25

1
Windward Overview 2
Windward Team 3
Investment Philosophy 5
Investment Process 6
Investment Process - Case Study (PX) 10
Investment Process - Case Study (CVS) 11
Risk Management 12
Risk Management - Case Study (C) 13
RAAM Investment Strategy & Performance 14
CapApp Investment Strategy & Performance 16
RAAM Strategy Snapshot 18
CapApp Strategy Snapshot 19
Why you should hire Windward 20
Explanation of Performance Results 21
Assets UnderManagement
Total AUM1: $259.2 millionEquities1: $225.0 million
Fixed Income2: $34.2 million
1 Equities contains allocation from balanced accounts and have been restatedas of Q4 2010 to include margin on relevant accounts
2 Includes cash & cash equivalents
Table of Contents

2
Windward OverviewWindward Capital Group Inc.
Located in Los Angeles, CAFounded in 1996Windward Capital Management Co. - Separately managed accounts for institutional & high-net worth
Over $259 million in client assets
Primary Focus on Large-Cap equitiesStrategies include both Core/Blend and Growth strategies
7 year - top quartile track record - Recently opened to institutional and consulting relationships
Experienced Team: Robert Nichols, Ph.D. and Donald Bessler, CPAExtensive Institutional Experience60 years Experience & $17 billion managed between the portfolio managers
Consistency, Continuity & ConvictionCharacteristics of Windward’s process and culture

3
Windward TeamRobert Nichols, Ph.D. - Chief Executive Officer - Portfolio Manager
Mr. Nichols is the founder of Windward Capital Management Co. For twenty-one years (1971 to 1992) prior to founding Windward, he was President of the Roley, Nichols Capital Group, Inc., in Los Angeles, California. While at the firm, he was President of RNC Capital Management managing more than $1.25 billion in portfolios of taxable, municipal, corporate and multi-employer retirement plans and foundation clients.
In addition to his corporate responsibilities, he was a senior member of the Investment Policy Committee and Research Committee. In 1990, he and his partners sold the firm to an Austrian bank.
His academic degrees include an MBA and a Ph.D. in Management from the Claremont Graduate School’s Drucker School of Business. Mr. Nichols’ past management responsibilities include managing accounts for the State of Washington, Catalina Island Conservancy, GTE Pension Fund, Rapid Transit District of Los Angeles, Territory of Guam airport authority, American Institute of Architects, Southwest Electrical Worker's Union, City of Warren Michigan, Little Rock Police and Fire (LOPFI), and People’s Bank & Trust.
He has served as a Trustee of the Marine Corps Command and Staff College Foundation, Public appointed member of the Los Angeles Unified School District Pension Fund, as well as a member of the Board of Counselors for the School of Fine Arts at the University of Southern California (USC).
Donald Bessler CPA - Chief Investment Officer - Portfolio ManagerMr. Bessler came to Windward Capital Management Co. from First American Capital Management where he was a Senior Portfolio Manager/Senior Vice President.
Prior to First American Capital Management, he was a Principal and the Director of Research at Roxbury Capital Management LLC, a $14 billion asset management firm in Los Angeles. As Director of Research and voting member of the Investment Committee, he supervised a team of six Equity Research Analysts in addition to personally managing more than $1 billion in client assets. He was also responsible for managing the Roxbury Special Situations Portfolio and the Special Situations Hedge Fund.
Mr. Bessler began his career as a Certified Public Accountant and attained the level of Audit Manager with the accounting firm Price Waterhouse. During the six years he worked in New York, he was responsible for the corporate audits of such firms as Chase Manhattan Bank, Eastman Kodak, and Oppenheimer & Co.
Mr. Bessler graduated summa cum laude from Lehigh University with a BS in Finance, a BS in Accounting, and a BA in Psychology. Mr. Bessler has managed accounts for Eli Lilly Co., Guidant Corp., Texas A&M, and the University of South Florida.

4
Windward Team cont.Stephan Pene - Managing Director, Chief Financial Officer/Chief Compliance Officer
Mr. Pene has worked as a financial officer in the investment advisory and brokerage field for more than twenty-five years. He is a member of the Board of Directorsand a Principal of both Windward Capital Management Co. and S.L. Reed & Company, subsidiaries of The Windward Capital Group Inc. Prior to joining TheWindward Capital Group Inc, he was Controller at Curian Capital, LLC, a subsidiary of Jackson National Life Insurance Company. Before his association with CurianCapital, Mr. Pene was Senior Vice President and Chief Accounting Officer at Wells Fargo Van Kasper, an investment banking, broker/dealer and fixed incomesecurities primary dealer. Earlier in his career he was, for seven years, the Chief Financial Officer of the securities division of Home Savings of America. Hisacademic degrees include a BS in Finance from California State University, Northridge and an MBA from Pepperdine University where he graduated magna cum laude.
Kenneth Kilpo - Managing Director, Advisory ServicesMr. Kilpo has over thirteen years of experience in the financial services industry consulting with high-net worth individuals and small to midsize corporations. He is amember of the Board of Directors and a Principal of both Windward Capital Management Co. and S.L. Reed & Company, subsidiaries of The Windward CapitalGroup, Inc. Prior to joining Windward Capital Group Inc., he was a Financial Consultant at Merrill Lynch. Mr. Kilpo has a Bachelor of Arts degree in Economicsfrom the University of California at San Diego.
Reed Nichols - Director, Advisory ServicesMr. Nichols came to S.L. Reed & Company after years of work within the banking community of Santa Barbara, California. He began his career as a Reconciliation Specialist with Santa Barbara Bank and Trust before moving to Community West Bank as an Account Specialist. Immediately prior to joining S.L. Reed & Company, he held the position of Senior Business Banker at J.P. Morgan Chase, working with high net worth individuals and small business owners.
Joseph Robillard - Director, Institutional SalesMr. Robillard brings to Windward extensive experience in finance, managing banking relationships of high-net worth individuals, as well as private and publiccorporations. Prior to joining Windward Capital Group Inc., he was a relationship manager at Wells Fargo’s Commercial Bank. Mr. Robillard has a Bachelor of Arts degree in Law & Society from the University of California at Santa Barbara.
Milkah LoScalzo - Vice President, Investment ResearchMs. LoScalzo has over sixteen years of experience in the financial services industry working with large institutional clients and high-net worth individuals and smallto midsize corporations. She is a Vice President reporting directly to Mr. Nichols and handles research trading and operational issues for Windward. Before joiningWindward, Ms. LoScalzo was the Executive Assistant to the Chairman of The Seidler Companies where she serviced institutional clients, such as the Roman CatholicArchdiocese of Los Angeles and Loyola Marymount University.Prior to that, Ms. LoScalzo worked for the Boston Group, L.P. handling all aspects of the broker-dealer/investment management firm. Ms. LoScalzo received her B.A.and LL.B from the University of the Philippines.
5
Investment Philosophy
We believe, and our record demonstrates, that superior active management adds value, and that a thematic investment approach combined with a disciplined, fundamental, bottom-up research process, generates superior risk-adjusted performance over time.
Furthermore, we believe that, at any one given time, there are multiple economic themes driving the market. We seek to own high-quality companies benefiting from more than one of these economic themes.

6
Investment ProcessRussell 1000
Thematic (Top-Down)
Cyclical/Secular themes determine economic sector beneficiaries
500Potentials
Quantitative screens (e.g., Return on Invested Capital, Free Cash Flow, Revenue/Earnings Growth, Valuation) are applied to companies within highlighted economic sectors
Quantitative (Bottom-Up)
250 Potentials
Fundamental (Bottom Up)
Fundamental financial analysis identifies investment opportunities
125 Potentials
Focus on Quality, Growth, and Value drives final investment decision (Risk Management and Multi-Thematic stocks are emphasized)
Portfolio Construction
40 – 45 Stocks
7
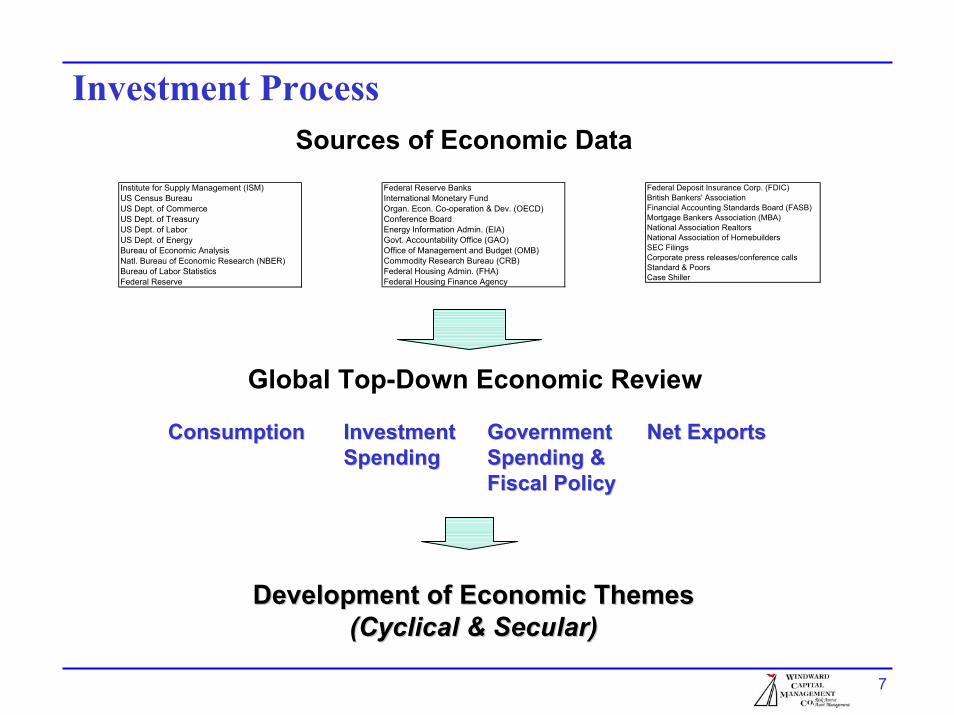
Investment ProcessSources of Economic Data
Institute for Supply Management (ISM)US Census BureauUS Dept. of CommerceUS Dept. of TreasuryUS Dept. of LaborUS Dept. of EnergyBureau of Economic AnalysisNatl. Bureau of Economic Research (NBER)Bureau of Labor StatisticsFederal Reserve
Federal Reserve BanksInternational Monetary FundOrgan. Econ. Co-operation & Dev. (OECD)Conference BoardEnergy Information Admin. (EIA)Govt. Accountability Office (GAO)Office of Management and Budget (OMB)Commodity Research Bureau (CRB)Federal Housing Admin. (FHA)Federal Housing Finance Agency
Federal Deposit Insurance Corp. (FDIC)British Bankers' AssociationFinancial Accounting Standards Board (FASB)Mortgage Bankers Association (MBA)National Association RealtorsNational Association of HomebuildersSEC FilingsCorporate press releases/conference callsStandard & PoorsCase Shiller
Global Top-Down Economic Review
ConsumptionConsumption Investment Investment Spending
Government Government Spending & Spending & Fiscal Policy Fiscal Policy
Net ExportsNet ExportsSpending
Development of Economic ThemesDevelopment of Economic Themes(Cyclical & Secular)(Cyclical & Secular)

8
Investment Process
Current Windward ThemesRise Of The RestTech HavenRegulation
Continued De-LeveragingCapacityThe Great Unwind
Continued De-leveragingConsumer de-leveraging and the shrinking ofbank balance sheets will be a multi-year processthat will restrain the U.S. economic recovery(and the earnings power of those sectorsaffected).
RegulationFinancial Services re-regulation, Healthcare reform,and Climate Change policy are all currentlyareas of government focus, and the economicsectors within these areas may, therefore,be subject to challenges or opportunities basedupon how successful the government is inimplementing its programs.
Rise of The RestGlobalization and the development of themiddle class in emerging markets is a long-termsecular trend.
The Great UnwindThe unwinding of current Fed policies has thepotential to, at the very least, weaken the U.S.dollar.
Tech HavenSelect Technology companies are well positionedto withstand the current recession dueto their strong balance sheets (high cash, lowdebt) and are uniquely poised to benefit from arebound in global consumer spending—especiallyin emerging economies where standardsof living are improving from subsistence levels.
CapacityThe specific industries that did not overexpandduring the boom (Materials, Energy, and Industrials)are better positioned than those that did(Real Estate, Financial Services, Homebuilding,Automobile Manufacturing, and Retailing) tobenefit from a global economic recovery—especiallyone that is led by emerging markets.

9
Investment Process
Fundamental Characteristics:
QualityDominant, financially strong, leading companies with best-in-class managements, high incremental returns on invested capital,and business models with sustainable competitive advantages
GrowthCompanies with predictable and sustainable above average growthin revenue, earnings, and free cash flow
ValueCompanies that are undervalued on either an absolute or relativebasis, based upon our projections of future cash flow and earnings
10
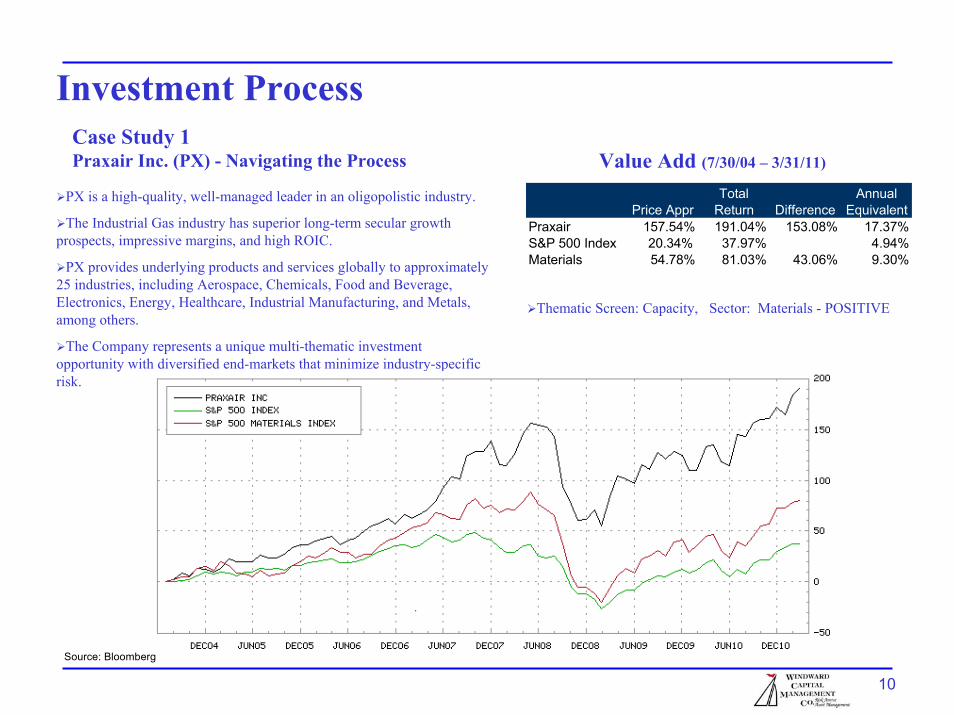
Investment ProcessCase Study 1Praxair Inc. (PX) - Navigating the Process
PX is a high-quality, well-managed leader in an oligopolistic industry.
The Industrial Gas industry has superior long-term secular growth prospects, impressive margins, and high ROIC.
PX provides underlying products and services globally to approximately 25 industries, including Aerospace, Chemicals, Food and Beverage, Electronics, Energy, Healthcare, Industrial Manufacturing, and Metals, among others.
The Company represents a unique multi-thematic investment opportunity with diversified end-markets that minimize industry-specific risk.
Source: Bloomberg
Value Add (7/30/04 – 3/31/11)
Thematic Screen: Capacity, Sector: Materials - POSITIVE
Price ApprTotal
Return DifferenceAnnual
EquivalentPraxair 157.54% 191.04% 153.08% 17.37%S&P 500 Index 20.34% 37.97% 4.94%Materials 54.78% 81.03% 43.06% 9.30%
11
Investment ProcessCase Study 2CVS Caremark Corp. (CVS) – Navigating the Process Value Add (5/31/04 – 03/31/11)
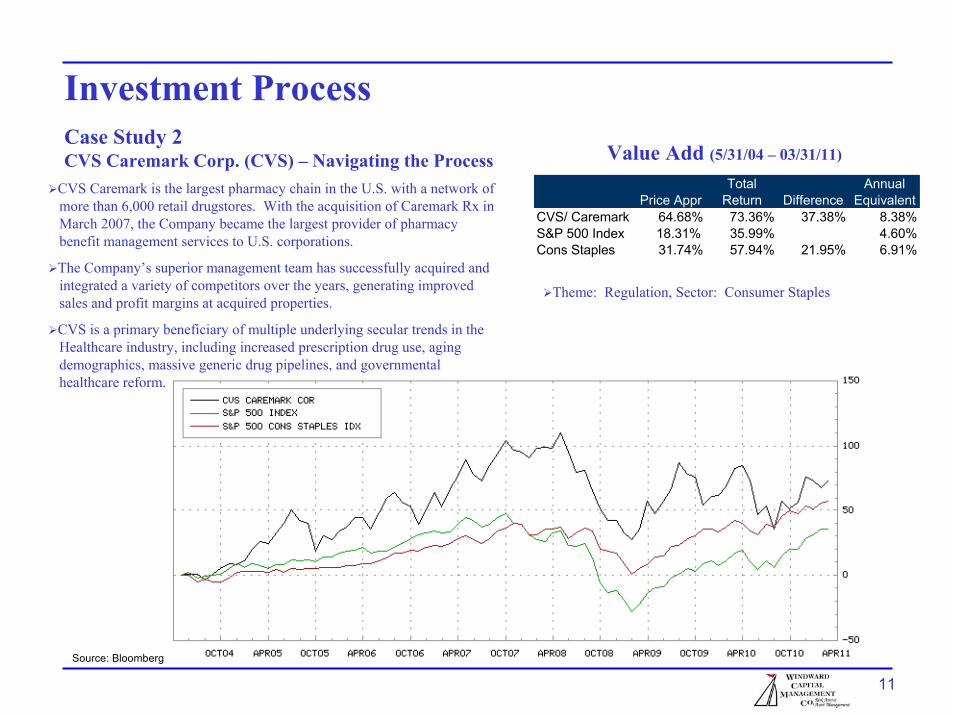
CVS Caremark is the largest pharmacy chain in the U.S. with a network ofmore than 6,000 retail drugstores. With the acquisition of Caremark Rx inMarch 2007, the Company became the largest provider of pharmacybenefit management services to U.S. corporations.
The Company’s superior management team has successfully acquired andintegrated a variety of competitors over the years, generating improvedsales and profit margins at acquired properties.
CVS is a primary beneficiary of multiple underlying secular trends in theHealthcare industry, including increased prescription drug use, agingdemographics, massive generic drug pipelines, and governmentalhealthcare reform.
Source: Bloomberg
Theme: Regulation, Sector: Consumer Staples
Price ApprTotal
Return DifferenceAnnual
EquivalentCVS/ Caremark 64.68% 73.36% 37.38% 8.38%S&P 500 Index 18.31% 35.99% 4.60%Cons Staples 31.74% 57.94% 21.95% 6.91%

12
Risk Management
Stock ConstraintsInitial position size limited to 2-4%
Sector ConstraintsUp to 1.5x the benchmark weight
Up to 15% of total portfolio value for economic sectors under 10% weighting in the benchmark
Sell DisciplineWe often take the “devil’s advocate” approach during the investment decision-making process when reviewing our portfolios.
Windward constantly monitors securities for:
1. Deteriorating Fundamentals2. Ethics Violations3. Declining Market Share4. Unfavorable Acquisition5. Loss of Key Management Personnel6. Price appreciation to a level that effectively discounts the company’s positive long-term fundamentals
There is no automatic “trip wire” for a sell order
Judgment and experience on the part of the portfolio managers needs to play a role in the sell decision.
Any one of these events can individually trigger a sale of a stock

13
Risk Management Case StudyCase Study - Citigroup (C) – Process in Action Value Add (9/12/07 – 03/31/11)
Additional Purchase
Initial Sale
Final Sale
Price ApprTotal
Return DifferenceAnnual
EquivalentCitigroup -87.44% -83.98% -161.53% -19.90%S&P 500 Index 50.69% 77.54% 7.20%Financials -25.66% -8.72% -86.26% -1.10%
Windward’s forecast for a deterioration in the housing and credit marketsled us to start underweighting the Financial Services industry (on a relativebasis) in clients’ portfolios during late-2005. Citigroup, a global financialleader, had inordinate exposure to these deteriorating trends due to its sizeand reach.
An impending re-valuation of Citigroup’s underlying assets could haverendered the Company’s shareholders’ equity worthless, in our opinion.
Windward therefore sold 50% of its C position in May 2007 at $55 per shareand the remaining 50% in September 2007 at $45 per share. C stocksubsequently fell to a low of $1 per share in March 2009.
Source: Bloomberg
Theme: Regulation, Sector: Financials - Negative
Initial Purchase

14
-5
0
5
10
15
20
25
3035
40
45
12/2010-3/2011 3/2010-3/2011 3/2009-3/2011 3/2008-3/2011 3/2006-3/2011 12/2002-3/2011HIGH (0.05) 9.01 22.14 37.59 6.52 6.76 11.40FIRST QUARTILE 7.02 17.31 32.47 4.17 4.15 9.04MEDIAN 6.30 15.57 30.44 3.17 3.25 8.07THIRD QUARTILE 5.40 13.66 28.57 2.13 2.63 7.45LOW (0.95) 3.36 9.24 23.90 0.50 1.17 5.99MEAN 6.17 15.49 30.51 3.17 3.46 8.25VALID COUNT 303 303 300 292 272 218
Windward Capital WCM RAAMStandard & Poor's 500
12/2010-3/2011 3/2010-3/2011 3/2009-3/2011 3/2008-3/2011 3/2006-3/2011 12/2002-3/2011VALUE RANK VALUE RANK VALUE RANK VALUE RANK VALUE RANK VALUE RANK
6.53 39 23.22 1 32.08 28 5.91 3 6.51 1 10.14 75.92 61 15.65 47 31.61 37 2.35 71 2.62 75 7.21 83
Investment Strategy & PerformanceThe RAAM portfolio is a Large Cap Blend strategy that has an emphasis on risk containment. The strategy focuses on a combination of growth equities, and less volatile relative growth equities in order to mitigate the overall portfolio volatility. While portfolio performance continues to be our primary goal, we seek to control inherent portfolio volatility by altering both the economic sector and individual equity position weightings throughout the stock market cycle. The resulting portfolios are likely to pay a higher level of dividend income than our pure growth portfolios.
Source: PSN (Plan Sponsor Network) Historical Data as of 3/31/11
Upon request, equitiesselected can reflect a social or
environmentally-sensitive investment strategy.
Risk Averse Asset Management (RAAM) – Large Cap Blend
Windward Focusand Value Add
15
Investment Strategy & Performance cont. Risk Averse Asset Management (RAAM Equity)
STATISTICS SUMMARY1
PERIOD ROR STDEV ALPHA BETA RSQRTRACK ERROR SHARPE INFO RATIO
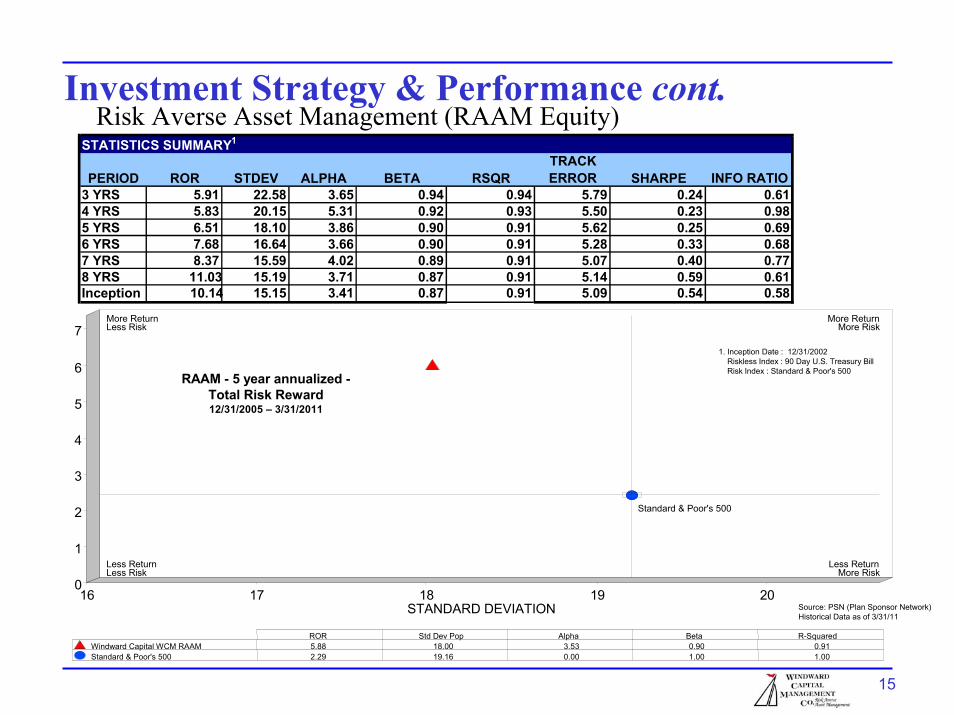
3 YRS 5.91 22.58 3.65 0.94 0.94 5.79 0.24 0.614 YRS 5.83 20.15 5.31 0.92 0.93 5.50 0.23 0.985 YRS 6.51 18.10 3.86 0.90 0.91 5.62 0.25 0.696 YRS 7.68 16.64 3.66 0.90 0.91 5.28 0.33 0.687 YRS 8.37 15.59 4.02 0.89 0.91 5.07 0.40 0.778 YRS 11.03 15.19 3.71 0.87 0.91 5.14 0.59 0.61Inception 10.14 15.15 3.41 0.87 0.91 5.09 0.54 0.58
Source: PSN (Plan Sponsor Network) Historical Data as of 3/31/11
STANDARD DEVIATION
RAAM - 5 year annualized -Total Risk Reward12/31/2005 – 3/31/2011
1. Inception Date : 12/31/2002Riskless Index : 90 Day U.S. Treasury BillRisk Index : Standard & Poor's 500
16 17 18 19 200
1
2
3
4
5
6
7
Standard & Poor's 500
More ReturnLess Risk
Less ReturnLess Risk
More ReturnMore Risk
Less ReturnMore Risk
RATE OF RETURN
Windward Capital WCM RAAMStandard & Poor's 500
ROR Std Dev Pop Alpha Beta R-Squared5.88 18.00 3.53 0.90 0.912.29 19.16 0.00 1.00 1.00

16
Investment Strategy & PerformanceCapital Appreciation (CapApp Equity) – Large Cap Growth
-10
-5
0
510
1520
25
30
35
40
45
12/2010-3/2011 3/2010-3/2011 3/2009-3/2011 3/2008-3/2011 3/2006-3/2011 12/2002-3/2011HIGH (0.05) 8.96 27.24 39.83 9.34 7.18 12.69FIRST QUARTILE 6.81 20.74 34.37 5.91 5.31 9.99MEDIAN 5.90 17.85 31.42 4.59 4.24 8.76THIRD QUARTILE 4.79 14.50 28.89 2.98 3.21 7.58LOW (0.95) 2.96 10.29 25.36 -0.18 0.55 6.07MEAN 5.82 17.93 31.64 4.48 4.18 8.84VALID COUNT 267 267 264 260 246 207
Windward Capital WCM CapAppRussell 1000 Growth
12/2010-3/2011 3/2010-3/2011 3/2009-3/2011 3/2008-3/2011 3/2006-3/2011 12/2002-3/2011VALUE RANK VALUE RANK VALUE RANK VALUE RANK VALUE RANK VALUE RANK
6.26 37 29.60 1 35.43 17 8.73 1 6.68 3 11.25 76.03 45 18.26 45 33.07 38 5.19 36 4.34 47 7.75 72
Our Capital Appreciation (CapApp) strategy is a Large Cap Growth strategy focusing primarily on the growth characteristics of the companies within our economic and sector themes. The portfolios nonetheless are constructed to mitigate risk and experience less volatility than a traditional Growth portfolio, while achieving superior results.
*Source: PSN (Plan Sponsor Network) Historical Data as of 3/31/11
Upon request, equitiesselected can reflect a social or
environmentally-sensitive investment strategy.
Windward Focusand Value Add

17
Investment Strategy & Performance cont.Capital Appreciation (CapApp Equity)
STATISTICS SUMMARY 1
PERIOD ROR STDEV ALPHA BETA RSQRTRACK ERROR SHARPE INFO RATIO
3 YRS 8.73 24.56 3.75 0.99 0.91 7.42 0.34 0.484 YRS 8.53 22.15 4.98 0.98 0.91 6.52 0.33 0.755 YRS 6.68 20.22 2.52 0.98 0.88 6.93 0.23 0.346 YRS 8.78 18.59 3.15 0.98 0.88 6.41 0.35 0.477 YRS 8.90 17.41 3.95 0.95 0.87 6.31 0.39 0.608 YRS 11.96 16.93 4.06 0.94 0.88 6.07 0.59 0.63Inception 11.25 16.79 3.74 0.94 0.88 6.02 0.55 0.58
CapApp - 5 year annualized -Total Risk Reward12/31/2005 – 3/31/2011
1. Inception Date : 12/31/2002Riskless Index : 90 Day U.S. Treasury BillRisk Index : Russell 1000 Growth
Source: PSN (Plan Sponsor Network) Historical Data as of 3/31/11
18 19 20 21STANDARD DEVIATION
2
3
4
5
6
7
Russell 1000 Growth
More ReturnLess Risk
Less ReturnLess Risk
More ReturnMore Risk
Less ReturnMore Risk
Windward Capital WCM CapAppRussell 1000 Growth
ROR Std Dev Pop Alpha Beta R-Squared6.34 20.17 2.75 0.98 0.883.75 19.44 0.00 1.00 1.00
18
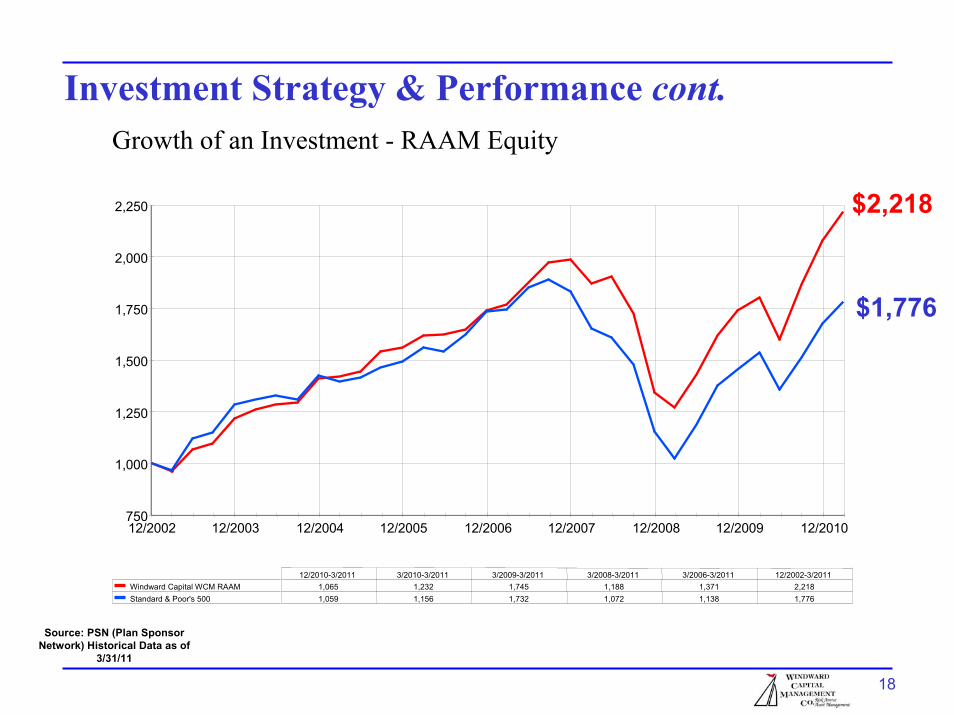
Investment Strategy & Performance cont. Growth of an Investment - RAAM Equity
$2,218
DOLLARS ($)
12/2002 12/2003 12/2004 12/2005 12/2006 12/2007 12/2008 12/2009 12/2010750
1,000
1,250
1,500
1,750
2,000
2,250
$1,776
Windward Capital WCM RAAMStandard & Poor's 500
12/2010-3/2011 3/2010-3/2011 3/2009-3/2011 3/2008-3/2011 3/2006-3/2011 12/2002-3/20111,065 1,232 1,745 1,188 1,371 2,2181,059 1,156 1,732 1,072 1,138 1,776
Source: PSN (Plan Sponsor Network) Historical Data as of
3/31/11

19
Investment Strategy & Performance cont. Growth of an Investment - CapApp Equity
$2,409
$1,851
12/2002 12/2003 12/2004 12/2005 12/2006 12/2007 12/2008 12/2009 12/2010750
1,000
1,250
1,500
1,750
2,000
2,250
2,500
DOLLARS ($)
Windward Capital WCM CapAppRussell 1000 Growth
12/2010-3/2011 3/2010-3/2011 3/2009-3/2011 3/2008-3/2011 3/2006-3/2011 12/2002-3/20111,063 1,296 1,834 1,285 1,382 2,4091,060 1,183 1,771 1,164 1,237 1,851
Source: PSN (Plan Sponsor Network) Historical Data as of
3/31/11

20
Portfolio Snapshot - RAAM - Large Cap BlendCharacteristics Ten Largest Holdings2
AppleStrategy AUM 1 $207.1MMAmazonAvg. # Holdings 2 40-45
P/E (1 yr forward) 2 Peabody Energy18.4(as of 3/31/2011) IBMP/E (trailing 12 month) 2 34.9x
PraxairAvg. Mkt Cap $87.6 BNetflixMed. Mkt Cap $49.6 BOracle1.20%Yield
Position WeightTurnover 2
Salesforce 1-5%CVS/Caremark34%
1 Contains equity allocation from balanced accounts2 Representative Separately Managed Account
Vmware
Attribution Analysis (YTD as of 3/31/11)
GICS Sectors % Port CTR(P) % Bench CTR(B) % Active Total Allocation Selection Interaction Ret(P) Ret(B) Rel Rtn100.00% 6.70% 100.00% 5.93% 0.00% 0.77 -0.34 0.42 0.69 6.70% 5.93% 0.77%
Consumer Disc 16.17% 2.00% 10.51% 0.49% 5.66% 1.23 -0.06 0.88 0.42 12.93% 4.72% 8.21%Consumer Staples 14.06% 0.05% 10.25% 0.26% 3.80% -0.45 -0.14 -0.22 -0.08 0.45% 2.52% -2.07%Energy 7.54% 0.93% 12.67% 2.03% -5.13% -0.84 -0.53 -0.48 0.17 12.30% 16.80% -4.50%Financials 0.00% 0.00% 16.09% 0.51% -16.09% 0.46 0.46 0.00 0.00 0.00% 3.05% -3.05%Health Care 5.37% 0.25% 10.85% 0.61% -5.48% 0.05 0.01 -0.11 0.05 4.47% 5.63% -1.16%Industrials 11.81% 1.16% 11.10% 0.96% 0.71% 0.15 0.02 0.13 0.00 9.86% 8.75% 1.10%Info Tech 26.75% 1.33% 18.68% 0.67% 8.07% 0.20 -0.19 0.28 0.11 5.02% 3.52% 1.50%Materials 14.21% 0.65% 3.64% 0.17% 10.57% 0.17 -0.15 0.00 -0.01 4.41% 4.54% -0.13%Not Classified 3.36% 0.32% 0.06% 0.00% 3.30% 0.14 0.14 0.00 0.00 9.66% 3.35% 6.30%Telecomm Services 0.00% 0.00% 2.94% 0.15% -2.94% 0.03 0.03 0.00 0.00 0.00% 4.87% -4.87%Utilities 0.72% 0.01% 3.20% 0.09% -2.47% 0.07 0.08 -0.05 0.04 1.10% 2.74% -1.64%
Portfolio Benchmark S&P 500 Attribution Effects Stock Level Returns
Source: Bloomberg Analytics

21
Portfolio Snapshot - CapApp - Large Cap GrowthCharacteristics Ten Largest Holdings2
Strategy AUM 1
Attribution Analysis (YTD as of 3/31/11)
Source: Bloomberg Analytics
GICS Sectors % Port CTR(P) % Bench CTR(B) % Active Total Allocation Selection Interaction Ret(P) Ret(B) Rel Rtn100.00% 6.29% 100.00% 6.05% 0.00% 0.24 -0.98 1.12 0.09 6.29% 6.05% 0.24%
Consumer Disc 19.45% 2.45% 14.37% 0.38% 5.08% 1.83 -0.17 1.53 0.47 13.11% 2.65% 10.45%Consumer Staples 7.04% 0.22% 9.22% 0.41% -2.18% -0.06 0.04 -0.12 0.02 3.24% 4.48% -1.25%Energy 6.10% 0.87% 11.45% 1.80% -5.34% -0.64 -0.54 -0.15 0.04 14.46% 16.60% -2.15%Financials 0.00% 0.00% 4.76% 0.29% -4.76% -0.01 -0.01 0.00 0.00 0.00% 6.15% -6.15%Health Care 12.22% 0.52% 9.61% 0.66% 2.61% -0.31 0.01 -0.25 -0.08 4.23% 6.95% -2.72%Industrials 10.67% 0.99% 13.37% 1.11% -2.70% 0.05 -0.06 0.14 -0.03 9.36% 8.36% 1.00%Info Tech 30.38% 1.59% 31.01% 1.25% -0.64% 0.39 0.02 0.41 -0.03 5.24% 3.95% 1.29%Materials 10.94% -0.66% 5.04% 0.14% 5.90% -1.20 -0.24 -0.45 -0.52 -5.83% 2.60% -8.43%Not Classified 3.19% 0.30% 0.28% 0.01% 2.92% 0.13 -0.10 0.01 0.21 9.43% 2.57% 6.86%Telecomm Services 0.00% 0.00% 0.81% -0.01% -0.81% 0.06 0.06 0.00 0.00 0.00% -0.65% 0.65%Utilities 0.00% 0.00% 0.08% 0.01% -0.08% -0.01 -0.01 0.00 0.00 0.00% 13.89% -13.89%
Portfolio Benchmark Russell 1000 Growth Attribution Effects Stock Level Returns
(as of 3/31/2011)
1 Contains equity allocation from balanced accounts2 Representative Separately Managed Account
Stericycle
AmazonNetflixApple$10.3MM
Avg. # Holdings 2 40-45P/E (1 yr forward) 2 22.9x
Peabody EnergyP/E (trailing 12 month) 2 44.1xSalesforceAvg. Mkt Cap $60.3 BBaiduMed. Mkt Cap $24.9 BChipotle0.58%Yield
Position WeightTurnover 2
Vmware1-5%Agilent34%

22
Windward Capital Management Co.
Thematic Process adds risk adjusted alpha over time
Primary Focus on Large-Cap equitiesStrategies include both Core/Blend and Growth strategies
Experienced Team with the Agility of an Emerging ManagerRobert Nichols, Ph.D. and Donald Bessler, CPAExtensive Institutional Experience60 years Experience & $17 billion managed between the portfolio managers
7 year top-quartile track record - Recently opened to select consulting and platform relationships
Consistency, Continuity & Conviction –Throughout process and cultureTop Quartile Information Ratio, First Quadrant risk/reward, and other top statistical measurements

23
Explanation of Performance ResultsPerformance of each account within the composites are time weighted, and are calculated on both a gross and net basis. The net basis is calculated net of management fees, net of brokerage fees and net of custodial fees, if any. Accounts are maintainedon an accrual basis and dividends and interest may or may not have been reinvested. The composites are asset weighted. Accounts are added at the end of the month in which they become fully invested, and removed at the month end prior to the actual termination date. Effective July 2006, only portfolios with minimum initial assets of $200,000 are included in a composite. Any portfolio that falls 20% or more below the minimum initial asset level, or any portfolio that has been determined to have investment restrictions outside Windward guidelines, will be removed from the composite. Any cash flows in/out of a portfolio greater than 30% of the asset value will result in the removal of a portfolio from the composite for a full calendar month. The Standard & Poor’s 500 stock index (S&P), Russell 1000 Growth Index, Dow Jones Industrial Average (DJIAwINC), National Association of Securities Dealers Automated Quotes (NASDAQ), and the Treasury Bill Index (T-Bill) are unmanaged capitalization-weighted indices of securities. The indices assume reinvestment of dividends where applicable, but do not include the effect of management and transaction fees. If included, management and transactions fees would lower the returns of these indices. Due to the significant changes in the Portfolio Management Team at Windward, performance data for periods prior to 2003 were not included. Performance data prior to 2003 is available upon request. The performance data for the years 2000-2002 would have a negative impact on the annualized returns for each composite. Actual results of an individual account may be different from the performance of the composites because of differences in inception dates, transaction and related costs, fees, cash withdrawals and other factors. Performance data quoted represents past performance and is no guarantee of future results.

Contact Info.Robert Nichols – Chief Executive Officer
11111 Santa Monica Blvd. Suite 1200Los Angeles, CA 90025
t: 310-893-3000 f: [email protected]
www.windwardcapital.com


