1 Wine quality and prices: experts vs market Luca Cacchiarelli 1 , Anna Carbone 2 , Marco Esti 3 , Tiziana Laureti 4 , Alessandro Sorrentino 4 1 Dipartimento di Scienza della Natura e del Territorio, Universita’ di Sassari, Sassari , Italy 2 Dipartimento di Scienze e Tecnologie per l’Agricoltura, le Foreste, la Natura e l’Energia, Universita’ della Tuscia, Viterbo, Italy 3 Dipartimento per l’Innovazione nei Sistemi Biologici, Agroalimentari e Forestali, Universita’ della Tuscia, Viterbo, Italy 4 Dipartimento di Economia e Impresa, Universita’ della Tuscia, Viterbo, Italy Paper prepared for presentation at the EAAE-AAEA Joint Seminar ‘Consumer Behavior in a Changing World: Food, Culture, Society” March 25 to 27, 2015 Naples, Italy Do Not Cite. This piece is an early DRAFT of a paper to be published in 2016 by the British Food Journal.
Transcript
1
Wine quality and prices: experts vs market
Luca Cacchiarelli1, Anna Carbone
2, Marco Esti
3, Tiziana Laureti
4, Alessandro Sorrentino
4
1 Dipartimento di Scienza della Natura e del Territorio, Universita’ di Sassari, Sassari, Italy
2 Dipartimento di Scienze e Tecnologie per l’Agricoltura, le Foreste, la Natura e l’Energia, Universita’ della Tuscia,
Viterbo, Italy 3 Dipartimento per l’Innovazione nei Sistemi Biologici, Agroalimentari e Forestali, Universita’ della Tuscia, Viterbo,
Italy 4 Dipartimento di Economia e Impresa, Universita’ della Tuscia, Viterbo, Italy
Paper prepared for presentation at the EAAE-AAEA Joint Seminar
‘Consumer Behavior in a Changing World: Food, Culture, Society”
March 25 to 27, 2015
Naples, Italy
Do Not Cite. This piece is an early DRAFT of a paper to be published in 2016 by the British Food Journal.
2
Wine quality and prices: experts vs market
Abstract
The paper aims at: i) understanding to what extent wine experts’ evaluations are influenced by different
quality clues ii) assessing the role and effectiveness of different quality clues in the creation of price. To
meet these goals we set two independent equations. The first -estimated via an ordered logit- explaining the
score obtained by each wine with a bunch of attributes of the wine and of its production process. The second
equation is a hedonic price model –estimated via an interval regression- where price is a function of a large
number quality clues. The analysis covers 2,523 wines from three Italian Regions as reviewed by Veronelli
guide. Results indicates that: i) few attributes seems to systematically impact experts’ judgments; ii) many
quality clues are associated with significant price premiums; iii) in some cases consumers give value to
quality clues along with experts while in other cases there is no alignment.
Wine is a complex and highly differentiated product where quality plays an important role in
determining demand. Many relevant quality aspects are experience or credence attributes. Thus,
asymmetric information is pervasive in this market and consumers’ choice is widely based on a
number of quality clues. Many authors have focused on the perceived value of reputation linked to
the region and the country of origin and on the role played by wine producer in the process of
building the overall value (Panzone & Simoes, 2009; Schamel, 2006; Schamel & Anderson, 2003).
Furthermore, grape variety and ageing are taken into account in implicit price estimates given the
hypothesis that consumers evaluate these factors when deciding on a purchase (Steiner 2004,
Schamel & Anderson 2003).
Also important are experts’ evaluations released in wine guides, journals, blogs and web sites, or
even more informal and varied clues like suggestions from vendors, sommeliers and friends.
Besides, wine events such as fairs, exhibitions, trials, wine tours etc. seek at providing occasions for
experiencing the product. Wine guides traditionally play a major role; for this reason many authors
have estimated how expert ratings affect the price of wine (Costanigro et al., 2007; Schamel &
Anderson, 2003; Oczkowski 2001).
The expert’s judges represent an important factor that affects the market price mechanism. Some
authors have provided evidence on wine experts’ behaviour when forming quality ratings (AAWE,
2012; Galizzi 2013; Caggiano et al., 2012). For instance, wine characteristics such as red and sweet
wine and the ageing have a positive impact on quality rating while factors linked to firm
characteristics and grape variety seem to have insignificant effect on the score received in wine
guides. Moreover, experts can have preferences towards wine characteristics which can contribute
to produce systematically better judgements for some types of wine.
Overall, diverse quality clues are usually combined together as none of them is sufficient per se and
none can cover the entire bunch of attributes relevant to the consumers in the different market
segments. The pattern of the relationships between different quality attributes and their clues may
vary with the kind of the attribute and with the features of each specific market. Synergies and/or
trade-offs may arise, significantly affecting the meaning and the impact of a certain quality to the
consumer (Benfratello et al., 2009; Delmas and Lessem, 2012; Costanigro et al., 2007).
This study focuses on the presence of factors that may systematically affect experts’ evaluations
whose judgments may deeply influence market tendencies. First, via an ordered logit model, we
estimate an equation that seeks at highlighting such effects; afterwards, we present a hedonic price
model where the price of the wine is regressed against different quality clues including experts’
4
evaluations. These clues are figured out as pertaining to three levels: attributes of the wine itself;
attributes of the producer; characteristics related to the place of origin and to its certifications.
Although the hedonic price model has received some criticism, particularly in the context of wine
(Unwin, 2001), it is commonly used as a way to assess the value of product attributes and it has
been affirmed that it represents a valid empirical methodology when the necessary precautions are
taken (Thrane, 2004).
Our data comes from one of the major Italian wine guides: Veronelli (2010 edition) that has a well
established reputation and provides a number of information that allows for an insightful analysis.
The guide does not release precise values of prices but gives interval values so that an interval
regression was used, where coefficients are interpreted in the usual way: as partial elasticities of
price on each variable, or, put it in other words, as the percentage impact of each variable on price.
Our dataset covers 2,523 wines from three much varied Italian wine Regions: Veneto, Lazio and
Sicily. These have been selected in order to represent three very different situations: Veneto is a
northern region with a large wine industry and occupies the first place as a national wine producer
with a very well established reputation, both on domestic and foreign markets, with relatively large
firms, certifications of origin established since a long time. Lazio is in Central Italy, it has some
quite famous and old wines but its wine industry is actually in decline as it is witnessed by the
reduction of vineyards, the sharp decrease in exports and the low rate of use of its certifications of
origin. Sicily has been for many decades known worldwide as a producer of bulk wines, mostly
used for their high alcohol content. This kind of specialization and the related reputation negatively
affected Sicilian producers when changes in market intervention by the European Community
within the Common Agricultural Policy (CAP) and demand trends took places. As a reaction to the
changing context, along the nineties, Sicilian producers and the Regional authorities started to put in
place a recovery strategy. This was based on the improvement of the quality and on new and more
effective communication and promotion activities. As a consequence, the reputation of Sicilian
wines – and that of the region as an area of wine production- progressively changed and the market
segments that these wines nowadays occupy are much more rewording compared to the past and
also in comparison to those of many other Italian Regions. All in all, our expectations are to find a
hierarchy with Veneto leading the group and Lazio closing the line.
The paper is organized as follows: Section 2 is devoted to discussing the overall logical framework
of the models and presents the variables used; Section 3 presents the details of the estimation
methods. Results are discussed in Section 4, while Section 5 concludes.
5
2. The logic of the model and the role of the different quality clues
Wine quality is multifaceted and mixes up many search, experience, as well as, credence
attributes. Motivations for buying and drinking wine are also complex and varied, thus, product
differentiation is key in defining the drivers for competitiveness. Both horizontal and vertical
differentiations apply and are relevant in wine markets. Some quality attributes may act differently
with respect to different markets segment, creating vertical hierarchies that hold in some segments
but not in others. For example, color, vine variety and wine blends are attributes that clearly create
horizontal differentiation. Differently, the place of origin may act as a feature of horizontal
segmentation, increasing product types and thus corresponding to consumers’ appreciation for
variety; besides, in cases of a generalized consensus on the superior reputation of a certain
production area, place of origin may create vertical differentiation.
The score obtained in wine testing is a clear example of vertical differentiation, with wines scored
higher that are of “better taste/quality” than wines that obtain lower scores. However things are
more complex, as we all know: de gustibus non disputandum est and this is why different tasters
provide different judgments, and only rarely these are well aligned (Galizzi, 2013; Caggiano et al.,
2012). While in the literature these differences, are usually regarded as reducing the reliability and,
hence, the usefulness of experts’ evaluation, here we argue that to the extent to which experts’ taste
reflect consumers’ taste in specific market segments, differences in their judgments shall be
regarded as a way to better suit specific group of consumers. This interpretation of the role of
experts’ guides is well coherent with the presence in the market, and the great popularity, of many
diverse guides together with other means of disseminating wine evaluations.
From the above considerations we derive the relevance of empirical assessments of attributes that
encounter experts’ taste and thus that may influence, in one way or another, their evaluations. The
first equation that we estimate is an attempt to model these influences; Figure 1 summarizes the
overall framework.
Figure 1. Variables used in evaluation model
dependent variable consumers' price
kind of wine
origin of the vine
diffusion of the vine
ageing
organic production process
professionals involved in the production
process
regressors
6
Where the variables are specified as described below:
1) The dependent variable, Score, is the experts’ evaluation, here expressed in a three point scale: 1
(good wine), 2 (very good wine), 3 (excellent wine). Evaluations released by experts are regarded as
a proxy of sensory quality as it is, directly and indirectly, perceived by stakeholders along the
chains, including final consumers.. Veronelli Guide organizes blind trials operated, if not as fully
controlled experiments, in a systematic and ordered way. Though criticized under different respects
(Ashton, 2011; Schiefer and Fischer, 2008), these evaluations are widely used in the literature and
usually assumed to be independent with respect to other quality clues1. Wine experts tend also to be
expert in communication and to act as promoters. They are, not only perceived as reliable judges of
sensory quality, but are also increasingly regarded as able to promote tendencies and fashions, as
effectively witnessed by the expression wine gurus (Ali et al., 2008; Hay 2010).
2) A first group of variables, W, used to explain the evaluation refers to the kind of wine: red, white,
sparkling (includes prosecco and spumante) and a fourth kind referred to as sweet wines, that
actually besides the sweet ones, includes dessert and liqueur wines (hereafter referred to as sweet
or as Sdl).
3) A second group of variables, Ag, indicates the extent of ageing (i.e. the length of the maturing
process). As the dataset includes only few wine aged more than 5 years, all wines from grapes
before 2004 are grouped together.
4) In order to include in the model information on the kind of grape, two variables, Gr, are considered:
The origin of the vine (i.e. grape variety); where Italian and international varieties are distinguished.
It is largely acknowledged that international varieties are greatly appreciated, both in domestic and
world markets, and are often referred to as an evidence of the globalization of wine market and,
particularly of consumers’ taste.
The diffusion of the vine. A different and, somehow, parallel tendency with regard to vines, is the
appreciation of traditional, local grapes that, on the one side, assures a strong relation with the
territory and, on the other side, increase diversity of wines, enlarging the assortment. These
considerations lead us to build a variable that takes into account three levels of diffusion of the
varieties: local (regional or sub-regional diffusion), wide (the variety is present in more than one
region but not throughout the Country), national (nationwide diffusion) 2
.
1
Main critics focus on the following: blindness of trials; constraints in the selection process; difficulties in changing judgment over time (need for
time consistency); need for diversifying from other guides; need for including fashion wines; need to sell the guide and/or to cover production cost. 2
Actually, Veronelli specifies the name of the grapes present in each wine and order them according to their role in the blending from those
present in higher proportion to those used in smaller shares. As it was not possible to run the model with the name of the grapes used First because the number of dummies was to large with respect to the number of total observations and, second, the number of wines for each grape was not sufficient
to get significant results.
7
5) Ex indicates the use of technicians’ expertise in the production process. In particular, available
information is on whether an agronomist follows the vineyard and whether more (than one)
oenologist are involved in the wine making process. The assumption here is that these professionals
benefit the quality of the wine. It is worth noticing that when more oenologist are present, the
winery benefit of a larger extent of specialization in their expertise with a sort of separation of
competencies among the oenologist.
6) Lastly, one more attribute included in the model, Or, state whether the wine is organic. While for a
number of years organic wines suffered from a negative reputation as their sensory quality was
acknowledged not to be satisfactory, things seems to be changing in recent times and it seems, thus,
interesting to explore recent acknowledgments by experts on this point.
All in all, the idea is that estimating such an equation would bring insights on some features that we
argue may affect significantly the appreciation of the wines among experts, influencing, in turn,
consumers and demand trends.
The second objective of the paper – i.e. evaluating the role of different quality clues in final
consumers’ price of the wine- is addressed by a second equation. Although some variables included
in the previous equation will be also used in the model, it is important to note that the two equations
do not form anyhow a single model comprising two steps. The two equations that we pose are
conceived as independent one from the other and, as such, are estimated separately. The variables
that populate the second equation are discussed here below:
1) The dependent variable is the consumers’ price of the wine.
The variables used in order to represent the quality features explaining prices may be divided in
three groups: i) attributes of the wine itself (A); ii) attributes of the producer (F); iii) attributes of the
area where the wine comes from (Ce) (Fig. 2). However, it is important to pinpoint that the
distinction suggested is not to be thought as a rigid one; in fact, there are significant overlaps among
the three groups of variables. For example, grape variety is, obviously, an intrinsic attribute of the
wine but, to some extent it is also related with the place of origin as many varieties are ubiquitous
while others are rooted to specific places and, thus, contribute to define the peculiar character of the
place.
8
Figure 2. Variables used in the Hedonic price model
The first group of variables, those directly pertaining to the wine, includes:
2) The Guides evaluation: In addition to the three scoring levels we included the New Entry (NE)
statement that is conferred to wines included in the guide for the first time. This variable is
considered in our model as we believe it may bring further insights on the mechanisms of price
formation. Differently from other wines in the guide, new entries are wines that were not included
in the past editions of the guide. We argue that NEs are either new products of fine quality or
already existing wines that increased their quality above the minimum threshold to be admitted in
the guide. However, New Entries are only signaled as such and are not evaluated in the usual
scoring system. It seems reasonable to assume that they distribute along the three-points scoring of
the guide just as the other wines. Hence, other things being equal, a lower price for these wines (i.e.
a negative price premium with respect to wines that have been present in past editions) may reflect
a negative bias towards wines for which information from the guide is lacking so far. In other
words, the variable helps assessing the value of the accumulation of information over time. Besides,
an opposite effect may arise in the case of new products due to curiosity and appreciation with
which the market welcomes novelties and due to an additional positive effect of promotional
activities that accompany the launch of the product. If this is the case and if this effect is stronger
than the previous one, a positive price premium should be detected.
3) The age of the wine enters exactly in the same fashion as before. This is considered to be a relevant
quality clue in the wine market for many reasons. First, climate conditions vary greatly over time
deeply influencing quality and prices. Second, wine ageing adds character to some wines and
increases its quality. Third, ageing is a selective process as not all wines are inclined to ageing and
not always ageing is a successful process.
dependent variable consumers' price
experts' evaluation
organic production process
production volumes
ageing
origin of the vine
diffusion of the vine
kind of wine
kind of wine name
kind of ownership
size of the vineyard
kind of the name of the producer
Region where the wine comes from
certification of origin
variables related to
the production area
variables related to
the producer
variables related to
the wine
9
4) Following the hypothesis that consumers may attach different values to different kind of vines, the
typology of grape variety is here specified just as previously described.
5) The number of bottles produced for each wine. Here we pose that quantity produced may influence
price in different ways. On one side, reputation to be established requires a critical mass of product.
On the other side, larger quantities may be interpreted as a sign of low quality due to: i) the
frequently assumed quality-quantity trade-off; ii) low quantity produced may confer to the wine a
connotation of exclusivity that act as a signal of high status (Gierl and Huettl, 2010).
6) A variable expressing whether the wine is organic is introduced. While for a number for years
organic wines suffered from a negative reputation as sensory quality was acknowledged no to be
satisfactory, at least from more demanding consumers in the wine market, more recently, literature
acknowledges that consumers’ attitude towards sensory quality of organic wines is complex and
may lead to different behaviors (Corsi and Strøm, 2013). First, evidences seem to show that organic
wines are associated with a positive price premium in high market segments considering that an
organic wine which is also a quality product is more difficult to be found; diversely, negative price
premiums may be associated to organic wines in lower market segments (Delmas and Lessem,
2011). Besides, consumers’ interested in production processes with low environmental impact may
attach value to this clue with consideration different from sensory quality.
7) As an element of originality with respect to the hedonic price literature on the value of wine
attributes, among the regressors we considered different typologies of wine names such as:
names referring to the grape variety;
names including Latin-Greek sounds that evokes the idea of a product roots in the past;
dialectal terms that are meant to enhance roots in the place of origin;
adjectives magnifying quality meant to suggest an idea of superior quality;
terms in foreign languages (mainly English), meant to easily communicate to an international
target consumer;
or even just generic names (of an animal, an object, a person) as opposed to wine that are
marketed without a name.
Naming is a well-known area of marketing and in industrial sectors it is extensively used in
coordination with promotional activities. However in the primary sector this area of strategic
communication is far less developed and there are fewer studies providing insights on its value.
Here we try to get some very simple and preliminary evidences of the value of different naming
strategies in the wine sector.
8) Lastly, the model acknowledges the presence of additional, specific quality attributes such as being
red, white, sparkling, or Sdl.
10
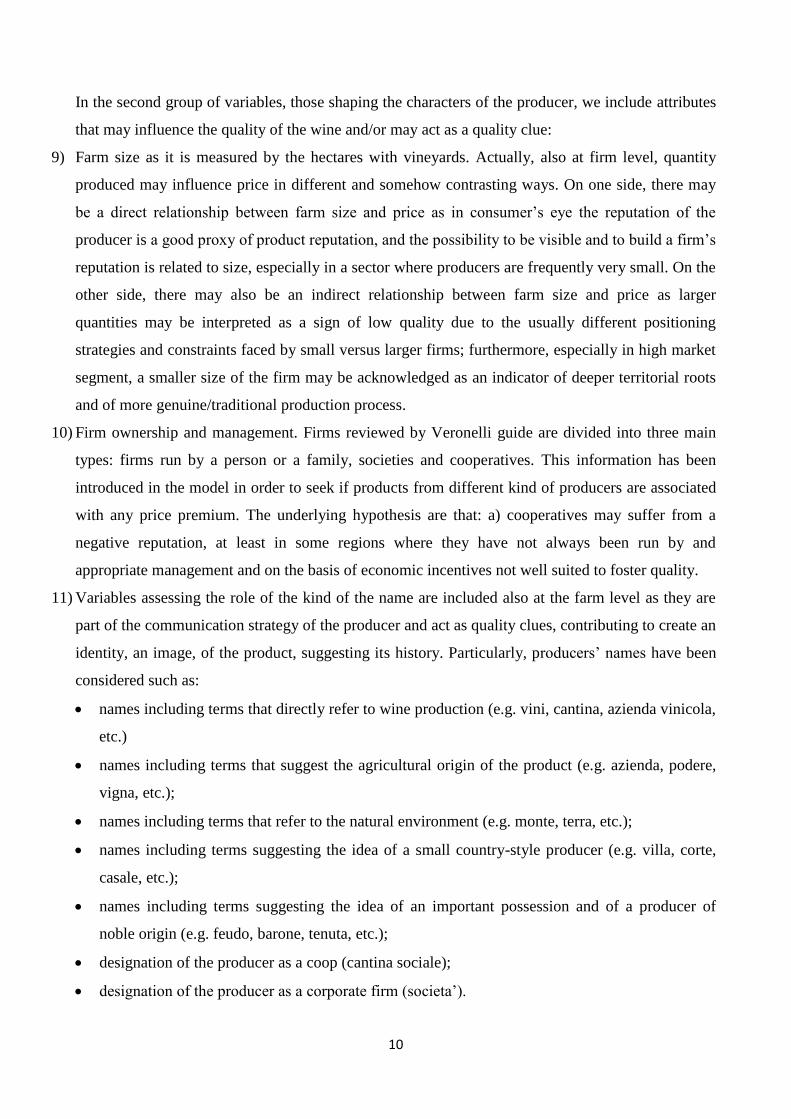
In the second group of variables, those shaping the characters of the producer, we include attributes
that may influence the quality of the wine and/or may act as a quality clue:
9) Farm size as it is measured by the hectares with vineyards. Actually, also at firm level, quantity
produced may influence price in different and somehow contrasting ways. On one side, there may
be a direct relationship between farm size and price as in consumer’s eye the reputation of the
producer is a good proxy of product reputation, and the possibility to be visible and to build a firm’s
reputation is related to size, especially in a sector where producers are frequently very small. On the
other side, there may also be an indirect relationship between farm size and price as larger
quantities may be interpreted as a sign of low quality due to the usually different positioning
strategies and constraints faced by small versus larger firms; furthermore, especially in high market
segment, a smaller size of the firm may be acknowledged as an indicator of deeper territorial roots
and of more genuine/traditional production process.
10) Firm ownership and management. Firms reviewed by Veronelli guide are divided into three main
types: firms run by a person or a family, societies and cooperatives. This information has been
introduced in the model in order to seek if products from different kind of producers are associated
with any price premium. The underlying hypothesis are that: a) cooperatives may suffer from a
negative reputation, at least in some regions where they have not always been run by and
appropriate management and on the basis of economic incentives not well suited to foster quality.
11) Variables assessing the role of the kind of the name are included also at the farm level as they are
part of the communication strategy of the producer and act as quality clues, contributing to create an
identity, an image, of the product, suggesting its history. Particularly, producers’ names have been
considered such as:
names including terms that directly refer to wine production (e.g. vini, cantina, azienda vinicola,
etc.)
names including terms that suggest the agricultural origin of the product (e.g. azienda, podere,
vigna, etc.);
names including terms that refer to the natural environment (e.g. monte, terra, etc.);
names including terms suggesting the idea of a small country-style producer (e.g. villa, corte,
casale, etc.);
names including terms suggesting the idea of an important possession and of a producer of
noble origin (e.g. feudo, barone, tenuta, etc.);
designation of the producer as a coop (cantina sociale);
designation of the producer as a corporate firm (societa’).
11
It is worthwhile noticing that this is, again, an element of orginality within the literature on hedonic
price models, where, to our knowledge, the impact of the producer’s name as a quality clue have
never been modeled.
The third group of variables, Ce -those shaping the characters of the production area, a major factor
influencing quality and commonly acknowledged as a relevant quality clue- includes:
12) The region where production took place. As already discussed, regional reputation plays a key role
as a quality clue as the place -or to better say: the terroir- where a wine comes from has a deep
influence in wine quality and, over time, has become one major quality clue, especially important in
Countries, like Italy, that are traditionally involved in the wine industry, both as producer and as
consumer. Needless to recall that in wine shops wines are exposed by Region and, similarly, in
wine guides wines are reviewed by Regions.
13) The type of Certification of Origin was included in the model as it acts as a twofold quality clue: a)
as already said, the place of origin is associated with quality due to climate, soil, local grape
varieties, traditional techniques for producing grape and/or wine, and so forth; b) Certification of
Origin is associated with the so called Quality Pyramid and, hence, set an explicit vertical
differentiation (Chiodo, 2008). At the bottom of the Pyramid there are Table wines (VdTs), for
which it is not possible to indicate vintage and varieties blended. Typical Geographical Indications
(IGT) occupy the following layer of the pyramid and are characterized by looser roots to the place
of origin and by relatively more freedom in production rules and in blending wine varieties
(including international varieties), compared to the wines at the top of the classification. Raising
one more step of the pyramid there are DOCs (Controlled Denominations of Origin) that require a
stricter definition of the production area and more stringent production rules and blending. Finally,
on the top of the Italian quality classification, there are DOCGs (Designation of Origin Controlled
and Guaranteed). This type of certification -strictly monitored by the national controlling bodies- is
only awarded to very well-known and high quality wines with outstanding traditional roots in the
place of origin.
This type of classification has been in use for a long time even if, over the last few years, it has been
criticized especially concerning the relative positioning of IGT (Albisinni, 2008; Lechermere,
2006). In fact, in many cases the IGTs have taken advantage of their flexibility in terms of variety,
image, and geographical identity, thus adjusting better to changes in the consumers’ preferences,
fashion trends and strategies of competitors worldwide3.
3
Though not of direct interest here, it is worth recalling that the CE Regulation 479/2008, that reformed the Common Market Organization for the
wine sector, puts wines under the same Scheme that regulates Certifications of Origin for other food products, that is CE Reg. 510/2006 for PDO and PGI. However, DOCG, DOC and IGT are still in place in the Italian system at the present moment and will only gradually and partially switch to the
new classification.
12
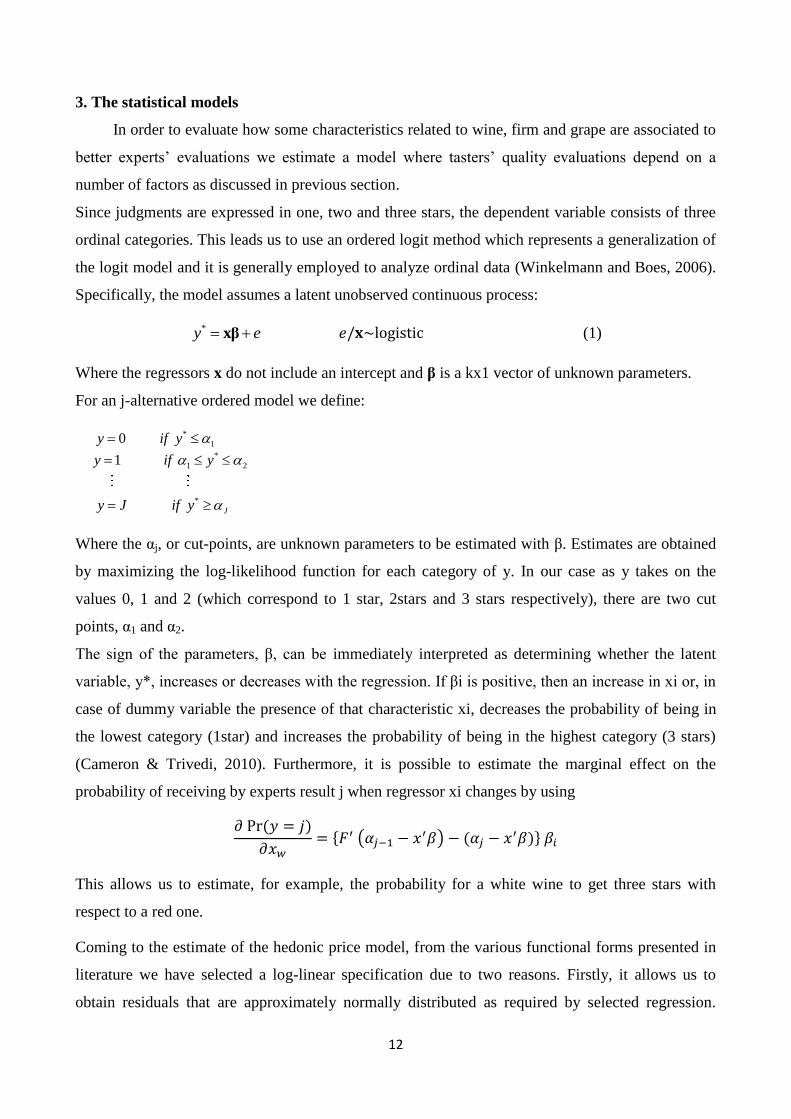
3. The statistical models
In order to evaluate how some characteristics related to wine, firm and grape are associated to
better experts’ evaluations we estimate a model where tasters’ quality evaluations depend on a
number of factors as discussed in previous section.
Since judgments are expressed in one, two and three stars, the dependent variable consists of three
ordinal categories. This leads us to use an ordered logit method which represents a generalization of
the logit model and it is generally employed to analyze ordinal data (Winkelmann and Boes, 2006).
Specifically, the model assumes a latent unobserved continuous process:
*y e xβ 𝑒/𝐱~logistic (1)
Where the regressors x do not include an intercept and β is a kx1 vector of unknown parameters.
For an j-alternative ordered model we define:
*
1
*
1 2
*
0
1
J
y if y
y if y
y J if y
Where the αj, or cut-points, are unknown parameters to be estimated with β. Estimates are obtained
by maximizing the log-likelihood function for each category of y. In our case as y takes on the
values 0, 1 and 2 (which correspond to 1 star, 2stars and 3 stars respectively), there are two cut
points, α1 and α2.
The sign of the parameters, β, can be immediately interpreted as determining whether the latent
variable, y*, increases or decreases with the regression. If βi is positive, then an increase in xi or, in
case of dummy variable the presence of that characteristic xi, decreases the probability of being in
the lowest category (1star) and increases the probability of being in the highest category (3 stars)
(Cameron & Trivedi, 2010). Furthermore, it is possible to estimate the marginal effect on the
probability of receiving by experts result j when regressor xi changes by using
𝜕 Pr (𝑦 = 𝑗)
𝜕𝑥𝑤= {𝐹′ (𝛼𝑗−1 − 𝑥′𝛽) − (𝛼𝑗 − 𝑥′𝛽)} 𝛽𝑖
This allows us to estimate, for example, the probability for a white wine to get three stars with
respect to a red one.
Coming to the estimate of the hedonic price model, from the various functional forms presented in
literature we have selected a log-linear specification due to two reasons. Firstly, it allows us to
obtain residuals that are approximately normally distributed as required by selected regression.
13
Secondly, the interpretation of regression coefficients is more immediate and is as follows: the
dependent variable changes by 100*( -1) percent for a one-unit increase in x, holding all other
variables fixed.
Specifically, the log-linear specification is expressed as follows:
Log P = f (A, F, Ce) (2)
Where the dependent variable is the logarithm of the wine price which is explained by a number of
independent variables as described in the previous section.
For estimating equation (2) we choose an interval regression because our dependent variable (wine
price) is grouped into intervals. Indeed, using this kind of data as the dependent variable requires a
generalization of censored regression known as interval regression (Wooldridge, 2010). The
extreme values of the categories on either end of the range are either left-censored or right-
censored.
In other words, we have interval-coded data but we are interested in the population regression
y uxβ . It is worth noting that the structure of the problem is similar to the ordered probit
model. However, one feature of such models is that the “cut-points” (i.e. the values separating
different outcomes) are assumed to be unknown parameters requiring estimation. As the cut-points
are known in our case (Table 1 - descriptive statistics) we do not use ordered probit model.
Let 1 2 ... jr r r denote the known interval limits (i.e. reported price intervals). We can define:
1
1 2
0
1
J
w if y r
w if r y r
w J if y r
Under the normality assumption, we can estimate β and 2 . Recently Murasawa (2013) stated that
if J ≥4, it is possible to relax the assumption of normality or known boundaries (or both if J ≥5),
though at least two boundaries must be known. The log likelihood for a random draw i is:
1 2
1
, 1 0 log / 1 1 log /
/ ... 1 log /
i i i
i J
l w r w r
r w J r
β xβ xβ
xβ xβ
The maximum likelihood estimators of β and 2 are often called interval regression estimators,
with the understanding that the underlying population distribution is homoskedastic normal
(Wooldridge, 2010).
14
While ordered logit or ordered probit permit to evaluate the probability for a wine to present a
medium or a high price, instead of a low one, depending to its specific characteristic, interval
regression allows interpreting the estimates in the same way of OLS and Quantile regressions. In
effect, the coefficients of the interval regression, in case of a log-linear specification, show the
percentage impact of each variable on price. This characteristic represents certainly an advantage of
interval regression with respect to logit and probit models and, to our knowledge, this is the first
time that it is applied in order to estimate a hedonic price model.
Assessing fit of models (1) and (2) involves the evaluation of scalar measures of fit for the model as
a whole. Many scalar measures have been developed to summarize the overall goodness of fit for
regression models of continuous, count or categorical dependent variables. A scalar measure can be
useful in comparing competing models and ultimately in selecting a final model. However, there is
no convincing evidence that selecting a model that maximizes the value of a given measure results
in a model that is optimal in any sense other than the model’s having a larger value of that measure.
Although measures of fit provide some information, it is only partial information that must be
assessed within the context of the theory motivating the analysis, past research, and the estimated
parameters of the model being considered (Long and Freese, 2006). Bearing this consideration in
mind, we considered the McKelvey and Zavoina’s R2 which can be defined for models with
censoring using
^' ^^ ^ ^
Var y Varβ x β . The measure is expressed as:
^2
& /
M ZR Var y Var y
4. Results
An overview of the number and frequency of the different cases in each variable is presented
below in Tab. 1 where the dataset is presented as an aggregate as well as divided by wine
typologies.
Results of equation n.1
The estimates of the ordered logit regression for all wines -with robust standards errors- are
reported because the selected variables affect the experts’ evaluations of the various types of wine
basically in the same way.
15
Table 1. Number of observations and frequencies of cases.
Source: Our elaborations on Veronelli 2010.
Variables obs freq obs freq obs freq obs freq
Wine level
new entry 298 0.12 175 0.13 83 0.12 25 0.10
one star 509 0.21 194 0.14 219 0.32 38 0.15
two stars 1280 0.52 729 0.53 364 0.53 137 0.52
three stars 352 0.14 265 0.19 23 0.03 61 0.23
organic 336 0.14 177 0.13 113 0.16 25 0.10
<7600 number of bottles 851 0.35 451 0.33 191 0.28 189 0.72
more than 1 enologist 474 0.19 250 0.18 157 0.23 45 0.17
Area of production
DOCG 440 0.18 231 0.17 19 0.03 117 0.45
DOC 899 0.37 508 0.37 289 0.42 56 0.21
IGT 1100 0.45 624 0.46 381 0.55 88 0.34
Lazio 220 0.09 114 0.08 89 0.13 11 0.04
Sicilia 675 0.28 393 0.29 226 0.33 54 0.21
Veneto 1544 0.63 856 0.63 374 0.54 196 0.75
Price=<7 E. 325 0.13 148 0.11 165 0.24 3 0.01
7<Pr=<10 E. 590 0.24 304 0.22 237 0.34 5 0.02
10.1<Pr=<15 E. 681 0.28 366 0.27 215 0.31 50 0.19
15.1<Pr=<20 E. 282 0.12 155 0.11 46 0.07 68 0.26
20.1<Pr=<30 E. 324 0.13 195 0.14 22 0.03 96 0.37
Price>30 E. 237 0.10 195 0.14 3 0.00 39 0.15
obs 2439 1.00 1363 1.00 688 1.00 261 1.00
White Wines Sweet WinesAll Wines Red Wines
16
Looking at the overall fit of the model, the McKelvey&Zavoina R2 has a value of 0.255: still a
good result for ordered logit estimations. There are few variables that significantly affect the
probability of the wine in our dataset to get a higher score in Veronelli blind evaluation tests; these
are:
1) The typology of the wine. In particular, white and sparkling wines have a lower probability to reach
higher scores, indicating that experts, other things being equal, do not appreciate these wines as the
other ones. Actually, Tab. 2 and Fig. 3 clearly shows that, with respect to red wines (i.e. the
benchmark), the whites have about 8% of additional probability to get one star while they have
6.5% chances less to get three stars. The appreciation of sparkling wines is even lower, with 13.8%
more probability to get only one star and 11.3% less to get three stars.
2) The ageing of wine is particularly appreciated by Veronelli experts, with high and significant
coefficients of the variables stating the progressively more intense effects of the maturing process.
Older wines are more likely to obtain three stars and, symmetrically, less likely to obtain only one
star and the effect increases from the two years old wines (2008 vintage in our sample, as compared
to the benchmark, i.e. vintage 2009) – that have -14% probabilities to obtain one star and +11.6%
to obtain three stars- up to the older wines in the sample (vintage 2004 and older, as compared to
vintage 2009) -that have -39% probabilities to obtain one star and +33% % to obtain three stars.
Table 2.The ordered logit model estimation
Source: Our elaborations on Veronelli 2010. 1 Table reports coefficients and standard errors 2 *means significant at 1%; **means significant at 5%; ***means significant at 10%
Variables Coef St. Err
white wines -0.538* 0.11545
Sdl wines 0.082 0.15062
sparkling wines -0.928* 0.22618
national origin -0.042 0.17276
national diffusion 0.022 0.15037
wide diffusion -0.326 0.19961
vintage<2004 2.622* 0.23871
vintage 2005 1.772* 0.19962
vintage 2006 1.829* 0.15424
vintage 2007 1.546* 0.13427
vintage 2008 0.952* 0.12213
organic -0.0387 0.12672
agronomist 0.319* 0.10452
more than 1 enologist 0.433* 0.11092
Cut1 -0.246 0.22294
Cut2 3.135 0.23486
McKelvey & Zavoina's R2
Obs
All Wines
0.255
2139
17
The variables included in the model in order to represent the kind of vines do not significantly
affect experts’ evaluations. This is interpreted as a sign of lack of any a priori preferences, whether
positive or negative, neither towards different origin of the vines nor towards the wideness of their
diffusion.
Similarly, wines from organic grapes do not encounter any significant quality disadvantage and
have just the same probability to score higher or lower than any other wine in the sample. This
result seems quite relevant as it contradicts results usually obtained in hedonic price exercises.
Figure 3. Marginal effects of different quality attributes on experts’ evaluations
3) According to our results, grapes produced with the help of an agronomist make the wine better and
so does, and even more, the presence of more than one oenologist. The coefficients are significant
and indicate, respectively, an increased probability of about 3.9 % and 5.3 % to get 3 stars with
respect to wines produced without the agronomic expertise and/or with the help of only one
oenologist.
In conclusion, the estimation of the first equation rendered some relevant results that may be
summed up as follows: i) Veronelli experts have their own preferences in favor of red and more
aged wines. No other significant predispositions towards wines typologies and/or attributes that
horizontally segment the market emerge; ii) wines produced with the advice of experts have more
chances to get higher scores (i.e. overall, their sensory quality is higher).
Results of equation n.2
-50
-40
-30
-20
-10
0
10
20
30
40
One star
two stars
Three stars
18
Hereafter we report the results of the estimates of the hedonic price models. Previous works
(Schamel, 2003; Corduas et al., 2013; --------------- 2014a, 2014b, 2014c) have demonstrated that red
wines are associated with higher prices than white ones and, moreover, the other characteristics are
differently related to prices for the different wine typologies. Since the results of Chow test, which
examines whether parameters (slopes and the intercept) of one kind are different from those of other
types, suggested us to estimate separately wines from each typology, the table 3 and Fig. 4 show the
results for all wines, red, white and Sdl wines4.
The estimations of the coefficients of the second equation (tab. 3) show that the model fits quite
well with a good value of the McKelvey&Zavoina R2: 0.437. Nevertheless, it should be pointed out
that the subsample with red wines fit better (0.428) lower values with respect to the white (0.258)
and the sweet ones (0.298). As there are many variables that have a significant impact on the price
of wines, we get a further confirmation of the complexity of this market and, thus, of the intricacy
of the overall system of the quality clues that convey information to the final consumer.
Starting with the variables directly related to the wine, the first to be presented are those expressing
product typologies. The consumers’ price of white wines reviewed by Veronelli is, on average,
5.6% lower than that of red wines, while the price of sparkling wines is not significantly different
and sweet wines are associated to about 22.2% higher prices.
One of the most valuable attributes are the guide evaluation and the age. Evaluations (i.e. the clues
that asses sensory quality to the final consumer) are particularly valuable and perform as expected
with two stars wines (i.e. very good wines) that worth 25% more than wines that got one star (i.e.
good wines, that are the benchmark) and three stars wines (excellent wines) that largely outperform
one star wines with an average increase in price of about 86%. The price of red wines is more
sensitive to the evaluation ranking with respect to both: white and sweet wines, with the last ones
that only react, in terms of PP, at the three stars level.
It is particularly interesting to discuss the results for the New Entries. These wines are associated
with a price premium of about 26.9% with respect to the benchmark; their coefficient is slightly
higher (+1.6%) also when compared to the two stars wines while it is much lower in comparison to
the three stars wines (about 60 percentage points lower). These results may be interpreted as
follows: while New Entries are welcomed positively at relatively less high market segments due to
the effect of promotional activities and to the curiosity for novelties (see previous section); when
confronted with the higher ones, where consumers are more exigent and prices are higher, they
suffer from the lack of consolidated reputation and information. Also, it is worth to pinpoint that red
4
Since dataset contains only 117 sparkling wines, the hedonic price model was not estimated separately for such wine typology.
19
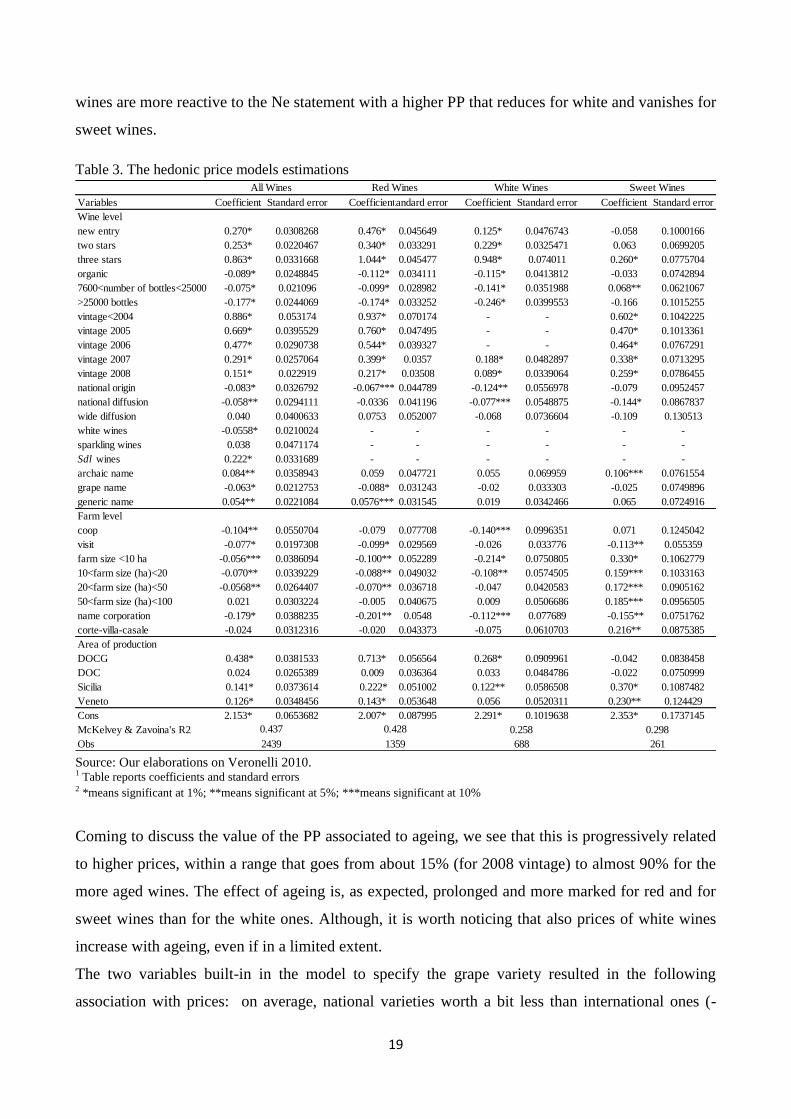
wines are more reactive to the Ne statement with a higher PP that reduces for white and vanishes for
sweet wines.
Table 3. The hedonic price models estimations
Source: Our elaborations on Veronelli 2010. 1 Table reports coefficients and standard errors 2 *means significant at 1%; **means significant at 5%; ***means significant at 10%
Coming to discuss the value of the PP associated to ageing, we see that this is progressively related
to higher prices, within a range that goes from about 15% (for 2008 vintage) to almost 90% for the
more aged wines. The effect of ageing is, as expected, prolonged and more marked for red and for
sweet wines than for the white ones. Although, it is worth noticing that also prices of white wines
increase with ageing, even if in a limited extent.
The two variables built-in in the model to specify the grape variety resulted in the following
association with prices: on average, national varieties worth a bit less than international ones (-
Variables Coefficient Standard error CoefficientStandard error Coefficient Standard error Coefficient Standard error
Wine level
new entry 0.270* 0.0308268 0.476* 0.045649 0.125* 0.0476743 -0.058 0.1000166
two stars 0.253* 0.0220467 0.340* 0.033291 0.229* 0.0325471 0.063 0.0699205
three stars 0.863* 0.0331668 1.044* 0.045477 0.948* 0.074011 0.260* 0.0775704
It is interesting to read this piece of evidence together with the role played by the dimension of the
producer that shows a significant positive association with price, with values comprise between -
6.9% to 2% (with respect to the benchmark class that is: over 100 hectares of vineyards). The two
results seems to indicate that larger producers are more effective in building their reputation (due to
scale economies in information and promotion activities) and considerations about exclusivity and
distinctiveness are demanded to the wine label. The effect is sharper in the case of red and DPL
wines, while it is less distinct for white wines.
The same line of reasoning on the role of the producer’s reputation, helps in understanding the
negative sign of the coefficients that links the price with: i) the producers being a coop (-10.4%;
5
The result is particularly interesting when taking into consideration that production volume showed no significant relations to evaluation scores
(these results are not presented in the paper due to space limits). The two evidences together say that, in this case, no quantity/quality trade-off takes
place but in consumers’ eyes.
21
however in the separated models, the coefficient in significant only for the white wines); ii) the
producers signaling in the name the corporate nature of the firm (-17.9; the coefficient is significant
for all the wine typologies)6.
Figure 4. The hedonic price models estimations
6
Noticeably, this is the only feature of the producers’ name that resulted significantly correlated to price in our dataset. The only exception is for
name that include terms such as Corte, Casale, Villa that associate with a significant large negative PP (-21.6%) in case of sweet wines.
-40 -20 0 20 40 60 80 100 120
Veneto
Sicilia
DOC
DOCG
corte-villa-casale
name corporation
50<farm size (ha)<100
20<farm size (ha)<50
10<farm size (ha)<20
farm size <10 ha
visit
coop
generic name
grape name
archaic name
Sdl wines
sparkling wines
white wines
wide diffusion
national diffusion
national origin
vintage 2008
vintage 2007
vintage 2006
vintage 2005
vintage<2004
>25000 bottles
7600<n° of bottles<25000
organic
three stars
two stars
new entry
All wines
Red
White
Sweet
22
Last, we comment on coefficient of the variables that express the place of origin and its
certification. At regional level we find significant coefficients for the three regions in the dataset,
with both wines from Veneto and Sicily gaining higher prices than that from Lazio (+12.6% and
14.09%). Differences are more marked for Sdl wines and reduce progressively for red and for white
wines. Sicilian wines get the highest prices in all the typologies with a peak for Sdl (+37%).
With respect to the certification of the origin these indicate that, while DOCG gain quite a high PP
with +43.8% over IGT, with a peak of + 71.3% for red wines (+26.8% is the coefficient value for
the whites, while the coefficient for Sdl is not significant); DOC does not, for any of the wine
typologies. In other words, this means that DOC and IGT wines in the dataset does not show any
significant differences in their prices: the market denies the quality pyramid established, on paper,
by the law.
5. Concluding remarks
The analysis presented in the paper offers many diverse insights on the functioning of the
complex Italian wine market and especially on the role of different quality clues.
The estimate of the first equation, where experts’ evaluations are regressed on a bunch of quality
attributes, shows that their quality appraisal reacts positively to the expertise of agronomist and
oenologist that, hence, seems to increase wine sensory quality. Investments in acquiring these
competences seem thus rewarding in terms of increased product quality.
One more piece of evidence that stems from the first regression exercise is that experts’ quality
assessments are influenced by testers’ taste. In particular, Veronelli guide experts prefer red wines
more than white ones and more aged wines with respect than younger ones. Besides, our dataset did
not show other bias factors, with different kind of vines that do not influence judgments and organic
wines that have just the same chance of getting one, two or three scores than non-organic wines.
In our view, evidence that the evaluations are affected by testers’ taste, is not to be regarded as a
factor that diminishes reliability of experts’ judgments. On the contrary, given the very subjective
nature of taste, groups of consumers with clear preferences for definite quality attributes shall to
refer to the guide that better suites their taste. Put in this way, we conclude that a systematic meta-
analysis on experts’ tastes may be useful in help consumers at better orienteering themselves in the
world of wine guides.
The estimates of the second equation show the extent to which a number of different quality clues
are associated with price premiums. Overall, experts’ evaluations, DOCG certification and wine
ageing are the most valuable features. One more general result is that the price of red wines seem
more reactive to many quality clues with respect to white wines. Just as if quality turns-out to be
23
more important, more valuable, when choosing red wines. Recalling the results of the first
regression, that showed experts’ partisan appreciation for red aged wines, this may be interpreted as
an alignment between the experts’ and the consumers’ tastes.
Other results are worth to be recalled: i) international grape varieties worth more than the national
ones; however locally rooted vines get a price premium with respect to nationally diffused vines; ii)
there is an inverse relationship between price and production volumes, indicating that consumers
assume that a quality-quantity trade-off works and/or appreciate the value of scarcity; iii)diversely,
the dimension of the producer is positively associated with price, showing that there is a
reputational premium associated to a higher visibility; iv)wines produced by Italian cooperatives get
a negative price premium as well as wines from corporate firm that declare their nature in their
name; v)organic wines also get a negative price premium that is approximately of the same extent
for red and white wines. It may be argued that consumers’ negative bias against organic wines is the
effect, prolonged over time, of former poor quality performance of these wines. The absence of any
systematic negative evaluation on the experts’ side allows anticipating that, over time, these wines
could regain a better reputation. In other words: evidences on the good quality alignment reached by
organic wines may help, over time, to overcome the negative widespread prejudice of the final
consumers, inducing a higher willingness to pay.
An element of originality of the proposed analysis is the attempt to get first insights on the value of
different name typologies. While this is quite a developed field in marketing studies it is not so
common in the wider economic literature on wine markets. Our results about wine names indicate
that these are useful tools to differentiate the product, raise reputation and increase the price. No
matter if they are just generic names or if, for example, use archaic terms. Diversely, names that
mention the vine are not valuable in our dataset. A possible reason for this can be found referring to
the negative value associated to some kind of grape variety: would the name of the wine mention
the disliked kind of variety this would negatively affect the value.
References
Albissini, F., 2008. La OCM vino: denominazioni di origine, etichettatura e tracciabilità nel nuovo