33
WIN/Gallup International’s 40 th Annual Global End of Year Survey reveals Happiness improves despite Economic Confidence falling

WIN/Gallup International’s
40th Annual Global End of Year Survey
reveals Happiness improves despite Economic
Confidence falling

WIN/Gallup International’s 40th Annual Global End of Year Survey reveals
happiness improves despite economic confidence falling
WIN/Gallup International, the world’s leading association in market research and polling, has
published today its 40th Annual End of Year Survey exploring the outlook, expectations, views and
beliefs of 68,759 people from 69 countries across the globe.
Headlines
68% of the world said that they feel happy about their lives, an increase from 66% last year;
22% are neither happy nor unhappy, and 9% feel unhappy about their lives.
Net happiness (happy minus unhappy) globally is +59%; an increase from +56% last year.
Fiji and China are the happiest countries of the world (+89% and +79% net happiness
respectively), followed by Philippines, Vietnam, Indonesia, Panama and Papua New Guinea
while Iraq is the least happy for the third year in a row (less than +1% net happiness).
42% of the world is optimistic about the economic outlook for 2017; 22% are pessimistic and
31% believe the economy will remain the same. Net economic optimism is at +20%.
The most optimistic countries about economic prosperity in 2017 are Ghana and Bangladesh
(+67% net optimistic each). In contrast, South Korea, Hong Kong and Greece are the most
pessimistic (-62%, -56% and -53% respectively).
Happiness: A happier world albeit with some stark regional differences
Two in three (68%) citizens of the world report being happy, a figure which has risen 2% from twelve
months ago, despite a year in which the world has seen considerable change and a year of frequent
and bloody terrorist attacks. Of the 68,759 people surveyed, 9% said that they were unhappy, down
from 10% at the end of 2015. Overall this means that the world is +59% net happy (happiness minus
unhappiness).
But regionally the story is very different with those in East Asia and Oceania significantly happier
than those in the Middle East. For example, happiness in Fiji and China, the net happiest countries of
the world (net scores of +89% and +79% respectively) is in stark contrast to happiness in Iraq, which
rates as the unhappiest of all 69 countries surveyed (net score of less than +1%).
The Beatles wrote “money can’t buy me love” – but the findings suggest it does however correlate
strongly with happiness – those in the bottom quintile of income record a net happiness score of
+33% compared with a score of +75% for those in the top quintile; irrespective of nations in which
they reside.

Economic Optimism: Globally high but lower than last year
When it comes to economic outlook despite much of the world largely remaining out of recession,
economic optimism has declined from twelve months ago. The study shows that 42% of the world is
optimistic for the economic outlook in 2017, almost double (22%) of those who are pessimistic. Net
optimism (the percentage of those saying next year will be one of economic prosperity minus the
percentage who say next year will be one of economic difficulty) has fallen from +23% to +20%.
While globally just over two in five (42%) say next year will be one of economic prosperity, there are
very significant differences across the globe. European citizens are significantly less optimistic than
anywhere else in the world: EU Europe net score of -26% and Non-EU Europe net score of -20%. The
challenges posed to the very future of the EU project in 2016 may well have created economic doubt
within the world’s largest economic bloc. Within Europe, economic pessimism is most acutely felt in
Italy (net score of -48%), the UK (net score of -38%) and France (net score of -34%). Only Korea and
Hong Kong, who have witnessed a year of political and economic turmoil, are more pessimistic (net
scores of -62% and -56%). The most optimistic nations when it comes to the economy were Ghana
and Bangladesh (+67% net optimism each). When it comes to a demographic breakdown, young
people prove to be considerably more optimistic than older generations with 34% under 34 years of
age net optimistic compared to -7% over the age of 55.
Hope: High amongst Middle and Low Income Nations
As most of the world welcomes a New Year, we see a majority (52%) of the planet feeling that
overall 2017 will be better than 2016, although one in seven (15%) feel it will be worse (giving a net
score of +37%, which represents a small drop of 2% points from a year ago). Those living in some of
the fastest growing countries in the world (Bangladesh net +76%, Ghana net +76%, Ivory Cost +72%,
Fiji +62%, China net +56%, India net +55% and Brazil net +51%) are the most hopeful for the year
ahead. However, it is the economic superblocks of the EU (net score of 1%) and North America (net
score of +11%) which show the least optimism for improvement. With Prime Minister Renzi losing a
referendum this month and with an economic recovery that does not take off, it is perhaps of no
surprise that it is the Italians (net score of -42%) who are most concerned about the year ahead.
Analysis: Global Income Redistribution drives national outlooks on Economic Optimism and Pessimism Polling data combined with World Bank Bigdata on Gross National Income (GNI) shows a clear link
between economic outlook for the year 2017 and global redistribution of Income (GNI) during the
last one decade.
During the recent 10 years (2005-15), the Tier One Rich Countries (30 nations with average annual
per capita income of 45,000 US dollars) lost 10% in their share in global economy. This Group in the
opinion poll is at present the most pessimistic in their economic outlook for 2017 (-17% Net Score).
The Tier Two Middle Income Countries (12 nations with average annual per capita income of 13,000
US dollars) gained 10% in their share in global economy. This group in the survey is at present the
most optimistic in economic outlook for 2017 (+30%). The Tier Three Low Income countries (175
nations with average annual per capita income of 7,000 US dollars) which retained its share in global
economy during the last decade hangs in between the Tier One and Tier Two in terms of economic
outlook (+26%). See Exhibit 5 on page 11.
Vilma Scarpino, President of WIN/Gallup International Association, said: “The world is witnessing
changing income distribution across nations. The old rich are losing while the new rich are gaining
ground. This transition is reflected in their outlooks on hope about 2017. Fortunately, happiness is
becoming unrelated to views on economic outlook. The rich nations of the Western World are happy
despite their gloomy outlook on economic prospects. As a result, the global community as a whole
reveals a happy majority, in fact slightly happier than a year ago.”
-ENDS-
Methodology:
The WIN/Gallup International survey is an annual tradition initiated by and designed under the
chairmanship of Dr. George Gallup in 1977. It is conducted every year since then. This year it was
carried out by the WIN/Gallup International Association in 69 countries around the world. It is the
poll’s 40th anniversary.
Sample Size and Mode of Field Work:
A total of 68,759 people were interviewed globally. In each country a representative sample of
around 1000 men and women was interviewed either face to face (26 countries; n=29,713), via
telephone (15 countries; n=12,470), online (25 countries; n=23,947) or through mixed methods (3
countries; n=2,629). The field work was conducted during October-December 2016. The margin of
error for the survey is between +/-3-5% at 95% confidence level.

About WIN/Gallup International
WIN/Gallup International is the leading association in market research and polling (registered and
headquartered in Zürich/Switzerland and not related to Gallup Inc., headquartered in Washington
D.C.) * and is made up of the 80 largest independent market research and polling firms in their
respective countries with combined revenue of over €550 million and covering 95% of the world’s
market.
For more than 60 years WIN/Gallup International Members have demonstrated their expert ability
to conduct multi-country surveys on a comparable basis and deliver the highest quality. Their
Members are leading national institutes with a profound local knowledge of research methods and
techniques, statistical sources, customs and culture differences of its own country and carefully
selected by the Association Board. With only one Member agency per country, Members work
together on a daily basis to share knowledge, new research techniques and tools, as well as to
provide the most appropriate solutions to international research projects and service our clients to
the best of our abilities.
The accumulated expertise of the Association is formidable - they have internationally renowned
experts in public opinion, Third World issues, advertising, and media research as well as in
commercial fields such as IT/telecommunications, healthcare, retail, economics, corporate research
and so on. Members are at the leading edge of technical and methodological developments, which
have impacted on not only the research industry but also the whole commercial world.
* Disclaimer: Gallup International Association or its members are not related to Gallup Inc., headquartered in Washington D.C which is no longer a member of Gallup International Association. Gallup International Association does not accept responsibility for opinion polling other than its own. We require that our surveys be credited fully as Gallup International (not Gallup or Gallup Poll). For further details see website: www.wingia.com,
Opinion Research Committee of WIN/Gallup International: They will be happy to provide comments and explanations required by the media. Dr. Ijaz Gilani [email protected] Johnny Heald [email protected] Marita Carballo [email protected]
For More Information & Media Inquiries, please contact: Chiara Monetti [email protected] Misha Raza [email protected]

EXHIBIT #1
HOPE INDEX
ECONOMIC
OPTIMISM INDEX HAPPINESS INDEX
TOP 10
OPTIMIST/
HAPPY
COUNTRIES
(Starting from
most optimistic/
happiest)
(Net score),
showing positive
minus negative
Bangladesh +76%
Ghana +67%
Fiji +89%
Ghana +76% Bangladesh +67% China +79%
Ivory Coast +72% Ivory Coast +56% Philippines +79%
Fiji +62% India +54% Vietnam +78%
China +56% Vietnam +48% Indonesia +78%
India +55% Philippines +38% Panama +77%
Brazil +51% Fiji +34% Papua New
Guinea +77%
Philippines +48% China +34% Paraguay +74%
Vietnam +48% Papua New
Guinea +31% Bangladesh +74%
Estonia +47% Pakistan +30% Argentina +72%
TOP 10
PESSIMIST/
UNHAPPY
COUNTRIES
(Starting from
most pessimistic/
unhappiest)
(Net score),
showing positive
minus negative
Italy -42%
South Korea -62%
Iraq Less
than1%
Hong Kong -35% Hong Kong -56% Hong Kong +14%
South Korea -31% Greece -53% Greece +21%
Greece -30% Ukraine -49% Nigeria +29%
Mexico -29% Mexico -49% Turkey +30%
Bosnia &
Herzegovina -13% Italy -48% Afghanistan +31%
Bulgaria -5% Belgium -39% Bulgaria +33%
Belgium -5% Austria -38% Romania +34%
Austria -3% United Kingdom -38% Israel +34%
Turkey -2% France -34% Albania +35%

The 3 Key Index Figures for 2017 are the following:
HOPE:
Optimists: 52%
Pessimists: 15%
Neutrals: 27 %
EXHIBIT #2
Optimists lead Pessimists by 37 %

ECONOMIC OPTIMISM:
Optimists: 42%
Pessimists: 22%
Neutrals: 31%
EXHIBIT # 3
Optimists lead Pessimists by 20%

HAPPINESS:
Happy: 68%
Neutrals: 22%
Unhappy: 9%
EXHIBIT #4
Happy People Lead Unhappy People by 59%

EXHIBIT #5
DRIVERS OF NATIONAL OUTLOOK ON
ECONOMIC OPTIMISM AND PESSIMISM
Global Income
(GNI) at PPP
Economic Outlook for
2017
Net Score
Share in
2005
Share in
2015
Change in Share
(2005-15)
TIER ONE
countries
(G7 and EU)
50% 40% -10% -17%
TIER TWO
(G20 other
than Tier One countries
32% 42% +10% +30%
TIER THREE
All Other countries 18% 18% Nil +26%
Note: 1- Global GNI is based on the latest available Tables provided by the World Bank (databank.worldbank.org). The
Purchasing Power Parity (PPP) based computations have been used for both years (2005-2015)
2- Approximations have been used within + 1%.

Table # 1.1: HOPE INDEX FOR 2017 (Country Wise)
Q1. As far as you are concerned, do you think that 2017 will be better, worse or the same as 2016?
Net Hope
Optimists Pessimists Neutral* Do not
know / no response
Net Score of Optimists
over Pessimists
Row% Row% Row% Row% Row%
Global average 52% 15% 27% 6% 37%
Co
un
trie
s in
Alp
hab
eti
cal
ord
er
Afghanistan 35% 36% 27% 2% -1%
Albania 47% 12% 37% 4% 35%
Argentina 45% 23% 26% 6% 22%
Armenia 34% 14% 42% 10% 20%
Australia 29% 26% 38% 7% 3%
Austria 23% 26% 46% 5% -3%
Azerbaijan 29% 14% 12% 45% 15%
Bangladesh 86% 10% 3% 1% 76%
Belgium 22% 27% 41% 10% -5%
Bosnia and Herzegovina
19% 32% 35% 14% -13%
Brazil 68% 17% 11% 4% 51%
Bulgaria 21% 26% 40% 13% -5%
Canada 38% 24% 33% 5% 14%
China 62% 6% 31% 1% 56%
Colombia*** 47% 29% 22% 2% 18%
Congo 34% 22% 27% 17% 12%
Czech Republic 27% 22% 47% 4% 5%
Denmark 40% 7% 49% 4% 33%
Ecuador 32% 27% 26% 15% 5%
Estonia 53% 6% 31% 10% 47%
Fiji 70% 8% 18% 4% 62%
Finland 35% 22% 34% 9% 13%
France 25% 27% 36% 12% -2%
Germany 31% 24% 42% 3% 7%
Ghana 80% 4% 7% 9% 76%
Greece 21% 51% 24% 4% -30%
Hong Kong 15% 50% 29% 6% -35%
Iceland 22% 11% 63% 4% 11%
India 64% 9% 18% 9% 55%
Indonesia 49% 11% 35% 5% 38%
Iran*** 36% 24% 24% 16% 12%
Iraq 52% 33% 12% 3% 19%
Ireland 38% 21% 36% 5% 17%
Israel 36% 20% 35% 9% 16%
Italy 14% 56% 27% 3% -42%
Ivory Coast 78% 6% 8% 8% 72%
Japan 20% 13% 41% 26% 7%

Korea, Rep (South) 11% 42% 45% 2% -31%
Kosovo 46% 13% 36% 5% 33%
Latvia 32% 22% 31% 15% 10%
Lebanon 43% 27% 27% 3% 16%
Lithuania 40% 18% 34% 8% 22%
Macedonia 39% 21% 31% 9% 18%
Mexico 17% 46% 35% 2% -29%
Mongolia 39% 22% 37% 2% 17%
Nigeria 66% 21% 9% 4% 45%
Norway 41% 15% 39% 5% 26%
Pakistan 53% 28% 17% 2% 25%
Palestinian Territories (West Bank & Gaza) ***
34% 38% 22% 6% -4%
Panama 42% 23% 30% 5% 19%
Papua New Guinea 52% 16% 24% 8% 36%
Paraguay 43% 12% 39% 6% 31%
Peru 57% 12% 23% 8% 45%
Philippines 52% 4% 39% 5% 48%
Poland 26% 26% 39% 9% 0%
Portugal 45% 14% 38% 3% 31%
Romania 40% 25% 29% 6% 15%
Russian Federation 33% 19% 38% 10% 14%
Serbia 30% 31% 37% 2% -1%
Slovenia 35% 19% 41% 5% 16%
South Africa 56% 22% 14% 8% 34%
Spain 39% 22% 37% 2% 17%
Sweden 49% 10% 38% 3% 39%
Thailand 42% 13% 44% 1% 29%
Turkey 37% 39% 18% 6% -2%
Ukraine 37% 34% 28% 1% 3%
United Kingdom 33% 29% 31% 7% 4%
United States 36% 25% 26% 13% 11%
Vietnam 60% 12% 26% 2% 48%
Optimists: 2017 will be Better Pessimists: 2017 will be Worse *Neutral: 2017 will remain the same
** ROUNDING OFF OF DECIMALS: There may be a slight difference of 1% in some instances. Exact figures are available elsewhere. There is also a slight possibility that the figures vary up to a maximum of 1% between different versions of the press releases. ***Iran and Palestine’s data as well as Colombia’s updated data arrived after the initial draft had been completed. We have included their findings in the country wise tables. However, their data is not reflected in the regional & demographic tabulation, exhibits or within the text of this press release. Moreover, the data is not part of the main dataset of this press release and thus not reflected in the global statistics/other overall figures.
Weighted according to Adult Population 18+ SOURCE: WIN/Gallup International Annual Global Poll/ EOY, December 2016

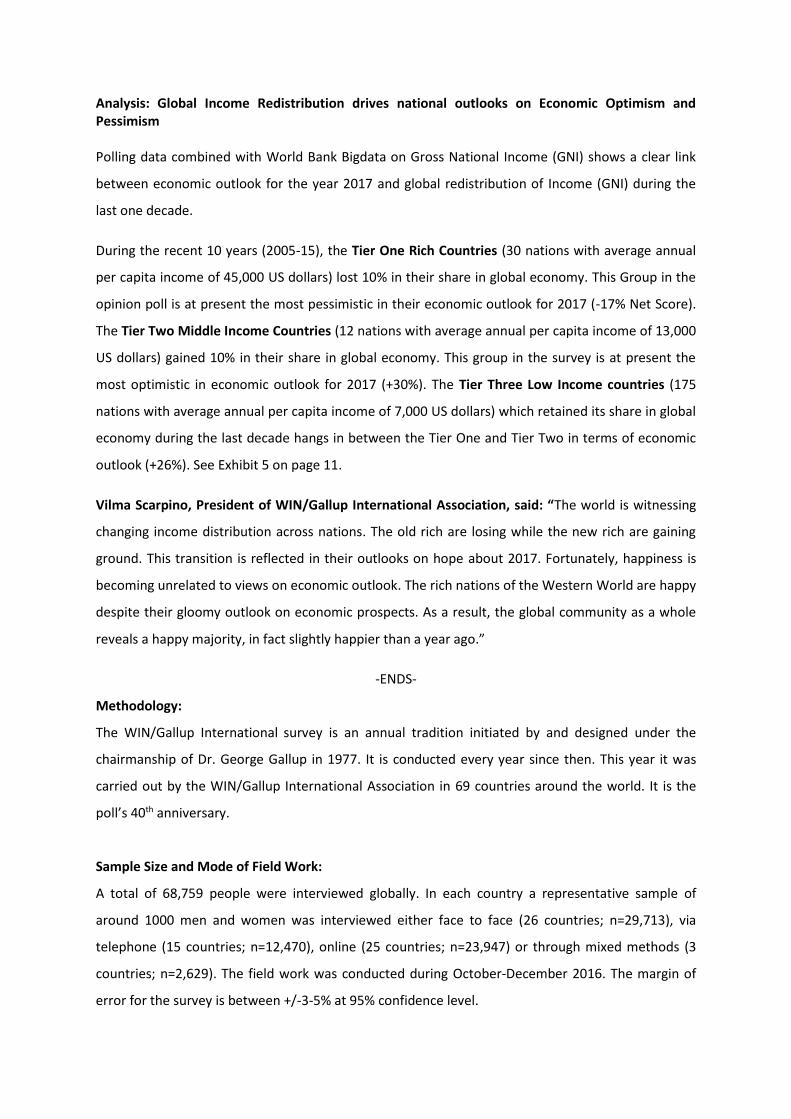
Table # 1.2: HOPE INDEX FOR 2017 (Region Wise)
Q1. As far as you are concerned, do you think that 2017 will be better, worse or the same as 2016?
Net Hope
Un
weig
hte
d
Co
un
t
Co
l%
Op
tim
ists
Pes
sim
ists
Neu
tral*
DK
/NR
Net Score of Optimists
over Pessimists
Row% Row% Row% Row%
All Regions 66541 100 52% 15% 27% 6% 37%
East Asia & Oceania 11442 41.16 55% 9% 33% 3% 46%
Non-EU Europe 8382 4.69 34% 23% 35% 8% 11%
EU Europe*** 21357 10.19 29% 29% 36% 6% 0%
Latin America 7544 7.12 49% 25% 21% 5% 24%
MENA 2000 0.31 50% 32% 15% 3% 18%
North America 2002 7.13 36% 25% 26% 13% 11%
Sub-Saharan African 5423 3.16 65% 19% 10% 6% 46%
West & South Asia 8391 26.23 63% 12% 17% 8% 51%
G-7 7175 100 30% 26% 32% 12% 4%
United States of America
1001 40.52 36% 25% 26% 13% 11%
Canada 1001 4.83 38% 24% 33% 5% 14%
Germany 1006 11.62 31% 24% 42% 3% 7%
France 1007 8.41 25% 27% 36% 12% -2%
United Kingdom 1004 8.55 33% 29% 31% 7% 4%
Italy 995 8.38 14% 56% 27% 3% -42%
Japan 1161 17.69 20% 13% 41% 26% 7%
BRIC 5349 100 62% 9% 25% 4% 53%
Brazil 1974 6.49 68% 17% 11% 4% 51%
Russian Federation 1000 5.62 33% 19% 38% 10% 14%
India 1225 37.01 64% 9% 18% 9% 55%
China 1150 50.87 62% 6% 31% 1% 56%
G-20 20733 100 52% 14% 27% 7% 38%
United States 1001 7.83 36% 25% 26% 13% 11%
Canada 1001 0.93 38% 24% 33% 5% 14%
Germany 1006 2.25 31% 24% 42% 3% 7%
France 1007 1.63 25% 27% 36% 12% -2%
United Kingdom 1004 1.65 33% 29% 31% 7% 4%
Italy 995 1.62 14% 56% 27% 3% -42%
Japan 1161 3.42 20% 13% 41% 26% 7%
Argentina 978 0.96 45% 23% 26% 6% 22%
Korea 1500 1.36 11% 42% 45% 2% -31%
Turkey 1013 1.71 37% 39% 18% 6% -2%
Australia 1253 0.58 29% 26% 38% 7% 3%
China 1150 34.37 62% 6% 31% 1% 56%

India 1225 25 64% 9% 18% 9% 55%
Russian Federation 1000 3.8 33% 19% 38% 10% 14%
Brazil 1974 4.38 68% 17% 11% 4% 51%
South Africa 1645 1.03 56% 22% 14% 8% 34%
Indonesia 1005 5.09 49% 11% 35% 5% 38%
Mexico 815 2.38 17% 46% 35% 2% -29%
T3 Classification 66541 100 52% 15% 27% 6% 37%
.
Tier # 1 (Original G7 + EU Europe)
24520 20.1 31% 25% 33% 11% 6%
Tier # 2 (G20 excluding G7+ EU Europe)
13558 65.62 58% 11% 26% 5% 47%
Tier (All other countries )
28463 14.28 57% 18% 22% 3% 39%
East Asia & Oceania: Australia, China, Fiji, Hong Kong, Indonesia, Japan, Korea, Rep (South), Mongolia, Papua New Guinea, Philippines, Thailand and Vietnam. Eastern Europe: Albania, Armenia, Azerbaijan, Bosnia and Herzegovina, Kosovo, Macedonia, Russian Federation, Serbia and Ukraine. EU Europe: Austria, Belgium, Bulgaria, Czech Republic, Denmark, Estonia, Finland, France, Germany, Greece, Iceland, Ireland, Italy, Latvia, Lithuania, Norway, Poland, Portugal, Romania, Slovenia, Spain, Sweden and United Kingdom. Latin America: Argentina, Brazil, Ecuador, Mexico, Panama, Paraguay and Peru. MENA: Iraq and Lebanon. North America: Canada and United States. Sub-Saharan Africa: Congo, Ghana, Ivory Coast, Nigeria and South Africa. West & South Asia: Afghanistan, Bangladesh, India, Israel, Pakistan and Turkey.
Optimists: 2017 will be better Pessimists: 2017 will be worse *Neutrals:2017 will remain the same ** ROUNDING OFF OF DECIMALS: There may be a slight difference of 1% in some instances. Exact
figures are available elsewhere. ***United Kingdom has been considered part of EU Europe for the purpose of this press release. Weighted according to Adult Population 18+
SOURCE: WIN/Gallup International Annual Global Poll/ EOY, December 2016

Table # 1.3: HOPE INDEX FOR 2017 (Demographics Wise)
Q1. As far as you are concerned, do you think that 2017 will be better, worse or the same as
2016?
Net Hope
Un
-Weig
hte
d
Co
un
t
Co
l%
Op
tim
ists
Pes
sim
ists
Neu
tral*
DK
/NR
Net Score of
Optimists over
Pessimists
Row% Row% Row% Row%
Gender 66541 100.00% 52% 15% 27% 6% 37%
D1. Gender
Male 33995 49.86% 53% 15% 26% 5% 38%
Female 32546 50.14% 51% 15% 28% 6% 36%
Age 66541 100.00% 52% 15% 27% 6% 37%
D2A. Age.
Under 34 25522 44.01% 60% 12% 23% 5% 48%
35 - 54 24758 36.77% 52% 16% 27% 5% 36%
55+ 16261 19.22% 35% 21% 36% 8% 14%
Monthly Household Income 66541 100.00% 52% 15% 27% 6% 37%
D3. Income
Low (Bottom quintile/20%)
10837 11.56% 45% 20% 25% 10% 25%
Medium low (Second quintile/20%)
13238 17.98% 46% 16% 30% 7% 30%
Medium (Third quintile/20%)
15376 19.31% 49% 19% 27% 5% 30%
Medium high (Fourth quintile/20%)
10682 26.97% 55% 12% 29% 4% 42%
High (Top quintile/20%)
7960 18.32% 62% 11% 23% 3% 51%
Refused/Do not know/no answer
8448 5.85% 50% 15% 22% 12% 35%
Education 66541 100.00% 52% 15% 27% 6% 37%
D4. Education: Highest attained
No education/only basic education
4205 3.03% 58% 20% 15% 7% 38%
Completed primary
8239 6.93% 41% 23% 31% 6% 18%
Completed secondary school
28986 39.30% 46% 16% 32% 6% 29%
Completed High level education (University)
18353 42.25% 59% 12% 23% 5% 47%

Completed Higher level of education (Masters, PHD, etc.)
6049 8.22% 55% 16% 23% 6% 39%
Refused/DNK/DNA 709 .26% 33% 25% 25% 17% 7%
Optimists: 2017 will be Better Pessimists: 2017 will be Worse *Neutral:2017 will remain the same ** ROUNDING OFF OF DECIMALS: There may be a slight difference of 1% in some instances. Exact figures are available elsewhere.
Weighted according to Adult Population 18+ SOURCE: WIN/Gallup International Annual Global Poll/ EOY, December 2016

Table # 2.1: ECONOMIC OPTIMISM INDEX 2017 (Country Wise)
Q2. Compared to this year, in your opinion, will next year be a year of economic prosperity,
economic difficulty or remain the same for your country?
Net Economic Optimism
Optimists Pessimists Neutral* Do not
know / no response
Net Score of Optimists
over Pessimists
Row% Row% Row% Row%
Global average 42% 22% 31% 5% 20%
Co
un
trie
s in
Alp
hab
eti
cal
ord
er
Afghanistan 25% 51% 22% 2% -26%
Albania 39% 29% 30% 2% 10%
Argentina 37% 31% 25% 7% 6%
Armenia 34% 20% 37% 9% 14%
Australia 12% 41% 39% 8% -29%
Austria 9% 47% 40% 4% -38%
Azerbaijan 20% 17% 16% 47% 3%
Bangladesh 81% 14% 5% 0% 67%
Belgium 10% 49% 26% 15% -39%
Bosnia and Herzegovina
18% 38% 41% 3% -20%
Brazil 41% 23% 31% 5% 18%
Bulgaria 12% 33% 41% 14% -21%
Canada 16% 35% 42% 7% -19%
China 44% 10% 45% 1% 34%
Colombia*** 25% 36% 37% 2% -11%
Congo 32% 27% 25% 16% 5%
Czech Republic 23% 24% 49% 4% -1%
Denmark 26% 18% 50% 6% 8%
Ecuador 29% 37% 26% 8% -8%
Estonia 11% 26% 54% 9% -15%
Fiji 49% 15% 33% 3% 34%
Finland 13% 27% 54% 6% -14%
France 13% 47% 30% 10% -34%
Germany 13% 37% 47% 3% -24%
Ghana 73% 6% 13% 8% 67%
Greece 6% 59% 30% 5% -53%
Hong Kong 8% 64% 24% 4% -56%
Iceland 19% 21% 43% 17% -2%
India 69% 15% 10% 6% 54%
Indonesia 35% 18% 39% 8% 17%
Iran*** 29% 30% 28% 13% -1%
Iraq 35% 35% 27% 3% 0%
Ireland 22% 31% 42% 5% -9%
Israel 21% 33% 39% 7% -12%
Italy 9% 57% 31% 3% -48%

Ivory Coast 69% 13% 12% 6% 56%
Japan 8% 25% 43% 24% -17%
Korea, Rep (South) 4% 66% 28% 2% -62%
Kosovo 37% 13% 40% 10% 24%
Latvia 8% 42% 40% 10% -34%
Lebanon 37% 30% 30% 3% 7%
Lithuania 18% 35% 42% 5% -17%
Macedonia 33% 27% 31% 9% 6%
Mexico 7% 56% 37% 0% -49%
Mongolia 35% 27% 37% 1% 8%
Nigeria 58% 28% 11% 3% 30%
Norway 26% 24% 43% 7% 2%
Pakistan 56% 26% 16% 2% 30%
Palestinian Territories (West Bank & Gaza)***
24% 46% 23% 7% -22%
Panama 23% 20% 54% 3% 3%
Papua New Guinea 53% 22% 21% 4% 31%
Paraguay 39% 14% 39% 8% 25%
Peru 49% 21% 23% 7% 28%
Philippines 48% 10% 39% 3% 38%
Poland 16% 36% 38% 10% -20%
Portugal 27% 22% 47% 4% 5%
Romania 22% 22% 51% 5% 0%
Russian Federation 17% 31% 40% 12% -14%
Serbia 23% 39% 35% 3% -16%
Slovenia 32% 23% 40% 5% 9%
South Africa 29% 43% 19% 9% -14%
Spain 27% 37% 34% 2% -10%
Sweden 10% 23% 64% 3% -13%
Thailand 28% 19% 51% 2% 9%
Turkey 23% 50% 23% 4% -27%
Ukraine 13% 62% 24% 1% -49%
United Kingdom 15% 53% 26% 6% -38%
United States 28% 30% 30% 12% -2%
Vietnam 60% 12% 25% 3% 48%
Optimists: 2017 will be a year of Economic Prosperity Pessimists: 2017 will be a year of Economic Difficulty *Neutral: 2017 will remain the same
** ROUNDING OFF OF DECIMALS: There may be a slight difference of 1% in some instances.
Exact figures are available elsewhere. There is also a slight possibility that the figures vary up to a maximum of 1% between different versions of the press releases. ***Iran and Palestine’s data as well as Colombia’s updated data arrived after the initial draft had been completed. We have included their findings in the country wise tables. However, their data is not reflected in the regional & demographic tabulation, exhibits or within the text of this press release. Moreover, the data is not part of the main dataset of this press release and thus not reflected in the global statistics/other overall figures.
Weighted according to Adult Population 18+ SOURCE: WIN/Gallup International Annual Global Poll/ EOY, December 2016

Table # 2.2: ECONOMIC OPTIMISM INDEX 2017 ( Region Wise)
Q2. Compared to this year, in your opinion, will next year be a year of economic prosperity, economic difficulty or remain the same for your country?
Net Economic Optimism
Un
weig
hte
d
Co
un
t
Co
l%
Op
tim
ists
Pes
sim
ists
Neu
tral*
Do
no
t
kn
ow
/ n
o
resp
on
se
Net Score of
Optimists over
Pessimists
Row% Row% Row% Row%
All Regions 66541 100 42% 22% 31% 5% 20%
East Asia & Oceania
11442 41.16 39% 15% 43% 3% 24%
Non-EU Europe 8382 4.69 17% 37% 36% 10% -20%
EU Europe*** 21357 10.19 15% 42% 37% 6% -27%
Latin America 7544 7.12 31% 33% 32% 4% -2%
MENA 2000 0.31 36% 34% 27% 3% 2%
North America 2002 7.13 27% 30% 32% 11% -3%
Sub-Saharan African
5423 3.16 52% 29% 13% 6% 23%
West & South Asia 8391 26.23 66% 18% 11% 5% 48%
G-7 7175 100 18% 36% 35% 11% -18%
United States of America
1001 40.52 28% 30% 30% 12% -2%
Canada 1001 4.83 16% 35% 42% 7% -19%
Germany 1006 11.62 13% 37% 47% 3% -24%
France 1007 8.41 13% 47% 30% 10% -34%
United Kingdom 1004 8.55 15% 53% 26% 6% -38%
Italy 995 8.38 9% 57% 31% 3% -48%
Japan 1161 17.69 8% 25% 43% 24% -17%
BRIC 5349 100 52% 14% 31% 3% 38%
Brazil 1974 6.49 41% 23% 31% 5% 18%
Russian Federation 1000 5.62 17% 31% 40% 12% -14%
India 1225 37.01 69% 15% 10% 6% 54%
China 1150 50.87 44% 10% 45% 1% 34%
G-20 20733 100 42% 21% 32% 5% 21%
United States 1001 7.83 28% 30% 30% 12% -2%
Canada 1001 0.93 16% 35% 42% 7% -19%
Germany 1006 2.25 13% 37% 47% 3% -24%
France 1007 1.63 13% 47% 30% 10% -34%
United Kingdom 1004 1.65 15% 53% 26% 6% -38%
Italy 995 1.62 9% 57% 31% 3% -48%
Japan 1161 3.42 8% 25% 43% 24% -17%
Argentina 978 0.96 37% 31% 25% 7% 6%
Korea 1500 1.36 4% 66% 28% 2% -62%
Turkey 1013 1.71 23% 50% 23% 4% -27%
Australia 1253 0.58 12% 41% 39% 8% -29%
China 1150 34.37 44% 10% 45% 1% 34%
India 1225 25 69% 15% 10% 6% 54%
Russian Federation 1000 3.8 17% 31% 40% 12% -14%
Brazil 1974 4.38 41% 23% 31% 5% 18%
South Africa 1645 1.03 29% 43% 19% 9% -14%
Indonesia 1005 5.09 35% 18% 39% 8% 17%
Mexico 815 2.38 7% 56% 37% 0% -49%
T3 Classification 66541 100 42% 22% 31% 5% 20%
Tier # 1 (Original G7 + EU Europe)
24520 20.1 18% 35% 36% 11% -17%
Tier # 2 (G20 excluding G7+ EU Europe)
13558 65.62 47% 18% 31% 4% 29%
Tier (All other countries)
28463 14.28 50% 24% 23% 3% 26%
East Asia & Oceania: Australia, China, Fiji, Hong Kong, Indonesia, Japan, Korea, Rep (South), Mongolia, Papua New Guinea, Philippines, Thailand and Vietnam.
Eastern Europe: Albania, Armenia, Azerbaijan, Bosnia and Herzegovina, Kosovo, Macedonia,
Russian Federation, Serbia and Ukraine.
EU Europe: Austria, Belgium, Bulgaria, Czech Republic, Denmark, Estonia, Finland, France,
Germany, Greece, Iceland, Ireland, Italy, Latvia, Lithuania, Norway, Poland, Portugal, Romania,
Slovenia, Spain, Sweden and United Kingdom.
Latin America: Argentina, Brazil, Ecuador, Mexico, Panama, Paraguay and Peru.
MENA: Iraq and Lebanon.
North America: Canada and United States.
Sub-Saharan Africa: Congo, Ghana, Ivory Coast, Nigeria and South Africa.
West & South Asia: Afghanistan, Bangladesh, India, Israel, Pakistan and Turkey.
Optimists: 2017 will be better Pessimists: 2017 will be worse *Neutrals:2017 will remain the same ** ROUNDING OFF OF DECIMALS: There may be a slight difference of 1% in some instances.
Exact figures are available elsewhere. ***United Kingdom has been considered part of EU Europe for the purpose of this press release. Weighted according to Adult Population 18+
SOURCE: WIN/Gallup International Annual Global Poll/ EOY, December 2016

Table # 2.3: ECONOMIC OPTIMISM INDEX 2017 (Demographics Wise)
Q2. Compared to this year, in your opinion, will next year be a year of economic prosperity, economic difficulty or remain the same for your country?
Net Economic Optimism
Un
weig
hte
d
Co
un
t
Co
l%
Eco
no
mic
pro
sp
eri
ty
Eco
no
mic
dif
ficu
lty
Rem
ain
th
e
sam
e
I d
on
't k
no
w / I
pre
fer
no
t to
an
sw
er
Net Score of
Optimists over
Pessimists
Row% Row% Row
% Row%
Gender 66541 100.00% 42% 22% 31% 5% 20%
D1. Gender
Male 33995 49.86% 43% 21% 31% 5% 22%
Female 32546 50.14% 40% 23% 31% 6% 17%
Age 66541 100.00% 42% 22% 31% 5% 20%
D2A. Age.
Under 34 25522 44.01% 53% 19% 23% 5% 34%
35 - 54 24758 36.77% 39% 23% 34% 4% 16%
55+ 16261 19.22% 23% 29% 42% 6% -6%
Monthly Household Income 66541 100.00% 42% 22% 31% 5% 20%
D3. Income
Low (Bottom quintile/20%)
10837 11.56% 38% 28% 26% 8% 10%
Medium low (Second quintile/20%)
13238 17.98% 47% 25% 24% 4% 22%
Medium (Third quintile/20%)
15376 19.31% 40% 26% 29% 5% 14%
Medium high (Fourth quintile/20%)
10682 26.97% 41% 18% 38% 3% 23%
High (Top quintile/20%)
7960 18.32% 43% 18% 35% 4% 25%
Refused/Do not know/no answer
8448 5.85% 42% 22% 27% 9% 20%
Education 66541 100.00% 42% 22% 31% 5% 20%
D4. Education: Highest attained
No education/only basic education
4205 3.03% 53% 23% 19% 5% 30%
Completed primary
8239 6.93% 33% 28% 33% 6% 5%
Completed secondary school
28986 39.30% 35% 24% 35% 6% 11%
Completed High level education (University)
18353 42.25% 47% 19% 29% 5% 28%

Completed Higher level of education (Masters, PHD, etc.)
6049 8.22% 50% 25% 22% 3% 25%
Refused/DNK/DNA
709 0.26% 24% 28% 30% 18% -4%
Optimists: 2017 will be a year of Economic Prosperity Pessimists: 2017 will be a year of Economic Difficulty *Neutrals:2017 will remain the same ** ROUNDING OFF OF DECIMALS: There may be a slight difference of 1% in some instances. Exact figures are available elsewhere.
Weighted according to Adult Population 18+ SOURCE: WIN/Gallup International Annual Global Poll/ EOY, December 2016

Table # 3.1: HAPPINESS INDEX 2017 (Country Wise)
Q3. In general, do you personally feel very happy, happy, neither happy nor unhappy, unhappy, or very unhappy about your life?
Net Happiness
Happy Neutral* Unhappy Do not
know / no response
Net Score of Happy Over
Unhappy Row% Row% Row% Row%
Global average 68% 22% 9% 1% 59%
Co
un
trie
s in
Alp
hab
eti
cal
ord
er
Afghanistan 48% 36% 16% 0% 32%
Albania 49% 35% 14% 2% 35%
Argentina 77% 18% 5% 0% 72%
Armenia 65% 30% 4% 1% 61%
Australia 58% 27% 14% 1% 44%
Austria 65% 28% 6% 1% 59%
Azerbaijan 61% 26% 5% 8% 56%
Bangladesh 80% 14% 6% 0 74%
Belgium 55% 35% 9% 1% 46%
Bosnia and Herzegovina
59% 30% 11% 0% 48%
Brazil 70% 18% 11% 1% 59%
Bulgaria 43% 45% 10% 2% 33%
Canada 62% 25% 12% 1% 50%
China 81% 17% 2% 0 79%
Colombia*** 89% 8% 2% 1% 87%
Congo 56% 32% 10% 2% 46%
Czech Republic 48% 43% 8% 1% 40%
Denmark 61% 32% 5% 2% 56%
Ecuador 74% 21% 4% 1% 70%
Estonia 52% 40% 5% 3% 47%
Fiji 91% 7% 2% 0 89%
Finland 50% 36% 12% 2% 38%
France 49% 45% 6% 0% 43%
Germany 61% 24% 15% 0% 46%
Ghana 68% 5% 26% 1% 42%
Greece 34% 52% 13% 1% 21%
Hong Kong 36% 42% 22% 0% 14%
Iceland 76% 16% 6% 2% 70%
India 61% 19% 19% 1% 42%
Indonesia 79% 17% 1% 3% 78%
Iran*** 42% 45% 12% 1% 30%
Iraq 38% 25% 37% 0% Less than 1%
Ireland 61% 27% 12% 0% 49%
Israel 54% 25% 20% 1% 34%
Italy 45% 47% 7% 1% 38%
Ivory Coast 62% 18% 20% 0% 42%
Japan 59% 29% 4% 8% 55%
Korea, Rep (South) 49% 42% 9% 0% 40%
Kosovo 56% 30% 11% 3% 45%
Latvia 49% 38% 9% 4% 40%
Lebanon 63% 11% 26% 0 37%
Lithuania 54% 36% 8% 2% 46%
Macedonia 52% 36% 10% 2% 42%
Mexico 76% 19% 4% 0.01 72%
Mongolia 73% 24% 3% 0 70%
Nigeria 59% 10% 30% 0.01 29%
Norway 69% 17% 13% 1% 56%
Pakistan 77% 16% 6% 1% 71%
Palestinian Territories (West Bank & Gaza)***
56% 22% 19% 3% 37%
Panama 82% 12% 5% 1% 77%
Papua New Guinea 82% 13% 5% 0% 77%
Paraguay 77% 17% 3% 3% 74%
Peru 69% 26% 4% 1% 65%
Philippines 82% 15% 3% 0% 79%
Poland 67% 25% 7% 1% 60%
Portugal 57% 35% 7% 1% 50%
Romania 59% 16% 25% 0% 34%
Russian Federation 56% 33% 5% 6% 51%
Serbia 48% 42% 10% 0% 38%
Slovenia 59% 34% 6% 1% 53%
South Africa 56% 23% 19% 2% 37%
Spain 59% 30% 10% 1% 49%
Sweden 60% 33% 6% 1% 54%
Thailand 67% 28% 4% 0.01 63%
Turkey 46% 37% 16% 1% 30%
Ukraine 50% 43% 6% 1% 44%
United Kingdom 60% 27% 13% 0% 47%
United States 62% 24% 14% 0% 48%
Vietnam 79% 20% 1% 0 78%
Happy: Happy+ Very Happy Unhappy: Unhappy + Very Unhappy *Neutral: Neither happy nor unhappy
** ROUNDING OFF OF DECIMALS: There may be a slight difference of 1% in some instances.
Exact figures are available elsewhere. There is also a slight possibility that the figures vary up to a maximum of 1% between different versions of the press releases. ***Iran and Palestine’s data as well as Colombia’s updated data arrived after the initial draft had been completed. We have included their findings in the country wise tables. However, their data is not reflected in the regional & demographic tabulation, exhibits or within the text of this press release. Moreover, the data is not part of the main dataset of this press release and thus not reflected in the global statistics/other overall figures.
Weighted according to Adult Population 18+ SOURCE: WIN/Gallup International Annual Global Poll/ EOY, December 2016

Table # 3.2: HAPPINESS INDEX 2017 (Regions Wise)
Q3. In general, do you personally feel very happy, happy, neither happy nor unhappy, unhappy, or
very unhappy about your life?
Net Happiness
Un
weig
hte
d
Co
un
t
Co
l%
Hap
py
Neu
tral*
Un
hap
py
DK
/NR
Net Score of Happy Over
Unhappy
Ro
w%
Ro
w%
Ro
w%
Ro
w%
All Regions 66541 100 68% 22% 9% 1% 59%
East Asia & Oceania 11442 41.16 78% 19% 2% 1% 75%
Non-EU Europe 8382 4.69 54% 35% 6% 5% 49%
EU Europe 21357 10.19 56% 33% 11% 1% 45%
Latin America 7544 7.12 73% 19% 8% 1% 65%
MENA 2000 0.31 43% 22% 35% 0% 8%
North America 2002 7.13 62% 24% 14% 1% 48%
Sub-Saharan African 5423 3.16 60% 14% 26% 1% 34%
West & South Asia 8391 26.23 63% 19% 17% 0% 46%
G-7 7175 100 59% 29% 11% 2% 48%
United States of America 1001 40.52 62% 24% 14% 1% 48%
Canada 1001 4.83 62% 25% 12% 1% 50%
Germany 1006 11.62 61% 24% 15% 0% 46%
France 1007 8.41 49% 45% 6% 0% 42%
United Kingdom 1004 8.55 60% 27% 13% 1% 47%
Italy 995 8.38 45% 47% 7% 0% 38%
Japan 1161 17.69 59% 29% 4% 7% 55%
BRIC 5349 100 72% 19% 9% 1% 63%
Brazil 1974 6.49 70% 18% 11% 1% 59%
Russian Federation 1000 5.62 56% 33% 5% 6% 51%
India 1225 37.01 61% 19% 19% 0% 42%
China 1150 50.87 81% 17% 2% 80%
G-20 20733 100 69% 21% 9% 1% 60%
United States 1001 7.83 62% 24% 14% 1% 48%
Canada 1001 0.93 62% 25% 12% 1% 50%
Germany 1006 2.25 61% 24% 15% 0% 46%
France 1007 1.63 49% 45% 6% 0% 42%
United Kingdom 1004 1.65 60% 27% 13% 1% 47%
Italy 995 1.62 45% 47% 7% 0% 38%
Japan 1161 3.42 59% 29% 4% 7% 55%
Argentina 978 0.96 77% 18% 5% 0% 72%
Korea 1500 1.36 49% 42% 9% 0% 39%
Turkey 1013 1.71 46% 37% 16% 0% 30%
Australia 1253 0.58 58% 27% 14% 1% 44%

China 1150 34.37 81% 17% 2% 0% 80%
India 1225 25 61% 19% 19% 0% 42%
Russian Federation 1000 3.8 56% 33% 5% 6% 51%
Brazil 1974 4.38 70% 18% 11% 1% 59%
South Africa 1645 1.03 56% 23% 19% 2% 37%
Indonesia 1005 5.09 79% 17% 1% 3% 77%
Mexico 815 2.38 76% 19% 4% 72%
T3 Classification 66541 100 68% 22% 9% 1% 59%
Tier # 1 (Original G7 + EU Europe)
24520 20.1 58% 29% 11% 2% 48%
Tier # 2 (G20 excluding G7+ EU Europe)
13558 65.62 71% 19% 9% 1% 62%
Tier (All other countries) 28463 14.28 69% 20% 10% 0% 60%
East Asia & Oceania: Australia, China, Fiji, Hong Kong, Indonesia, Japan, Korea, Rep (South), Mongolia, Papua New Guinea, Philippines, Thailand and Vietnam.
Eastern Europe: Albania, Armenia, Azerbaijan, Bosnia and Herzegovina, Kosovo, Macedonia, Russian
Federation, Serbia and Ukraine.
EU Europe: Austria, Belgium, Bulgaria, Czech Republic, Denmark, Estonia, Finland, France, Germany,
Greece, Iceland, Ireland, Italy, Latvia, Lithuania, Norway, Poland, Portugal, Romania, Slovenia, Spain,
Sweden and United Kingdom.
Latin America: Argentina, Brazil, Ecuador, Mexico, Panama, Paraguay and Peru.
MENA: Iraq and Lebanon.
North America: Canada and United States.
Sub-Saharan Africa: Congo, Ghana, Ivory Coast, Nigeria and South Africa.
West & South Asia: Afghanistan, Bangladesh, India, Israel, Pakistan and Turkey.
Optimists: 2017 will be better Pessimists: 2017 will be worse *Neutrals:2017 will remain the same ** ROUNDING OFF OF DECIMALS: There may be a slight difference of 1% in some instances. Exact
figures are available elsewhere. ***United Kingdom has been considered part of EU Europe for the purpose of this press release. Weighted according to Adult Population 18+
SOURCE: WIN/Gallup International Annual Global Poll/ EOY, December 2016

Table # 3.3: HAPPINESS INDEX 2017 ( Demographics Wise)
Q3. In general, do you personally feel very happy,
happy, neither happy nor unhappy, unhappy, or very unhappy about your life?
Net Happines
s
Un
weig
hte
d
Co
un
t
Co
l%
Ha
pp
y
Ne
utr
al*
Un
ha
pp
y
DK
/NR
Net Scope of
Happy Over
Unhappy Row% Row% Row% Row%
Gender 66541 100.00% 68% 22% 9% 1% 59%
D1. Gender
Male 33995 49.86% 67% 22% 10% 1% 57%
Female 32546 50.14% 69% 21% 9% 1% 60%
Age 66541 100.00% 68% 22% 9% 1% 59%
D2A. Age.
Under 34 25522 44.01% 70% 20% 10% 0% 60%
35 - 54 24758 36.77% 69% 22% 9% 0% 60%
55+ 16261 19.22% 65% 25% 9% 1% 56%
Monthly Household Income 66541 100.00% 68% 22% 9% 1% 59%
D3. Income
Low (Bottom quintile/20%)
10837 11.56% 52% 27% 19% 2% 33%
Medium low (Second quintile/20%)
13238 17.98% 61% 23% 16% 0% 45%
Medium (Third quintile/20%)
15376 19.31% 67% 23% 10% 0% 57%
Medium high (Fourth quintile/20%)
10682 26.97% 77% 19% 4% 0% 73%
High (Top quintile/20%)
7960 18.32% 78% 18% 3% 1% 75%
Refused/Do not know/no answer
8448 5.85% 58% 25% 14% 3% 44%
Education 66541 100.00% 68% 22% 9% 1% 59%
D4. Education: Highest attained
No education/only basic education
4205 3.03% 56% 20% 23% 1% 33%
Completed primary 8239 6.93% 63% 26% 10% 1% 53%
Completed secondary school
28986 39.30% 67% 21% 10% 2% 57%
Completed High level education (University)
18353 42.25% 71% 21% 7% 1% 64%

Completed Higher level of education (Masters, PHD, etc.)
6049 8.22% 70% 23% 7% 0% 63%
Refused/DNK/DNA 709 0.26% 39% 41% 11% 9% 28%
Happy: Happy+ Very Happy Unhappy: Unhappy + Very Unhappy *Neutral: Neither happy nor unhappy ** ROUNDING OFF OF DECIMALS: There may be a slight difference of 1% in some instances. Exact figures are available elsewhere.
Weighted according to Adult Population 18+ SOURCE: WIN/Gallup International Annual Global Poll/ EOY, December 2016

Methodology Sheet
Country Company Name Methodology Sample Coverage Field Dates
1 AFGHANISTAN ACSOR-Surveys Face to Face 2787 National November 04 – 12, 2016
2 ALBANIA Be Research LLC Face to Face 1035 National November 05 - 14, 2016
3 ARGENTINA
Voices! Research & Consultancy
Face to Face 978 National October 20 - November 1,
2016
4 ARMENIA
MPG LLC (Marketing Professional Group)
Face to Face 1104 National November 02 - 16, 2016
5 AUSTRALIA Colmar Brunton Online 1253 National December 05 - 08, 2016
6 AUSTRIA
Österreichisches Gallup Institut
Online 968 National November 14 - 15, 2016
7 AZERBAIJAN
SIAR Research and Consulting Group
CATI 507 National November 09 - December
04, 2016
8 BANGLADESH
SRGB (SRG Bangladesh Limited)
CATI 1000 National November 10 - 30, 2016
9 BELGIUM iVOX Online 1000 National
November 28 - December 4, 2016
10 BOSNIA & HERZEGOVINA
Mareco Index Bosnia CATI 1000 National November 07 - 27, 2016
11 BRAZIL IBOPE Inteligência Face to Face 1974 National November 10 - 14, 2016
12 BULGARIA
Gallup International / TNS BBSS
Face to Face 820 National November 24 - 30, 2016
13 CANADA Leger Online 1001 National November 02 - 16, 2016
14 CHINA WisdomAsia Online 1150 Urban November 5 - 14, 2016
15 COLOMBIA
CENTRO NACIONAL DE CONSULTORIA (CNC)
CATI 1032 National November 10 - 23, 2016
16 CONGO Target Face to Face 1000 National November 01 - 15, 2016
17 CZECH REPUBLIC MARECO Ltd. Praha Face to Face 1000 National
October 17 - November 7, 2016
18 DENMARK DMA/Research Online 1002 National November 18 - 28, 2016
19 ECUADOR CEDATOS Face to Face 733 National November 08 - 15 2016
20 ESTONIA Baltmi Estonia ltd Online 483 National November 21 - 28, 2016
21 FIJI Tebbutt Research CATI 512 National December 17 - 21, 2016
22 FINLAND Taloustutkimus Oy Online 1005 National October - November, 2016
23 FRANCE BVA Online 1007 National November 25 - 30, 2016
24 GERMANY Produkt + Markt Online 1006 National
November 27 - December 5, 2016
25 GHANA Positive Insights Face to Face 969 National November 15 - 24, 2016
26 GREECE Alternative Research Solutions Online 1004 National November, 2016
27 HONG KONG CSG (Consumer Search Group) Online 496 Urban
October 24 - November 4, 2016
28 ICELAND Gallup Iceland Online 1065 National
October 19 – November 02, 2016

29 INDIA*
DataPrompt International
See note below regarding TEAM C VOTER’s support on this poll
CATI 1225 National December 01 - 06, 2016
30 INDONESIA Deka Face to Face 1005 Urban October 19 - 30, 2016
31 IRAN EMRC CATI 684 Urban November, 2016
32 IRAQ IIACSS CATI 1000 Urban
November 15 - December 11, 2016
33 IRELAND Red C Research and Marketing Online 1005 National November 03 - 08, 2016
34 ISRAEL
Palestinian Center for Public Opinion (PCPO)
CATI 366 National November 22 - 29, 2016
35 ITALY DOXA Face to Face 995 National November 21 - 29, 2016
36 IVORY COAST
EMC – Etudes de marche et conseils
Face to Face 1000 National November 14 - 27, 2016
37 JAPAN NRC (Nippon Research Center) Face to Face 1161 National November 02- 14, 2016
38 KOREA Gallup Korea Face to Face 1500 National November, 2016
39 KOSOVO Index Kosova Face to Face 1031 National November 23 - 29, 2016
40 LATVIA SKDS Online 1001 National November 21 - 26, 2016
41 LEBANON REACH CATI 1000 National November 03 - 25, 2016
42 LITHUANIA BALTMI Ltd Online 475 National November 18 - 25, 2016
43 MACEDONIA BRIMA Face to Face 1202 National
November 25 - December 1, 2016
44 MEXICO BRAIN F2F / TAPI 815 National
October 28 - November 12, 2016
45 MONGOLIA MMCG CATI 1021 National
November 21 – December 1, 2016
46 NIGERIA Market Trends International Online 809 National November 09 - 19, 2016
47 NORWAY Faktum Markedsanalyse As
CATI / F2F / Online
970 National November 02 - 23, 2016
48 PAKISTAN Gallup Pakistan Face to Face 2000 National
October 24 - November 20, 2016
49 PALESTINIAN TERRITORIES (WEST BANK & GAZA)
Palestinian Center for Public Opinion (PCPO)
Face to Face 502 National November 29 - December
20, 2016
50 PANAMA Dichter & Neira Face to Face 1200 National November 17 - 20, 2016
51 PAPUA NEW GUINEA
Tebbutt Research CATI 1044 National October 20 - 30, 2016
52 PARAGUAY
INSTITUTO DE COMUNICACION Y ARTE - ICA
F2F/CATI 844 National November 07 - 22, 2016
53 PERU DATUM Internacional Face to Face 1000 National
November 25 - December 05, 2016
54 PHILIPPINES
PSRC (Philippines Survey & Research Center Inc.)
Face to Face 1000 National November 04 - 23, 2016
55 POLAND MARECO POLSKA Face to Face 1014 National
October 28 - November 14, 2016
56 PORTUGAL Marktest Online 1007 National November 14 - 21, 2016

57 ROMANIA TNS CSOP CATI 466 National November, 2016
58 RUSSIA Romir Face to Face 1000 Urban November 14 - 21, 2016
59 SERBIA TNS Medium Gallup Face to Face 1003 National October 22 -31, 2016
60 SLOVENIA Mediana Online 1013 National November 16 - 18, 2016
61 SOUTH AFRICA Freshly Ground Insights (FGI) Online 1645 National
October 25 - November 03, 2016
62 SPAIN Instituto DYM Online 1013 National
October 28 - November 07, 2016
63 SWEDEN CMA Research Online 1034 National November 11 - 24, 2016
64 THAILAND Infosearch co.ltd CATI 600 National November 7 - 27, 2016
65 TURKEY Barem CATI 1013 National
October 25 - November 22, 2016
66 UK
ORB International (Opinion Research Business)
Online 1004 National November, 2016
67 UKRAINE Romir Ukraine Online 500 Urban November 14 - 21, 2016
68 USA Leger USA Online 1001 National November 02 -15, 2016
69 VIETNAM Indochina Research Face to Face 700 Urban
October 20 - November 15, 2016

NOTES:
1. INDIA*: We are grateful to our Friendly Company in India, TEAM C VOTER for their support on this poll. (Contact Details: Yashwant Deshmukh Email ID: [email protected] )
2. GLOBAL AND REGIONAL WEIGHTS USED TO PRODUCE AVERAGES: Whenever any data refers to Global or Regional average, the average was computed by weighting the national samples included in the group, population proportionate to size (pps), according to the share of each country in the adult, age18+ population.
As mentioned in point 2 of the methodology note of the press release, the findings in this press release are based on only age 18+ cases, cases under age 18 have been dropped. 579 (un-weighted) cases from 16 countries have been dropped. For those who wish to see the tables that contain cases under 18 and that have not been weighted for global population, these are available by the title of ‘Global Tabs’ on the website.

Disclaimer: Gallup International Association or its members are not related to Gallup Inc., headquartered in
Washington D.C. which is no longer a member of Gallup International Association. Gallup International
Association does not accept responsibility for opinion polling other than its own. We require that our
surveys be credited fully as Gallup International (not Gallup or Gallup Poll). For further details see website:
www.wingia.com
In no event shall WIN Gallup International Association, its Member Companies, or its agents or officers be liable for any
damages whatsoever (including, without limitation, damages for loss of profits, business interruption) arising out of the use of or
inability to use the materials. As a user of this report, you acknowledge and agree that any reliance upon, or use of any
information made available through this report shall be entirely at your own risk. Subject to any implied terms which cannot be
excluded by law, WIN Gallup International Association and its related entities (including any directors, officers, employees and
agents) shall not be liable for any loss or damage, whether direct or indirect, and however caused, to any person arising from
the use of (or reliance upon) information provided on and made available through this report.


