41
Oregon Reading First (201 0) 1 Winter 2010 Data Based Planning for Instructional Focus Groups
| Date post: | 31-Dec-2015 |
| Category: |
Documents |
| Upload: | socrates-flavian |
| View: | 27 times |
| Download: | 0 times |

Oregon Reading First (2010) 1
Winter 2010 Data Based Planning for Instructional Focus
Groups
Winter 2010 Data Based Planning for Instructional Focus
Groups
Oregon Reading First (2010) 2
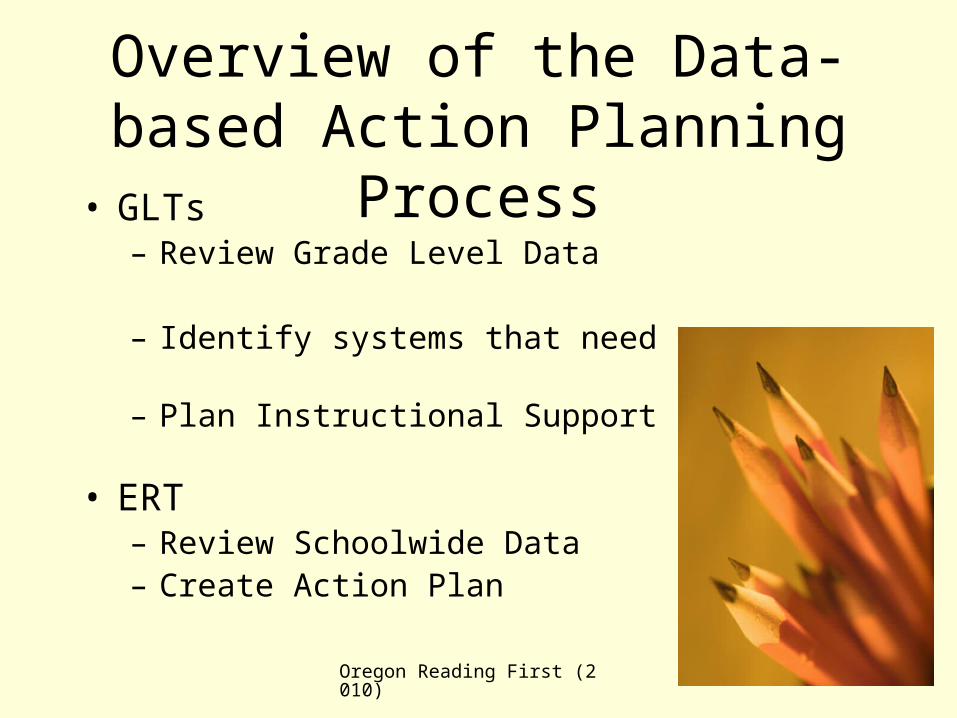
Overview of the Data-based Action Planning Process
• GLTs– Review Grade Level Data
– Identify systems that need support
– Plan Instructional Support
• ERT– Review Schoolwide Data– Create Action Plan

Oregon Reading First (2010) 3
Data-based Action Planning GLT Meetings

Oregon Reading First (2010) 4
DBAP GLT Meeting Logistics
Preparing in Advance:– Coach can fill in grade level data in advance for
Tables 1 and 2 or the team could work on this together
– Gather Participant Materials (see attached List)

Oregon Reading First (2010) 5
GLT AgendaJanuary GLT Agenda : _ Briefly review Meeting Norms _ Select a recorder to fill out the Data Team Minutes during the meeting _ Review grade -level actions on the 2008 -2009 School Action Plan and report on progress _ Review Winter DIBELS benchmark data
1. Review studen t scores and aimline progress. Set goals and draw aimlines for newly introduced measures (e.g., NWF in kindergarten, ORF in first grade).
2. Analyze error patterns and/or word reading strategies from individual DIBELS booklets for each group (e.g., NWF Gener al Performance Pattern Table; ORF General Performance Pattern Table).
3. Review Outcomes (Table 1) for K -6 students during winter of last year and compare to winter of this year.
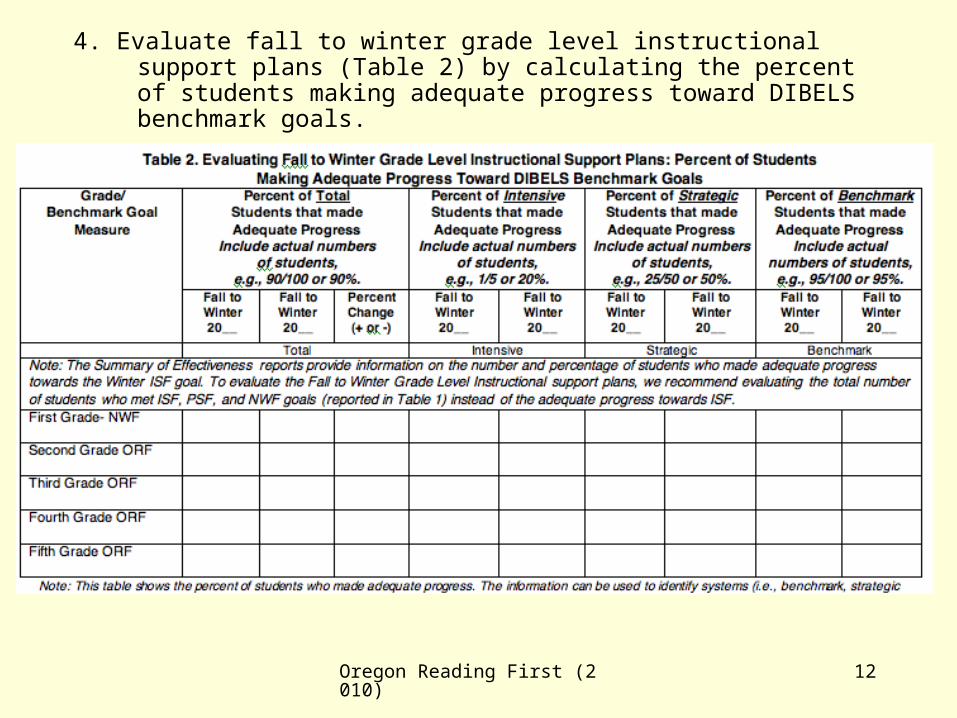
4. Evaluate fall to winter grade level instructional support plans (Table 2) by cal culating the percent of students making adequate progress toward DIBELS benchmark goals.
_ Move DIBELS data cards on the Wall Chart according to the Winter DIBELS Benchmark data and Assessment Plan Criteria.
_ Review group In -Program Assessment Plan data (as l isted on each Focus Group plan). o Did the students in the group meet the in -program assessment mastery criteria? If not, create a
plan for reteaching/retesting: ___________________________________________________ _________________________________________ __________________________________ o Review group pacing schedule and lesson progress. Is the group meeting projected lesson
pacing progress? If not, create an action to address the pacing concern: _________________ ______________________________________ _____________________________________

Oregon Reading First (2010) 6
Review grade-level actions on the 2008-2009 School Action Plan. Report on Progress (due February 27th)
Schoolwide Action Plan
Schoolwide Element
Indicate Schoolwide or Specific Grade
and Group
Action to Be Taken (be specific enough so that it is possible to determine
when the action has been implemented)
Person Responsible
Report on Progress of
Implement ation 1 Assessment K-2 Phonics screeners, DIBELS, and other pertinent
assessments will be given in September so groups can be formed and reading instruction can begin during the first full week of school.
Classroom Teachers, Reading Coach, Title 1 -A Staff
All phonics screeners were given in September and instruction started.
2 Professional Development
K-2 A (2 hour) Houghton Mifflin assessment and material refresher will be scheduled with Carol Dissen.
Principal/Reading Coach
Completed the second week of September.
3 Professional Development
K-2 A refresher session for all intervention programs and enhancements (Templates, ERI, Horizons, and Reading Mastery) will be available to all teachers and assistants.
Coach, District School Improvement Specialist, Regional Coordinator
Refreshers all completed in the fall. Peggy and Ann have modeled lessons during visits as well.
4 Professional Development
K-2 A parent involvement outline will be created to help parents understand the DIBELS measures and targets, cr eate letter name, sight word, and high frequency word flashcards and show how to help their child succeed in reading using templates.
Building Leadership Team
Family Nights were held in the fall. Parent newsletters contain helpful hints.

Oregon Reading First (2010) 7
Review DIBELS benchmark data1. Review student scores and aimline progress. Set goals and draw aimlines for
newly introduced measures (e.g. NWF in kindergarten, ORF in first grade)

Oregon Reading First (2010) 8
2. Analyze error patterns and/or word reading strategies from individual DIBELS booklets for each group (e.g. NWF General Performance Pattern Table; ORF General Performance Pattern Table)

Oregon Reading First (2010) 9
3. Review Outcomes (Table 1) for K-5 students during winter of last year and compare to winter of this year.

Oregon Reading First (2010) 10
A B C D E F G
Grade/Measure Percent at Established(Low Risk) Spring 20
___
Percent at Established(Low Risk)
Spring 20 ___
Percentage Point
Increase/Decrease
(+ or -)
Percent at Deficit
(At Risk)Spring 20 ___
Percent at Deficit
(At Risk)Spring 20 ___
Percentage Point
Increase/Decrease
(+ or -)
Kindergarten- PSF
Kindergarten- NWF
First Grade- ORF
Second Grade ORF
Third Grade ORF 31% 39% +8% 51% 36% -15%Fourth Grade ORF
Fifth Grade ORF
The percent of students at low risk has increased. That’s good! However, only about 40% of our studentsare meeting the goal, so we have room to improve.
The percent of studentsat risk has decreased, so that is good. We still have 36% of students at-risk…that’s more than one third of the students.We think we can do better!

Oregon Reading First (2010) 11
CAUTION!Remember that our BOTTOM LINE consideration is the percent
of students that are reaching benchmark. Sometimes schools that are in the upper quartile of the adequate progress range still have room for improvement in the number of students they are supporting to achieve the
benchmark!
Oregon Reading First (2010) 12
4. Evaluate fall to winter grade level instructional support plans (Table 2) by calculating the percent of students making adequate progress toward DIBELS benchmark goals.

Oregon Reading First (2010) 13
Grade/Benchmark Goal Measure
Percent of Total Students that Made Adequate Progress
Include actual numbers of students,
e.g., 90/100 or 90%.
Percent of Intensive Students that made Adequate Progress
Include actual numbers of students,
e.g., 1/5 or 20%.
Percent of Strategic Students that made Adequate Progress
Include actual numbers of students,
e.g., 25/50 or 50%.
Percent of Benchmark Students that made Adequate Progress
Include actual numbers of students,
e.g., 95/100 or 95%.
Winter to Spring20__
Winter to Spring20__
Percent Change(+ or -)
Winter to Spring20__
Winter to Spring20__
Winter to Spring20__
Winter to Spring20__
Winter to Spring20__
Winter to Spring20__
Total Intensive Strategic Benchmark
Kindergarten- PSF
First Grade- ORF
Second Grade ORF
40% 43% +3% 0% 0/45
0%
0/23
25% 5/19
23% 5/20
90% 17/19
90% 20/22
Third Grade ORF
Fourth Grade ORF
Fifth Grade ORF
Table 2. Evaluating Winter to Spring Grade Level Instructional Support Plans: Percent of StudentsMaking Adequate Progress Toward DIBELS Benchmark Goals
Note: This table shows the percent of students who made adequate progress. The information can be used to identify systems (i.e., benchmark, strategic and/or intensive) that are healthy or that need moderate to substantial changes. Use caution when
interpreting percentages for systems that only have a few students.
Oregon Reading First (2010) 14
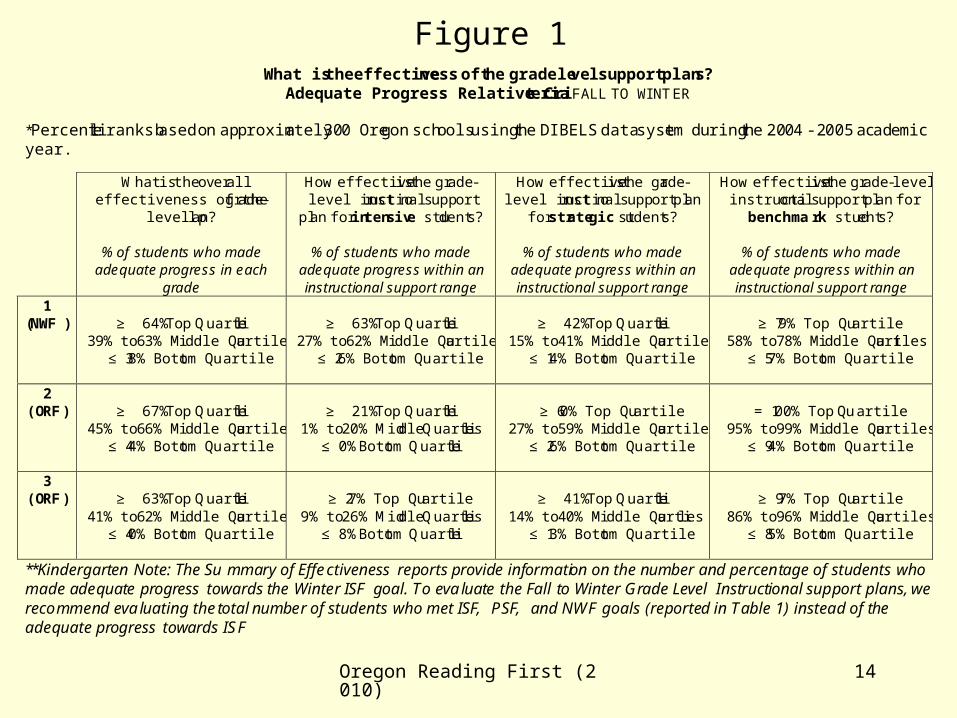
Figure 1What is the effectiveness of the grade level support plans?
Adequate Progress Relative Criteria FALL TO WINTER
*Percentile ranks based on approximately 300 Oregon schools using the DIBELS data system during the 2004 - 2005 academic year.
**Kindergarten Note: The Summary of Effectiveness reports provide information on the number and percentage of students who made adequate progress towards the Winter ISF goal. To evaluate the Fall to Winter Grade Level Instructional support plans, we recommend evaluating the total number of students who met ISF, PSF, and NWF goals (reported in Table 1) instead of the adequate progress towards ISF
What is the overall effectiveness of the grade-
level plan?
% of students who made adequate progress in each
grade
How effective is the grade-level instructional support
plan for intensive students?
% of students who made adequate progress within an instructional support range
How effective is the grade-level instructional support plan
for strategic students?
% of students who made adequate progress within an instructional support range
How effective is the grade-level instructional support plan for
benchmark students?
% of students who made adequate progress within an instructional support range
1 (NWF)
≥ 64% Top Quartile
39% to 63% Middle Quartiles ≤ 38% Bottom Quartile
≥ 63% Top Quartile
27% to 62% Middle Quartiles ≤ 26% Bottom Quartile
≥ 42% Top Quartile
15% to 41% Middle Quartiles ≤ 14% Bottom Quartile
≥ 79% Top Quartile
58% to 78% Middle Quartiles ≤ 57% Bottom Quartile
2 (ORF)
≥ 67% Top Quartile
45% to 66% Middle Quartiles ≤ 44% Bottom Quartile
≥ 21% Top Quartile
1% to 20% Middle Quartiles ≤ 0% Bottom Quartile
≥ 60% Top Quartile
27% to 59% Middle Quartiles ≤ 26% Bottom Quartile
= 100% Top Quartile
95% to 99% Middle Quartiles ≤ 94% Bottom Quartile
3 (ORF)
≥ 63% Top Quartile
41% to 62% Middle Quartiles ≤ 40% Bottom Quartile
≥ 27% Top Quartile
9% to 26% Middle Quartiles ≤ 8% Bottom Quartile
≥ 41% Top Quartile
14% to 40% Middle Quartiles ≤ 13% Bottom Quartile
≥ 97% Top Quartile
86% to 96% Middle Quartiles ≤ 85% Bottom Quartile

Oregon Reading First (2010) 15
Grade/Benchmark Goal Measure
Percent of Total Students that Made Adequate Progress
Include actual numbers of students,
e.g., 90/100 or 90%.
Percent of Intensive Students that made Adequate Progress
Include actual numbers of students,
e.g., 1/5 or 20%.
Percent of Strategic Students that made Adequate Progress
Include actual numbers of students,
e.g., 25/50 or 50%.
Percent of Benchmark Students that made Adequate Progress
Include actual numbers of students,
e.g., 95/100 or 95%.
Winter to Spring20__
Winter to Spring20__
Percent Change(+ or -)
Winter to Spring20__
Winter to Spring20__
Winter to Spring20__
Winter to Spring20__
Winter to Spring20__
Winter to Spring20__
Total Intensive Strategic Benchmark
Kindergarten- PSF
First Grade- ORF
Second Grade ORF
40% 43% +3% 0% 0/45
0%
0/23
25% 5/19
23% 5/20
90% 17/19
90% 20/22
Third Grade ORF
Fourth Grade ORF
Fifth Grade ORF
Table 2. Evaluating Winter to Spring Grade Level Instructional Support Plans: Percent of StudentsMaking Adequate Progress Toward DIBELS Benchmark Goals
Note: This table shows the percent of students who made adequate progress. The information can be used to identify systems (i.e., benchmark, strategic, or intensive) that are healthy or that need changes. Use caution when interpreting percentages for systems that only have a few students. For example, 90% of 5 students and 90% of 30 students should lead to different interpretations.

Oregon Reading First (2010) 16
Grade/Benchmark Goal Measure
Percent of Total Students that Made Adequate Progress
Include actual numbers of students,
e.g., 90/100 or 90%.
Percent of Intensive Students that made Adequate Progress
Include actual numbers of students,
e.g., 1/5 or 20%.
Percent of Strategic Students that made Adequate Progress
Include actual numbers of students,
e.g., 25/50 or 50%.
Percent of Benchmark Students that made Adequate Progress
Include actual numbers of students,
e.g., 95/100 or 95%.
Winter to Spring20__
Winter to Spring20__
Percent Change(+ or -)
Winter to Spring20__
Winter to Spring20__
Winter to Spring20__
Winter to Spring20__
Winter to Spring20__
Winter to Spring20__
Total Intensive Strategic Benchmark
Kindergarten- PSF
First Grade- ORF
Second Grade ORF
40% 43% +3% 0% 0/45
0%
0/23
25% 5/19
23% 5/20
90% 17/19
90% 20/22
Third Grade ORF
Fourth Grade ORF
Fifth Grade ORF
Note: This table shows the percent of students who made adequate progress. The information can be used to identify systems (i.e., benchmark, strategic, or intensive) that are healthy or that need changes. Use caution when interpreting percentages for systems that only have a few students. For example, 90% of 5 students and 90% of 30 students should lead to different interpretations.
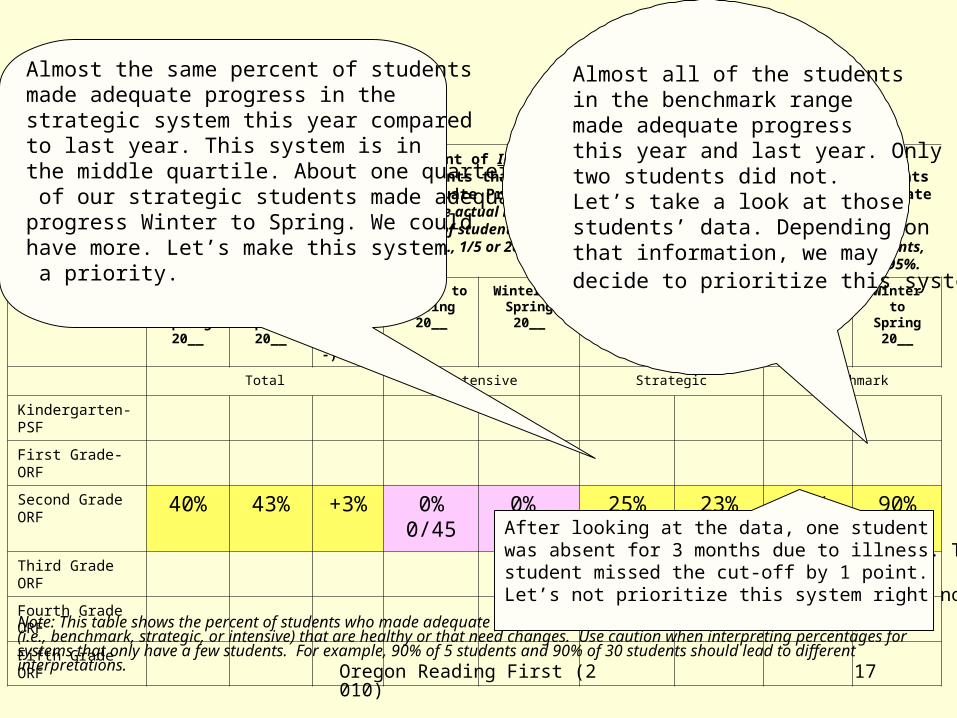
None of the studentsin the intensive range moved to some risk or low risk on the benchmarkgoal. This system was in The bottom quartile. We have fewer students in the intensive range (23 vs. 45)but this is a systemthat needs support.
Let’s make this a priority.
Overall we increased the percent of students who made adequate progress a little bit. The total for the grade level is in the middlequartiles compared to other schoolsin the state using DIBELS. Our challenge is that less than half of our students making adequate progress. How can we make changes to improve the system next year. Let’s look at the systems within the gradeto see where we should prioritize.
Oregon Reading First (2010) 17
Grade/Benchmark Goal Measure
Percent of Total Students that Made Adequate Progress
Include actual numbers of students,
e.g., 90/100 or 90%.
Percent of Intensive Students that made Adequate Progress
Include actual numbers of students,
e.g., 1/5 or 20%.
Percent of Strategic Students that made Adequate Progress
Include actual numbers of students,
e.g., 25/50 or 50%.
Percent of Benchmark Students that made Adequate Progress
Include actual numbers of students,
e.g., 95/100 or 95%.
Winter to Spring20__
Winter to Spring20__
Percent Change(+ or -)
Winter to Spring20__
Winter to Spring20__
Winter to Spring20__
Winter to Spring20__
Winter to Spring20__
Winter to Spring20__
Total Intensive Strategic Benchmark
Kindergarten- PSF
First Grade- ORF
Second Grade ORF
40% 43% +3% 0% 0/45
0%
0/23
25% 5/19
23% 5/20
90% 17/19
90% 20/22
Third Grade ORF
Fourth Grade ORF
Fifth Grade ORF
Note: This table shows the percent of students who made adequate progress. The information can be used to identify systems (i.e., benchmark, strategic, or intensive) that are healthy or that need changes. Use caution when interpreting percentages for systems that only have a few students. For example, 90% of 5 students and 90% of 30 students should lead to different interpretations.
Almost the same percent of studentsmade adequate progress in the strategic system this year comparedto last year. This system is in the middle quartile. About one quarter of our strategic students made adequate progress Winter to Spring. We couldhave more. Let’s make this system a priority.
Almost all of the studentsin the benchmark range made adequate progressthis year and last year. Only two students did not. Let’s take a look at those students’ data. Depending on that information, we may decide to prioritize this system.
After looking at the data, one student was absent for 3 months due to illness. The other student missed the cut-off by 1 point.Let’s not prioritize this system right now.

Oregon Reading First (2010) 18
Move DIBELS data cards on the Wall Chart according to Winter DIBELS benchmark goals Table

Oregon Reading First (2010) 19

Oregon Reading First (2010) 20
Review group in-program assessment data
1. Did the students in the group meet the in-program assessment mastery criteria? If yes, everyone give a yahoo! If no, create a plan for reteaching/retesting.
2. Review Group pacing schedule and lesson progress. Is the group meeting projected lesson pacing progress? If yes, everyone give a cowboy cheer. If no, create plan for an action to address pacing concern.

Oregon Reading First (2010) 21
Regroup Students as necessary and document on Focus Group plan
Oregon Reading First (2010) 22
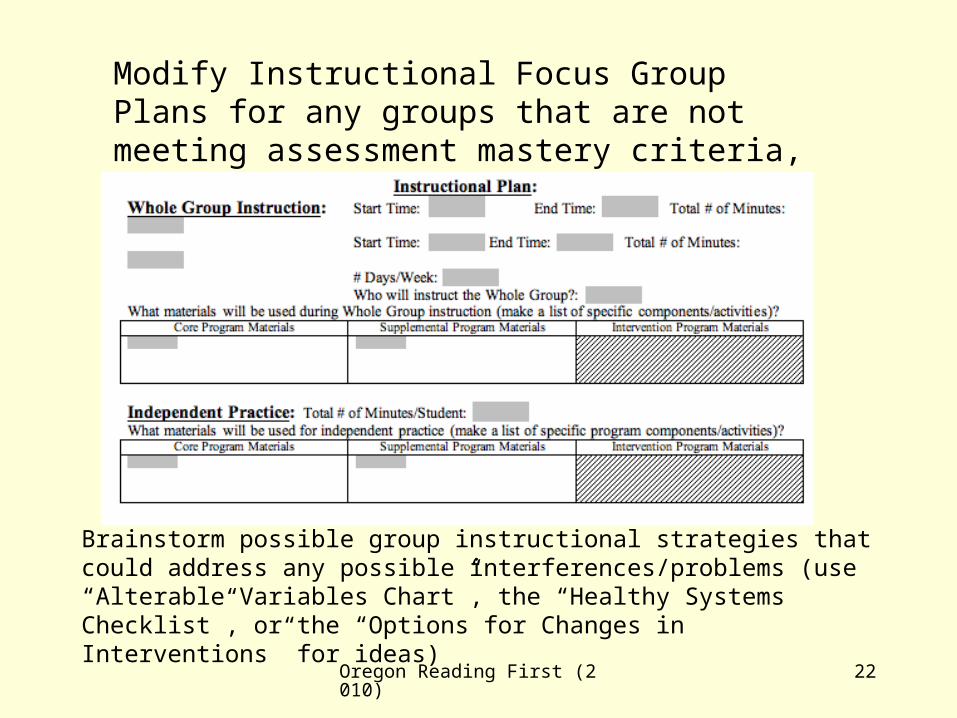
Modify Instructional Focus Group Plans for any groups that are not meeting assessment mastery criteria, and/or are not meeting projected lesson pacing progress.
Brainstorm possible group instructional strategies that could address any possible interferences/problems (use “Alterable Variables Chart”, the “Healthy Systems Checklist”, or the “Options for Changes in Interventions” for ideas)

Oregon Reading First (2010) 23
Discuss and Problem Solve any individual student concerns.
1. Compare students’ instructional recommendations from fall to winter.
2. Are there students who fell from benchmark to strategic, or strategic to intensive? These students will likely need more intensive instruction. You may need to administer the Phonics Screener to benchmark students who fell back to strategic.
3. Consider which intervention programs might be appropriate for strategic students who fell back to intensive and give the intervention program placement tests.

Oregon Reading First (2010) 24
Identify any new grade level actions that will address any identified areas of
concern …
Determine what future professional development and coaching support is needed …

Oregon Reading First (2010) 25
Data-based Action Planning ERT Meeting
Oregon Reading First (2010) 26
Purpose of the ERT Meeting
– Review Schoolwide Data
– Review the GLTs’ Suggested Actions
– Create Action Plan
– Consider RF Budget Implications

Oregon Reading First (2010) 27
ERT Meeting LogisticsPreparing in Advance
– Coach fills in grade level data in advance and can highlight Table 2 of ERT packet.
– Gather Participant Materials (see attached List)

Oregon Reading First (2010) 28
A B C D E F G
Grade/Measure Percent at Established(Low Risk)
Spring 20__
Percent at Established(Low Risk)
Spring 20__
Percentage Point Increase/
Decrease (+ or -)
Percent at Deficit
(At Risk)Spring 20__
Percent at Deficit
(At Risk)Spring 20__
Percentage Point Increase/
Decrease(+ or -)
Kindergarten- PSF
Kindergarten- NWF
First Grade- ORF
Second Grade ORF
Third Grade ORF
Fourth Grade ORF
Fifth Grade ORF
Reviewing OutcomesCoach will have completed all rows in Tables 1 and 2 in the Early Reading Team booklet (and could highlight boxes in Table 2 where appropriate) before the ERT meeting.
Step 1. Review spring reading outcomes for K-3 students. Discuss as a team: •Has the percentage of students established on each measure increased? •Has the percentage of students at deficit on each measure decreased?
Table 1 Reviewing Outcomes for K-5 Students Spring Last Year and Comparing to Spring Outcomes This Year
Note: This table shows the percent of students that met the important end of year reading goals for the purpose of reviewing outcomes.

Oregon Reading First (2010) 29
Grade/Benchmark Goal Measure
Percent of Total Students that Made Adequate Progress
Include actual numbers of students,
e.g., 90/100 or 90%.
Percent of Intensive Students that made Adequate Progress
Include actual numbers of students,
e.g., 1/5 or 20%.
Percent of Strategic Students that made Adequate Progress
Include actual numbers of students,
e.g., 25/50 or 50%.
Percent of Benchmark Students that made Adequate
ProgressInclude actual
numbers of students, e.g., 95/100 or 95%.
Winter to Spring20__
Winter to Spring20__
Percent Change(+ or -)
Winter to Spring20__
Winter to Spring20__
Winter to Spring20__
Winter to Spring20__
Winter to Spring20__
Winter to Spring20__
Total Intensive Strategic Benchmark
Kindergarten- PSF
First Grade- ORF
Second Grade ORF
Third Grade ORF
Fourth Grade ORF
Fifth Grade ORF
Evaluating SupportWhat is the effectiveness of the grade level support plans?
Step 2: Evaluate the health of the Winter to Spring support systems for grades K-3. Discuss the percentage and number of students in each grade level system that are making adequate progress.
Table 2: Evaluating Winter to Spring Instructional Support Plans: Percent of Students Making Adequate Progress Towards DIBELS Benchmark Goals
Note: This table shows the percent of students who made adequate progress. The information can be used to identify systems (i.e. benchmark, strategic, or intensive) that are healthy or that need changes. Use caution when interpreting percentages for systems that only have a few students. For example, 90% of 5 students and 90% of 30 students should lead to different interpretations.

Oregon Reading First (2010) 30
Step 3: Based on Tables 1 and 2, list the systems, across grade-level (K-3 or K-5) data, that are of highest priority.
Step 4: Review grade level teams’ identified new grade level actions.
Step 5: ERT team should consider whether any systems, other than those identified in grade level teams, are in need of support. If so, identify questions and suggested actions.
Step 6: Based on team consensus, prioritize actions that
will have a significant impact on student achievement. Use this information to revise your current action plan to include
new actions and revised current actions.

Oregon Reading First (2010) 31
How to Document Adding New Actions
Schoolwide Element
Indicate Schoolwide or Specific Grade
and Group
Action to be Taken (be specific
enough that it is possible to determine when the action has been implemented)
Person Responsible
Report on Progress
Implementation
New Action #___
Date Added: ______
New Action #___
Date Added: ______
New Action #___
Date Added: ______
New Action #___
Date Added: ______
New Action #___
Date Added: ______
School: _____________________

Oregon Reading First (2010) 32
Due Date: February 27
• School Action Plan Progress Notes and New Actions
• Winter-Spring Instructional Focus Group Plans

Oregon Reading First (2010) 33
Mini Review:How to Read a Summary Of
Effectiveness Report

Oregon Reading First (2010) 34
Summary of Effectiveness Report• Time Period, Grade Level, and Measure
• Number of students:
• Total included in the report
• Number with a Benchmark, Strategic, or Intensive in the middle of the year
• Number at each benchmark status
Middle of Kindergarten Instructional
Recommendation to End of Year Kindergarten Benchmark Status on
PSF
Intensive at Middle of Year to Strategic at Middle of Year to Benchmark at Middle of Year to Benchmark Status on PSF in End of Kindergarten (Total)
End of Year Deficit
End of Year Emerging
End of Year Established
End of Year Deficit
End of Year Emerging
End of Year Established
End of Year Deficit
End of Year Emerging
End of Year Established
Adams 7 Students Intensive at Middle of K
8.5% of Total Students
34 Students Strategic at Middle of K
41.5% of Total Students
41 Students Benchmark at Middle of K
50% of Total Students
N = 82
Count 1 3 3 0 7 27 0 3 38Deficit 1.2%% of Instructional Recommendation
14.3% 42.9% 42.9% 0% 20.6% 79.4% 0% 7.3% 92.7%Emerging 15.9%
% of Total 1.2% 3.7% 3.7% 0% 8.5% 32.9% 0% 3.7% 46.3%Established 82.9%

Oregon Reading First (2010) 35
At Risk
Intensive Strategic Benchmark
Time 1: ( e.g., Winter)
Time 2: (e.g., Spring)
1. Some Risk
2. Low Risk
At Risk
Some Risk
3. Low Risk
At Risk
Some Risk
4. Low Risk
DIBELS Summary of Effectiveness Reports4 Ways to Achieve Adequate Progress

Oregon Reading First (2010) 36
Middle of the Year Instructional Recommendation
Intensive Strategic Benchmark
Middle of Kindergarten Instructional
Recommendation to End of Year Kindergarten Benchmark Status on
PSF
Intensive at Middle of Year to Strategic at Middle of Year to Benchmark at Middle of Year to Benchmark Status on PSF in End of Kindergarten (Total)
End of Year Deficit
End of Year Emerging
End of Year Established
End of Year Deficit
End of Year Emerging
End of Year Established
End of Year Deficit
End of Year Emerging
End of Year Established
Adams 7 Students Intensive at Middle of K
8.5% of Total Students
34 Students Strategic at Middle of K
41.5% of Total Students
41 Students Benchmark at Middle of K
50% of Total Students
N = 82
Count 1 3 3 0 7 27 0 3 38Deficit 1.2%% of Instructional Recommendation
14.3% 42.9% 42.9% 0% 20.6% 79.4% 0% 7.3% 92.7%Emerging 15.9%
% of Total 1.2% 3.7% 3.7% 0% 8.5% 32.9% 0% 3.7% 46.3%Established 82.9%

Oregon Reading First (2010) 37
End of Year Benchmark Status
At Risk
1. Some Risk
2. Low Risk
At Risk
Some Risk
3. Low Risk
At Risk
Some Risk
4. Low Risk
Middle of Kindergarten Instructional
Recommendation to End of Year Kindergarten
Benchmark Status on PSF
Intensive at Middle of Year to Strategic at Middle of Year to Benchmark at Middle of Year to Benchmark Status on PSF in End of Kindergarten (Total)
End of Year Deficit
End of Year Emerging
End of Year Established
End of Year Deficit
End of Year Emerging
End of Year Established
End of Year Deficit
End of Year Emerging
End of Year Established
Adams 7 Students Intensive at Middle of K
8.5% of Total Students
34 Students Strategic at Middle of K
41.5% of Total Students
41 Students Benchmark at Middle of K
50% of Total Students
N = 82
Count 1 3 3 0 7 27 0 3 38Deficit 1.2%% of Instructional Recommendation
14.3% 42.9% 42.9% 0% 20.6% 79.4% 0% 7.3% 92.7%Emerging 15.9%
% of Total 1.2% 3.7% 3.7% 0% 8.5% 32.9% 0% 3.7% 46.3%Established 82.9%
Oregon Reading First (2010) 38
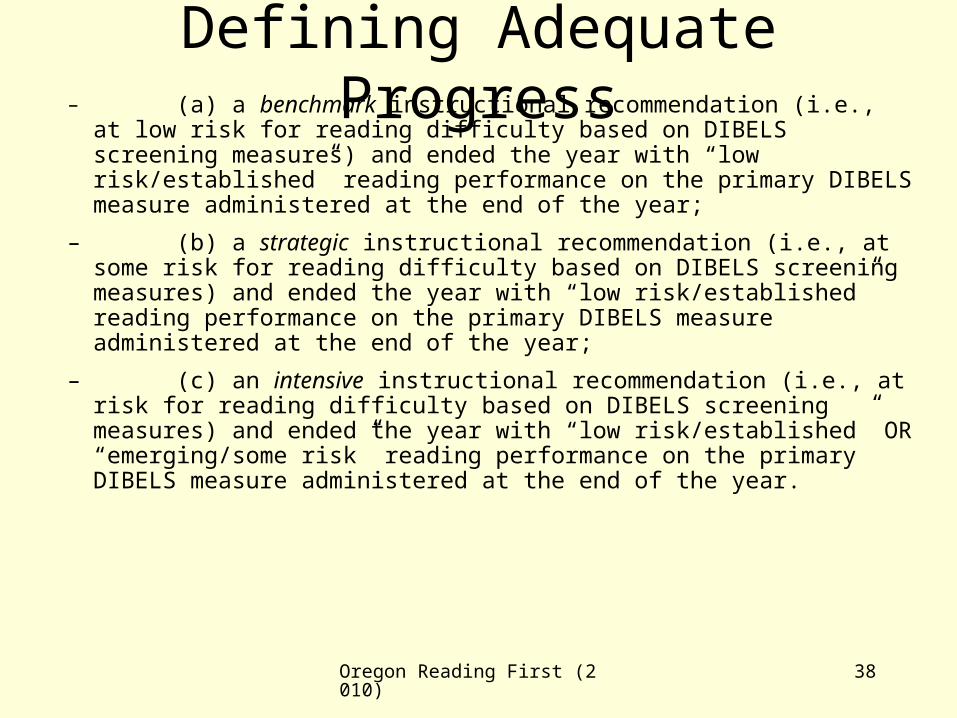
Defining Adequate Progress– (a) a benchmark instructional recommendation (i.e., at low risk for
reading difficulty based on DIBELS screening measures) and ended the year with “low risk/established” reading performance on the primary DIBELS measure administered at the end of the year;
– (b) a strategic instructional recommendation (i.e., at some risk for reading difficulty based on DIBELS screening measures) and ended the year with “low risk/established” reading performance on the primary DIBELS measure administered at the end of the year;
– (c) an intensive instructional recommendation (i.e., at risk for reading difficulty based on DIBELS screening measures) and ended the year with “low risk/established” OR “emerging/some risk” reading performance on the primary DIBELS measure administered at the end of the year.

Oregon Reading First (2010) 39
Summary of Effectiveness Report: Review
Count = Number of students
% of Instructional Recommendation = How many students within the instructional range (i.e., benchmark, strategic, intensive) made adequate progress?
% of Total = How many students made adequate progress at this grade level?
Middle of Kindergarten Instructional
Recommendation to End of Year Kindergarten
Benchmark Status on PSF
Intensive at Middle of Year to Strategic at Middle of Year to Benchmark at Middle of Year to Benchmark Status on PSF in End of Kindergarten (Total)
End of Year
Deficit
End of Year Emerging
End of Year Established
End of Year
Deficit
End of Year Emerging
End of Year Established
End of Year Deficit
End of Year Emerging
End of Year Established
Adams 7 Students Intensive at Middle of K
8.5% of Total Students
34 Students Strategic at Middle of K
41.5% of Total Students
41 Students Benchmark at Middle of K
50% of Total Students
N = 82
Count 1 3 3 0 7 27 0 3 38 Deficit 1.2%
% of Instructional Recommendation
14.3% 42.9% 42.9% 0% 20.6% 79.4% 0% 7.3% 92.7% Emerging 15.9%
% of Total 1.2% 3.7% 3.7% 0% 8.5% 32.9% 0% 3.7% 46.3% Established 82.9%

Oregon Reading First (2010) 40
Recommended PacingKindergarten:Reading Mastery 1 - Lesson 135 +ERI - all 126 lessons WITH enhancementsRead Well K Unit 15+
First Grade:Reading Mastery 2 - Lesson 168 +Horizons B - complete all lessonsRead Well 1 - complete all units

Oregon Reading First (2010) 41
Recommended PacingSecond GradeReading Mastery 3 - Lesson 120 +Horizons CD - lesson 70+
Third Grade:Reading Mastery 5 - Lesson 55 +Horizons CD - lesson 160


