No. 2 Winter 2011/12 Modelling the changing planet Improving flood predictions Earthquake research to help save lives The importance of snow Blue Marble The magazine of the UK’s National Centre for Earth Observation DATA ASSIMILATION ISSUE
Transcript
Data Assimilation issue
No. 2Winter 2011/12
Modelling the changing planet
Improving flood predictions
Earthquake research to help save lives
The importance of snow
Blue MarbleThe magazine of the UK’s National Centre for Earth Observation
Data assimilatioN issue
2
imagine an orchestra in a recording studio, with a dozen microphones disturbed
amongst the players to pick up the sound. Who would want to buy the soundtrack of each microphone, on a dozen CDs, in order to listen to a symphony? Perhaps a few experts but certainly not the majority of music lovers. What they want is a well-balanced, high-quality blend of all the individual soundtracks on a single CD.
This is what data assimilation is about: combining different measurements of a system – satellite observations of planet Earth, say, rather than recordings of an orchestra – in order to get the most accurate and useful rendition of how the system evolves. In a recording studio, to blend the soundtracks and to suppress the noise, one uses sophisticated electronic equipment. Similarly, to blend measurements of planet Earth from different satellites, one uses a sophisticated numerical model. Such a model represents the equations that govern the Earth system of interest – the atmosphere, land, ocean, cryosphere or biosphere. By doing this, we can make the best use of all our available information, taking into account any errors in the data and in the model.
Such a methodology is at the heart of modern weather forecasting and is growing rapidly in importance as a means of testing how well our models represent the real world. Articles in this issue of Blue Marble give a flavour of the widespread uses of data assimilation at NCEO.
Blue Marble is a controlled circulation magazine distributed free of charge to decision-makers in Government, science and commerce. It is produced and edited on behalf of NCEO by Boffin Media and is designed by Folio Creative.
www.boffinmedia.co.uk www.foliocreative.co.uk
3 Building the next top model How data assimilation can make a
difference to all our lives
7 let it snow The NCEO scientist going to the ends of
the Earth to study snow
10 after the flood Improving computer models of flooding
12 Revealing hidden hazards Studies of earthquakes uncover concealed
danger
14 FeatuReD iNstRumeNt
15 PRoFile
CoNteNts
3 7
10
12 14
Credit for cover image: esa
3
science journalist Richard Hollingham gets to grips with data assimilation and discovers that work conducted by NCeo has a wide
range of benefits and applications…
It’s your first time in a strange town. You’ve been at meetings all day and you need to get back to the station. You could do with the exercise, so you decide to walk. When you ask the way, you’re given a set of instructions: where to turn left or right and landmarks to look out for. When you take this information in, your brain builds up a picture of the route – a model – and you’re ready to set off.
As you travel, you notice new things: a set of traffic lights, an interesting antique shop, a dangerous hole in the pavement. The model in your mind changes – adjusting to the new information your brain is absorbing. When you reach the station, the picture in your brain is very different to the one you had when you set off. If you did the journey again, you’d have a much more accurate mental model of the route.
That’s what data assimilation is all about – combining observations with a model to arrive at the most accurate possible result and an even better model (see diagram below). The term ‘data assimilation’ itself is perhaps a little misleading; data assimilation is about much more than simply combining data to produce a result. Without data assimilation, the computer models we use to forecast the weather or predict changes in the Earth’s climate would be, to put it bluntly, pretty rubbish.
BuilDiNg tHe Next
toP moDel
Data assimilation can be used to improve models of traffic flow
Better understanding
Better forecasts
Data assimilatioN
Numerical model
Observations
More realistic model
4
Forecasting the futureOne wall of Peter Jan Van Leeuwen’s office in the Department of Meteorology at the University of Reading is covered with a long rectangular whiteboard. On it, graphs and mathematical equations fill almost every space. Data assimilation is rooted in maths but you don’t have to understand the complex algorithms to see how it can be useful.
“The technologies we develop can be used everywhere,” says Van Leeuwen, leader of the data assimilation theme at NCEO. “It can give you a better weather forecast, better traffic control on a busy road or even a better interpretation of an electrocardiogram in hospital.”
Scientists working on data assimilation are aiming for three things: improved forecasts or predictions, a better understanding of what’s going on in the system and, crucially, an improvement in the original model. And when you’ve got a better model, you can repeat the process all over again and improve the model still further.
Van Leeuwen cites a project he worked on to generate better forecasts of how the ocean in the North Atlantic changes over time. He was aiming for improved predictions of currents, temperatures, ocean salinity and the extent of seasonal sea ice. With so many parameters, in a complex ever-changing three-dimensional environment, you can imagine it was quite a challenge.
“The original numerical models – the simulations – of the ocean we were working from were really not good,” he says. “That’s typical, many ocean models are not that good. So we had these models and then observations from satellites and research ships.” By feeding these real observations into the model, running
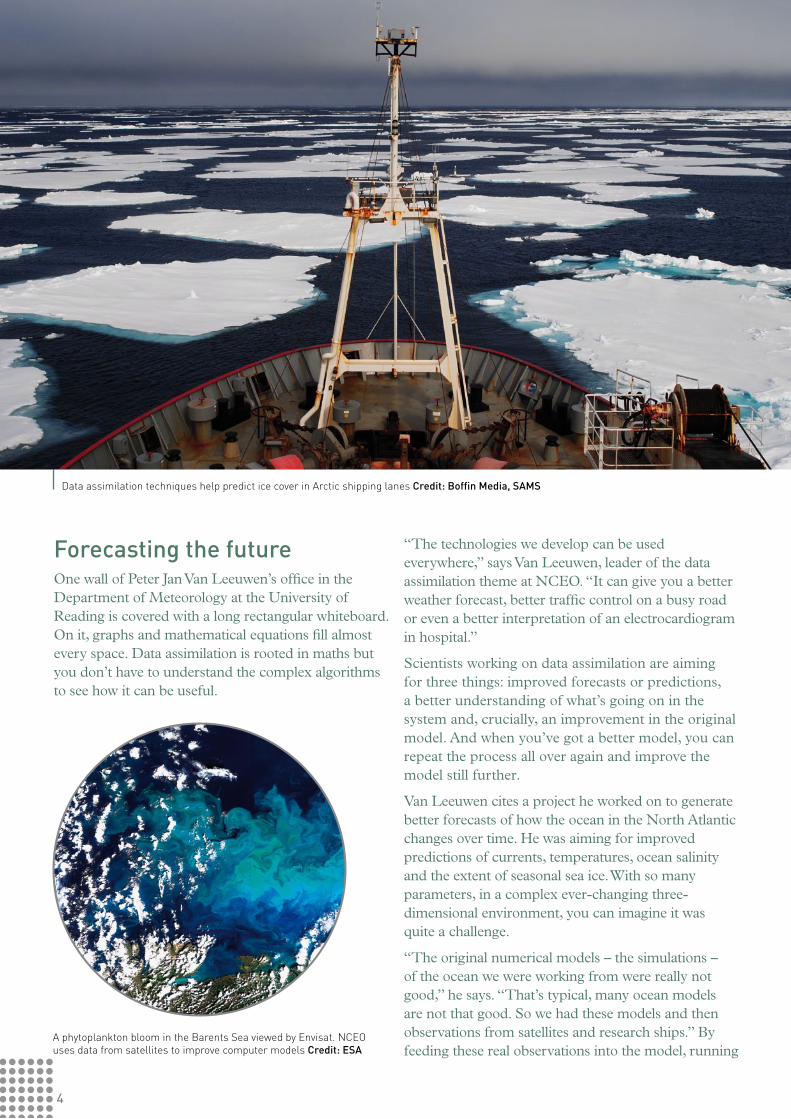
Data assimilation techniques help predict ice cover in Arctic shipping lanes Credit: Boffin media, sams
A phytoplankton bloom in the Barents Sea viewed by Envisat. NCEO uses data from satellites to improve computer models Credit: esa
the model again and adjusting it every time, they arrived at a much more accurate forecast.
In the short term, this information can be used by meteorologists and coastguards to provide more reliable forecasts to shipping operators and fishing fleets. Over a longer time scale, climatologists and oceanographers can watch for any significant changes or major shifts in ocean currents. If, for example, the warm currents which western Europe’s climate relies on appeared to be slowing down, then this would hopefully be flagged-up by the more accurate models.
Forecasting weatherProfessor of Applied Mathematics, Nancy Nichols’ office in Reading also has a large whiteboard on the wall. Some of the equations are familiar from Van Leeuwen’s board – not that I’m going to attempt to understand them. What I am trying to understand is why the maths appears to be so complex.
“There’s a famous quote in our field: we can’t forecast the weather for tomorrow, because we don’t know what it is today,” says Nichols. “There’re a huge amount of parameters you need to put into a model before you can use it for an accurate forecast. We don’t have all that information, so the idea [with data assimilation] is that we’re aiming for a full description of the system we’re looking to predict…and that comes from observations coupled with the model.”
Without data assimilation techniques, for something as ambitious as global weather forecasting, there are never going to be enough observations. It is, after all, impossible to know the state of the atmosphere at every location on Earth at any one time. Let alone how it changes every second. What weather models do have are measurements taken at particular points – you can perhaps imagine them dotted around the Earth. These points represent a whole range of different sources of information, including data from satellites, measurements from automatic ground stations or even readings from traditional rain or wind gauges. Each one of these observation points has a load of numbers, for things such as wind speed, temperature, humidity or cloud cover.
You also need to add into the mix the fact that each of these observations also has errors associated with it. Most satellites, for example, make indirect measurements – such as a reading for thermal radiation emitted from the Earth rather than temperature. All these factors need to be accounted for and the model adjusted. Without data assimilation, a small error can go a long way to making your prediction wildly inaccurate.
“There are methods for solving small problems, but the difficulty is to apply those to a really big problem,” Nichols explains. “I used to work on aircraft control and you have a system with ten variables that you have to control…with weather forecasting you’ve got ten million variables. So the question is: can
5
Data assimilation is increasingly important for weather forecasting Credit: esa
Nancy Nichols
“There’s a famous quote in our field: we can’t forecast the weather for tomorrow, because we don’t know what it is today.”
6
you take a relatively simple system and extrapolate that to another system?” For Nichols that means developing new mathematical equations, algorithms and routines. The fact that we now have increasingly accurate weather models for several days ahead suggests that this is indeed possible. And scientists at NCEO are working on several research projects, using data assimilation to improve weather forecasting. Partners include the Met Office and the European Centre for Medium range Weather Forecasting – considered two of the best forecasting centres in the world.
star trek scienceOne of Nichols’ research students, Dale Partridge, likens data assimilation to the collective species in Star Trek known as the Borg. The Borg roam the galaxy assimilating individuals into the ‘collective’ in order to improve the success of the species. It is, perhaps, a sinister analogy but it makes a lot of sense. “Like the Borg, we assimilate the data into the model,” says Partridge, who (reassuringly) looks perfectly normal.
Partridge is using data assimilation techniques to improve computer simulations of glaciers. Better understanding these complex ‘rivers’ of solid, moving ice will not only add to our knowledge of the Earth’s climate. If they melt, glaciers around countries like Greenland will have a significant effect on global sea levels. And in regions such as the Himalayas, glaciers are a major source of fresh water for tens of millions of people.
“We’re trying to improve our understanding of the way glaciers flow,” Partridge says. “We’re developing new modelling techniques to get a better global representation of glaciers in our climate models.”
Peter Jan Van Leeuwen is keen to apply the expertise nurtured at NCEO to a wider range of problems. NCEO already runs courses in data assimilation for other organisations and is developing short courses for industry. “We can provide the techniques of data assimilation and suggest how you could use those techniques,” he explains. “We are involved in improving its use in industrial production process control and in oil exploration and hydrology for better models of underground reservoirs.”
Through NCEO, Van Leeuwen is currently working with the Indian space industry to help it use Earth observation data from satellites. Without data assimilation, satellite measurements just provide a snapshot of the atmosphere or ground beneath. With
data assimilation and modelling techniques, those measurements become increasingly useful.
So what difference does data assimilation make to our lives? “Well for a start,” says Van Leeuwen, “without it, the weather forecast would be very inaccurate and we rely on the forecast for so much.” And, he says, one of the most promising areas is at sea: “we can apply it to oceanography for modelling coastal pollution and fisheries, energy from waves or ship routing.”
Then there’s a whole range of other uses, from improved flood prediction to even helping you maintain your mobile signal as you walk through a busy city. Data assimilation systems are applied to help route your phone signal to different masts as you move, so your call doesn’t get dropped.
“Data assimilation is a systematic tool to solve complex problems,” says Van Leeuwen. “We have the expertise here at NCEO to benefit the wider economy.” From weather forecasting to climate, data assimilation can be used to help understand some of the world’s most complex systems. Perhaps it could even, jokes Van Leeuwen, solve one of the most intractable problems known to man: traffic jams on the M25. “If you look at the way traffic control is done on the M25 nowadays, it’s really primitive. We could do much, much better!”
Weather satellites make many indirect measurements and observations that are interpreted using data assimilation Credit: esa
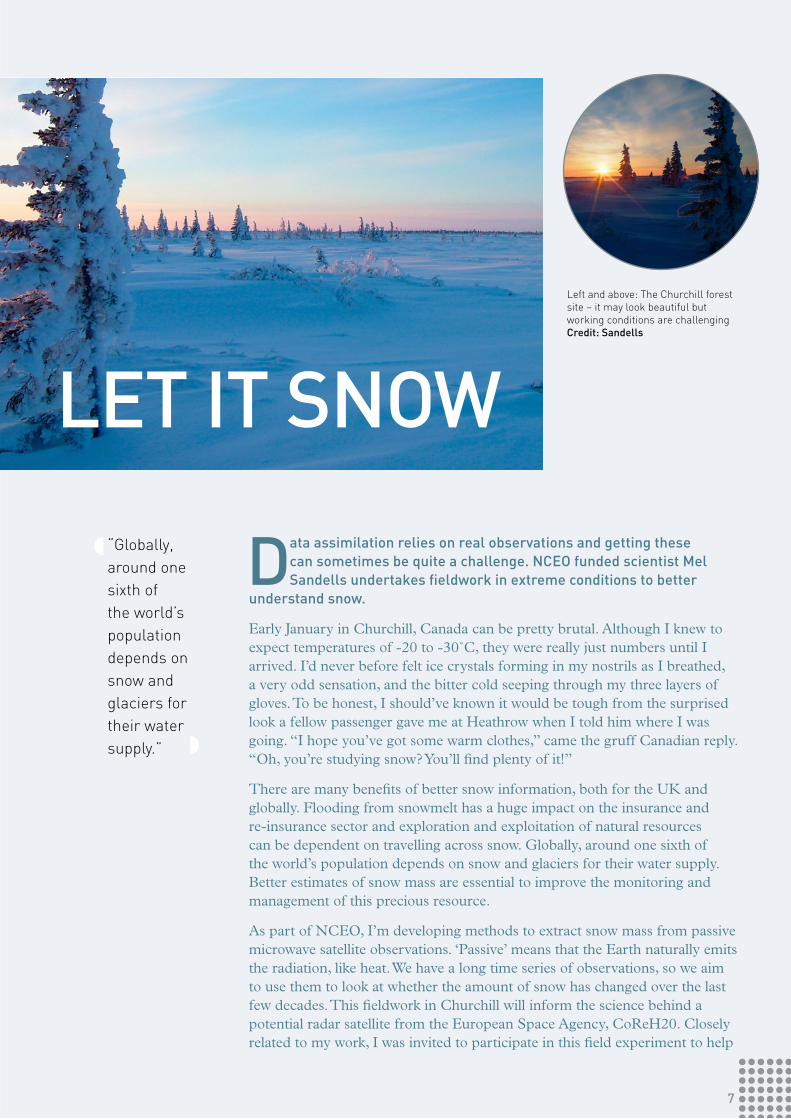
Data assimilation relies on real observations and getting these can sometimes be quite a challenge. NCeo funded scientist mel sandells undertakes fieldwork in extreme conditions to better
understand snow.
Early January in Churchill, Canada can be pretty brutal. Although I knew to expect temperatures of -20 to -30˚C, they were really just numbers until I arrived. I’d never before felt ice crystals forming in my nostrils as I breathed, a very odd sensation, and the bitter cold seeping through my three layers of gloves. To be honest, I should’ve known it would be tough from the surprised look a fellow passenger gave me at Heathrow when I told him where I was going. “I hope you’ve got some warm clothes,” came the gruff Canadian reply. “Oh, you’re studying snow? You’ll find plenty of it!”
There are many benefits of better snow information, both for the UK and globally. Flooding from snowmelt has a huge impact on the insurance and re-insurance sector and exploration and exploitation of natural resources can be dependent on travelling across snow. Globally, around one sixth of the world’s population depends on snow and glaciers for their water supply. Better estimates of snow mass are essential to improve the monitoring and management of this precious resource.
As part of NCEO, I’m developing methods to extract snow mass from passive microwave satellite observations. ‘Passive’ means that the Earth naturally emits the radiation, like heat. We have a long time series of observations, so we aim to use them to look at whether the amount of snow has changed over the last few decades. This fieldwork in Churchill will inform the science behind a potential radar satellite from the European Space Agency, CoReH20. Closely related to my work, I was invited to participate in this field experiment to help
7
Left and above: The Churchill forest site – it may look beautiful but working conditions are challenging Credit: sandells
let it sNoW
“Globally, around one sixth of the world’s population depends on snow and glaciers for their water supply.”
take high-resolution measurements of the snow to find out everything we can about the snow beneath our instruments. We need data to test computer models of how we think satellites should interpret the microwave signals from the snow and there’s no substitute for cold, challenging fieldwork.
Freezing rainBoarding our tiny plane in Winnipeg with a handful of other passengers, we were told that there was a severe weather warning. Freezing rain ahead. “We don’t know if we’re gonna make it, but we’ll give it a go,” the tannoy announced.
Considerably more at ease once we had arrived at the Churchill Northern Studies Center, I got dressed into field gear and headed out to join colleagues at our first site. The instrument I use is a scatterometer, a
type of radar that scans the snow, sending out signals at different frequencies in the microwave spectrum. Measuring how much of the signal is returned to
8
Smoothing off the side of a snow pit Credit: sandells
Ice crust on the snow surface from melt and refreeze processes. Large crystals have grown underneath but we need to know more about how these affect the satellite measurements Credit: sandells
9
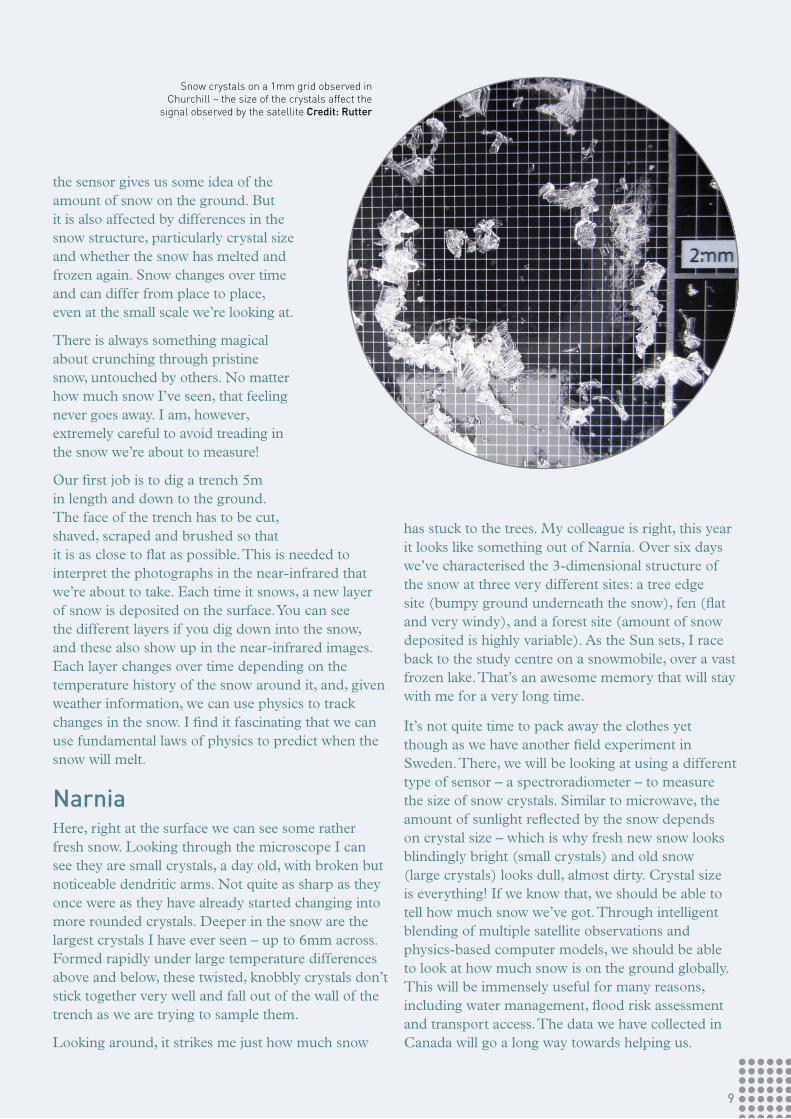
the sensor gives us some idea of the amount of snow on the ground. But it is also affected by differences in the snow structure, particularly crystal size and whether the snow has melted and frozen again. Snow changes over time and can differ from place to place, even at the small scale we’re looking at.
There is always something magical about crunching through pristine snow, untouched by others. No matter how much snow I’ve seen, that feeling never goes away. I am, however, extremely careful to avoid treading in the snow we’re about to measure!
Our first job is to dig a trench 5m in length and down to the ground. The face of the trench has to be cut, shaved, scraped and brushed so that it is as close to flat as possible. This is needed to interpret the photographs in the near-infrared that we’re about to take. Each time it snows, a new layer of snow is deposited on the surface. You can see the different layers if you dig down into the snow, and these also show up in the near-infrared images. Each layer changes over time depending on the temperature history of the snow around it, and, given weather information, we can use physics to track changes in the snow. I find it fascinating that we can use fundamental laws of physics to predict when the snow will melt.
NarniaHere, right at the surface we can see some rather fresh snow. Looking through the microscope I can see they are small crystals, a day old, with broken but noticeable dendritic arms. Not quite as sharp as they once were as they have already started changing into more rounded crystals. Deeper in the snow are the largest crystals I have ever seen – up to 6mm across. Formed rapidly under large temperature differences above and below, these twisted, knobbly crystals don’t stick together very well and fall out of the wall of the trench as we are trying to sample them.
Looking around, it strikes me just how much snow
has stuck to the trees. My colleague is right, this year it looks like something out of Narnia. Over six days we’ve characterised the 3-dimensional structure of the snow at three very different sites: a tree edge site (bumpy ground underneath the snow), fen (flat and very windy), and a forest site (amount of snow deposited is highly variable). As the Sun sets, I race back to the study centre on a snowmobile, over a vast frozen lake. That’s an awesome memory that will stay with me for a very long time.
It’s not quite time to pack away the clothes yet though as we have another field experiment in Sweden. There, we will be looking at using a different type of sensor – a spectroradiometer – to measure the size of snow crystals. Similar to microwave, the amount of sunlight reflected by the snow depends on crystal size – which is why fresh new snow looks blindingly bright (small crystals) and old snow (large crystals) looks dull, almost dirty. Crystal size is everything! If we know that, we should be able to tell how much snow we’ve got. Through intelligent blending of multiple satellite observations and physics-based computer models, we should be able to look at how much snow is on the ground globally. This will be immensely useful for many reasons, including water management, flood risk assessment and transport access. The data we have collected in Canada will go a long way towards helping us.
Snow crystals on a 1mm grid observed in Churchill – the size of the crystals affect the
signal observed by the satellite Credit: Rutter
10
sue Nelson reports on NCeo efforts, using data assimilation, to improve computer models of what happens when there’s a flood.
The heavens open and, after a Biblical-style flood, a town becomes an island. Rescue helicopters hover overhead, people have died and homes and businesses are damaged by river water. Meanwhile, the local water treatment plant is compromised, drinking water is contaminated and, although surrounded by water, fresh water supplies are running out.
In 2007 this nightmare scenario happened to Tewkesbury in Gloucestershire. It was the wettest summer on record and flooding occurred across Britain – from Nottinghamshire, Derbyshire, Yorkshire and Lincolnshire – to Worcestershire, where run-off water into the river Avon, near Evesham, was eight times greater than the highest levels since records began.
The flooding damaged vital infrastructure such as water supplies, power networks and roads. According to the Environment Agency, it cost the economy £3.2bn and the Government promptly set up the Pitt Commission, which reviewed what had happened and examined how responses to flooding could be improved in the future.
These responses included providing the emergency services with near real-time flood visualisation tools – accurate computer model simulations of what
The Earth Observation satellite TerraSAR-X, seen here with the TanDEM-X satellite, provides NCEO scientists with information over large areas to help improve flood models Credit: esa, DlR
aFteR tHeFLOOD
A snapshot from the 2-D model simulation showing what happened in Tewkesbury. This is overlaid on a 3m TerraSAR-X image Credit: NCeo
11
is happening during a flood. As a result, NCEO researchers have been working on exactly that, using Tewkesbury as an important proof-of-concept test case.
Radar satellitesThe rivers Severn and Avon both meet at Tewkesbury and gauges along these rivers measure water levels and the flow of water every 15 minutes. “This produces a hydrograph and that inputs to the flood model together with high resolution river and floodplain topographic data to see how that water behaves all along the river and when it’s overtopping,” explains Guy Schumann, Principal Investigator on the project. “At the moment we have very high resolution models for the Tewkesbury area and they are reproducing what has been observed on aerial and satellite images capturing the event.”
Schumann, from the University of Bristol’s School of Geographical Sciences, works with information on the ground as well as from satellites, such as the German Earth Observation satellite TerraSAR-X, to help improve flood models.
“The advantage of using radar satellites to monitor flooding is because they use microwaves,” says Schumann. “The wavelengths of these instruments can penetrate clouds, day and night. So you can still get a picture no matter what time of day it is or the weather conditions.”
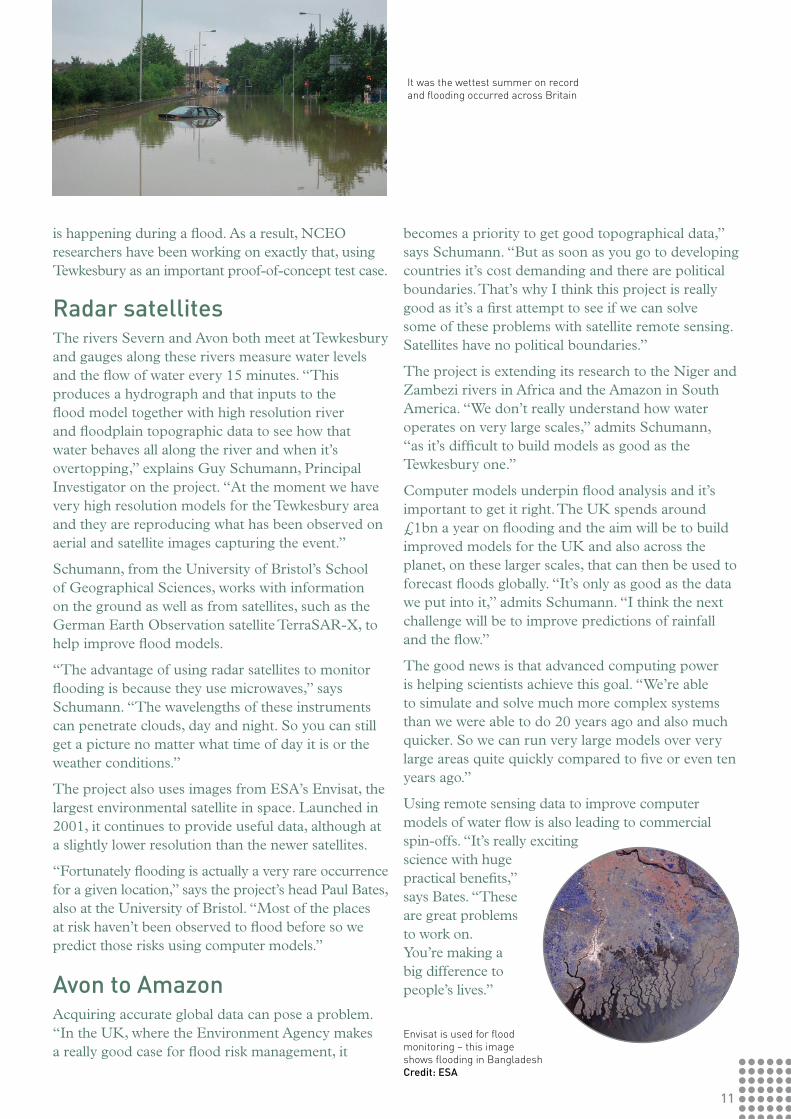
The project also uses images from ESA’s Envisat, the largest environmental satellite in space. Launched in 2001, it continues to provide useful data, although at a slightly lower resolution than the newer satellites.
“Fortunately flooding is actually a very rare occurrence for a given location,” says the project’s head Paul Bates, also at the University of Bristol. “Most of the places at risk haven’t been observed to flood before so we predict those risks using computer models.”
avon to amazonAcquiring accurate global data can pose a problem. “In the UK, where the Environment Agency makes a really good case for flood risk management, it
becomes a priority to get good topographical data,” says Schumann. “But as soon as you go to developing countries it’s cost demanding and there are political boundaries. That’s why I think this project is really good as it’s a first attempt to see if we can solve some of these problems with satellite remote sensing. Satellites have no political boundaries.”
The project is extending its research to the Niger and Zambezi rivers in Africa and the Amazon in South America. “We don’t really understand how water operates on very large scales,” admits Schumann, “as it’s difficult to build models as good as the Tewkesbury one.”
Computer models underpin flood analysis and it’s important to get it right. The UK spends around £1bn a year on flooding and the aim will be to build improved models for the UK and also across the planet, on these larger scales, that can then be used to forecast floods globally. “It’s only as good as the data we put into it,” admits Schumann. “I think the next challenge will be to improve predictions of rainfall and the flow.”
The good news is that advanced computing power is helping scientists achieve this goal. “We’re able to simulate and solve much more complex systems than we were able to do 20 years ago and also much quicker. So we can run very large models over very large areas quite quickly compared to five or even ten years ago.”
Using remote sensing data to improve computer models of water flow is also leading to commercial spin-offs. “It’s really exciting science with huge practical benefits,” says Bates. “These are great problems to work on. You’re making a big difference to people’s lives.”
It was the wettest summer on record and flooding occurred across Britain
Envisat is used for flood monitoring – this image shows flooding in Bangladesh Credit: esa
12
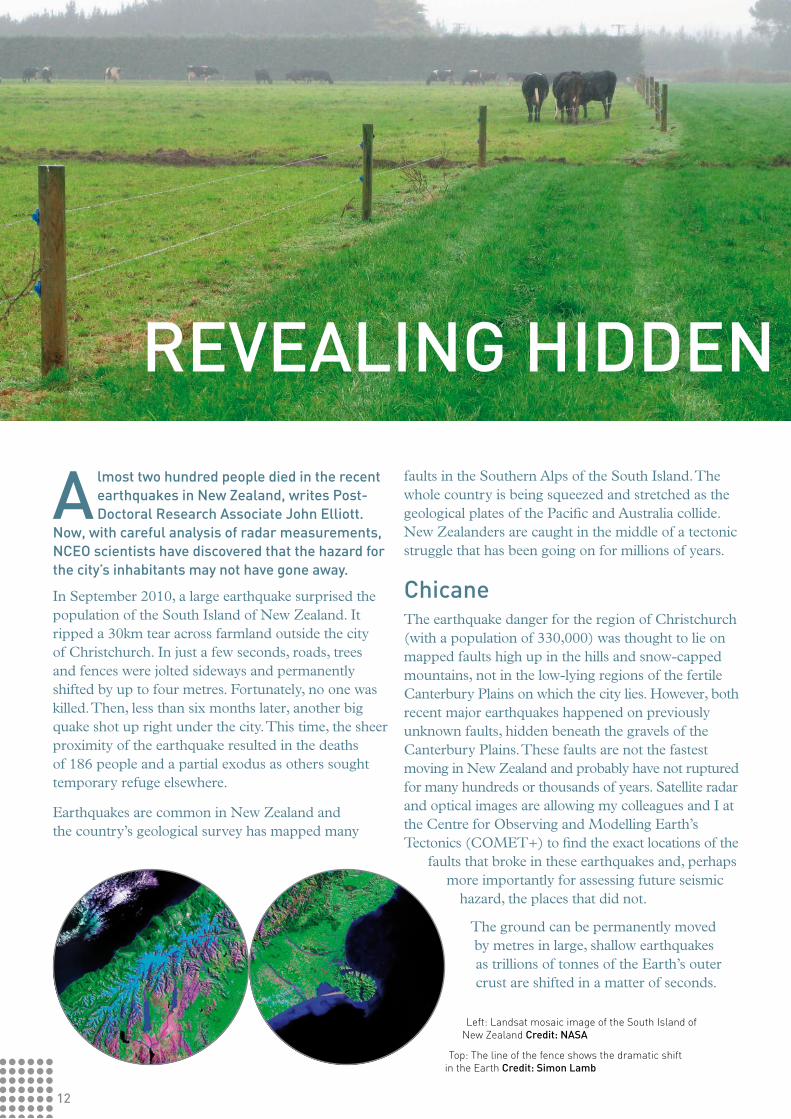
Left: Landsat mosaic image of the South Island of New Zealand Credit: Nasa
Top: The line of the fence shows the dramatic shift in the Earth Credit: simon lamb
almost two hundred people died in the recent earthquakes in New Zealand, writes Post-Doctoral Research associate John elliott.
Now, with careful analysis of radar measurements, NCeo scientists have discovered that the hazard for the city’s inhabitants may not have gone away.
In September 2010, a large earthquake surprised the population of the South Island of New Zealand. It ripped a 30km tear across farmland outside the city of Christchurch. In just a few seconds, roads, trees and fences were jolted sideways and permanently shifted by up to four metres. Fortunately, no one was killed. Then, less than six months later, another big quake shot up right under the city. This time, the sheer proximity of the earthquake resulted in the deaths of 186 people and a partial exodus as others sought temporary refuge elsewhere.
Earthquakes are common in New Zealand and the country’s geological survey has mapped many
faults in the Southern Alps of the South Island. The whole country is being squeezed and stretched as the geological plates of the Pacific and Australia collide. New Zealanders are caught in the middle of a tectonic struggle that has been going on for millions of years.
ChicaneThe earthquake danger for the region of Christchurch (with a population of 330,000) was thought to lie on mapped faults high up in the hills and snow-capped mountains, not in the low-lying regions of the fertile Canterbury Plains on which the city lies. However, both recent major earthquakes happened on previously unknown faults, hidden beneath the gravels of the Canterbury Plains. These faults are not the fastest moving in New Zealand and probably have not ruptured for many hundreds or thousands of years. Satellite radar and optical images are allowing my colleagues and I at the Centre for Observing and Modelling Earth’s Tectonics (COMET+) to find the exact locations of the
faults that broke in these earthquakes and, perhaps more importantly for assessing future seismic
hazard, the places that did not.
The ground can be permanently moved by metres in large, shallow earthquakes as trillions of tonnes of the Earth’s outer crust are shifted in a matter of seconds.
RevealiNg HiDDeN HaZaRDs
13
In the first New Zealand earthquake, parts of the northern end of the Canterbury Plains were pushed closer to the city by up to four metres. At the fault line, this caused a big step in the criss-crossing pattern of roads that were previously constructed straight, resulting in a chicane as if on a racing track. We have used satellite images from WorldView-2 with a half metre resolution to measure 50 of these bent roads and hedges. These can then be compared to what our field geologist colleagues measured on the ground in the days after the earthquake.
On the ground, however, it is only possible to make measurements along the line of the fault where the offsets of roads and fences can be found. We get a much bigger and better picture of the smaller ground movements when we use satellite radar measurements. These observations are also more useful than those from optical imagery ones, as they can be used at night and in cloud because the radar signal goes right through the haze.
elastic bandThe radar instrument on board a Japanese satellite called ALOS acquired images before and after both earthquakes. By looking at the difference in time it took the radar to bounce off the Earth and return to the satellite, it was possible to create a map of how far the ground moved in each earthquake. By using simple models of the Earth that treat it like a big elastic band, we can find out where the faults lie because this is where the earth has snapped the most. Perhaps more importantly, our models indicate that there has been very little ground motion in-between these two earthquakes. This is referred to a seismic gap and lies to the western edge of Christchurch. If a potential fault line lies here then it is under increased pressure and could break in the future - the gap being long enough that the earthquake generated could be just as big as before.
The population of Christchurch now faces an uncertain future and some difficult choices. Earthquakes cannot be predicted and the uncertainties in the probabilities of more significant earthquakes in the coming decades are large. The conclusions we draw from the satellite observations will permit a much more informed decision to be made by the New Zealand government regarding the location and strength of future buildings in the region; something that would not have been possible at this level of precision prior to the advent of remote satellite observations.
RevealiNg HiDDeN HaZaRDsAbove: Radar image of the earthquake Credit: Comet+, Jaxa
Below: Once straight roads are now kinked Credit: simon lamb, Digitalglobe
What is it?The Geostationary Earth Radiation Budget (GERB) mission is a series of four 40kg instruments carried on Meteosat Second Generation (MSG) European weather satellites. The first was launched in 2002 on Meteosat-8 and the second took over in 2007, operating on Meteosat-9. Two further instruments will fly on future Meteosats.
What does it do?The instrument, largely developed by Imperial College, the Rutherford Appleton Laboratory and the University of Leicester (with funding from the Natural Environment Research Council), measures the amount of solar radiation arriving on Earth and the amount leaving or being scattered into space. Every 15 minutes it produces a highly accurate picture of broadband radiances from a third of the globe. Its resolution is significantly better than previous satellite instruments that measured the Earth’s thermal radiation and allows rapidly changing processes to be examined.
How does it work?Mounted on a rapidly spinning satellite, which subjects the hardware to constant acceleration of around 15G, GERB uses a mirror to focus light onto detectors. These detectors sample the emissions from a north-south slice of the earth’s surface for 40 milliseconds every 0.6 seconds, with a 50km2 resolution, moving from east-to-west. An on-board black body source and solar reflector sphere are used to check and calibrate the instrument’s data during its operational life.
Why is it useful?As well as providing experimental evidence for climate change, it has also helped improve climate forecasts by monitoring the greenhouse effect of small dust particles over the Western Sahara and by reassessing the brightness of clouds.
Understanding the Earth’s radiation budget – the balance between incoming solar radiation and outgoing reflected and scattered solar radiation – is important for understanding the climate. It is vital that climate models capture this balance correctly. Data from GERB makes it possible to study the accuracy of these models and improve them. The data also enables the effect on the climate of clouds and aerosols to be better observed. As these phenomena can change relatively quickly, the 15-minute sample interval of GERB is of critical importance for this work. A variety of GERB products are made available to researchers around the world.
FeatuReD iNstRumeNt: geRB
“Data from GERB makes it possible to study the accuracy of climate models and improve them.”
The GERB instrument at the Rutherford Appleton Laboratory Credit: Ral, esa
text by Paul ireson
15
ian Roulstone is a Professor of mathematics at the university of surrey’s Faculty of engineering and Physical sciences and is a co-theme leader on data assimilation for NCeo.
What is data assimilation?It is the process of obtaining information, whether it’s from satellites or ground-based observing systems, and getting that sort of data into a forecast model so you can make your next prediction.
For example, data is gathered from satellites, ships or weather stations, which measure temperature, moisture, wind speed and direction and so on. Tomorrow’s weather forecast is based on our knowledge of what the weather was doing yesterday combined with information from observations of what the weather has been doing today.
What sort of data is assimilated for NCeo? All sorts of data to do with moisture, temperature, ozone, carbon, etc.
How does this data get used for earth observation?NCEO has software that enables it to incorporate that data into prediction models to understand how weather and climate might change in the future. In order to predict the future we’ve got to know what’s happening now and that process of incorporating our knowledge of what’s happening into the computer models is data assimilation.
Where does the mathematics come in? Most mathematics that students learn at school or university is based around using techniques like calculus to solve linear problems, where there’s a direct one to one correspondence between cause and effect. However, much of the world does not obey linear rules and weather abounds with these non-linear relationships. Data assimilation is focused on developing new mathematical techniques to use that information in a variety of simulations. We’ve got the computer power to do this but not the underlying mathematics to do it properly.
But it doesn’t matter whether you’re doing climate, carbon, chemistry or the cryosphere; a lot of these very different applications rely on underpinning mathematical ideas that are the same.
What do enjoy most about your job?Astonishingly we’re using maths from very different areas – from theoretical physics to finance – for data assimilation in Earth observation and applying it to a huge range of practical problems. And it’s a two-way thing because the practical problems often stimulate novel ways of looking for new mathematics.
so this is cutting edge stuff?Oh yes. This is pushing us in new directions mathematically. We’re not just using maths, we’re creating new maths in order to tackle these problems, which is why it’s exciting for us.
Data assimilation is used to improve our understanding of the oceans, earth and atmosphere Credits: esa
PRoFile
16
NCEO is one of the Natural Environment Research Council’s research and collaborative centres. Its mission is to unlock the full potential of Earth Observation to monitor, diagnose and predict climate and environmental change.
NCEO involves more than 100 scientists from 26 universities and research establishments. By working together, they help ensure that the UK’s investments in satellite observations are fully realised.
National Centre for Earth Observation c/o The Directorate Department of Meteorology The University of Reading Reading RG6 6BB