35
1 WIPRO LIMITED AND SUBSIDIARIES CONDENSED CONSOLIDATED INTERIM FINANCIAL STATEMENTS UNDER IFRS AS OF AND FOR THE THREE MONTHS AND YEAR ENDED MARCH 31, 2017
| Date post: | 30-Mar-2018 |
| Category: |
Documents |
| Upload: | phungquynh |
| View: | 216 times |
| Download: | 1 times |

1
WIPRO LIMITED AND SUBSIDIARIES
CONDENSED CONSOLIDATED INTERIM FINANCIAL STATEMENTS UNDER IFRS
AS OF AND FOR THE THREE MONTHS AND YEAR ENDED MARCH 31, 2017

2
WIPRO LIMITED AND SUBSIDIARIES CONDENSED CONSOLIDATED INTERIM STATEMENT OF FINANCI AL POSITION
(` in millions, except share and per share data, unless otherwise stated)

3
WIPRO LIMITED AND SUBSIDIARIES
CONDENSED CONSOLIDATED INTERIM STATEMENT OF INCOME (` in millions, except share and per share data, unless otherwise stated)
4
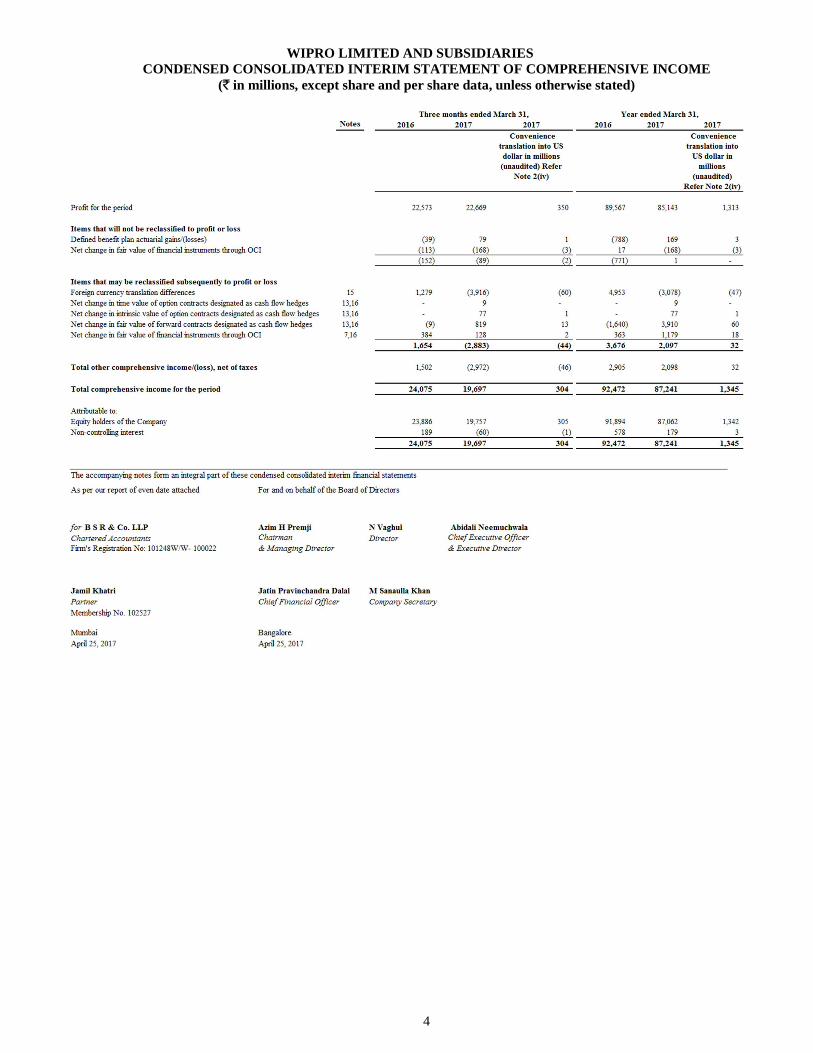
WIPRO LIMITED AND SUBSIDIARIES CONDENSED CONSOLIDATED INTERIM STATEMENT OF COMPREH ENSIVE INCOME
(` in millions, except share and per share data, unless otherwise stated)
5
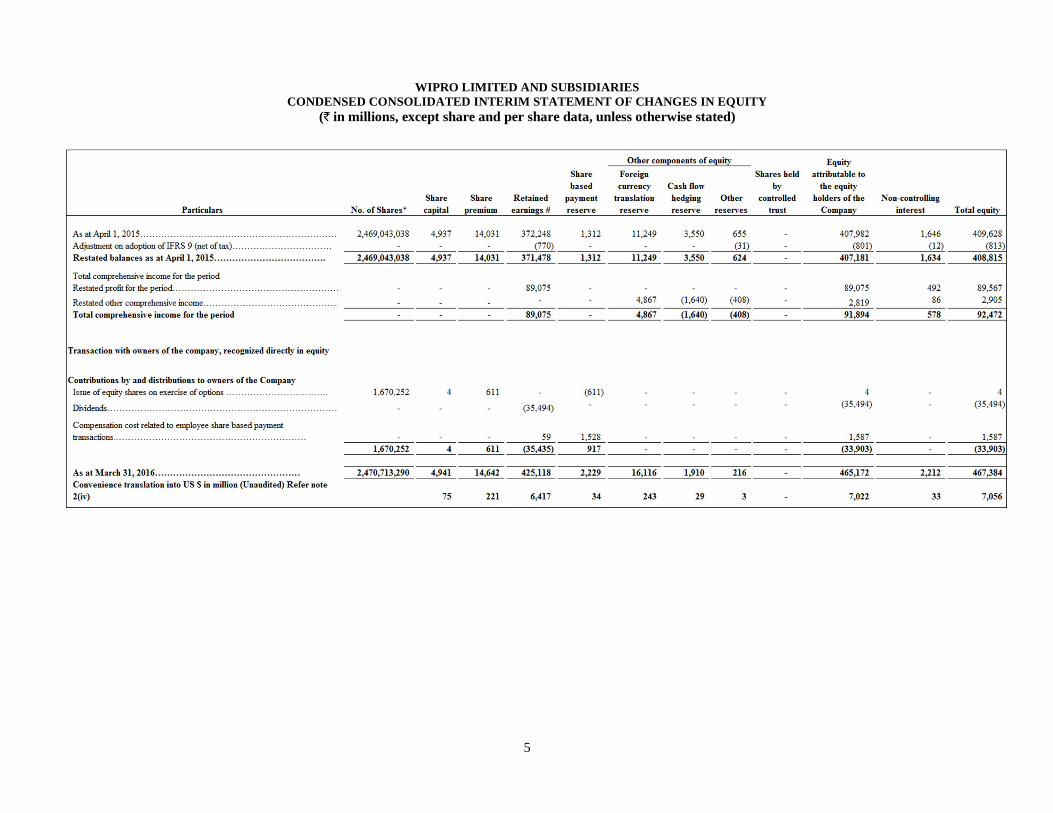
WIPRO LIMITED AND SUBSIDIARIES CONDENSED CONSOLIDATED INTERIM STATEMENT OF CHANGES IN EQUITY
(` in millions, except share and per share data, unless otherwise stated)

6
WIPRO LIMITED AND SUBSIDIARIES CONDENSED CONSOLIDATED INTERIM STATEMENT OF CHANGES IN EQUITY
(` in millions, except share and per share data, unless otherwise stated)

7
WIPRO LIMITED AND SUBSIDIARIES CONDENSED CONSOLIDATED INTERIM STATEMENT OF CASH FL OWS
(` in millions, except share and per share data, unless otherwise stated)

8
WIPRO LIMITED AND SUBSIDIARIES NOTES TO THE CONDENSED CONSOLIDATED INTERIM FINANCI AL STATEMENTS
(` in millions, except share and per share data, unless otherwise stated)
1. The Company overview
Wipro Limited (“Wipro” or the “Parent Company”), together with its subsidiaries (collectively, “the Company” or the “Group”) is a global information technology (IT), consulting and business process services (BPS) company.
Wipro is a public limited company incorporated and domiciled in India. The address of its registered office is Wipro Limited, Doddakannelli, Sarjapur Road, Bangalore – 560 035, Karnataka, India. Wipro has its primary listing with Bombay Stock Exchange and National Stock Exchange in India. The Company’s American Depository Shares representing equity shares are also listed on the New York Stock Exchange. These condensed consolidated interim financial statements were authorized for issue by the Company’s Board of Directors on April 25, 2017.
2. Basis of preparation of financial statements (i) Statement of compliance
These condensed consolidated interim financial statements have been prepared in accordance with
International Financial Reporting Standards and its interpretations (“IFRS”), as issued by the International Accounting Standards Board (“IASB”). Selected explanatory notes are included to explain events and transactions that are significant to understand the changes in financial position and performance of the Company since the last annual consolidated financial statements as at and for the year ended March 31, 2016. These condensed consolidated interim financial statements do not include all the information required for full annual financial statements prepared in accordance with IFRS.
(ii) Basis of preparation
These condensed consolidated interim financial statements are prepared in accordance with International
Accounting Standard (IAS) 34, “Interim Financial Reporting”. The condensed consolidated interim financial statements correspond to the classification provisions
contained in IAS 1(revised), “Presentation of Financial Statements” . For clarity, various items are aggregated in the statements of income and statements of financial position. These items are disaggregated separately in the notes, where applicable. The accounting policies have been consistently applied to all periods presented in these condensed consolidated interim financial statements.
All amounts included in the condensed consolidated interim financial statements are reported in millions of
Indian rupees (̀ in millions) except share and per share data, unless otherwise stated. Due to rounding off, the numbers presented throughout the document may not add up precisely to the totals and percentages may not precisely reflect the absolute figures. (iii) Basis of measurement
The condensed consolidated interim financial statements have been prepared on a historical cost convention
and on an accrual basis, except for the following material items that have been measured at fair value as required by relevant IFRS:
a. Derivative financial instruments; b. Financial instruments classified as fair value through other comprehensive income or fair value through
profit or loss; c. The defined benefit asset/ (liability) is recognised at the present value of the defined benefit obligation less
fair value of plan assets; and d. Contingent consideration.

9
(iv) Convenience translation (unaudited) The accompanying condensed consolidated interim financial statements have been prepared and reported in
Indian rupees, the national currency of India. Solely for the convenience of the readers, the condensed consolidated interim financial statements as of and for the year ended March 31, 2017, have been translated into United States dollars at the certified foreign exchange rate of $ 1 = ` 64.85 (March 31, 2016: $ 1 = ` 66.25), as published by the Federal Reserve Board of Governors on March 31, 2017. No representation is made that the Indian rupee amounts have been, could have been or could be converted into United States dollars at such a rate or any other rate.
(v) Use of estimates and judgment
The preparation of the condensed consolidated interim financial statements in conformity with IFRS requires
management to make judgments, estimates and assumptions that affect the application of accounting policies and the reported amounts of assets, liabilities, income and expenses. Actual results may differ from those estimates.
Estimates and underlying assumptions are reviewed on an ongoing basis. Revisions to accounting estimates
are recognized in the period in which the estimates are revised and in any future periods affected. In particular, information about significant areas of estimation, uncertainty and critical judgments in applying accounting policies that have the most significant effect on the amounts recognized in the condensed consolidated interim financial statements is included in the following notes:
a) Revenue recognition: The Company uses the percentage of completion method using the input (cost
expended) method to measure progress towards completion in respect of fixed price contracts. Percentage of completion method accounting relies on estimates of total expected contract revenue and costs. This method is followed when reasonably dependable estimates of the revenues and costs applicable to various elements of the contract can be made. Key factors that are reviewed in estimating the future costs to complete include estimates of future labor costs and productivity efficiencies. Because the financial reporting of these contracts depends on estimates that are assessed continually during the term of these contracts, recognized revenue and profit are subject to revisions as the contract progresses to completion. When estimates indicate that a loss will be incurred, the loss is provided for in the period in which the loss becomes probable.
b) Goodwill: Goodwill is tested for impairment at least annually and when events occur or changes in circumstances indicate that the recoverable amount of the cash generating unit is less than its carrying value. The recoverable amount of cash generating units is higher of value-in-use and fair value less cost to sell. The calculation involves use of significant estimates and assumptions which includes turnover and earnings multiples, growth rates and net margins used to calculate projected future cash flows, risk-adjusted discount rate, future economic and market conditions.
c) Income taxes: The major tax jurisdictions for the Company are India and the United States of America. Significant judgments are involved in determining the provision for income taxes including judgment on whether tax positions are probable of being sustained in tax assessments. A tax assessment can involve complex issues, which can only be resolved over extended time periods.
d) Deferred taxes: Deferred tax is recorded on temporary differences between the tax bases of assets and
liabilities and their carrying amounts, at the rates that have been enacted or substantively enacted at the reporting date. The ultimate realization of deferred tax assets is dependent upon the generation of future taxable profits during the periods in which those temporary differences and tax loss carry-forwards become deductible. The Company considers the expected reversal of deferred tax liabilities and projected future taxable income in making this assessment. The amount of the deferred tax assets considered realizable, however, could be reduced in the near term if estimates of future taxable income during the carry-forward period are reduced.
e) Business combinations: In accounting for business combinations, judgment is required in identifying whether an identifiable intangible asset is to be recorded separately from goodwill. Additionally, estimating the acquisition date fair value of the identifiable assets (including useful life estimates) and liabilities acquired and contingent consideration assumed involves management judgment. These measurements are based on information available at the acquisition date and are based on expectations and assumptions that have been deemed reasonable by management. Changes in these judgments, estimates, and assumptions can materially affect the results of operations.

10
f) Expected credit losses on financial assets: On application of IFRS 9, the impairment provisions of financial assets are based on assumptions about risk of default and expected timing of collection. The Company uses judgment in making these assumptions and selecting the inputs to the impairment calculation, based on the Company’s past history, customer’s credit-worthiness, existing market conditions as well as forward looking estimates at the end of each reporting period.
g) Measurement of fair value of non-marketable equity investments: These instruments are initially recorded at cost and subsequently measured at fair value. Fair value of investments is determined using the market and income approaches. The market approach includes the use of financial metrics and ratios of comparable companies, such as revenue, earnings, comparable performance multiples, recent financial rounds and the level of marketability of the investments. The selection of comparable companies requires management judgment and is based on a number of factors, including comparable company sizes, growth rates, and development stages. The income approach includes the use of discounted cash flow model, which requires significant estimates regarding the investees’ revenue, costs, and discount rates based on the risk profile of comparable companies. Estimates of revenue and costs are developed using available historical and forecast data.
h) Other estimates: The share based compensation expense is determined based on the Company’s estimate of equity instruments that will eventually vest.
3. Significant accounting policies Please refer to the Company’s Annual Report for the year ended March 31, 2016 for a discussion of the Company’s other critical accounting policies. The Company has early adopted IFRS 9 effective April 1, 2016, with retrospective application. Accordingly, the policy for financial instruments as presented in the Company’s Annual Report is amended as under: Financial instruments: a) Non-derivative financial instruments:
Non derivative financial instruments consist of:
• financial assets, which include cash and cash equivalents, trade receivables, unbilled revenues, finance lease receivables, employee and other advances, investments in equity and debt securities and eligible current and non-current assets;
• financial liabilities, which include long and short-term loans and borrowings, bank overdrafts, trade payables, eligible current and non-current liabilities.
Non derivative financial instruments are recognized initially at fair value. Financial assets are derecognized when substantial risks and rewards of ownership of the financial asset have been transferred. In cases where substantial risks and rewards of ownership of the financial assets are neither transferred nor retained, financial assets are derecognized only when the Company has not retained control over the financial asset. Subsequent to initial recognition, non-derivative financial instruments are measured as described below: A. Cash and cash equivalents The Company’s cash and cash equivalents consist of cash on hand and in banks and demand deposits with banks, which can be withdrawn at any time, without prior notice or penalty on the principal. For the purposes of the cash flow statement, cash and cash equivalents include cash on hand, in banks and demand deposits with banks, net of outstanding bank overdrafts that are repayable on demand and are considered part of the Company’s cash management system. In the consolidated statement of financial position, bank overdrafts are presented under borrowings within current liabilities.

11
B. Investments Financial instruments measured at amortised cost: Debt instruments that meet the following criteria are measured at amortized cost (except for debt instruments that are designated at fair value through Profit or Loss (FVTPL) on initial recognition): • the asset is held within a business model whose objective is to hold assets in order to collect contractual
cash flows; and
• the contractual terms of the instrument give rise on specified dates to cash flows that are solely payment of principal and interest on the principal amount outstanding.
Financial instruments measured at fair value through other comprehensive income (FVTOCI): Debt instruments that meet the following criteria are measured at fair value through other comprehensive income (FVTOCI) (except for debt instruments that are designated at fair value through Profit or Loss (FVTPL) on initial recognition): • the asset is held within a business model whose objective is achieved both by collecting contractual
cash flows and selling the financial asset; and
• the contractual terms of the instrument give rise on specified dates to cash flows that are solely payment of principal and interest on the principal amount outstanding.
Interest income is recognized in the statement of income for FVTOCI debt instruments. Other changes in fair value of FVTOCI financial assets are recognized in other comprehensive income. When the investment is disposed of, the cumulative gain or loss previously accumulated in reserves is transferred to the condensed consolidated interim statement of income. Financial instruments measured at fair value through profit or loss (FVTPL): Instruments that do not meet the amortised cost or FVTOCI criteria are measured at FVTPL. Financial assets at FVTPL are measured at fair value at the end of each reporting period, with any gains or losses arising on re-measurement recognized in statement of income. The gain or loss on disposal is recognized in the condensed consolidated interim statement of income. Interest income is recognized in statement of income for FVTPL debt instruments. Dividend on financial assets at FVTPL is recognized when the Group’s right to receive dividend is established. Investments in equity instruments designated to be classified as FVTOCI: The Company carries certain equity instruments which are not held for trading. The Company has elected the FVTOCI irrevocable option for these instruments. Movements in fair value of these investments are recognized in other comprehensive income and the gain or loss is not transferred to statement of income on disposal of these investments. Dividends from these investments are recognized in the condensed consolidated interim statement of income when the Company’s right to receive dividends is established. C. Other financial assets: Other financial assets are non-derivative financial assets with fixed or determinable payments that are not quoted in an active market. They are presented as current assets, except for those maturing later than 12 months after the reporting date which are presented as non-current assets. These are initially recognized at fair value and subsequently measured at amortized cost using the effective interest method, less any impairment losses. These comprise trade receivables, unbilled revenues, cash and cash equivalents and other assets.
12
D. Trade and other payables Trade and other payables are initially recognized at fair value, and subsequently carried at amortized cost using the effective interest method. For these financial instruments, the carrying amounts approximate fair value due to the short term maturity of these instruments.
b) Derivative financial instruments The Company is exposed to foreign currency fluctuations on foreign currency assets, liabilities, net investment in foreign operations and forecasted cash flows denominated in foreign currency. The Company limits the effect of foreign exchange rate fluctuations by following established risk management policies including the use of derivatives. The Company enters into derivative financial instruments where the counterparty is primarily a bank. Derivatives are recognized and measured at fair value. Attributable transaction costs are recognized in statement of income as cost. Subsequent to initial recognition, derivative financial instruments are measured as described below: A. Cash flow hedges Changes in the fair value of the derivative hedging instrument designated as a cash flow hedge are recognized in other comprehensive income and held in cash flow hedging reserve, net of taxes, a component of equity, to the extent that the hedge is effective. To the extent that the hedge is ineffective, changes in fair value are recognized in the statement of income and reported within foreign exchange gains/(losses), net within results from operating activities. If the hedging instrument no longer meets the criteria for hedge accounting, then hedge accounting is discontinued prospectively. If the hedging instrument expires or is sold, terminated or exercised, the cumulative gain or loss on the hedging instrument recognized in cash flow hedging reserve till the period the hedge was effective remains in cash flow hedging reserve until the forecasted transaction occurs. The cumulative gain or loss previously recognized in the cash flow hedging reserve is transferred to the statement of income upon the occurrence of the related forecasted transaction. If the forecasted transaction is no longer expected to occur, such cumulative balance is immediately recognized in the statement of income. B. Hedges of net investment in foreign operations The Company designates derivative financial instruments as hedges of net investments in foreign operations. The Company has also designated a foreign currency denominated borrowing as a hedge of net investment in foreign operations. Changes in the fair value of the derivative hedging instruments and gains/losses on translation or settlement of foreign currency denominated borrowings designated as a hedge of net investment in foreign operations are recognized in other comprehensive income and presented within equity in the FCTR to the extent that the hedge is effective. To the extent that the hedge is ineffective, changes in fair value are recognized in the statement of income and reported within foreign exchange gains/(losses), net within results from operating activities. C. Others Changes in fair value of foreign currency derivative instruments neither designated as cash flow hedges nor hedges of net investment in foreign operations are recognized in the statement of income and reported within foreign exchange gains, net within results from operating activities. Changes in fair value and gains/(losses) on settlement of foreign currency derivative instruments relating to borrowings, which have not been designated as hedges are recorded in finance expense.

13
New Accounting standards adopted by the Company:
The accounting policies adopted in the preparation of the condensed consolidated interim financial statements are consistent with those followed in the preparation of the Company’s annual consolidated financial statements for the year ended March 31, 2016, except for IFRS 9 as described below: IFRS 9 – Financial instruments
The Company has elected to early adopt IFRS 9, Financial Instruments effective April 1, 2016 with retrospective application.
IFRS 9 introduces a single approach for the classification and measurement of financial assets according to
their cash flow characteristics and the business model they are managed in, and provides a new impairment model based on expected credit losses. IFRS 9 also includes new guidance regarding the application of hedge accounting to better reflect an entity’s risk management activities especially with regard to managing non-financial risks.
Application of the new measurement and presentation requirements of IFRS 9 did not have a significant
impact on equity. The Company continues to measure at fair value all financial assets earlier measured at fair value. All existing hedge relationships that were earlier designated as effective hedging relationships continue to qualify for hedge accounting under IFRS 9. As IFRS 9 does not change the general principles of how an entity accounts for effective hedges, there is no significant impact as a result of applying IFRS 9. The effect of change in measurement of financial instruments on the Company’s financial position has been applied retrospectively. The retrospective application did not have a significant impact on the financial position as at March 31, 2015 and 2016.
The total impact on the Company’s retained earnings and other reserves due to classification and measurement of financial instruments is as follows:
Retained Earnings
Other Reserves
Reported opening balance as at April 1, 2015 ` 372,248 ` 655 Impact on adoption of IFRS 9
Reclassification of investments from available for sale investments (AFS) to FVTPL (refer note a)
55
(55)
Expected credit losses on financial assets (refer note d) (1,243) - Deferred tax impact on the above 406 24 Total impact on adoption of IFRS 9 (782) (31) Adjusted balance as at April 1, 2015 ` 371,466 ` 624
Reported balance as at March 31, 2016 425,735 505 Impact of adoption of IFRS 9 for the year ended March 31, 2016 Reclassification of investments from AFS to FVTPL (refer note a) 375 (375) Expected credit losses on financial assets (refer note d) (161) - Deferred tax impact on the above (61) 117 Adjustment on adoption of IFRS 9 for the year ended March 31, 2016 153 (258) Cumulative impact on adoption of IFRS 9 as at March 31, 2016 (629) (289) Adjusted balance as at March 31, 2016 ` 425,106 ` 216
(a) Reclassification of investments from AFS to FVTPL
Certain investments in liquid and short-term mutual funds and equity linked debentures were reclassified from available for sale to financial assets measured at FVTPL. Related fair value gain of ` 55 were transferred from other comprehensive income to retained earnings on April 1, 2015. During the year ended March 31, 2016, fair value gains related to these investments amounting to ̀ 258 was recognized in statement of income, net of related deferred tax expense of ` 117. This reclassification did not have any impact on the carrying value of the said assets as at April 1, 2015.
14
(b) Reclassification of investments from AFS to FVTOCI
The Company on initial application of IFRS 9 has made an irrevocable election to present in other comprehensive income subsequent changes in the fair value of equity investments not held for trading. Such investments and investment in certificate of deposits were reclassified from available for sale to financial assets measured at FVTOCI. This reclassification did not have any impact on the carrying value of the said assets as at April 1, 2015.
(c) Reclassification of loans and deposits to financial instruments at amortised cost
Certain inter corporate and term deposits along with related interest accruals were reclassified from loans and receivables reported as part of other assets to financial assets measured at amortised cost. This reclassification did not have any impact on the carrying value of the said assets as at April 1, 2015.
(d) Impairment of financial assets
The Company has applied the simplified approach to providing for expected credit losses on trade receivables as described by IFRS 9, which requires the use of lifetime expected credit loss provision for all trade receivables. These provisions are based on assessment of risk of default and expected timing of collection. A cumulative impairment provision of ` 918 (net of deferred tax) has been recorded as an adjustment to retained earnings as at April 1, 2015.
The Company assesses on a forward looking basis the expected credit losses associated with its assets carried
at amortised cost. The impairment methodology applied depends on whether there has been a significant increase in credit risk. New accounting standards not yet adopted: A number of new standards, amendments to standards and interpretations are not yet effective for annual periods beginning after April 1, 2016, and have not been applied in preparing these condensed consolidated interim financial statements. New standards, amendments to standards and interpretations that could have a potential impact on the consolidated financial statements of the Company are: IFRS 15 – Revenue from Contracts with Customers IFRS 15 supersedes all existing revenue requirements in IFRS (IAS 11 Construction Contracts, IAS 18 Revenue and related interpretations). According to the new standard, revenue is recognized to depict the transfer of promised goods or services to a customer in an amount that reflects the consideration to which the entity expects to be entitled in exchange for those goods or services. IFRS 15 establishes a five step model that will apply to revenue earned from a contract with a customer (with limited exceptions), regardless of the type of revenue transaction or the industry. Extensive disclosures will be required, including disaggregation of total revenue; information about performance obligation; changes in contract asset and liability account balances between periods and key judgments and estimates. The standard permits the use of either the retrospective or cumulative effect transition method. In September 2015, the IASB issued an amendment to IFRS 15 deferring the adoption of the standard to periods beginning on or after January 1, 2018. The Company is currently assessing the impact of adopting IFRS 15 on the Company’s Consolidated Financial Statements. IFRS 16 - Leases On January 13, 2016, the International Accounting Standards Board issued the final version of IFRS 16, Leases. IFRS 16 will replace the existing leases standard, IAS 17 Leases, and related interpretations. The standard sets out the principles for the recognition, measurement, presentation and disclosure of leases. IFRS 16 introduces a single lessee accounting model and requires a lessee to recognise assets and liabilities for all leases with a term of more than 12 months, unless the underlying asset is of low value. Accounting for transactions where the Company is a lessee is expected to be impacted on application of this standard. The Standard also contains enhanced disclosure requirements for lessees. The effective date for adoption of IFRS 16 is annual periods beginning on or after January 1, 2019, though early adoption is permitted for companies applying IFRS 15 Revenue from Contracts with Customers. The Company is currently assessing the impact of adopting IFRS 16 on the Company’s Consolidated Financial Statements.

15
4. Property, plant and equipment
Land Buildings Plant and
machinery*
Furniture fixtures and equipment Vehicles Total
Gross carrying value: As at April 1, 2015…………….………………….. ` 3,685 ` 24,515 ` 79,594 ` 12,698 ` 830 ` 121,322 Translation adjustment…………………………… 10 209 1,720 79 (1) 2,017 Additions ……………………………………....… - 1,799 15,424 1,791 62 19,076 Additions through business combination……… - 105 4,462 162 34 4,763
Disposals / adjustments………………………. - (539) (1,620) (615) (336) (3,110) As at March 31, 2016……………………………... ` 3,695 ` 26,089 ` 99,580 ` 14,115 ` 589 ` 144,068 Accumulated depreciation/impairment: As at April 1, 2015………………………………... ` - ` 4,513 ` 56,629 ` 10,636 ` 809 ` 72,587 Translation adjustment…………………………… - 73 1,113 80 - 1,266 Depreciation……………………………………… - 861 11,381 1,094 19 13,355 Disposals / adjustments………………………….. - (103) (962) (492) (324) (1,881) As at March 31, 2016……………………………... ` - ` 5,344 ` 68,161 ` 11,318 ` 504 ` 85,327 Capital work-in-progress ` 6,211
Net carrying value including Capital work-in-progress as at March 31, 2016………………..
` 64,952
Gross carrying value: As at April 1, 2016………………………………. ` 3,695 ` 26,089 ` 99,580 ` 14,115 ` 589 ` 144,068 Translation adjustment…………………………… (15) (69) (1,377) (133) 3 (1,591) Additions ………………………………………… - 1,133 16,572 2,242 23 19,970 Additions through business combination……… 134 446 835 77 - 1,492
Disposals / adjustments.………………………… - (18) (6,643) (553) (183) (7,397) As at March 31, 2017………………………… ` 3,814 ` 27,581 ` 108,967 ` 15,748 ` 432 ` 156,542
Accumulated depreciation/impairment: As at April 1, 2016………………………………... ` - ` 5,344 ` 68,161 ` 11,318 ` 504 ` 85,327 Translation adjustment…………………………… - (39) (816) (75) 2 (928) Depreciation……………………………………… - 1,059 14,910 1,117 28 17,114 Disposals / adjustments.…………………………. - (3) (5,250) (392) (169) (5,814) As at March 31, 2017……………………………. ` - ` 6,361 ` 77,005 ` 11,968 ` 365 ` 95,699 Capital work-in-progress ` 8,951 Net carrying value including Capital work-in-progress as at March 31, 2017………………
` 69,794
*Including computer equipment and software.
5. Goodwill and intangible assets
The movement in goodwill balance is given below:
Year ended
March 31, 2016 Year ended
March 31, 2017
Balance at the beginning of the period………………………………..... ` 68,078 ` 101,991 Translation adjustment…………………………………………………. 3,421 (4,319) Acquisition through business combination, net/adjustments.……….. 30,492 28,124 Balance at the end of the period……………………………………... ` 101,991 ` 125,796

16
Intangible assets
Customer
related Marketing
related Total Gross carrying value: As at April 1, 2015…………………………………………………... ` 10,617 ` 905 ̀ 11,522 Translation adjustment……………………………………………… 292 120 412 Disposal/ adjustment ……………………………………………….. - 189 189 Acquisition through business combination………………………….. 7,451 1,373 8,824 As at March 31, 2016………………………………………………... ` 18,360 ` 2,587 ` 20,947 Accumulated amortization and impairment: As at April 1, 2015…………………………………………………... ` 2,936 ` 655 ` 3,591 Translation adjustment……………………………………………… - 70 70 Amortization and impairment ………………………………………. 1,228 217 1,445 As at March 31, 2016………………………………………………... ` 4,164 ` 942 ` 5,106 Net carrying value as at March 31, 2016……………………..….. ` 14,196 ` 1,645 ` 15,841 Gross carrying value: As at April 1, 2016…………………………………………………... ` 18,360 ` 2,587 ` 20,947 Acquisition through business combination, net/adjustments………... 2,714 4,006 6,720 Translation adjustment……………………….................................... (546) (314) (860) As at March 31, 2017…………………………………………… ` 20,528 ` 6,279 ` 26,807 Accumulated amortization and impairment: As at April 1, 2016………………………………….….….….….…. ` 4,164 ` 942 ` 5,106 Translation adjustment……………………………………………… (7) (68) (75) Amortization and impairment…….….…………………………... 5,107 747 5,854 As at March 31, 2017…………………..……………….………...… ` 9,264 ` 1,621 ` 10,885 Net carrying value as at March 31, 2017……………………... ` 11,264 ̀ 5,658 ` 15,922
Amortization and impairment expense on intangible assets is included in selling and marketing expenses in the condensed consolidated interim statement of income.
6. Business combination Designit AS
On August 6, 2015, the Company obtained control of Designit AS (“Designit”) by acquiring 100% of its
share capital. Designit is a Denmark based global strategic design firm specializing in designing transformative product-service experiences. The acquisition strengthens the Company’s digital offerings, combining engineering and transformative technology with human centered-design methods.
The acquisition was executed through a share purchase agreement for a consideration of ` 6,501 (EUR 93 million) which includes a deferred earn-out component of ̀ 2,108 (EUR 30 million), which is linked to achievement of revenues and earnings over a period of 3 years ending June 30, 2018. The fair value of the earn-out liability was estimated by applying the discounted cash flow approach considering discount rate of 13% and probability adjusted revenue and earnings estimates. This earn-out liability was fair valued at ` 1,287 million and recorded as part of purchase price allocation.
17
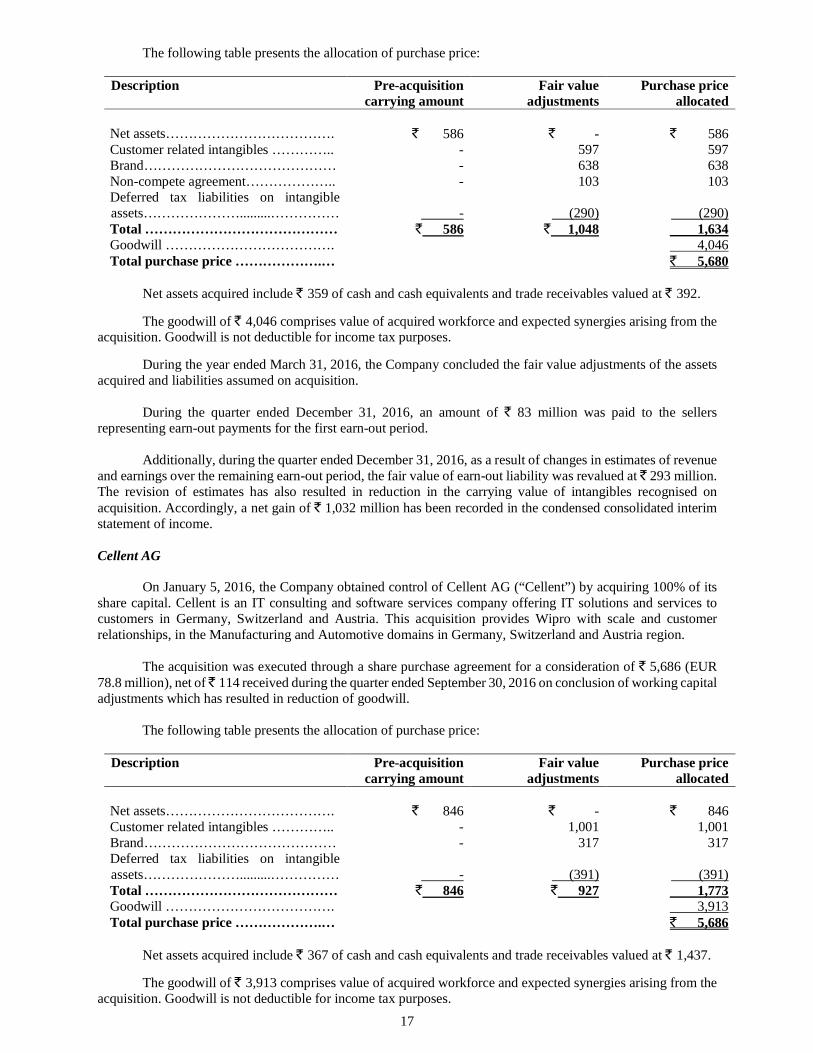
The following table presents the allocation of purchase price:
Description Pre-acquisition carrying amount
Fair value adjustments
Purchase price allocated
Net assets………………………………. ` 586 ` - ̀ 586 Customer related intangibles ………….. - 597 597 Brand…………………………………… - 638 638 Non-compete agreement……………….. - 103 103 Deferred tax liabilities on intangible assets………………….........……………
-
(290)
(290)
Total …………………………………… ` 586 ` 1,048 1,634 Goodwill ………………………………. 4,046 Total purchase price ……………….… ` 5,680
Net assets acquired include ` 359 of cash and cash equivalents and trade receivables valued at ̀ 392.
The goodwill of ̀ 4,046 comprises value of acquired workforce and expected synergies arising from the acquisition. Goodwill is not deductible for income tax purposes.
During the year ended March 31, 2016, the Company concluded the fair value adjustments of the assets acquired and liabilities assumed on acquisition.
During the quarter ended December 31, 2016, an amount of ` 83 million was paid to the sellers
representing earn-out payments for the first earn-out period. Additionally, during the quarter ended December 31, 2016, as a result of changes in estimates of revenue
and earnings over the remaining earn-out period, the fair value of earn-out liability was revalued at ` 293 million. The revision of estimates has also resulted in reduction in the carrying value of intangibles recognised on acquisition. Accordingly, a net gain of ` 1,032 million has been recorded in the condensed consolidated interim statement of income.
Cellent AG
On January 5, 2016, the Company obtained control of Cellent AG (“Cellent”) by acquiring 100% of its
share capital. Cellent is an IT consulting and software services company offering IT solutions and services to customers in Germany, Switzerland and Austria. This acquisition provides Wipro with scale and customer relationships, in the Manufacturing and Automotive domains in Germany, Switzerland and Austria region.
The acquisition was executed through a share purchase agreement for a consideration of ` 5,686 (EUR
78.8 million), net of ̀ 114 received during the quarter ended September 30, 2016 on conclusion of working capital adjustments which has resulted in reduction of goodwill.
The following table presents the allocation of purchase price:
Description Pre-acquisition
carrying amount Fair value
adjustments Purchase price
allocated Net assets………………………………. ` 846 ` - ̀ 846 Customer related intangibles ………….. - 1,001 1,001 Brand…………………………………… - 317 317 Deferred tax liabilities on intangible assets………………….........……………
-
(391)
(391)
Total …………………………………… ` 846 ` 927 1,773 Goodwill ………………………………. 3,913 Total purchase price ……………….… ` 5,686
Net assets acquired include ` 367 of cash and cash equivalents and trade receivables valued at ̀ 1,437.
The goodwill of ̀ 3,913 comprises value of acquired workforce and expected synergies arising from the acquisition. Goodwill is not deductible for income tax purposes.
18
During the quarter ended September 30, 2016, the Company concluded the fair value adjustments of the assets acquired and liabilities assumed on acquisition. Comparatives have not been retrospectively revised as the amounts are not material.
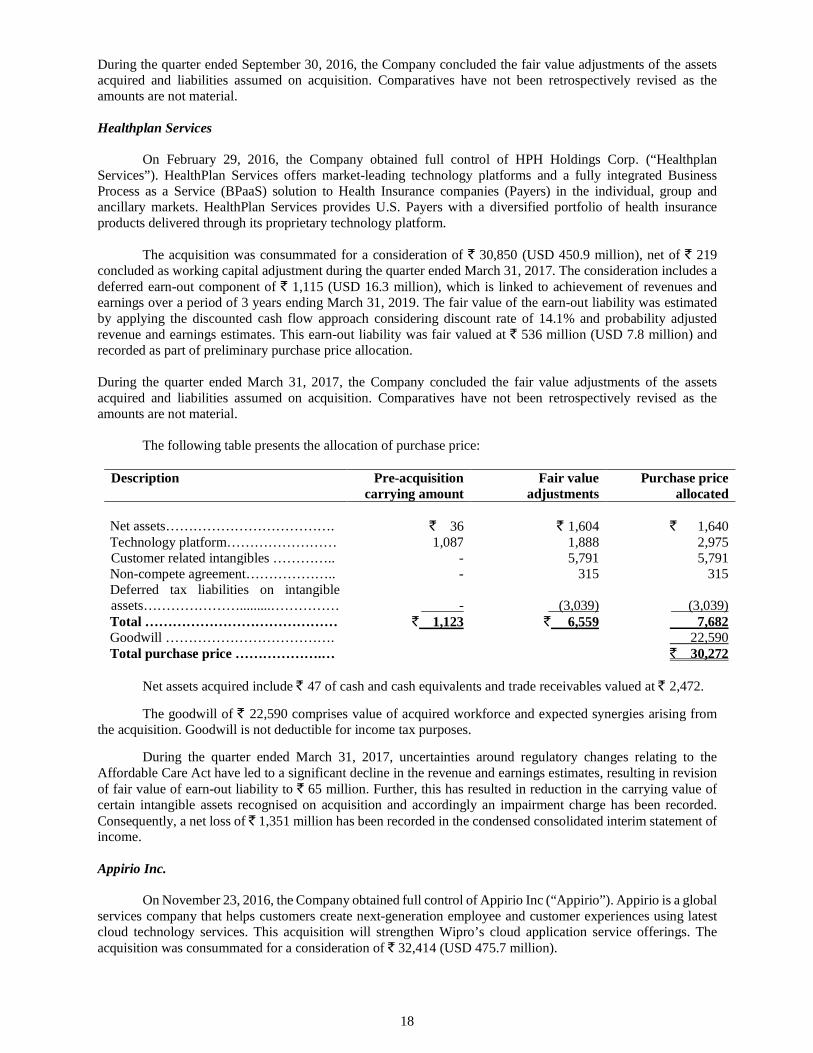
Healthplan Services
On February 29, 2016, the Company obtained full control of HPH Holdings Corp. (“Healthplan
Services”). HealthPlan Services offers market-leading technology platforms and a fully integrated Business Process as a Service (BPaaS) solution to Health Insurance companies (Payers) in the individual, group and ancillary markets. HealthPlan Services provides U.S. Payers with a diversified portfolio of health insurance products delivered through its proprietary technology platform.
The acquisition was consummated for a consideration of ` 30,850 (USD 450.9 million), net of ` 219 concluded as working capital adjustment during the quarter ended March 31, 2017. The consideration includes a deferred earn-out component of ` 1,115 (USD 16.3 million), which is linked to achievement of revenues and earnings over a period of 3 years ending March 31, 2019. The fair value of the earn-out liability was estimated by applying the discounted cash flow approach considering discount rate of 14.1% and probability adjusted revenue and earnings estimates. This earn-out liability was fair valued at ̀ 536 million (USD 7.8 million) and recorded as part of preliminary purchase price allocation. During the quarter ended March 31, 2017, the Company concluded the fair value adjustments of the assets acquired and liabilities assumed on acquisition. Comparatives have not been retrospectively revised as the amounts are not material.
The following table presents the allocation of purchase price:
Description Pre-acquisition carrying amount
Fair value adjustments
Purchase price allocated
Net assets………………………………. ` 36 ` 1,604 ̀ 1,640 Technology platform…………………… 1,087 1,888 2,975 Customer related intangibles ………….. - 5,791 5,791 Non-compete agreement……………….. - 315 315 Deferred tax liabilities on intangible assets………………….........……………
-
(3,039)
(3,039)
Total …………………………………… ` 1,123 ` 6,559 7,682 Goodwill ………………………………. 22,590 Total purchase price ……………….… ` 30,272
Net assets acquired include ` 47 of cash and cash equivalents and trade receivables valued at ̀ 2,472.
The goodwill of ̀ 22,590 comprises value of acquired workforce and expected synergies arising from the acquisition. Goodwill is not deductible for income tax purposes.
During the quarter ended March 31, 2017, uncertainties around regulatory changes relating to the Affordable Care Act have led to a significant decline in the revenue and earnings estimates, resulting in revision of fair value of earn-out liability to ̀ 65 million. Further, this has resulted in reduction in the carrying value of certain intangible assets recognised on acquisition and accordingly an impairment charge has been recorded. Consequently, a net loss of ` 1,351 million has been recorded in the condensed consolidated interim statement of income.
Appirio Inc.
On November 23, 2016, the Company obtained full control of Appirio Inc (“Appirio”). Appirio is a global
services company that helps customers create next-generation employee and customer experiences using latest cloud technology services. This acquisition will strengthen Wipro’s cloud application service offerings. The acquisition was consummated for a consideration of ` 32,414 (USD 475.7 million).

19
The following table presents the provisional allocation of purchase price:
Description Pre-acquisition carrying amount
Fair value adjustments
Purchase price allocated
Net assets………………………………. ` 526 (29) ̀ 497 Technology platform…………………… 436 (89) 347 Customer related intangibles ………….. - 2,323 2,323 Brand………..................……………….. 180 2,968 3,148 Alliance relationship. ………….. - 858 858 Deferred tax liabilities on intangible assets………………….........……………
-
(2,791)
(2,791)
Total …………………………………… ` 1,142 ` 3,240 4,382 Goodwill ………………………………. 28,032 Total purchase price ……………….… ` 32,414
Net assets acquired include ` 85 of cash and cash equivalents and trade receivables valued at ̀ 2,363.
The goodwill of ̀ 28,032 comprises value of acquired workforce and expected synergies arising from the acquisition. Goodwill is not deductible for income tax purposes.
The purchase consideration has been allocated on a provisional basis based on management’s estimates. The Company is in the process of making a final determination of the fair value of assets and liabilities. Finalization of the purchase price allocation may result in certain adjustments to the above allocation.
The pro-forma effects of this acquisition on the Company’s results were not material.
7. Investments
Financial instruments consist of the following: As at March 31, 2016 March 31, 2017
Financial instruments at FVTPL Investments in liquid and short-term mutual funds (1) ` 10,578 ` 104,675 Others 816 569
Financial instruments at FVTOCI Equity instruments 4,907 5,303 Commercial paper, Certificate of deposits and bonds 121,676 145,614
Financial instruments at amortised cost Inter corporate and term deposits (2) (3) 71,174 42,972
` 209,151 ` 299,133 Current 204,244 292,030 Non-current 4,907 7,103
(1) Investments in liquid and short-term mutual funds include investments amounting to ` 117 (March 31, 2016: ̀ 109) pledged as margin money deposits for entering into currency future contracts.
(2) These deposits earn a fixed rate of interest. (3) Term deposits include deposits in lien with banks amounting to ̀ 308 (March 31, 2016: ` 300).
8. Inventories
Inventories consist of the following: As at March 31, 2016 March 31, 2017
Stores and spare parts……………………………………………….. ` 871 ` 808 Raw materials and components.……………………………. ……… 2 1 Traded goods……………………………………………………… 4,517 3,106
` 5,390 ` 3,915

20
9. Cash and cash equivalents
Cash and cash equivalents as of March 31, 2016 and March 31, 2017 consists of cash and balances on deposit with banks. Cash and cash equivalents consists of the following:
As at March 31, 2016 March 31, 2017
Cash and bank balances……………………………………...……... ` 63,518 ` 27,808 Demand deposits with banks (1) (2)…………………………………... 35,531 24,902 ` 99,049 ` 52,710
(1) These deposits can be withdrawn by the Company at any time without prior notice and without any penalty on the principal. (2) Demand deposits with banks include deposits in lien with banks amounting to ` Nil (March 31, 2016: ̀ 3).
Cash and cash equivalents consists of the following for the purpose of the cash flow statement:
As at March 31, 2016 March 31, 2017
Cash and cash equivalents………………………………….. ` 99,049 ` 52,710 Bank overdrafts………………………………………........... (657) (1,992)
` 98,392 ` 50,718
10. Other assets As at March 31, 2016 March 31, 2017
Current Prepaid expenses and deposits………………..………………… ` 14,518 13,486 Due from officers and employees………………………………... 3,780 2,349 Finance lease receivables………………………………………... 2,034 1,854 Advance to suppliers……………………………. ……………… 1,507 1,448 Deferred contract costs………………………………………….. 3,720 4,270 Interest receivable……………………………….………………. 2,488 2,177 Balance with excise, customs and other authorities……………… 1,814 2,153 Others…………………………………………………………. 3,033 3,014 ` 32,894 ` 30,751 Non-current Prepaid expenses including rentals for leasehold land and deposits……………………………………………………...
` 8,534
` 10,516
Finance lease receivables……..…………………………………. 2,964 2,674 Deferred contract costs………………………………………….. 3,807 3,175 Others……………………..……………..…………………….... 523 428
` 15,828 ` 16,793 Total…………………………………………………………….. ` 48,722 ` 47,544
11. Loans and borrowings
A summary of loans and borrowings is as follows: As at March 31, 2016 March 31, 2017
Borrowings from banks……….…………………………… ` 105,661 ` 122,903 External commercial borrowings………………………………….. 9,938 9,728 Obligations under finance leases……………................................... 8,963 8,280 Term loans…………………………………………….….….….… 659 1,501 Total loans and borrowings………………………….................... ` 125,221 ` 142,412

21
12. Other liabilities and provisions As at
Other liabilities: March 31, 2016 March 31, 2017 Current:
Statutory and other liabilities…………………….…. ` 3,871 ` 3,353 Employee benefit obligations…………………….… 5,494 5,912 Advance from customers……………………………. 2,283 2,394 Others…………………………………………….. 2,173 1,368
` 13,821 ` 13,027
Non-current: Employee benefit obligations…………………………. ` 4,618 ` 4,235 Others………………………………………………….. 2,607 1,265
` 7,225 ` 5,500 Total……………………………………………………… ` 21,046 ` 18,527
As at
March 31, 2016 March 31, 2017 Provisions: Current:
Provision for warranty…………………….………... ` 388 ` 436 Others…………………………………………..….. 874 834 ` 1,262 ` 1,270
Non-current:
Provision for warranty……………………………..... ` 14 ` 4 Total………………………………………………... ` 1,276 ` 1,274
Provision for warranty represents cost associated with providing sales support services which are accrued at the time of recognition of revenues and are expected to be utilized over a period of 1 to 2 years. Other provisions primarily include provisions for tax related contingencies and litigations. The timing of cash outflows in respect of such provision cannot be reasonably determined.
13. Financial instruments
Derivative assets and liabilities:
The Company is exposed to foreign currency fluctuations on foreign currency assets / liabilities, forecasted
cash flows denominated in foreign currency and net investment in foreign operations. The Company follows established risk management policies, including the use of derivatives to hedge foreign currency assets / liabilities, foreign currency forecasted cash flows and net investment in foreign operations. The counter parties in these derivative instruments are primarily banks and the Company considers the risks of non-performance by the counterparty as non-material.
The following table presents the aggregate contracted principal amounts of the Company’s derivative contracts outstanding:
As at
March 31, 2016 March 31, 2017 Designated derivative instruments Sell: Forward contracts $ 897 $ 886
£ 248 £ 280 € 271 € 228 AUD 139 AUD 129 SAR 19 SAR -
Range Forward Option contracts
AED 7
$ 25 € 7
AED -
$ 130 € -

22
As at March 31, 2016 March 31, 2017
Interest rate swaps $ 150 $ -
Non designated derivative instruments Sell: Forward contracts $ 1,280 $ 889 £ 55 £ 82
€ 87 € 83 AUD 35 AUD 51
¥ 490 ¥ - SGD 3 SGD 3 ZAR 110 ZAR 262 CAD 11 CAD 41 CHF 10 CHF - SAR 58 SAR 49
AED 7 AED 69
Range Forward Option contracts
PLN -
$ 18
PLN 31
$ - Buy: Forward contracts $ 822 $ 750
The following table summarizes activity in the cash flow hedging reserve within equity related to all derivative instruments classified as cash flow hedges:
As at March 31, 2016 2017 Balance as at the beginning of the period………………………………………. ` 4,268 ` 2,367 Deferred cancellation gain/(loss), net…………………………………... (3) 74 Changes in fair value of effective portion of derivatives……………………. 1,079 12,391 Net (gain)/loss reclassified to statement of income on occurrence of
hedged transactions…………………………………………………… (2,977) (7,507) Gain/(loss) on cash flow hedging derivatives, net………………………. ` (1,901) ` 4,958 Balance as at the end of the period………………………........................ ` 2,367 ` 7,325 Deferred tax asset/(liability) thereon…………………………………….. ` (457) ` (1,419) Balance as at the end of the period, net of deferred tax.…………….. ` 1,910 ̀ 5,906
As at March 31, 2016 and 2017, there were no significant gains or losses on derivative transactions or portions thereof that have become ineffective as hedges, or associated with an underlying exposure that did not occur.
14. Fair value hierarchy
Financial assets and liabilities include cash and cash equivalents, trade receivables, unbilled revenues, finance lease receivables, employee and other advances and eligible current and non-current assets, long and short-term loans and borrowings, finance lease payables, bank overdrafts, trade payable, eligible current liabilities and non-current liabilities. The fair value of financial assets and liabilities approximate their carrying amount largely due to the short-term nature of such assets and liabilities.
Investments in liquid and short-term mutual funds, which are classified as FVTPL are measured using the net asset values at the reporting date multiplied by the quantity held.
The fair value of derivative financial instruments is determined based on observable market inputs including currency spot and forward rates, yield curves, currency volatility etc.
23
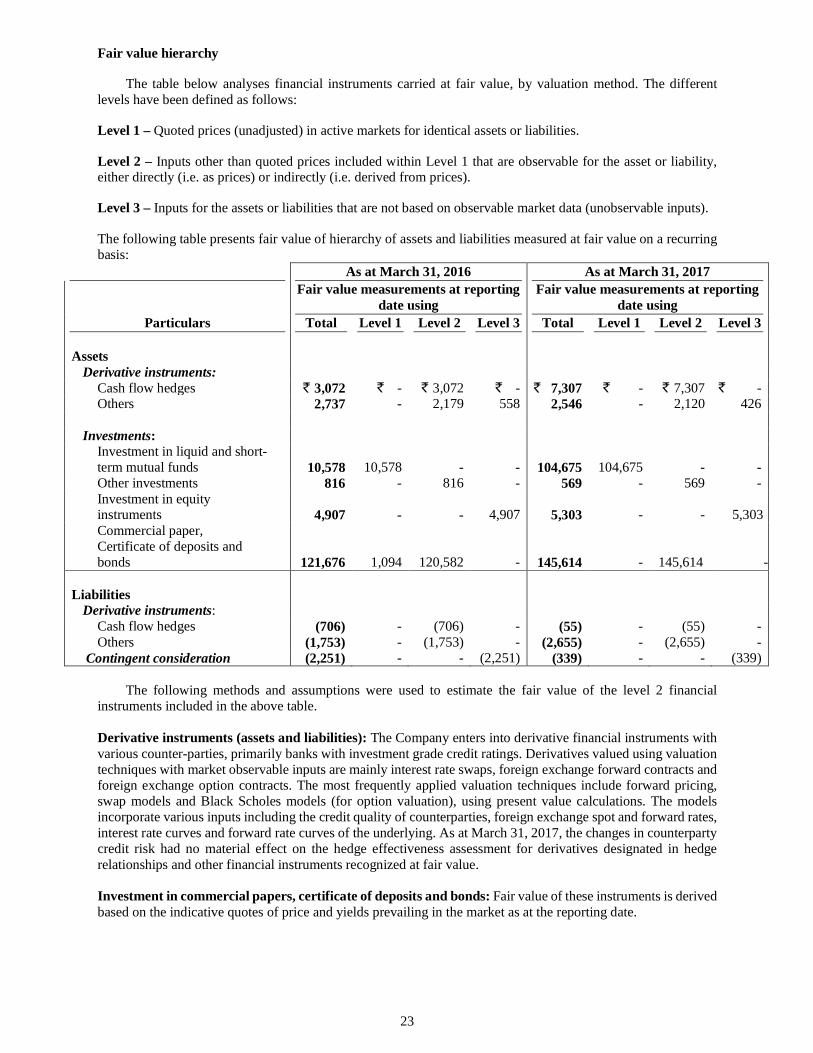
Fair value hierarchy
The table below analyses financial instruments carried at fair value, by valuation method. The different levels have been defined as follows:
Level 1 – Quoted prices (unadjusted) in active markets for identical assets or liabilities.
Level 2 – Inputs other than quoted prices included within Level 1 that are observable for the asset or liability, either directly (i.e. as prices) or indirectly (i.e. derived from prices).
Level 3 – Inputs for the assets or liabilities that are not based on observable market data (unobservable inputs).
The following table presents fair value of hierarchy of assets and liabilities measured at fair value on a recurring basis:
As at March 31, 2016 As at March 31, 2017
Particulars
Fair value measurements at reporting date using
Fair value measurements at reporting date using
Total Level 1 Level 2 Level 3 Total Level 1 Level 2 Level 3 Assets
Derivative instruments: Cash flow hedges ` 3,072 ` - ` 3,072 ` - ` 7,307 ` - ` 7,307 ` - Others 2,737 - 2,179 558 2,546 - 2,120 426
Investments:
Investment in liquid and short-term mutual funds 10,578 10,578 - - 104,675 104,675 - - Other investments 816 - 816 - 569 - 569 - Investment in equity instruments 4,907 - - 4,907
5,303
-
-
5,303
Commercial paper, Certificate of deposits and bonds 121,676 1,094 120,582 -
145,614
-
145,614
-
Liabilities
Derivative instruments: Cash flow hedges (706) - (706) - (55) - (55) - Others (1,753) - (1,753) - (2,655) - (2,655) -
Contingent consideration (2,251) - - (2,251) (339) - - (339) The following methods and assumptions were used to estimate the fair value of the level 2 financial
instruments included in the above table.
Derivative instruments (assets and liabilities): The Company enters into derivative financial instruments with various counter-parties, primarily banks with investment grade credit ratings. Derivatives valued using valuation techniques with market observable inputs are mainly interest rate swaps, foreign exchange forward contracts and foreign exchange option contracts. The most frequently applied valuation techniques include forward pricing, swap models and Black Scholes models (for option valuation), using present value calculations. The models incorporate various inputs including the credit quality of counterparties, foreign exchange spot and forward rates, interest rate curves and forward rate curves of the underlying. As at March 31, 2017, the changes in counterparty credit risk had no material effect on the hedge effectiveness assessment for derivatives designated in hedge relationships and other financial instruments recognized at fair value. Investment in commercial papers, certificate of deposits and bonds: Fair value of these instruments is derived based on the indicative quotes of price and yields prevailing in the market as at the reporting date.

24
Details of assets and liabilities considered under Level 3 classification:
Investments in equity
instruments
Derivative Assets – Others
Liabilities – Contingent
consideration Opening balance as on April 1, 2015 ` 3,867 ` 524 ` (110) Additions/adjustments 1,016 - (1,908) Gain/loss recognized in statement of income - 34 - Gain/loss recognized in foreign currency translation reserve - - (95) Gain/loss recognized in other comprehensive income 24 - - Finance expense recognized in statement of income - - (138) Balance as on March 31, 2016 ` 4,907 ` 558 ` (2,251) Additions 620 - - Payouts - - 140 Gain/loss recognized in statement of income - (132) 1,544 Gain/loss recognized in foreign currency translation reserve (41) -
198
Gain/loss recognized in other comprehensive income (183) - - Finance expense recognized in statement of income - - 30 Closing balance as on March 31, 2017 ` 5,303 ` 426 ` (339)
Description of significant unobservable inputs to valuation:
Item Valuation technique
Significant unobservable inputs
Movement by
Increase (`)
Decrease (`)
Unquoted equity investments
Discounted cash flow model
Long term growth rate
0.5% 55 (51)
Discount rate 0.5% (93) 101 Market multiple
approach Revenue multiple 0.5x 179 (186)
Derivative assets Option pricing model
Volatility of comparable companies
2.5% 31 (31)
Time to liquidation event
1 year 60 (69)
Contingent consideration
Probability weighted method
Estimated revenue achievement
5% 56 (56)
Estimated earnings achievement
1% - -
15. Foreign currency translation reserve
The movement in foreign currency translation reserve attributable to equity holders of the Company is summarized below:
As at March 31, 2016 March 31, 2017
Balance at the beginning of the period……………………………. ` 11,249 ` 16,116 Translation difference related to foreign operations, net………….. 5,680 (3,285) Change in effective portion of hedges of net investment in foreign operations………………………………………………… (813) 276 Total change during the period……………………………………. ` 4,867 ` (3,009) Balance at the end of the period………………………………... ` 16,116 ` 13,107
25
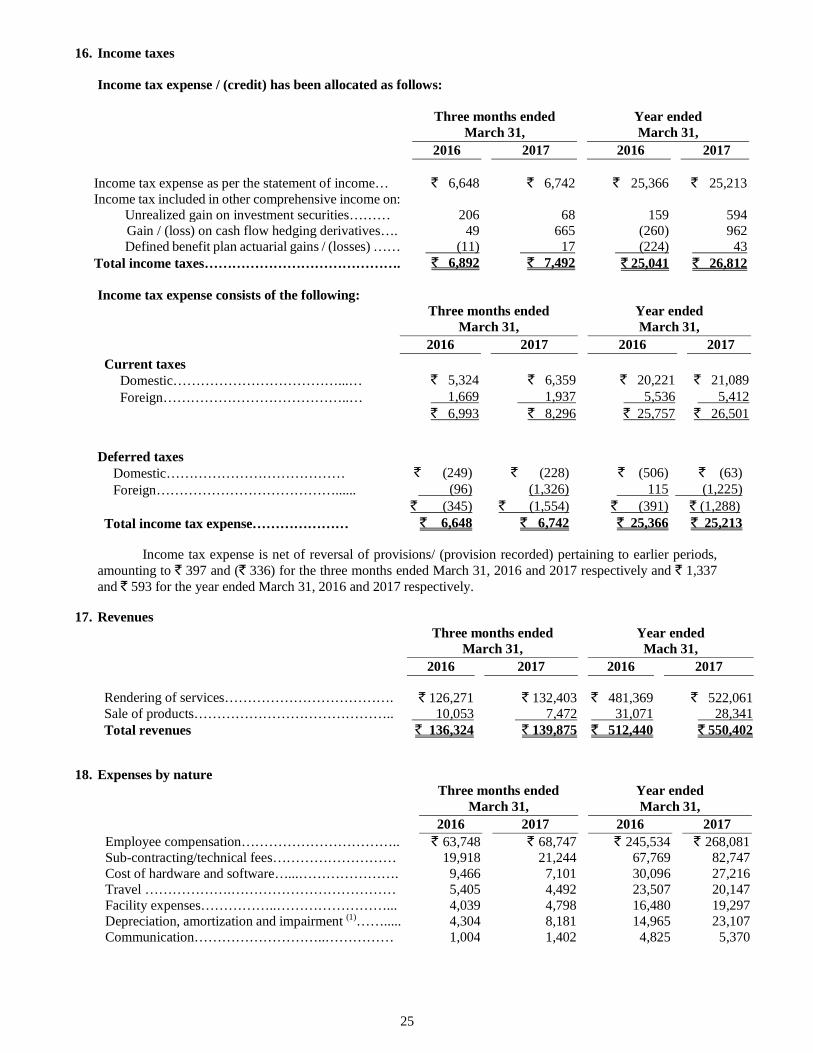
16. Income taxes
Income tax expense / (credit) has been allocated as follows:
Three months ended
March 31, Year ended March 31,
2016 2017 2016 2017
Income tax expense as per the statement of income… ` 6,648 ` 6,742 ` 25,366 ` 25,213 Income tax included in other comprehensive income on: Unrealized gain on investment securities……… 206 68 159 594
Gain / (loss) on cash flow hedging derivatives…. 49 665 (260) 962 Defined benefit plan actuarial gains / (losses) …… (11) 17 (224) 43 Total income taxes……………………………………. ` 6,892 ` 7,492 ` 25,041 ` 26,812 Income tax expense consists of the following:
Three months ended
March 31, Year ended March 31,
2016 2017 2016 2017 Current taxes
Domestic………………………………...… ` 5,324 ` 6,359 ` 20,221 ` 21,089 Foreign…………………………………..… 1,669 1,937 5,536 5,412
` 6,993 ` 8,296 ` 25,757 ` 26,501
Income tax expense is net of reversal of provisions/ (provision recorded) pertaining to earlier periods, amounting to ̀ 397 and (̀ 336) for the three months ended March 31, 2016 and 2017 respectively and ` 1,337 and ̀ 593 for the year ended March 31, 2016 and 2017 respectively.
17. Revenues Three months ended
March 31, Year ended Mach 31,
2016 2017 2016 2017
Rendering of services………………………………. ` 126,271 ` 132,403 ` 481,369 ̀ 522,061 Sale of products…………………………………….. 10,053 7,472 31,071 28,341 Total revenues ` 136,324 ` 139,875 ` 512,440 ` 550,402
18. Expenses by nature Three months ended
March 31, Year ended March 31,
2016 2017 2016 2017 Employee compensation…………………………….. ` 63,748 ` 68,747 ` 245,534 ` 268,081 Sub-contracting/technical fees……………………… 19,918 21,244 67,769 82,747 Cost of hardware and software…...…………………. 9,466 7,101 30,096 27,216 Travel ……………….……………………………… 5,405 4,492 23,507 20,147 Facility expenses……………..……………………... 4,039 4,798 16,480 19,297 Depreciation, amortization and impairment (1)……..... 4,304 8,181 14,965 23,107 Communication………………………..…………… 1,004 1,402 4,825 5,370
Deferred taxes Domestic………………………………… ` (249) ` (228) ` (506) ` (63) Foreign…………………………………...... (96) (1,326) 115 (1,225)
` (345) ` (1,554) ` (391) ` (1,288) Total income tax expense………………… ` 6,648 ` 6,742 ` 25,366 ` 25,213

26
Legal and professional fees………………………….. 1,360 1,319 4,214 4,957 Rates, taxes and insurance…………………………... 550 578 2,526 2,261 Marketing expenses……….…………..…………….. 631 764 2,292 2,936 Provision for doubtful debts……………………….. 776 89 2,004 2,427 Miscellaneous expenses…………………………… 1,421 1,159 5,235 5,836 Total cost of revenues, selling and marketing and general and administrative expenses……………... ` 112,622 ` 119,874 ` 419,447 ` 464,382 (1) Includes impairment charge on certain intangible assets recognised on acquisitions, amounting to ` 2,851 and ` 3,056 for the three months and year ended March 31, 2017 respectively. (Nil for the three months and year ended March 31, 2016)
19. Other operating income
During the quarter ended March 31, 2017, the Company has concluded the sale of the EcoEnergy division for a consideration of ` 4,670. Net gain from the sale, amounting to ` 4,082 has been recorded as other operating income.
20. Finance expense Three months ended
March 31, Year ended March 31,
2016 2017 2016 2017 Interest expense…………………………………………. ` 409 ` 580 ̀ 1,410 ` 1,916 Exchange fluctuation on foreign currency borrowings, net…................................................................................. 875 473 4,172 3,267 Total……………………………………………………. ` 1,284 ` 1,053 ` 5,582 ` 5,183
21. Finance and other income Three months ended
March 31, Year ended March 31,
2016 2017 2016 2017
Interest income………………………..…………………… ` 5,122 ` 4,186 ̀ 20,568 ̀ 17,307 Dividend income………………………..………………… 1 116 66 311 Unrealized gains/losses on financial instruments measured at fair value through profit or loss…………………………..
93 (775) 375 556
Gain on sale of investments………………………..………. 494 2,109 2,646 3,486 Total
` 5,710 ` 5,636 ` 23,655 ̀ 21,660
22. Earnings per equity share
A reconciliation of profit for the period and equity shares used in the computation of basic and diluted earnings per equity share is set out below:
Basic: Basic earnings per share is calculated by dividing the profit attributable to equity shareholders of the Company by the weighted average number of equity shares outstanding during the period, excluding equity shares purchased by the Company and held as treasury shares.
Three months ended March 31,
Year ended March 31,
2016 2017 2016 2017
Profit attributable to equity holders of the Company………………………..……………
` 22,380
` 22,611
` 89,075
` 84,895
Weighted average number of equity shares outstanding………………………..…………
2,457,344,850
2,417,784,033
2,456,559,400
2,428,540,505
Basic earnings per share…………………….... ` 9.11 ` 9.35 ` 36.26 ` 34.96

27
Diluted: Diluted earnings per share is calculated by adjusting the weighted average number of equity shares outstanding during the period for assumed conversion of all dilutive potential equity shares. Employee share options are dilutive potential equity shares for the Company. The calculation is performed in respect of share options to determine the number of shares that could have been acquired at fair value (determined as the average market price of the Company’s shares during the period). The number of shares calculated as above is compared with the number of shares that would have been issued assuming the exercise of the share options.
Three months ended March 31,
Year ended March 31,
2016 2017 2016 2017
Profit attributable to equity holders of the Company………………………..………….…
` 22,380
` 22,611
` 89,075
` 84,895
Weighted average number of equity shares outstanding………………………..…………..
2,457,344,850
2,417,784,033
2,456,559,400
2,428,540,505
Effect of dilutive equivalent share options….. 5,393,183 7,063,072 5,130,508 7,133,064 Weighted average number of equity shares for diluted earnings per share… 2,462,738,033
2,424,847,105 2,461,689,908
2,435,673,569
Basic earnings per share…………………….... ` 9.09 ` 9.32 ` 36.18 ̀ 34.85
23. Employee benefits
a) Employee costs include: Three months ended
March 31, Year ended March 31,
2016 2017 2016 2017
Salaries and bonus………………………….... ` 61,561 ` 66,370 ` 237,949 ` 259,270 Employee benefit plans Gratuity……………………………………... 229 248 922 1,046
Contribution to provident and other funds…. 1,573 1,659 5,129 6,023 Share based compensation…………………... 385 470 1,534 1,742 ` 63,748 ` 68,747 ` 245,534 ̀ 268,081
b) The employee benefit cost is recognized in the following line items in the statement of income:
Three months ended
March 31, Year ended March 31,
2016 2017 2016 2017
Cost of revenues………………………… ` 53,779 ` 58,642 ` 207,747 ` 226,595 Selling and marketing expenses….……….. 6,143 6,014 23,663 26,051 General and administrative expenses…...… 3,826 4,091 14,124 15,435 ` 63,748 ` 68,747 ` 245,534 ` 268,081
The Company has granted Nil and 2,398,000 options under Restricted Stock Unit (“RSU”) option plan during the three months and year ended March 31, 2017 respectively (20,000 and 2,870,400 for the three months and year ended March 31, 2016) and Nil and 2,379,500 options under American Depository Shares (“ADS”) option plan during the three months and year ended March 31, 2017 respectively (Nil and 1,697,700 for the three months and year ended March 31, 2016).
24. Commitments and contingencies
Capital commitments: As at March 31, 2016 and 2017, the Company had committed to spend approximately ` 10,734 and ̀ 12,238 respectively, under agreements to purchase property and equipment. These amounts are net of capital advances paid in respect of these purchases.

28
Guarantees: As at March 31, 2016 and 2017, performance and financial guarantees provided by banks on behalf of the Company to the Indian Government, customers and certain other agencies amount to approximately ` 25,218 and ̀ 22,023 respectively, as part of the bank line of credit.
Contingencies and lawsuits: The Company is subject to legal proceedings and claims (including tax assessment orders/ penalty notices) which have arisen in the ordinary course of its business. Some of the claims involve complex issues and it is not possible to make a reasonable estimate of the expected financial effect, if any, that will result from ultimate resolution of such proceedings. However, the resolution of these legal proceedings is not likely to have a material and adverse effect on the results of operations or the financial position of the Company. The significant of such matters are discussed below.
In March 2004, the Company received a tax demand for year ended March 31, 2001 arising primarily on account of denial of deduction under section 10A of the Income Tax Act, 1961 (Act) in respect of profit earned by the Company’s undertaking in Software Technology Park at Bangalore. The same issue was repeated in the successive assessments for the years ended March 31, 2002 to March 31, 2011 and the aggregate demand is ̀ 47,583 (including interest of ` 13,832). The appeals filed against the said demand before the Appellate authorities have been allowed in favor of the Company by the second appellate authority for the years up to March 31, 2008. Further appeals have been filed by the Income tax authorities before the Hon’ble High Court. The Hon’ble High Court has heard and disposed-off majority of the issues in favor of the Company up to years ended March 31, 2004. Department has filed a Special Leave Petition (SLP) before the Supreme Court of India for the year ended March 31, 2001 to March 31, 2004.
On similar issues for years up to March 31, 2000, the Hon’ble High Court of Karnataka has upheld the claim of the Company under section 10A of the Act. For the year ended March 31, 2009, the appeals are pending before Income Tax Appellate Tribunal (Tribunal). For years ended March 31, 2010 and March 31, 2011, the Dispute Resolution Panel (DRP) allowed the claim of the Company under section 10A of the Act. The Income tax authorities have filed an appeal before the Tribunal.
The Company received the draft assessment order for the year ended March 31, 2012 in March 2016 with a proposed demand of ` 4,241 (including interest of ` 1,376). Based on the DRP’s direction, allowing majority of the issues in favor of the Company, the assessing officer has passed the final order with Nil demand. However, on similar issue for earlier years, the Income Tax authorities have appealed before the Tribunal.
For year ended March 31, 2013 the Company received the draft assessment order in December 2016 with a proposed demand of ` 4,118 (including interest of ` 1,278), arising primarily on account of section 10AA issues with respect to exclusion from Export Turnover. The Company has filed an objection before the DRP within the prescribed timelines.
Considering the facts and nature of disallowance and the order of the appellate authority / Hon’ble High Court of Karnataka upholding the claims of the Company for earlier years, the Company believes that the final outcome of the above disputes should be in favor of the Company and there should not be any material adverse impact on the financial statements.
The contingent liability in respect of disputed demands for excise duty, custom duty, sales tax and other matters amounts to ` 2,585 and ̀ 2,654 as of March 31, 2017 and 2016. However, the resolution of these legal proceedings is not likely to have a material and adverse effect on the results of operations or the financial position of the Company.
25. Segment information
The Company is organized by the following operating segments; IT Services and IT Products. IT Services: The IT Services segment primarily consists of IT Service offerings to customers organized by industry verticals. Effective April 1, 2016, The Company realigned its industry verticals. The Communication Service Provider business unit was regrouped from the former Global Media and Telecom (GMT) industry vertical into a new industry vertical named “Communications”. The Media business unit from the former GMT industry vertical has been realigned with the former Retail, Consumer, Transport and Government (RCTG) industry vertical which has been renamed as “Consumer Business Unit” industry vertical. Further, the Network Equipment Provider business unit of the former GMT industry vertical has been realigned with the Manufacturing industry vertical to form the “Manufacturing and Technology” industry vertical.

29
The revised industry verticals are as follows: Finance Solutions (BFSI), Healthcare, Lifesciences & Services (HLS), Consumer (CBU), Energy, Natural Resources & Utilities (ENU), Manufacturing & Technology (MNT) and Communications (COMM). IT Services segment also includes Others which comprises dividend income relating to strategic investments, which are presented within “Finance and other Income” in the statement of Income. Key service offerings to customers includes software application development and maintenance, research and development services for hardware and software design, business application services, analytics, consulting, infrastructure outsourcing services and business process services. Comparative information has been restated to give effect to the above changes.
IT Products: The Company is a value added reseller of desktops, servers, notebooks, storage products, networking solutions and packaged software for leading international brands. In certain total outsourcing contracts of the IT Services segment, the Company delivers hardware, software products and other related deliverables. Revenue relating to the above items is reported as revenue from the sale of IT Products. The Chairman and Managing Director of the Company has been identified as the Chief Operating Decision Maker (CODM) as defined by IFRS 8, “Operating Segments.” The Chairman of the Company evaluates the segments based on their revenue growth and operating income. Assets and liabilities used in the Company’s business are not identified to any of the operating segments, as these are used interchangeably between segments. Management believes that it is currently not practicable to provide segment disclosures relating to total assets and liabilities since a meaningful segregation of the available data is onerous. Information on reportable segment for the three months ended March 31, 2016 is as follows:
IT Services IT
Products Reconciling
Items Company
total BFSI HLS CBU ENU MNT COMM Others Total
Revenue 32,552 16,905 20,970 17,917 29,747 9,877 - 127,968 9,603 (154) 137,417 Other operating income - - - -
Segment Result 6,931 3,067 3,664 3,408 6,125 1,679 - 24,874 (325) (59) 24,490 Unallocated 305 - - 305 Segment Result Total 25,179 (325) (59) 24,795 Finance expense (1,284) Finance and other income 5,710
Profit before tax 29,221 Income tax expense (6,648) Profit for the period 22,573 Depreciation, amortization and impairment 4,304
Information on reportable segment for the three months ended March 31, 2017 is as follows:
IT Services IT
Products Reconciling
Items Company
total BFSI HLS CBU ENU MNT COMM Others Total
Revenue 34,911 20,456 21,204 17,515 30,657 9,278 - 134,021 6,613 (14) 140,620 Other operating income 4,082 - - 4,082
Segment Result 5,153 (11) 3,719 4,097 5,969 1,449 - 20,376 (428) (13) 19,935 Unallocated 811 - - 811 Segment Result Total 25,269 (428) (13) 24,828

30
Finance expense (1,053) Finance and other income 5,636
Profit before tax 29,411 Income tax expense (6,742) Profit for the period 22,669 Depreciation, amortization and impairment 8,181
Information on reportable segment for the year ended March 31, 2016 is as follows:
IT Services IT
Products Reconciling
Items Company
total BFSI HLS CBU ENU MNT COMM Others Total
Revenue 128,147 58,358 79,514 70,866 113,422 37,009 - 487,316 29,722 (731) 516,307 Other operating income - - - -
Segment Result 27,902 12,009 13,590 13,475 24,223 5,990 - 97,189 (1,007) (386) 95,796
Unallocated 1,064 - - 1,064 Segment Result Total 98,253 (1,007) (386) 96,860 Finance expense (5,582) Finance and other income 23,655
Profit before tax 114,933 Income tax expense (25,366) Profit for the period 89,567 Depreciation, amortization and impairment 14,965
Information on reportable segment for the year ended March 31, 2017 is as follows:
IT Services IT
Products Reconciling
Items Company
total BFSI HLS CBU ENU MNT COMM Others Total
Revenue 135,967 82,242 83,417 68,883 119,175 38,756 - 528,440 25,922 (183) 554,179 Other operating income 4,082 - - 4,082
Segment Result 24,939 9,479 14,493 14,421 23,453 6,149 - 92,934 (1,680) (506) 90,748 Unallocated (951) - - (951) Segment Result Total 96,065 (1,680) (506) 93,879 Finance expense (5,183) Finance and other income 21,660
Profit before tax 110,356 Income tax expense (25,213) Profit for the period 85,143 Depreciation, amortization and impairment 23,107
The Company has four geographic segments: India, Americas, Europe and Rest of the world. Revenues from the geographic segments based on domicile of the customer are as follows:

31
Three months ended
March 31 Year ended March 31
2016 2017 2016 2017
India………………………..………………….. ` 13,869 ` 11,000 ` 51,371 ` 46,555 Americas……………………............................ 67,909 73,888 258,615 290,719 Europe………………………..……………….. 34,473 34,929 126,417 133,909 Rest of the world……………………………… 21,166 20,803 79,904 82,996 ` 137,417 ` 140,620 ` 516,307 ` 554,179
Management believes that it is currently not practicable to provide disclosure of geographical location wise assets, since the meaningful segregation of the available information is onerous. No client individually accounted for more than 10% of the revenues during the year ended March 31, 2016 and 2017. Notes:
a) Effective April 1, 2016, CODM’s review of the segment results is measured after including the amortization and impairment charge for acquired intangibles to the respective segments. Such costs were classified under reconciling items till the year ended March 31, 2016. Comparative information has been restated to give effect to the same.
b) “Reconciling items” includes dividend income/ gains/ losses relating to strategic investments, elimination of inter-segment transactions and other corporate activities.
c) Segment result represents operating profits of the segments and dividend income relating to strategic investments, which are presented within “Finance and other income” in the statement of Income.
d) Revenue from sale of traded cloud based licenses is reported as part of IT Services revenues. e) For the purpose of segment reporting, the Company has included the impact of “foreign exchange gains
/ (losses), net” in revenues (which is reported as a part of operating profit in the statement of income). f) For evaluating performance of the individual operating segments, stock compensation expense is
allocated on the basis of straight line amortization. The differential impact of accelerated amortization of stock compensation expense over stock compensation expense allocated to the individual operating segments is reported in reconciling items.
g) The Company generally offers multi-year payment terms in certain total outsourcing contracts. These payment terms primarily relate to IT hardware, software and certain transformation services in outsourcing contracts. The finance income on deferred consideration earned under these contracts is included in the revenue of the respective segment and is eliminated under reconciling items.
h) Segment result of HLS industry vertical is after considering the impact of impairment charge recorded on certain intangible assets recognised on acquisitions. Also refer note 6.
i) Net gain from sale of EcoEnergy division is included as part of IT Services segment result.

32
26. List of subsidiaries as of March 31, 2017 are provided in the table below.
Subsidiaries Subsidiaries Subsidiaries Country of Incorporation
Wipro LLC USA Wipro Gallagher Solutions,
Inc. Opus Capital Markets Consultants LLC
USA USA
Wipro Promax Analytics Solutions LLC
USA
Infocrossing, Inc. USA Wipro Insurance Solutions
LLC Wipro Data Centre and Cloud Services, Inc. Wipro IT Services, Inc.
USA USA USA
HPH Holdings Corp. (A) USA
Appirio, Inc. (A) USA
Wipro Overseas IT Services Pvt. Ltd
India
Wipro Japan KK Japan Wipro Shanghai Limited China Wipro Trademarks Holding Limited
India
Wipro Travel Services Limited India Wipro Holdings (Mauritius) Limited
Mauritius
Wipro Holdings UK Limited U.K. Wipro Information Technology
Austria GmbH(A) Wipro Digital Aps (A)
Austria Denmark
Wipro Europe Limited U.K. Wipro Financial Services UK
Limited (formerly Wipro Promax Analytics Solutions (Europe) Limited
U.K.
Wipro Cyprus Private Limited Cyprus Wipro Doha LLC# Qatar Wipro Technologies S.A DE
C.V Mexico
Wipro BPO Philippines LTD. Inc
Philippines
Wipro Holdings Hungary Korlátolt Felelősségű Társaság
Hungary
Wipro Holdings Investment Korlátolt Felelősségű Társaság
Hungary
Wipro Technologies SA Argentina Wipro Information Technology
Egypt SAE Egypt
Wipro Arabia Co. Limited Saudi Arabia Wipro Poland Sp. Z.o.o Poland Wipro IT Services Poland
Sp. z o. o Poland
Wipro Technologies Australia Pty Ltd.
Australia
Wipro Corporate Technologies Ghana Limited
Ghana

33
Subsidiaries Subsidiaries Subsidiaries Country of Incorporation
Wipro Technologies South Africa (Proprietary) Limited
South Africa
Wipro IT Services Ukraine LLC
Wipro Technologies Nigeria Limited
Nigeria Ukraine
Wipro Information Technology Netherlands BV.
Netherlands
Wipro Portugal S.A.(A) Portugal Wipro Technologies Limited,
Russia Russia
Wipro Technology Chile SPA Chile Wipro Solutions Canada
Limited Canada
Wipro Information Technology Kazakhstan LLP
Kazakhstan
Wipro Technologies W.T. Sociedad Anonima Wipro Outsourcing Services (Ireland) Limited Wipro Technologies Norway AS Wipro Technologies VZ, C.A.
Costa Rica Ireland Norway Venezuela
Wipro Technologies Peru S.A.C
Peru
Wipro Technologies SRL Romania PT WT Indonesia Indonesia Wipro Australia Pty Limited Australia Wipro (Thailand) Co Limited Thailand Wipro Bahrain Limited WLL Bahrain Wipro Gulf LLC Sultanate of
Oman Rainbow Software LLC Iraq Cellent GmbH
Cellent Mittelstandsberatung GmbH Cellent Gmbh(A)
Germany Germany Austria
Wipro Networks Pte Limited Wipro (Dalian) Limited
Singapore China
Wipro Technologies SDN BHD
Malaysia
Wipro Chengdu Limited China Wipro Airport IT Services Limited*
India
Appirio India Cloud Solutions Private Limited
India
*All the above direct subsidiaries are 100% held by the Company except that the Company holds 66.67% of the equity securities of Wipro Arabia Limited Co and 74% of the equity securities of Wipro Airport IT Services Limited
# 51% of equity securities of Wipro Doha LLC are held by a local share holder. However, the beneficial interest in these holdings is with the Company.
The Company controls ‘The Wipro SA Broad Based Ownership Scheme Trust’ and ‘Wipro SA Broad Based Ownership Scheme SPV (RF) (PTY) LTD incorporated in South Africa.

34
(A) Step Subsidiary details of Wipro Information Technology Austria GmbH, Wipro Europe Limited, Wipro Portugal S.A, Wipro Digital Aps, Cellent Gmbh, HPH Holdings Corp. and Appirio, Inc. are as follows:
Subsidiaries Subsidiaries Subsidiaries Subsidiaries Country of
Incorporation Wipro Information Technology Austria GmbH
Austria
Wipro Technologies Austria GmbH
Austria
New Logic Technologies SARL
France
Wipro Europe Limited
U.K.
Wipro UK Limited U.K. Wipro Portugal S.A. Portugal Wipro Retail UK Limited U.K.
Wipro do Brasil Technologia Ltda
Brazil
Wipro Technologies Gmbh
Germany
Wipro Do Brasil Sistemetas De Informatica Ltd
Brazil
Wipro Digital Aps Designit A/S
Designit Denmark A/S Designit MunchenGmbH Designit Oslo A/S Designit Sweden AB Designit T.L.V Ltd. Designit Tokyo Ltd. Denextep Spain Digital, S.L
Denmark Denmark Denmark Germany Norway Sweden Israel Japan Spain
Designit Colombia S A S
Colombia
Designit Peru S.A.C. Peru Cellent GmbH
Frontworx Informationstechnologie Gmbh
Austria Austria
HPH Holdings Corp. Healthplan Services Insurance Agency, Inc. Healthplan Services, Inc.
USA USA USA
Appirio, Inc. Appirio K.K. Topcoder, Inc. Appirio Ltd Appirio Pvt Ltd KI Management Inc.
Appirio GmbH Appirio Ltd (UK) Saaspoint, Inc.
USA Japan USA Ireland Germany UK USA Singapore USA
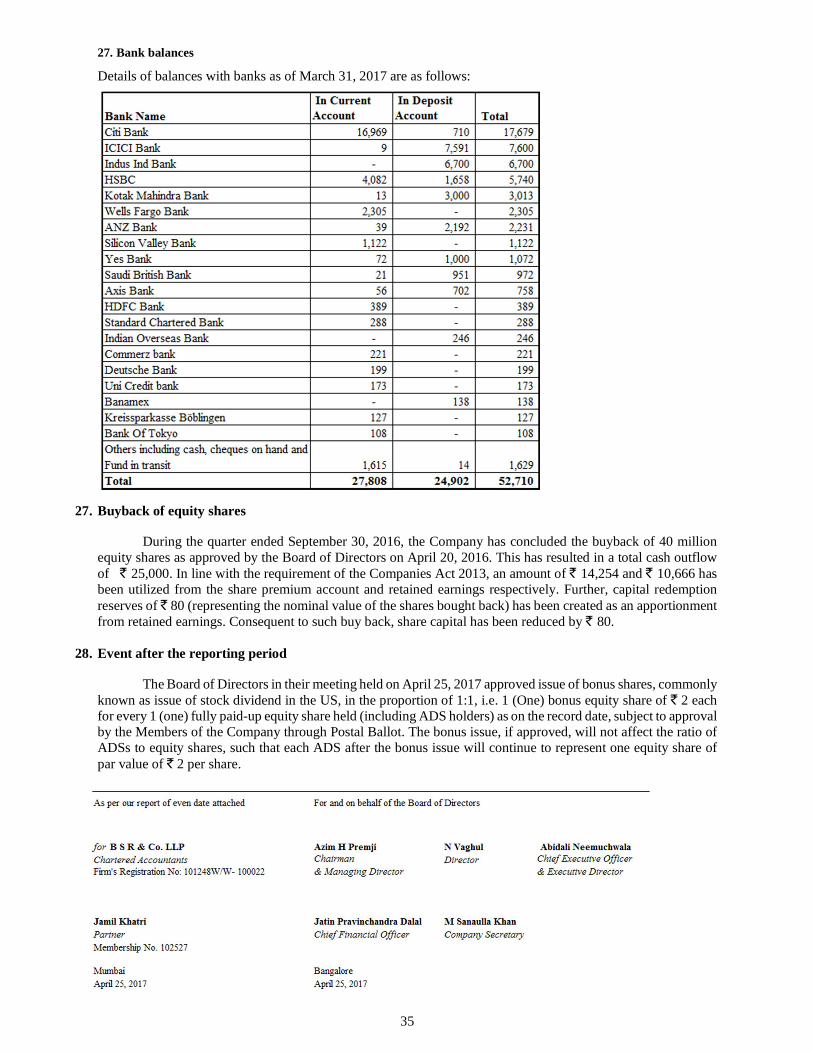
35
27. Bank balances
Details of balances with banks as of March 31, 2017 are as follows:
27. Buyback of equity shares
During the quarter ended September 30, 2016, the Company has concluded the buyback of 40 million equity shares as approved by the Board of Directors on April 20, 2016. This has resulted in a total cash outflow of ̀ 25,000. In line with the requirement of the Companies Act 2013, an amount of ` 14,254 and ̀ 10,666 has been utilized from the share premium account and retained earnings respectively. Further, capital redemption reserves of ̀ 80 (representing the nominal value of the shares bought back) has been created as an apportionment from retained earnings. Consequent to such buy back, share capital has been reduced by ` 80.
28. Event after the reporting period
The Board of Directors in their meeting held on April 25, 2017 approved issue of bonus shares, commonly known as issue of stock dividend in the US, in the proportion of 1:1, i.e. 1 (One) bonus equity share of ` 2 each for every 1 (one) fully paid-up equity share held (including ADS holders) as on the record date, subject to approval by the Members of the Company through Postal Ballot. The bonus issue, if approved, will not affect the ratio of ADSs to equity shares, such that each ADS after the bonus issue will continue to represent one equity share of par value of ̀ 2 per share.


