24
© 2012 WIPRO LTD | WWW.WIPRO.COM 1 Wipro – Presentation to Investors April – June, 2013
© 2012 WIPRO LTD | WWW.WIPRO.COM1
Wipro – Presentation to Investors
April – June, 2013
© 2012 WIPRO LTD | WWW.WIPRO.COM2
Safe Harbor
This presentation may contain certain “forward looking” statements, which
involve a number of risks, uncertainties and other factors that could cause
actual results to differ materially from those that may be projected by these
forward looking statements. These uncertainties have been detailed in the
reports filed by Wipro with the Securities and Exchange Commission and
these filings are available at www.sec.gov. This presentation also contains
references to findings of various reports available in the public domain.
Wipro makes no representation as to their accuracy or that the company
subscribes to those findings.
© 2012 WIPRO LTD | WWW.WIPRO.COM3
Agenda
Our track record on performance
Overall Market Opportunity
Our Strategy
Demerger Scheme
© 2012 WIPRO LTD | WWW.WIPRO.COM4
Track Record on Performance
© 2012 WIPRO LTD | WWW.WIPRO.COM5
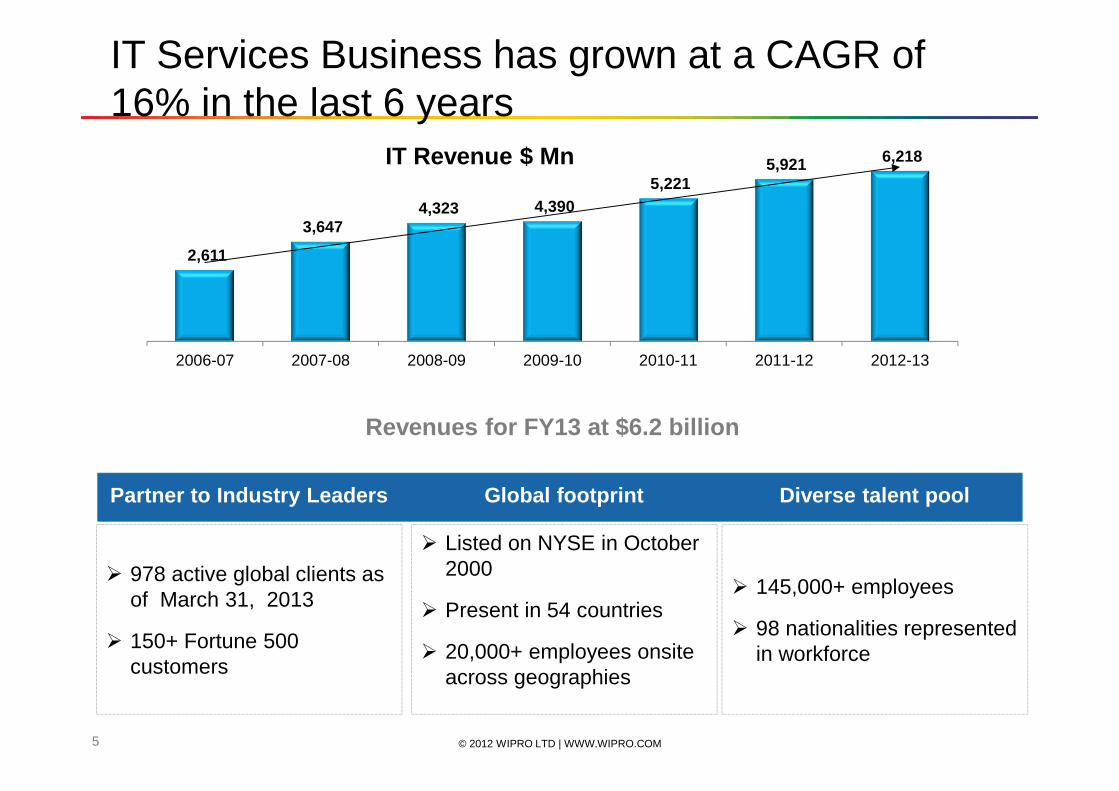
IT Services Business has grown at a CAGR of 16% in the last 6 years
� 978 active global clients as of March 31, 2013
� 150+ Fortune 500 customers
� Listed on NYSE in October 2000
� Present in 54 countries
� 20,000+ employees onsite across geographies
� 145,000+ employees
� 98 nationalities represented in workforce
Partner to Industry Leaders Global footprint Diverse talent pool
Revenues for FY13 at $6.2 billion
2,611
3,647 4,323 4,390
5,221 5,921 6,218
2006-07 2007-08 2008-09 2009-10 2010-11 2011-12 2012-13
IT Revenue $ Mn
© 2012 WIPRO LTD | WWW.WIPRO.COM6
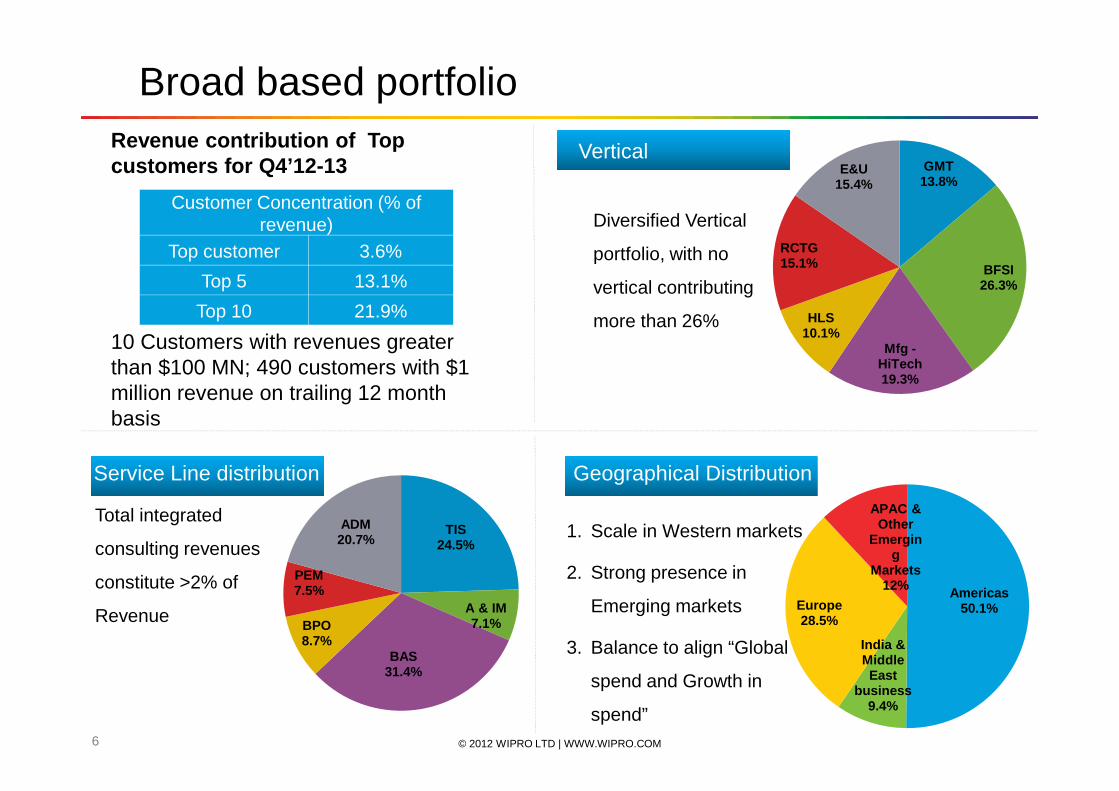
Broad based portfolio
Customer Concentration (% ofrevenue)
Top customer 3.6%
Top 5 13.1%
Top 10 21.9%
10 Customers with revenues greater than $100 MN; 490 customers with $1 million revenue on trailing 12 month basis
Revenue contribution of Top customers for Q4’12-13
Diversified Vertical
portfolio, with no
vertical contributing
more than 26%
Vertical
Total integrated
consulting revenues
constitute >2% of
Revenue
Service Line distribution
1. Scale in Western markets
2. Strong presence in
Emerging markets
3. Balance to align “Global
spend and Growth in
spend”
Geographical DistributionAPAC and emerging markets 9 %
America 52%
India & Middle East 10%
Europe 28%
GMT13.8%
BFSI26.3%
Mfg -HiTech19.3%
HLS10.1%
RCTG15.1%
E&U15.4%
Americas50.1%
India & Middle East
business9.4%
Europe28.5%
APAC & Other
Emerging
Markets12%
TIS24.5%
A & IM7.1%
BAS31.4%
BPO8.7%
PEM7.5%
ADM20.7%
© 2012 WIPRO LTD | WWW.WIPRO.COM7
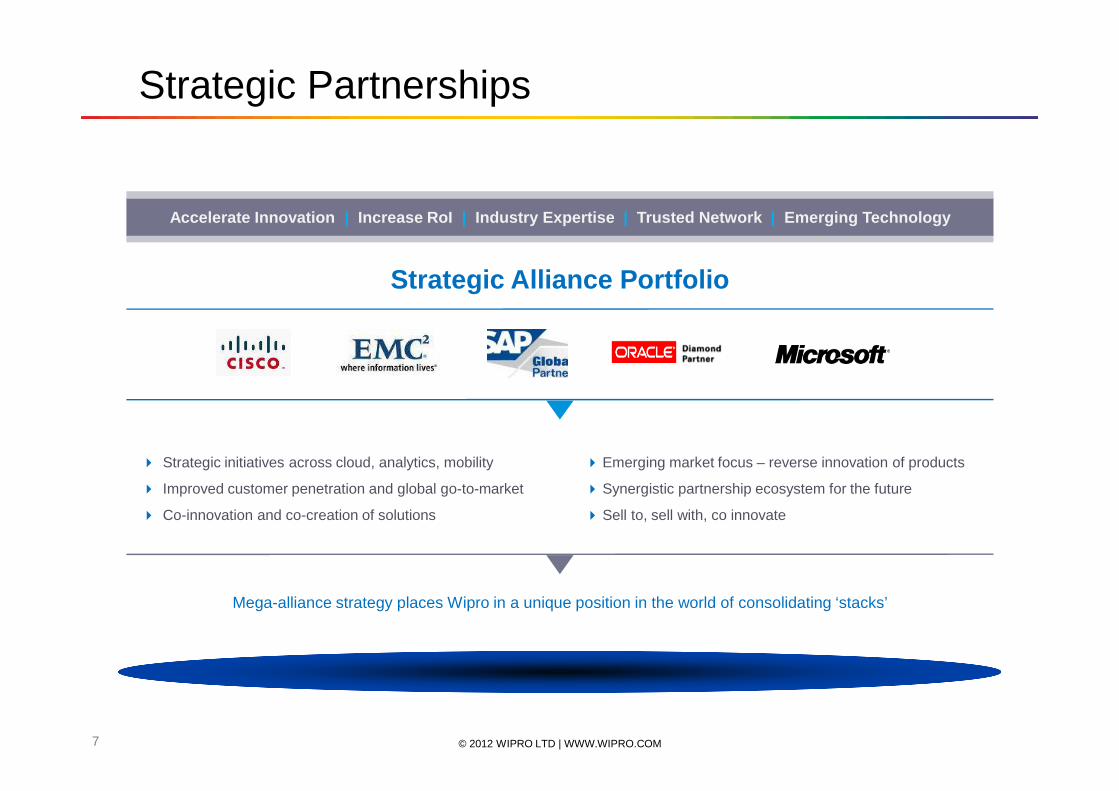
Accelerate Innovation | Increase RoI | Industry Expertise | Trusted Network | Emerging Technology
Strategic Partnerships
Strategic Alliance Portfolio
Mega-alliance strategy places Wipro in a unique position in the world of consolidating ‘stacks’
� Strategic initiatives across cloud, analytics, mobility
� Improved customer penetration and global go-to-market
� Co-innovation and co-creation of solutions
� Emerging market focus – reverse innovation of products
� Synergistic partnership ecosystem for the future
� Sell to, sell with, co innovate
© 2012 WIPRO LTD | WWW.WIPRO.COM8
Overall Market Opportunity
© 2012 WIPRO LTD | WWW.WIPRO.COM9
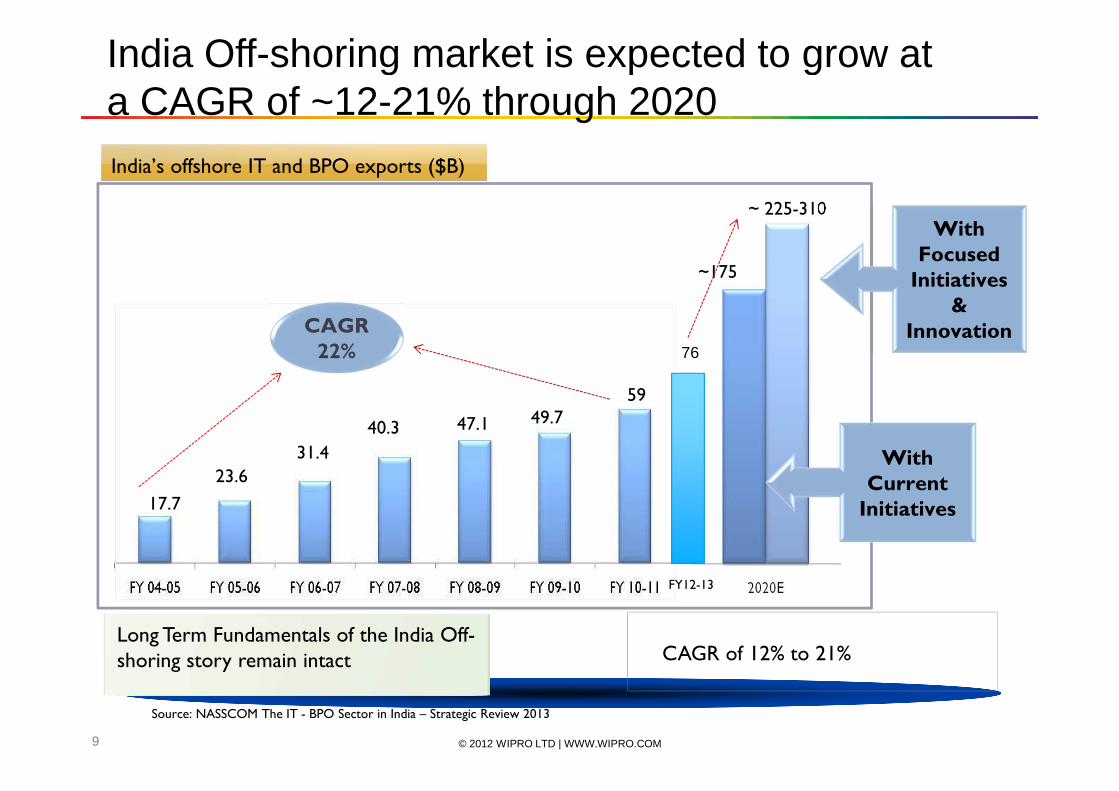
India Off-shoring market is expected to grow at a CAGR of ~12-21% through 2020
~ 225-310
~175
India’s offshore IT and BPO exports ($B)
With
Focused
Initiatives
&
Innovation
With
Current
Initiatives
CAGR of 12% to 21%
Source: NASSCOM The IT - BPO Sector in India – Strategic Review 2013
Long Term Fundamentals of the India Off-shoring story remain intact
23.6
17.7
31.4
40.3
59
47.1 49.7
CAGR
22%
FY12-13
76
© 2012 WIPRO LTD | WWW.WIPRO.COM10
Our Strategy
© 2012 WIPRO LTD | WWW.WIPRO.COM11
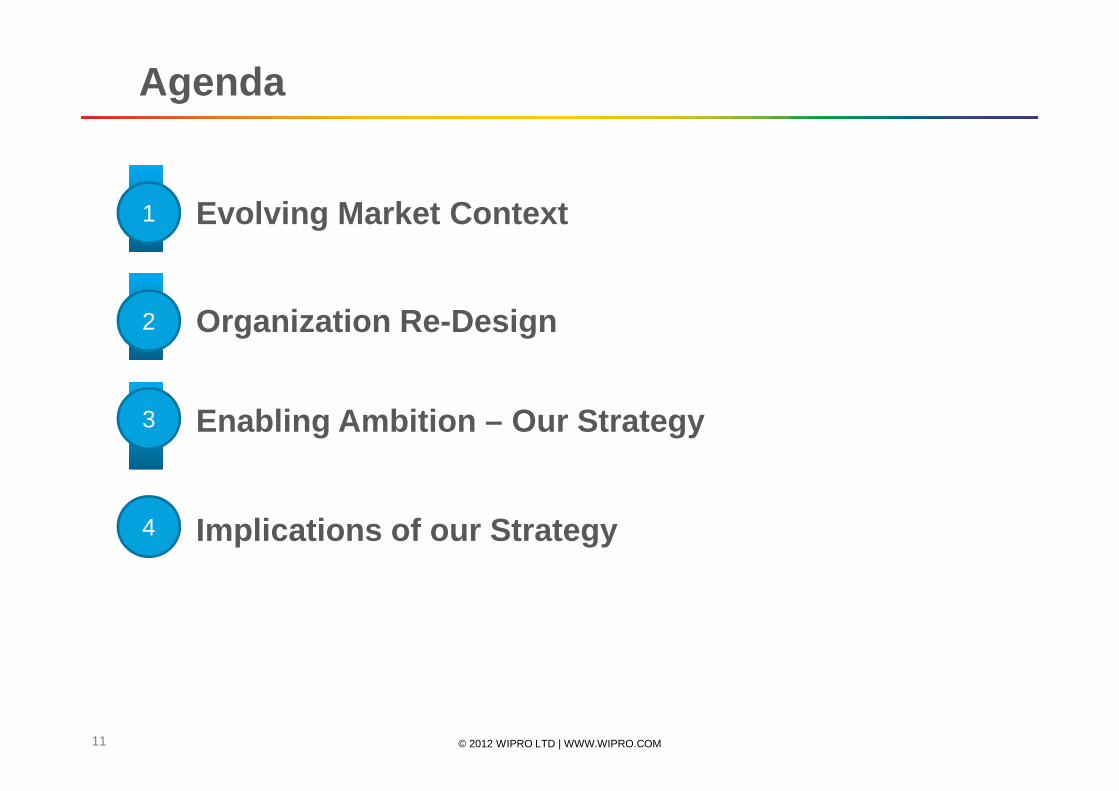
Agenda
Evolving Market Context
Organization Re-Design
Enabling Ambition – Our Strategy
Implications of our Strategy
1
2
3
4
© 2012 WIPRO LTD | WWW.WIPRO.COM12
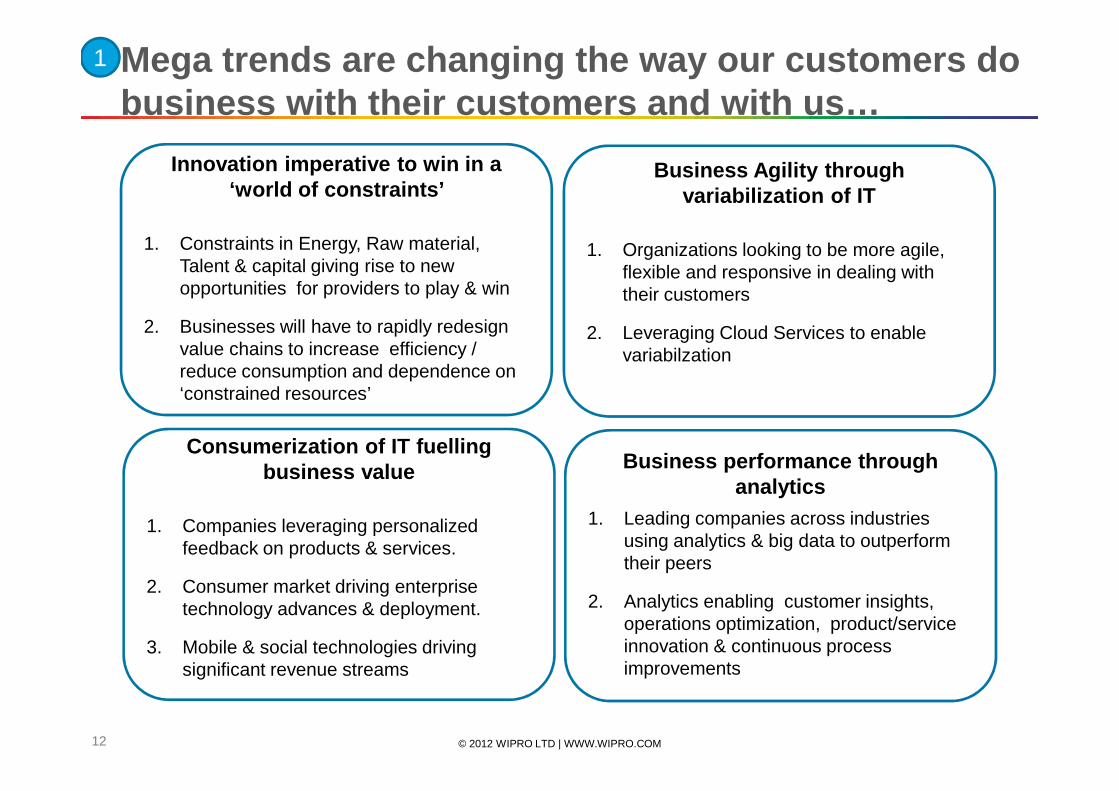
Innovation imperative to win in a ‘world of constraints’
1. Constraints in Energy, Raw material, Talent & capital giving rise to new opportunities for providers to play & win
2. Businesses will have to rapidly redesign value chains to increase efficiency / reduce consumption and dependence on ‘constrained resources’
Business Agility through variabilization of IT
1. Organizations looking to be more agile, flexible and responsive in dealing with their customers
2. Leveraging Cloud Services to enable variabilzation
Consumerization of IT fuelling business value
1. Companies leveraging personalized feedback on products & services.
2. Consumer market driving enterprise technology advances & deployment.
3. Mobile & social technologies driving significant revenue streams
Business performance through analytics
1. Leading companies across industries using analytics & big data to outperform their peers
2. Analytics enabling customer insights, operations optimization, product/service innovation & continuous process improvements
Mega trends are changing the way our customers do business with their customers and with us…
1
© 2012 WIPRO LTD | WWW.WIPRO.COM13
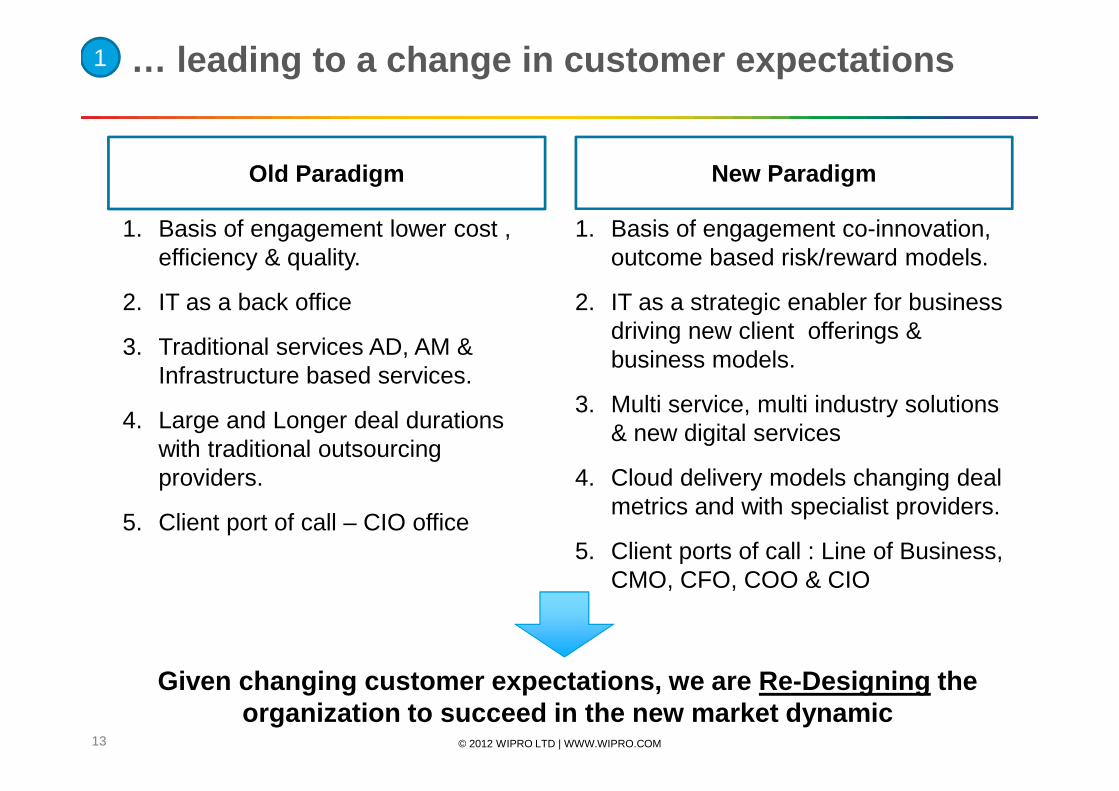
Old Paradigm New Paradigm
1. Basis of engagement lower cost , efficiency & quality.
2. IT as a back office
3. Traditional services AD, AM & Infrastructure based services.
4. Large and Longer deal durations with traditional outsourcing providers.
5. Client port of call – CIO office
1. Basis of engagement co-innovation, outcome based risk/reward models.
2. IT as a strategic enabler for business driving new client offerings & business models.
3. Multi service, multi industry solutions & new digital services
4. Cloud delivery models changing deal metrics and with specialist providers.
5. Client ports of call : Line of Business, CMO, CFO, COO & CIO
Given changing customer expectations, we are Re-Des igning the organization to succeed in the new market dynamic
… leading to a change in customer expectations1
© 2012 WIPRO LTD | WWW.WIPRO.COM14
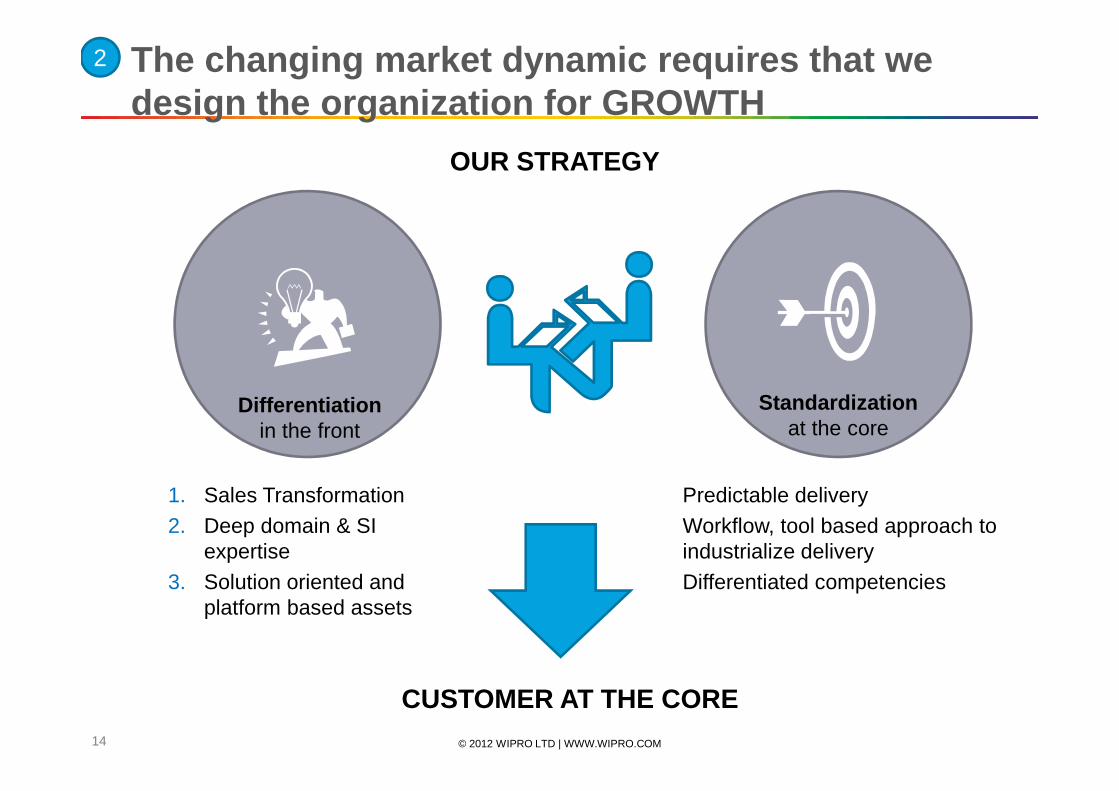
The changing market dynamic requires that we design the organization for GROWTH
2
Standardizationat the core
Differentiationin the front
Predictable deliveryWorkflow, tool based approach to industrialize deliveryDifferentiated competencies
CUSTOMER AT THE CORE
1. Sales Transformation2. Deep domain & SI
expertise3. Solution oriented and
platform based assets
OUR STRATEGY
© 2012 WIPRO LTD | WWW.WIPRO.COM15
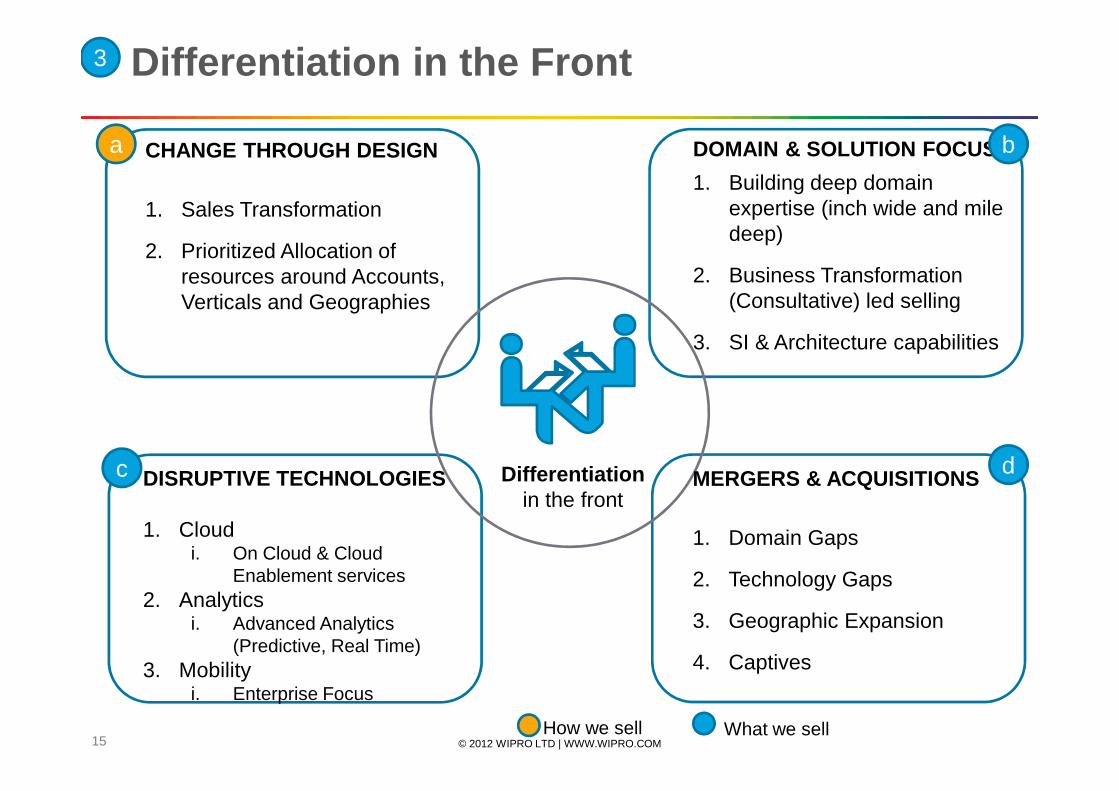
Differentiationin the front
CHANGE THROUGH DESIGN
1. Sales Transformation
2. Prioritized Allocation of resources around Accounts, Verticals and Geographies
DOMAIN & SOLUTION FOCUS
1. Building deep domain expertise (inch wide and mile deep)
2. Business Transformation (Consultative) led selling
3. SI & Architecture capabilities
MERGERS & ACQUISITIONS
1. Domain Gaps
2. Technology Gaps
3. Geographic Expansion
4. Captives
DISRUPTIVE TECHNOLOGIES
1. Cloudi. On Cloud & Cloud
Enablement services2. Analytics
i. Advanced Analytics (Predictive, Real Time)
3. Mobilityi. Enterprise Focus
a
c d
b
How we sell What we sell
Differentiation in the Front3
© 2012 WIPRO LTD | WWW.WIPRO.COM16
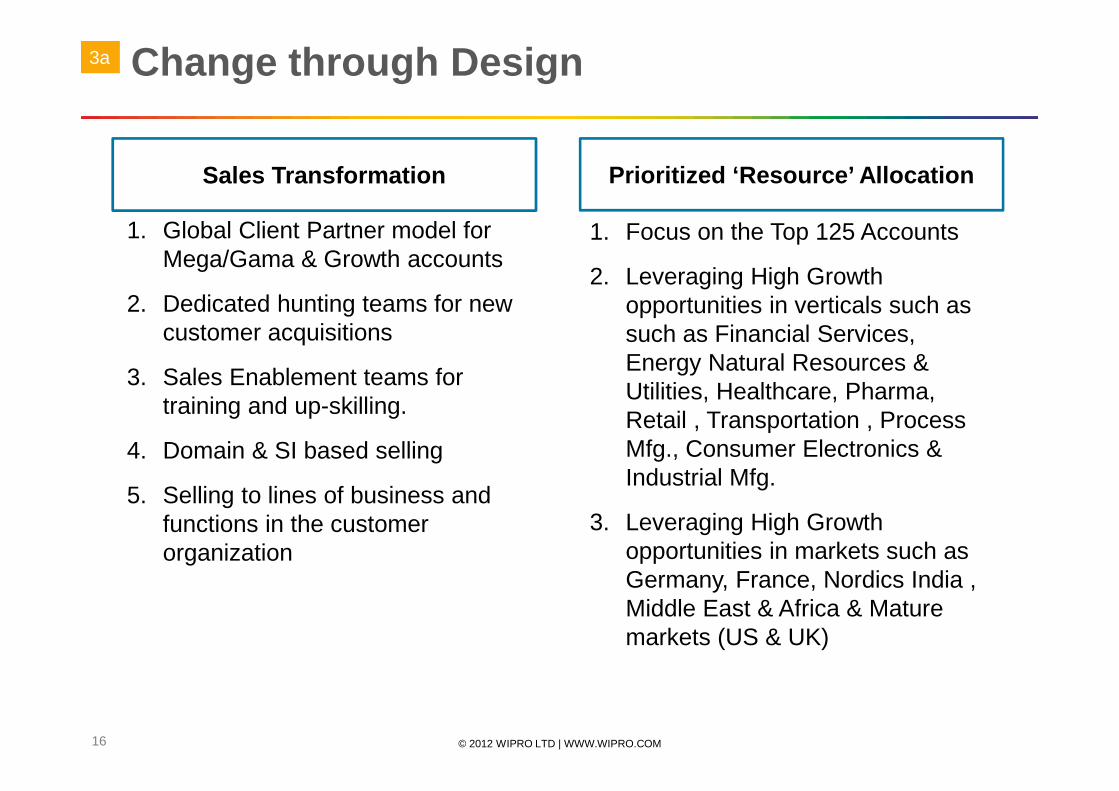
Sales Transformation Prioritized ‘Resource’ Allocation
1. Global Client Partner model for Mega/Gama & Growth accounts
2. Dedicated hunting teams for new customer acquisitions
3. Sales Enablement teams for training and up-skilling.
4. Domain & SI based selling
5. Selling to lines of business and functions in the customer organization
1. Focus on the Top 125 Accounts
2. Leveraging High Growth opportunities in verticals such as such as Financial Services, Energy Natural Resources & Utilities, Healthcare, Pharma, Retail , Transportation , Process Mfg., Consumer Electronics & Industrial Mfg.
3. Leveraging High Growth opportunities in markets such as Germany, France, Nordics India , Middle East & Africa & Mature markets (US & UK)
Change through Design3a
© 2012 WIPRO LTD | WWW.WIPRO.COM17
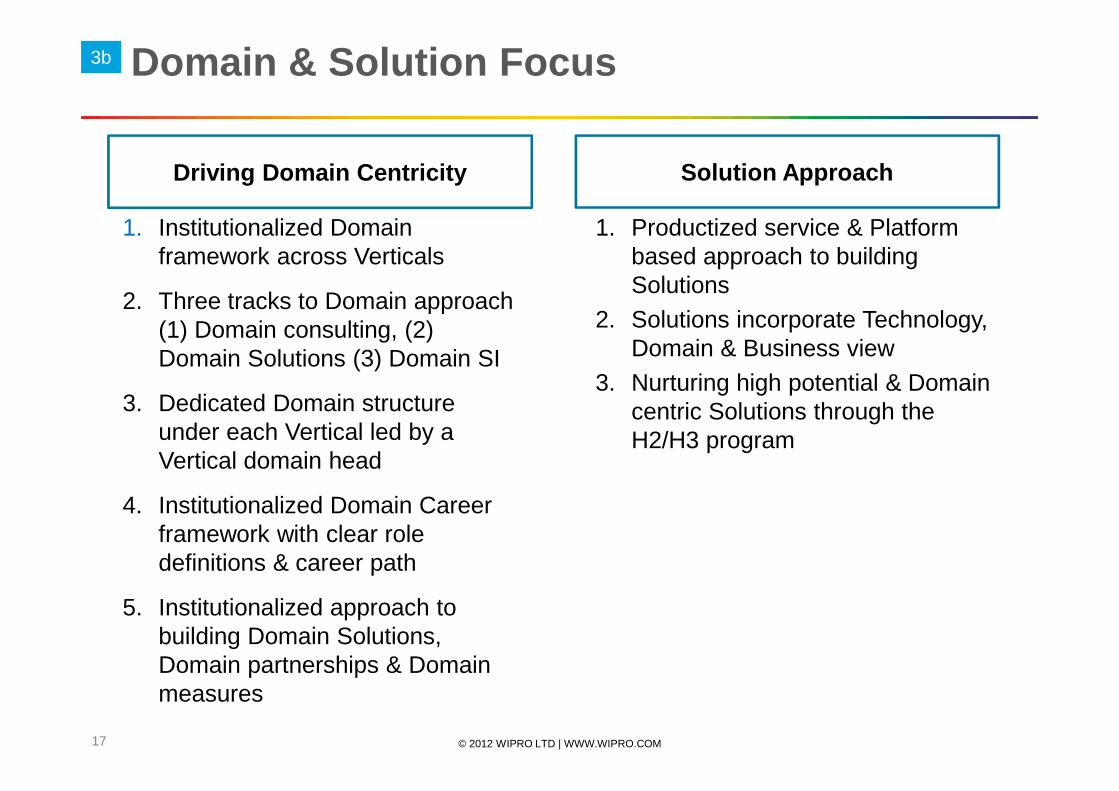
Driving Domain Centricity Solution Approach
1. Institutionalized Domain framework across Verticals
2. Three tracks to Domain approach (1) Domain consulting, (2) Domain Solutions (3) Domain SI
3. Dedicated Domain structure under each Vertical led by a Vertical domain head
4. Institutionalized Domain Career framework with clear role definitions & career path
5. Institutionalized approach to building Domain Solutions, Domain partnerships & Domain measures
1. Productized service & Platform based approach to building Solutions
2. Solutions incorporate Technology, Domain & Business view
3. Nurturing high potential & Domain centric Solutions through the H2/H3 program
Domain & Solution Focus 3a3b
© 2012 WIPRO LTD | WWW.WIPRO.COM18
Cloud
AnalyticsMobility
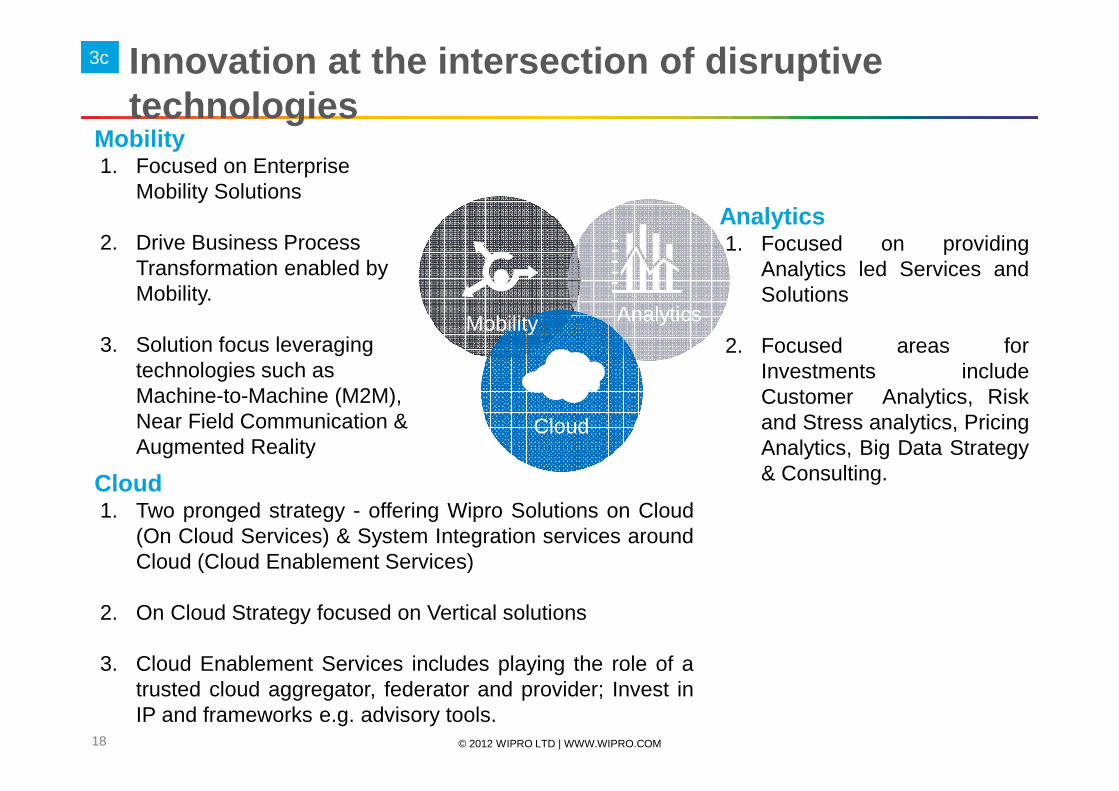
Analytics1. Focused on providing
Analytics led Services andSolutions
2. Focused areas forInvestments includeCustomer Analytics, Riskand Stress analytics, PricingAnalytics, Big Data Strategy& Consulting.Cloud
1. Two pronged strategy - offering Wipro Solutions on Cloud(On Cloud Services) & System Integration services aroundCloud (Cloud Enablement Services)
2. On Cloud Strategy focused on Vertical solutions
3. Cloud Enablement Services includes playing the role of atrusted cloud aggregator, federator and provider; Invest inIP and frameworks e.g. advisory tools.
Mobility1. Focused on Enterprise
Mobility Solutions
2. Drive Business Process Transformation enabled by Mobility.
3. Solution focus leveraging technologies such as Machine-to-Machine (M2M), Near Field Communication & Augmented Reality
Innovation at the intersection of disruptive technologies
3c3c
© 2012 WIPRO LTD | WWW.WIPRO.COM19
M&A focus
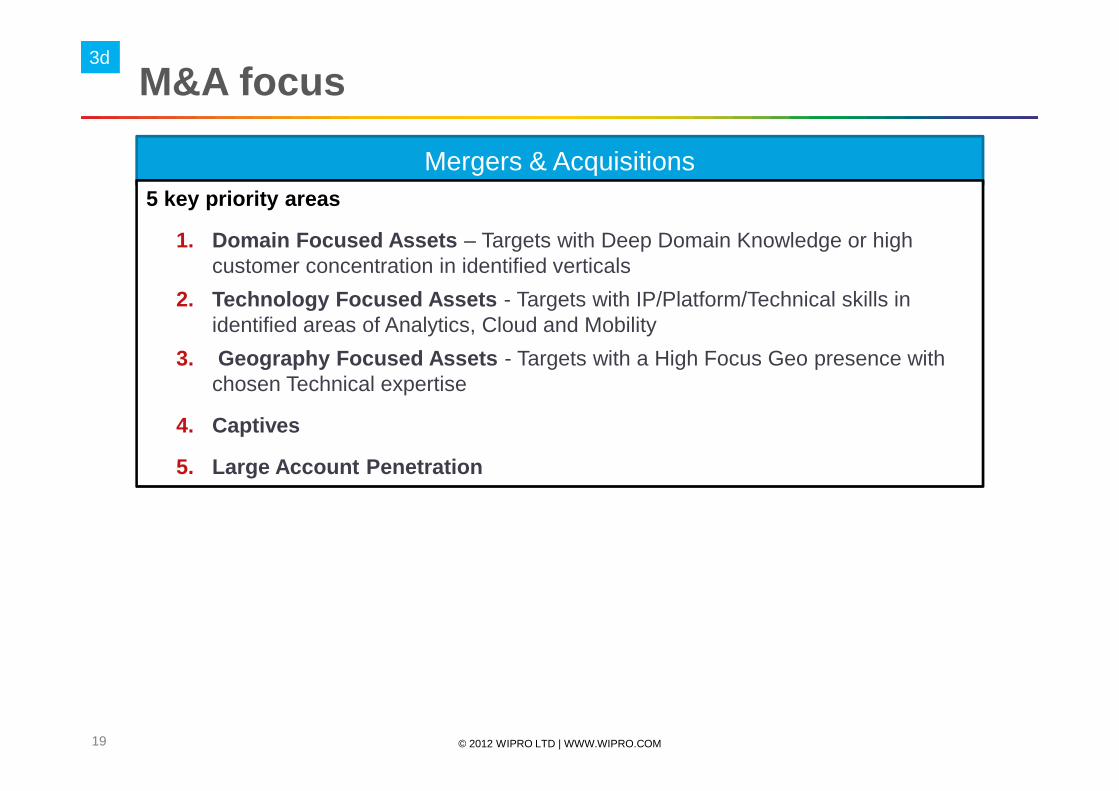
Mergers & Acquisitions5 key priority areas
1. Domain Focused Assets – Targets with Deep Domain Knowledge or high customer concentration in identified verticals
2. Technology Focused Assets - Targets with IP/Platform/Technical skills in identified areas of Analytics, Cloud and Mobility
3. Geography Focused Assets - Targets with a High Focus Geo presence with chosen Technical expertise
4. Captives
5. Large Account Penetration
3d
© 2012 WIPRO LTD | WWW.WIPRO.COM20
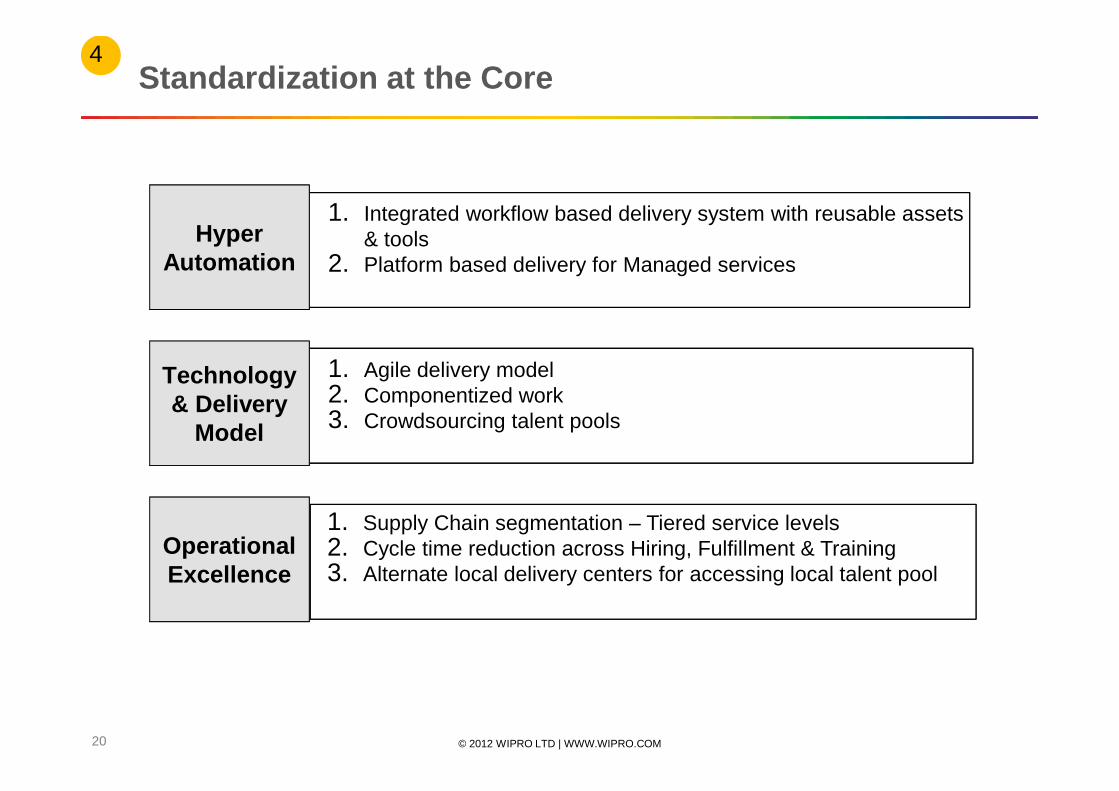
Standardization at the Core
Hyper Automation
Technology & Delivery
Model
Operational Excellence
4
1. Integrated workflow based delivery system with reusable assets & tools
2. Platform based delivery for Managed services
1. Agile delivery model2. Componentized work3. Crowdsourcing talent pools
1. Supply Chain segmentation – Tiered service levels2. Cycle time reduction across Hiring, Fulfillment & Training3. Alternate local delivery centers for accessing local talent pool
© 2012 WIPRO LTD | WWW.WIPRO.COM21
Annexure - Key Highlights of IT and Other Businesse s
© 2012 WIPRO LTD | WWW.WIPRO.COM22
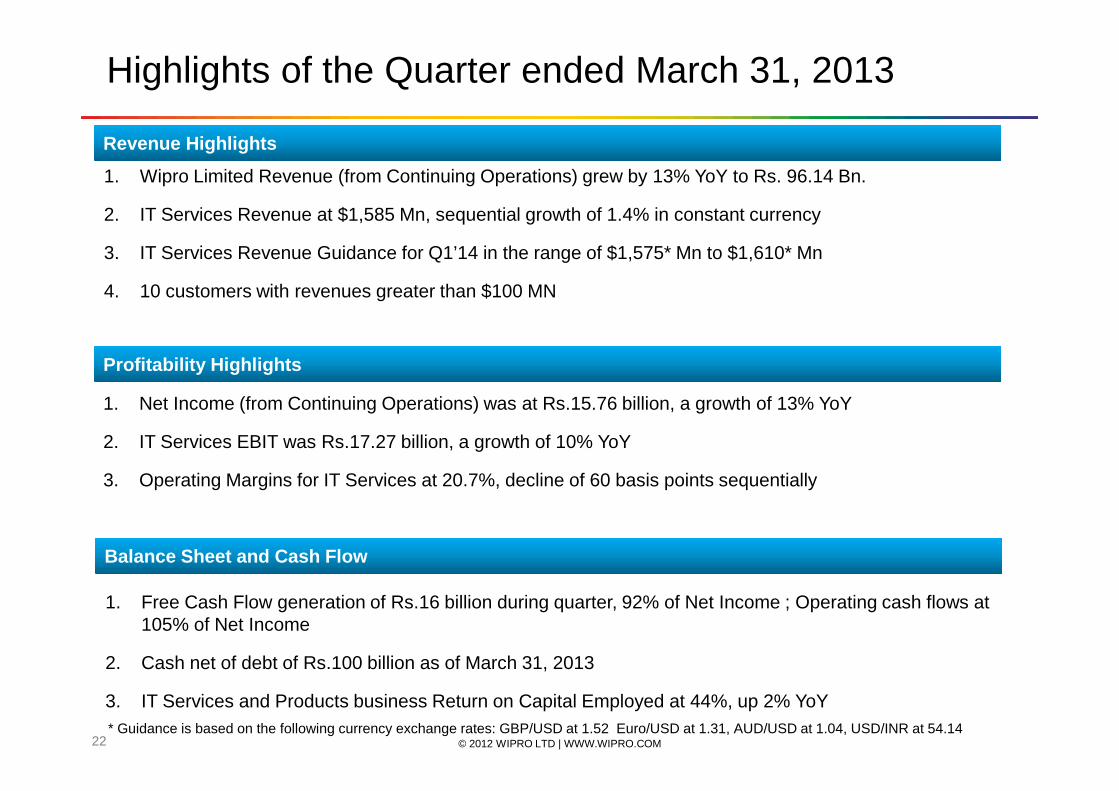
Highlights of the Quarter ended March 31, 2013
Revenue Highlights
1. Wipro Limited Revenue (from Continuing Operations) grew by 13% YoY to Rs. 96.14 Bn.
2. IT Services Revenue at $1,585 Mn, sequential growth of 1.4% in constant currency
3. IT Services Revenue Guidance for Q1’14 in the range of $1,575* Mn to $1,610* Mn
4. 10 customers with revenues greater than $100 MN
Profitability Highlights
1. Net Income (from Continuing Operations) was at Rs.15.76 billion, a growth of 13% YoY
2. IT Services EBIT was Rs.17.27 billion, a growth of 10% YoY
3. Operating Margins for IT Services at 20.7%, decline of 60 basis points sequentially
Balance Sheet and Cash Flow
1. Free Cash Flow generation of Rs.16 billion during quarter, 92% of Net Income ; Operating cash flows at 105% of Net Income
2. Cash net of debt of Rs.100 billion as of March 31, 2013
3. IT Services and Products business Return on Capital Employed at 44%, up 2% YoY* Guidance is based on the following currency exchange rates: GBP/USD at 1.52 Euro/USD at 1.31, AUD/USD at 1.04, USD/INR at 54.14
© 2012 WIPRO LTD | WWW.WIPRO.COM23
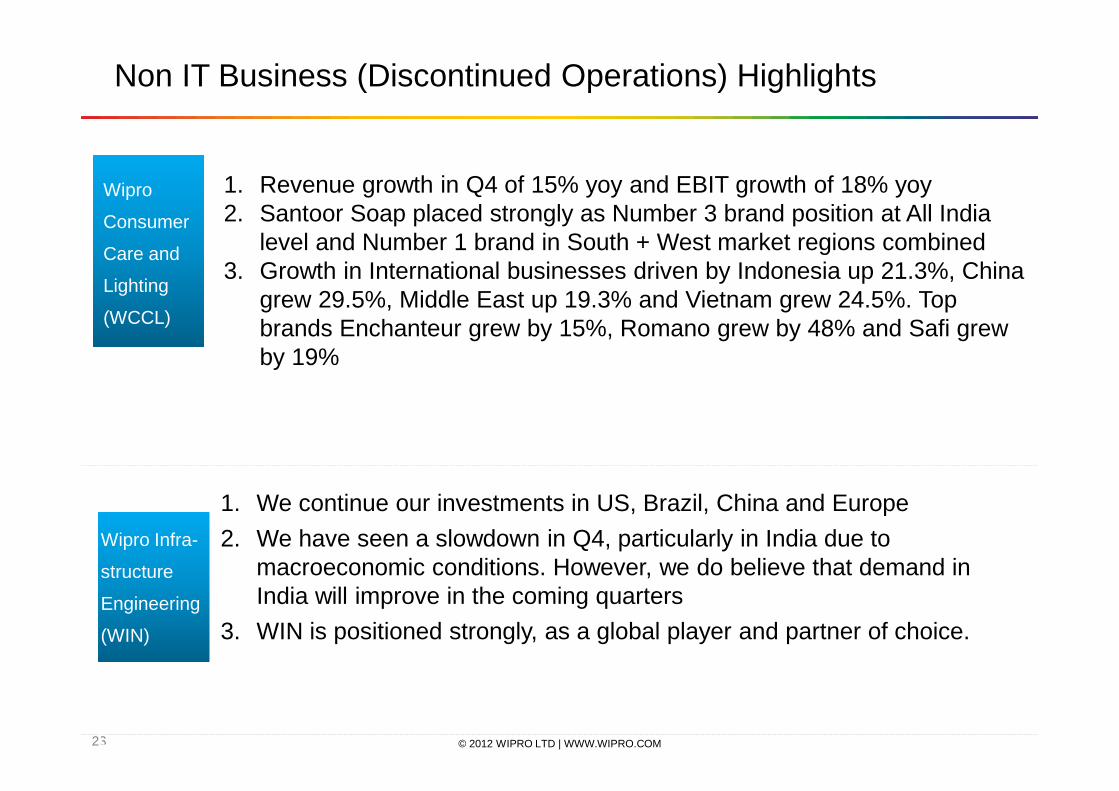
Non IT Business (Discontinued Operations) Highlights
1. Revenue growth in Q4 of 15% yoy and EBIT growth of 18% yoy2. Santoor Soap placed strongly as Number 3 brand position at All India
level and Number 1 brand in South + West market regions combined3. Growth in International businesses driven by Indonesia up 21.3%, China
grew 29.5%, Middle East up 19.3% and Vietnam grew 24.5%. Top brands Enchanteur grew by 15%, Romano grew by 48% and Safi grew by 19%
1. We continue our investments in US, Brazil, China and Europe
2. We have seen a slowdown in Q4, particularly in India due to macroeconomic conditions. However, we do believe that demand in India will improve in the coming quarters
3. WIN is positioned strongly, as a global player and partner of choice.
Wipro
Consumer
Care and
Lighting
(WCCL)
Wipro Infra-
structure
Engineering
(WIN)
Wipro
Eco
© 2012 WIPRO LTD | WWW.WIPRO.COM24
Thank You


