Abstract Wireless Image Sensor Networks (WISNs) consisting of untethered cameranodes and sensors may be deployed in a variety of unattended and possibly hostile envi-ronments to obtain surveillance data. In such settings, the WISN nodes must perform reliableevent acquisition to limit the energy, computation and delay drains associated with forward-ing large volumes of image data wirelessly to a sink node. In this work we investigate theevent acquisition properties of WISNs that employ various techniques at the camera nodes todistinguish between event and non-event frames in uncertain environments that may includeattacks. These techniques include lightweight image processing, decisions from n sensorswith/without cluster head fault and attack detection, and a combination approach relying onboth lightweight image processing and sensor decisions. We analyze the relative merits andlimitations of each approach in terms of the resulting probability of event detection and falsealarm in the face of occasional errors, attacks and stealthy attacks.
Wireless Image Sensor Networks (WISNs) are envisioned for a variety of innovative applica-tions such as distributed surveillance, intelligent infrastructure monitoring and scientific datacollection (Akyildiz et al. 2007; Feng et al. 2001). To realize this vision, WISN research mustovercome challenges associated with the increased processing, transmission and bandwidthcosts required for image data compared with conventional sensor data (Basharat et al. 2005;Soro and Heinzelman 2005; He and Wu 2006). A variety of interesting approaches have been
This work is supported in part by NSF grants ECCS-0735114 and EEC-0649142.
A. Czarlinska (B) · D. KundurDepartment of Electrical & Computer Engineering, Texas A&M University, College Station, TX, USAe-mail: [email protected]
123
136 Multidim Syst Sign Process (2009) 20:135–164
hostile
sensor
sensor
sensor
sensor
hostile
sensor
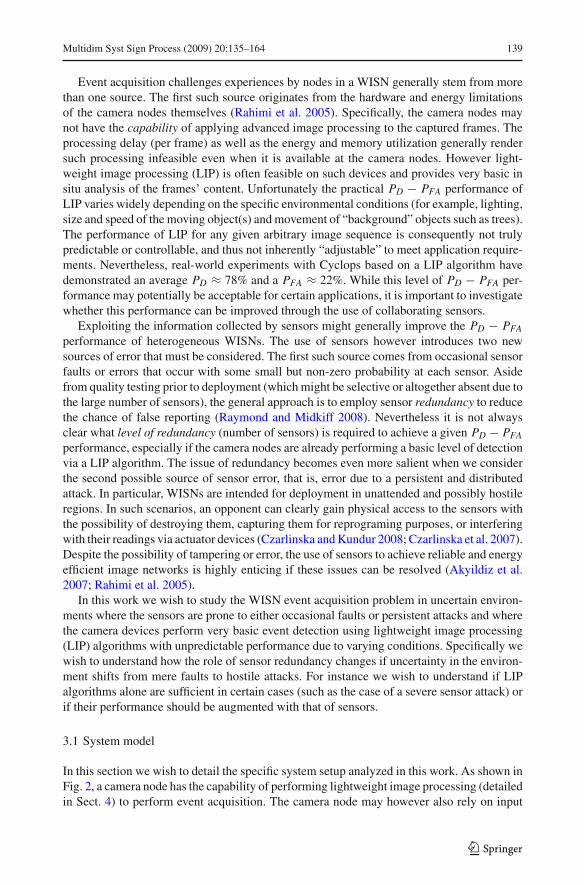
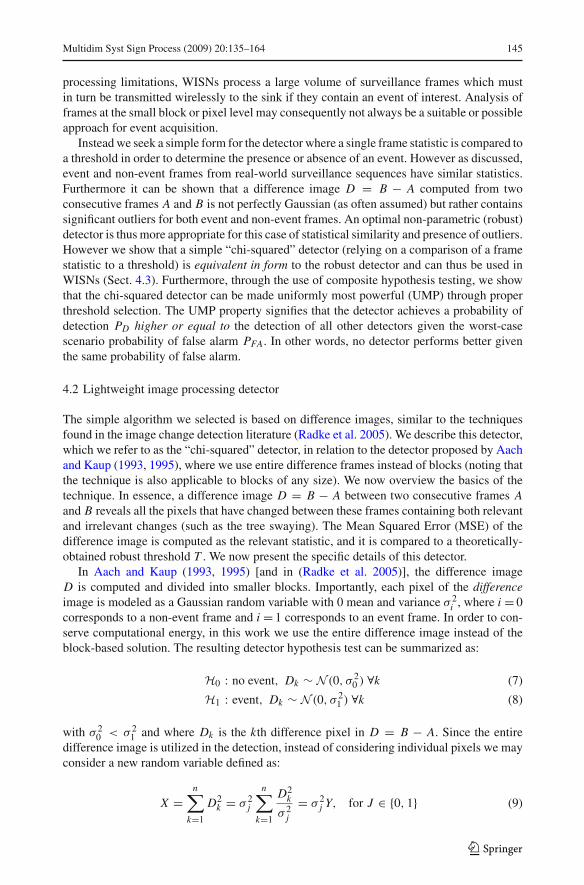
Fig. 1 A general heterogeneous visual sensor network comprised of untethered camera nodes and supportingsensors in the possible presence of a distributed attacker
proposed to address these issues including exploiting spatial and temporal data correlations(Chow et al. 2007; Ma and Liu 2005) as well as utilizing collaboration between camera nodesand sensors (Veeraraghavan et al. 2005). The latter approach has shown particular promisefor detecting events of interest occurring in the environment (He et al. 2006; Rahimi et al.2005).
In this work we examine the event acquisition properties of WISNs pre-deployed ran-domly or deterministically in unattended outdoor environments for the purpose of collectingrelevant surveillance data regarding an event of interest. As shown in Fig. 1, we consider aheterogeneous WISN comprised of sensors and untethered camera nodes (battery operatednodes with wireless data transmission to the sink; He et al. 2006). If the sensor and cameranode deployment is random, each camera may or may not find itself within a close range ofone or more supporting sensors. Such ad hoc arrangements may arise for example in rapiddeployment scenarios where sensors are dropped aerially into an area of possible danger.Deterministic deployments on the other hand may allow for the arrangement of n sensorswithin a desired radius around each camera to assist the camera in triggering and/or inidentifying events of interest. To offer such decision support, a variety of sensors such asmagnetometer or motion sensors might be chosen as dictated by the application. In this workwe only require that the sensor be capable of providing a binary “yes/no” output decisionregarding the presence of events given its sensory input. We also consider a general deploy-ment where each camera node may or may not find itself in the vicinity of n supportingsensors.
Whether with or without the assistance of supporting sensors, the camera nodes mustoperate reliably under significant resource constraints and may thus require the use of light-weight image processing (LIP) algorithms to perform event acquisition (Rahimi et al. 2005;Veeraraghavan et al. 2005). Under the collaboration paradigm, camera nodes may receivesupporting decisions about the presence or absence of an event from the distributed sensors(Veeraraghavan et al. 2005; Basharat et al. 2005). Due to their unattended deployment inpotentially hostile regions however, the sensors may experience errors due to an attack that isperpetrated by a hostile entity (for example a distributed hostile network as depicted in Fig. 1;Czarlinska et al. 2007; Raymond and Midkiff 2008; Buttyan and Hubaux 2002). In this workwe wish to investigate the detection and false alarm characteristics of such heterogeneousWISNs in uncertain environments where outdoor conditions may present challenges for thecamera LIP algorithms while occasional faults and deliberate attacks may present a challengefor the supporting sensors. In particular we wish to study the relative merits and limitationsof the following cases:
1. Lightweight Image Processing (LIP) Approach: preliminary results from real-world test-beds of low-power low-computation wireless camera nodes suggest that LIP algorithmsmay achieve a probability of detection and false alarm (PD − PFA) that may be acceptablefor certain applications (Rahimi et al. 2005; Veeraraghavan et al. 2005). Though we do
123
Multidim Syst Sign Process (2009) 20:135–164 137
not set out to improve any particular LIP algorithm, in this work we wish to understandthe underlying analytical properties of simple threshold based LIP algorithms and exam-ine their PD − PFA performance for a variety of real world surveillance sequences. Theoverarching goal is thus to understand the limits and suitability of LIP algorithms and toprovide a framework for enhancing their performance with sensors if required for a givenapplication.
2. Sensor Decisions Approach: in unattended outdoor settings, sensors may be prone tooccasional errors due to faults or may experience stealthy attacks (designed to avoiddetection; Czarlinska et al. 2007; Raymond and Midkiff 2008; Buttyan and Hubaux 2002).Although quality testing may provide an estimate for the probability of a fault, an estimatefor the probability of an attack may not be generally available a priori. Without verificationmechanisms, the reliability of the sensor decisions may thus not be adequate for someapplications despite node redundancy. In this work we study and compare the PD − PFA
performance of different fault/attack verification mechanisms at the cluster head for thecase of occasional errors, attacks and stealthy attacks. We also comment on the level ofnode redundancy (cluster size) required to achieve a desired event acquisition performanceunder each scenario.
3. Combined Decisions Approach: camera nodes may rely on a combination of decisionsfrom the sensors and the LIP algorithm for event acquisition (Rahimi et al. 2005;Veeraraghavan et al. 2005; He et al. 2006). We wish to study the characteristics of suchcombined decisions for various levels of node redundancy to exploit the desirable quali-ties of both approaches and avoid the degradation in performance that each method mayexperience in certain settings.
The remainder of this paper is organized as follows. Section 2 provides importantmotivation for the WISN event acquisition problem and overviews recent advances salientto our work. Section 3 describes the details of the event acquisition problem in uncertainenvironments. In Sect. 4 we focus on lightweight image processing (LIP) algorithms andtheir performance. In Sect. 5 we focus on the reliability of sensor decisions and study the per-formance of fault/attack detectors. In Sect. 6 we examine the combined decisions approachwith/without fault and attack detectors. Finally in Sect. 7 we summarize our findings andconclusions.
2 Background and recent advances
For many applications, the viability of Wireless Image Sensor Networks (WISNs) dependson the resolution of significant design issues centered around network reliability (Czarlinskaand Kundur 2008; Eltoweissy et al. 2006) longevity (Yu et al. 2007; Maniezzo et al. 2002)and security (Eltoweissy et al. 2005; Chan et al. 2003). The specific issues include everythingfrom energy-efficient capture of images as well as their processing and routing (Chow et al.2007; Veeraraghavan et al. 2005; Chow et al. 2006; Rodriguez 2003), to economical networkdesign relying on node heterogeneity with sleep/wake-up cycles (Bandyopadhyay and Coyle2003; He et al. 2006), to the network’s robustness to attack and compromise of privacy (Olariuet al. 2007). WISNs thus present a very wide range of timely challenges. In this section wewish to briefly outline some recent advances most salient to the focus of our work.
In He et al. (2006) describe VigilNet, a prototype implementation of a heterogeneousimage sensor network for energy efficient surveillance missions. In the experimental setup,70 Mica2 motes are deployed to detect and track the passing of a vehicle while triggeringcameras. The authors demonstrate how a multi-tier sleep/wake-up system consisting of motes
123
138 Multidim Syst Sign Process (2009) 20:135–164
and mote leaders called sentries can extend the lifetime of the network. Importantly, a sentrydecides whether an event of interest is occurring in the environment by counting the number of“yes” votes it receives from the motes which are utilizing magnetometer sensors. To accuratelycapture events, the probabilities of false positives and false negatives are balanced by carefullyselecting the detection threshold (i.e. the number of “yes” votes required to declare that anevent has occurred, referred to by the authors as the Degree of Aggregation DoA). Importantly,the DoA is selected experimentally and as the authors suggest, a framework with adjustablesensitivity for this selection could largely improve the system’s detection performance. Incomparison, in our work we study a framework that enables the cluster head (i.e. sentry) tomake optimal decisions based on sensor inputs with a flexible level of sensitivity.
Although heterogeneous multi-tier systems greatly improve the longevity of the over-all image network, practical designs must account for the substantial power consumptionof individual image-capture devices and of their image processing algorithms which han-dle the acquired frames. Recent advances in CMOS imaging technology have produced anew breed of low-power camera devices. Unfortunately these devices are generally intendedfor higher-power hosts and are thus not suitable for sensor networks. To address this issue(Rahimi et al. 2005), present a seminal camera device named Cyclops. Cyclops provides anelectronic interface between a low-power low-computation camera module based on CMOSimagers and a lightweight camera host such as a mote. While providing a critical bridgeand enabling use in visual sensor networks, Cyclops still suffers from extreme constraints inits computational power and processing delay, necessitating judicious use of its resources.For instance, Cyclops’s complex programmable logic device (CPLD) can perform simpleoperations on the frames at capture time, such as background subtraction and frame dif-ferentiation. Performing such simple operations at capture time instead of post-processingthe frames greatly reduces the energy consumption and delay of the device. In our work,we study how lightweight image processing (LIP) compatible with these ideas can improveevent detection performed by the cluster head and its associated sensors. Importantly cyclopsindeed possesses an asynchronous trigger input that can be connected to sensors (such asa passive IR detector, microphone or magnetometer) to trigger the camera and improve theoverall system’s performance.
3 The WISN event acquisition problem in uncertain environments
Upon deployment, the goal of a typical image network is to capture relevant visual sur-veillance pertaining to an event of interest and to forward this surveillance to a sink wherefurther analysis might be performed. To capture relevant surveillance, the network shouldgenerally exhibit a high probability of event detection PD (true positive) and a low probabilityof false alarm PFA (false positive). These probabilities not only affect the relevance of thecollected materials to the surveillance task, but also have an impact on the network’s energyconsumption and thus on its longevity. Specifically, the erroneous identification of “non-event” frames as “significant” and their subsequent processing and transmission through a(wireless) medium needlessly drains the nodes’ battery resources and burdens the sink withnon-content. On the other hand, the omission of “event” frames may significantly compro-mise the quality of the surveillance mission. The PD − PFA characteristics of the imagenetwork should also ideally exhibit the highly desirable property of being adjustable basedon the requirements of the application (such as its surveillance or energy requirements). Thedetection performance should also ideally exhibit some optimality in the sense of being “thebest” achievable performance given the practical challenges of WISNs.
123
Multidim Syst Sign Process (2009) 20:135–164 139
Event acquisition challenges experiences by nodes in a WISN generally stem from morethan one source. The first such source originates from the hardware and energy limitationsof the camera nodes themselves (Rahimi et al. 2005). Specifically, the camera nodes maynot have the capability of applying advanced image processing to the captured frames. Theprocessing delay (per frame) as well as the energy and memory utilization generally rendersuch processing infeasible even when it is available at the camera nodes. However light-weight image processing (LIP) is often feasible on such devices and provides very basic insitu analysis of the frames’ content. Unfortunately the practical PD − PFA performance ofLIP varies widely depending on the specific environmental conditions (for example, lighting,size and speed of the moving object(s) and movement of “background” objects such as trees).The performance of LIP for any given arbitrary image sequence is consequently not trulypredictable or controllable, and thus not inherently “adjustable” to meet application require-ments. Nevertheless, real-world experiments with Cyclops based on a LIP algorithm havedemonstrated an average PD ≈ 78% and a PFA ≈ 22%. While this level of PD − PFA per-formance may potentially be acceptable for certain applications, it is important to investigatewhether this performance can be improved through the use of collaborating sensors.
Exploiting the information collected by sensors might generally improve the PD − PFA
performance of heterogeneous WISNs. The use of sensors however introduces two newsources of error that must be considered. The first such source comes from occasional sensorfaults or errors that occur with some small but non-zero probability at each sensor. Asidefrom quality testing prior to deployment (which might be selective or altogether absent due tothe large number of sensors), the general approach is to employ sensor redundancy to reducethe chance of false reporting (Raymond and Midkiff 2008). Nevertheless it is not alwaysclear what level of redundancy (number of sensors) is required to achieve a given PD − PFA
performance, especially if the camera nodes are already performing a basic level of detectionvia a LIP algorithm. The issue of redundancy becomes even more salient when we considerthe second possible source of sensor error, that is, error due to a persistent and distributedattack. In particular, WISNs are intended for deployment in unattended and possibly hostileregions. In such scenarios, an opponent can clearly gain physical access to the sensors withthe possibility of destroying them, capturing them for reprograming purposes, or interferingwith their readings via actuator devices (Czarlinska and Kundur 2008; Czarlinska et al. 2007).Despite the possibility of tampering or error, the use of sensors to achieve reliable and energyefficient image networks is highly enticing if these issues can be resolved (Akyildiz et al.2007; Rahimi et al. 2005).
In this work we wish to study the WISN event acquisition problem in uncertain environ-ments where the sensors are prone to either occasional faults or persistent attacks and wherethe camera devices perform very basic event detection using lightweight image processing(LIP) algorithms with unpredictable performance due to varying conditions. Specifically wewish to understand how the role of sensor redundancy changes if uncertainty in the environ-ment shifts from mere faults to hostile attacks. For instance we wish to understand if LIPalgorithms alone are sufficient in certain cases (such as the case of a severe sensor attack) orif their performance should be augmented with that of sensors.
3.1 System model
In this section we wish to detail the specific system setup analyzed in this work. As shown inFig. 2, a camera node has the capability of performing lightweight image processing (detailedin Sect. 4) to perform event acquisition. The camera node may however also rely on input
123
140 Multidim Syst Sign Process (2009) 20:135–164
. . . yes/noLIP
sensor(s)
CHCH & LIP
cluster head camera node
yes/noattack
faultPD
PFA
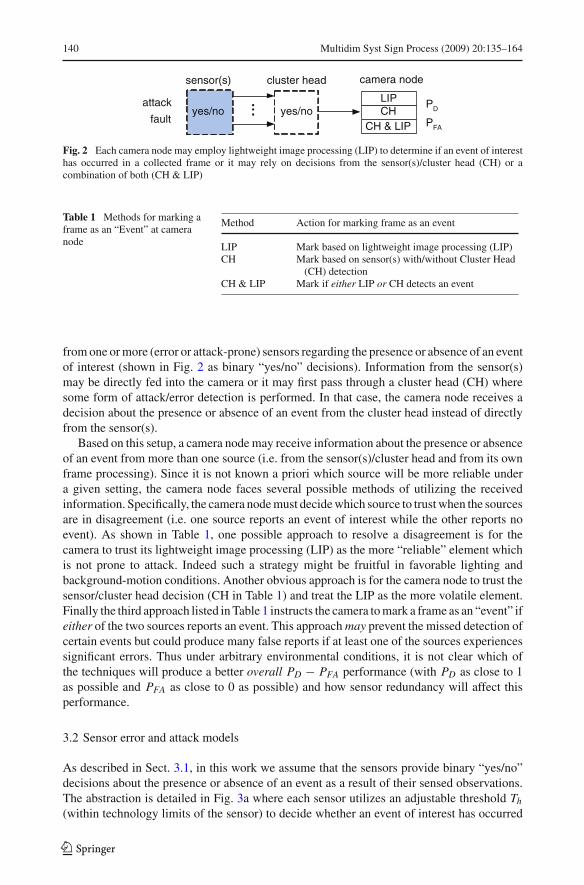
Fig. 2 Each camera node may employ lightweight image processing (LIP) to determine if an event of interesthas occurred in a collected frame or it may rely on decisions from the sensor(s)/cluster head (CH) or acombination of both (CH & LIP)
Table 1 Methods for marking aframe as an “Event” at cameranode
Method Action for marking frame as an event
LIP Mark based on lightweight image processing (LIP)CH Mark based on sensor(s) with/without Cluster Head
(CH) detectionCH & LIP Mark if either LIP or CH detects an event
from one or more (error or attack-prone) sensors regarding the presence or absence of an eventof interest (shown in Fig. 2 as binary “yes/no” decisions). Information from the sensor(s)may be directly fed into the camera or it may first pass through a cluster head (CH) wheresome form of attack/error detection is performed. In that case, the camera node receives adecision about the presence or absence of an event from the cluster head instead of directlyfrom the sensor(s).
Based on this setup, a camera node may receive information about the presence or absenceof an event from more than one source (i.e. from the sensor(s)/cluster head and from its ownframe processing). Since it is not known a priori which source will be more reliable undera given setting, the camera node faces several possible methods of utilizing the receivedinformation. Specifically, the camera node must decide which source to trust when the sourcesare in disagreement (i.e. one source reports an event of interest while the other reports noevent). As shown in Table 1, one possible approach to resolve a disagreement is for thecamera to trust its lightweight image processing (LIP) as the more “reliable” element whichis not prone to attack. Indeed such a strategy might be fruitful in favorable lighting andbackground-motion conditions. Another obvious approach is for the camera node to trust thesensor/cluster head decision (CH in Table 1) and treat the LIP as the more volatile element.Finally the third approach listed in Table 1 instructs the camera to mark a frame as an “event” ifeither of the two sources reports an event. This approach may prevent the missed detection ofcertain events but could produce many false reports if at least one of the sources experiencessignificant errors. Thus under arbitrary environmental conditions, it is not clear which ofthe techniques will produce a better overall PD − PFA performance (with PD as close to 1as possible and PFA as close to 0 as possible) and how sensor redundancy will affect thisperformance.
3.2 Sensor error and attack models
As described in Sect. 3.1, in this work we assume that the sensors provide binary “yes/no”decisions about the presence or absence of an event as a result of their sensed observations.The abstraction is detailed in Fig. 3a where each sensor utilizes an adjustable threshold Th
(within technology limits of the sensor) to decide whether an event of interest has occurred
123
Multidim Syst Sign Process (2009) 20:135–164 141
p1 - p
Th
event absent event present
xi
zi
0
1
0
1
1-q
1-q
q
q
1-p
p
(a) (b)
Fig. 3 a Binary sensor model with sensing threshold Th and resulting probability of witnessing an event0 ≤ p ≤ 1. b Basic bit error model due to fault or (unstealthy) attack where 0 ≤ q ≤ 1 is typically small forfaults but may be arbitrarily large for attacks
to produce a resulting decision bit of value 1/0. Decisions based on the use of a thresholdresult in a given probability p of witnessing an event (bit of value 1). The output decision ofa sensor i is thus described by a Bernoulli random variable which we denote by Xi as shownin Eq. 1.
Xi ={
1 w.p. p0 w.p. 1 − p
(1)
Yi ={
1 w.p. q0 w.p. 1 − q
(2)
Zi = Xi ⊕ Yi (3)
Zi ={
1 w.p. r0 w.p. 1 − r where r = q + p − 2pq
(4)
The notion of an occasional sensor fault is captured through the familiar bit error modeldepicted in Fig. 3b. In the model, a bit may be reported erroneously with a probability q . Theerror at sensor i is thus modeled by another Bernoulli random variable which we denote byYi as shown in Eq. 2. The decision bit produced by a sensor i in the presence of possibleerrors is thus given by the Bernoulli random variable Zi as shown in Fig. 3b and given byEqs. 3 and 4.
Importantly we note that the probability q of an error due to an occasional sensor faultmight be small and may possibly be estimated or upper-bounded from experimental setups.If however the sensor error is caused by a hostile attack in an unattended environment, wemay no longer conclude anything specific regarding the probability q a priori. Indeed if noverification mechanisms are in place, the value of q at a given sensor may take on any valuein the permissible range of 0 ≤ q ≤ 1 (a value of q = 1 at a given sensor indicates thatthe sensor always gives a decision opposite from the real sensed event such as for instancein the case when a node is captured). This possibility leads back to the question of the levelof redundancy (number of sensors) that should be utilized to support a camera node. Theissue is further complicated if the attacker utilizes a distributed attack approach throughsensor-actuator nodes (Akyildiz and Kasimoglu 2004). Sensor-actuator nodes deployed inan environment interfere with the readings taken by other sensors in their vicinity without theneed to physically “capture” the sensor and break its physical/cryptographic mechanisms forthe purposes of reprograming (Czarlinska et al. 2007). Depending on the effectiveness of such
123
142 Multidim Syst Sign Process (2009) 20:135–164
a hostile deployment, many sensor nodes might be affected and produce erroneous readingswith some non-negligible probability. A form of verification against occasional errors as wellas wide-spread errors (due to attack) is highly desirable.
In Sect. 3.1 we described a system model that may include a cluster head (CH) whichcollects individual sensor decisions as in many proposed systems and practical implemen-tations (Akyildiz et al. 2007; He et al. 2006; Rahimi et al. 2005). In such systems thecluster head requires that a specified number of sensors c reports an event before decid-ing that an event has most likely occurred and passing this information to the cameranode. The requisite number of sensors c [also known as the “weight” (Czarlinska et al.2007) or the degree of aggregation DoA (He et al. 2006)] may be determined experimen-tally, approximated based on expectations or obtained theoretically (Sect. 5). For instanceto perform an approximation, if there are n sensors and each sensor has a probability pof witnessing an event (based on its threshold Th), then the average expected number ofsensors that report an event is c ≈ np ± ε where ε may be determined experimentally.The cluster head thus receives decisions from n sensors which for the case of no errors isdenoted in vector form by X = [x1, x2, . . . , xn] and under the case of possible errors byZ = [z1, z2, . . . , zn]. If we denote by w the weight (number of 1’s) contained in the vectorreceived by the cluster head, then the cluster head computes w(Z) (or w(X) if there are noerrors) and compares it to the expected weight c. Based on this simple form of error/attackfiltering, the cluster head is effectively deciding between two hypotheses regarding thereceived sensor data as shown in Eq. 5. The H0 or null hypothesis is that the receiveddata Z comes from the Bern(p) distribution and is thus error free (in this case Z is reallyX). The H1 or alternative hypothesis is that the received data contains errors due to attack orfault.
H0 : normal operation, Z ∼ Bern(p)
H1 : attack (or fault), Z ∼ Bern(r) (5)
The preceding consideration of sensor error due to attack effectively treats the attackas a regular fault with the difference that the fault may possibly be unrestricted in valuedue to the attacker’s choice of action. However an attacker that wishes to effectively mis-guide the event acquisition process of a WISN may possibly take the cluster head detectorinto account. Specifically, the attacker may wish to determine the optimal probability ofattack q∗ that causes erroneous decisions while minimizing the chance of being detectedby the cluster head. This problem which we refer to as a stealthy attack is captured byEq. 6. The attacker wishes to choose an optimal value of attack parameter q∗ such that theweight of the attacked data (which depends on probabilities p and q) generally matches(in terms of the probability of occurrence) the weight of the unaltered data (which dependson the probability p alone). In general the attacker need not know the probability p (sinceit depends on the sensor threshold Th) and the optimization might be performed throughgame theoretic optimization where the sensors with unknown parameter p are treated asan opponent (the attacker is treated as the other player with unknown parameter q). Inthis work we wish to consider the effect of occasional errors, unconstrained attacks andstealthy attacks on the WISN event acquisition process and determine what level of sensorredundancy is required to support the lightweight image processing available at the cameranodes.
q∗ = max 0≤q≤1 Pr{w(Xp) = w(Zp,q)} (6)
123
Multidim Syst Sign Process (2009) 20:135–164 143
Fig. 4 Seq. 1 with frames (a–f) from top left to bottom right: indoor test conditions with constant lightingand no background changes
Fig. 5 Seq. 2 with frames (a–f) from top left to bottom right: outdoor variable lighting due to clouds. Ex: Thelight intensity changes by 70% between frames (a) and (b). Additional background movement due to shrub
4 Lightweight image processing in WISNs for event acquisition
4.1 Lightweight image processing and sequence characteristics
In the spirit of lightweight image processing (LIP) (Rahimi et al. 2005; Rosin 2002; Wu andChen 2007), we consider a relatively simple and general event acquisition algorithm (i.e.the approach is not tailored to the detection of any specific type of object). Examination ofthe proposed algorithm is intended to provide more insights into the properties of simplevisual algorithms and serve as an illustration of their performance in the context of energyand computation-limited camera nodes. To assess this generic algorithm for WISNs weconsider its properties in analytic form and obtain the algorithm’s PD − PFA performance forsurveillance sequences under varying conditions (Sect. 4.3). The real-world image sequencesused in our testing are shown in Figs. 4–7. The characteristics of these sequences are importantin understanding the suitability of the proposed algorithm for event acquisition in WISNs.We thus describe the test sequences prior to outlining the visual event acquisition algorithmand its properties.
The sequence of Fig. 4 is an idealized indoor test where the lighting and backgroundconditions do not change appreciably over time. The only significant change comes fromthe event of interest in the form of a test subject entering the camera’s field of view. Thedominant source of noise in this case is internal camera noise and flicker. The sequence ofFig. 5 shows outdoor parking-lot surveillance on a windy day, where the event of interest isthe passing of an unidentified car. The event acquisition task in this sequence is complicated
123
144 Multidim Syst Sign Process (2009) 20:135–164
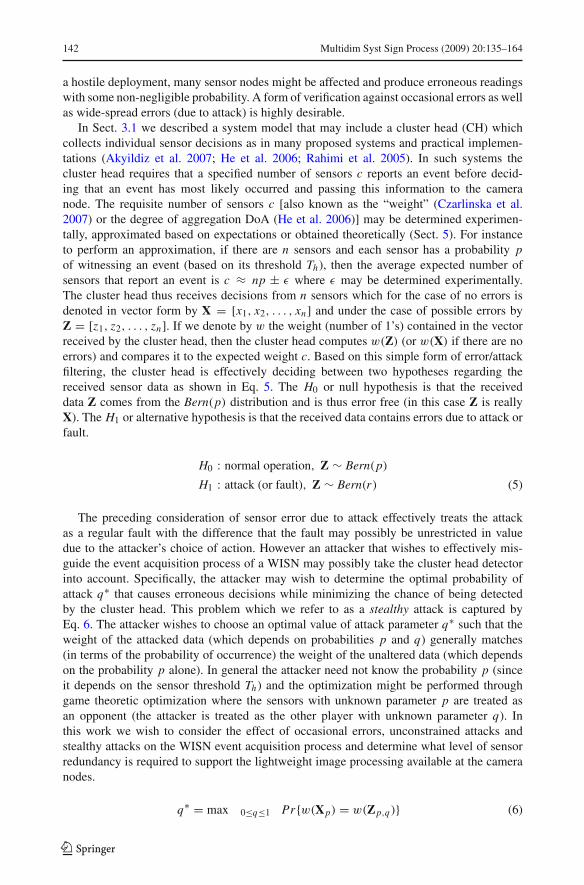
Fig. 6 Seq. 3 with frames (a–f) from top left to bottom right: changing outdoor light and background (swayingtrees). The subject temporarily disappears behind a tree in frames (c) and (e)
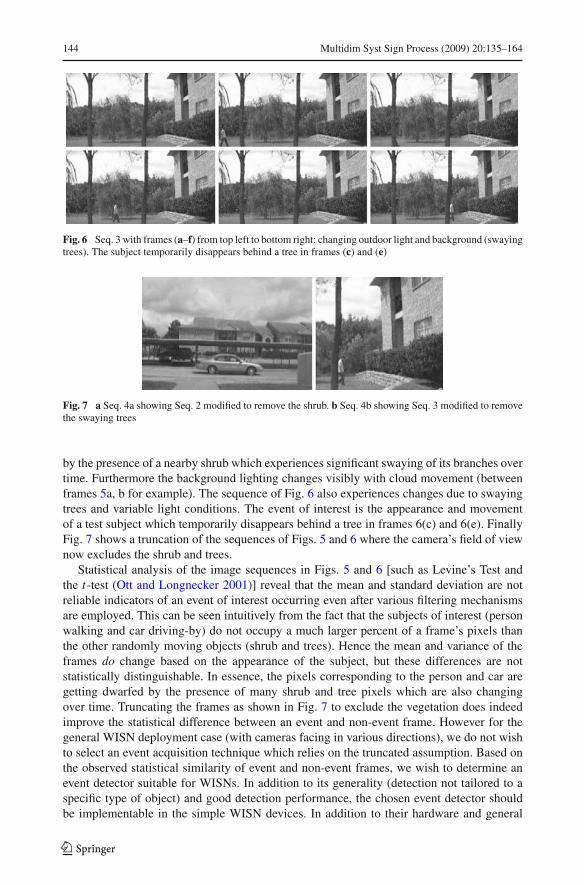
Fig. 7 a Seq. 4a showing Seq. 2 modified to remove the shrub. b Seq. 4b showing Seq. 3 modified to removethe swaying trees
by the presence of a nearby shrub which experiences significant swaying of its branches overtime. Furthermore the background lighting changes visibly with cloud movement (betweenframes 5a, b for example). The sequence of Fig. 6 also experiences changes due to swayingtrees and variable light conditions. The event of interest is the appearance and movementof a test subject which temporarily disappears behind a tree in frames 6(c) and 6(e). FinallyFig. 7 shows a truncation of the sequences of Figs. 5 and 6 where the camera’s field of viewnow excludes the shrub and trees.
Statistical analysis of the image sequences in Figs. 5 and 6 [such as Levine’s Test andthe t-test (Ott and Longnecker 2001)] reveal that the mean and standard deviation are notreliable indicators of an event of interest occurring even after various filtering mechanismsare employed. This can be seen intuitively from the fact that the subjects of interest (personwalking and car driving-by) do not occupy a much larger percent of a frame’s pixels thanthe other randomly moving objects (shrub and trees). Hence the mean and variance of theframes do change based on the appearance of the subject, but these differences are notstatistically distinguishable. In essence, the pixels corresponding to the person and car aregetting dwarfed by the presence of many shrub and tree pixels which are also changingover time. Truncating the frames as shown in Fig. 7 to exclude the vegetation does indeedimprove the statistical difference between an event and non-event frame. However for thegeneral WISN deployment case (with cameras facing in various directions), we do not wishto select an event acquisition technique which relies on the truncated assumption. Based onthe observed statistical similarity of event and non-event frames, we wish to determine anevent detector suitable for WISNs. In addition to its generality (detection not tailored to aspecific type of object) and good detection performance, the chosen event detector shouldbe implementable in the simple WISN devices. In addition to their hardware and general
123
Multidim Syst Sign Process (2009) 20:135–164 145
processing limitations, WISNs process a large volume of surveillance frames which mustin turn be transmitted wirelessly to the sink if they contain an event of interest. Analysis offrames at the small block or pixel level may consequently not always be a suitable or possibleapproach for event acquisition.
Instead we seek a simple form for the detector where a single frame statistic is compared toa threshold in order to determine the presence or absence of an event. However as discussed,event and non-event frames from real-world surveillance sequences have similar statistics.Furthermore it can be shown that a difference image D = B − A computed from twoconsecutive frames A and B is not perfectly Gaussian (as often assumed) but rather containssignificant outliers for both event and non-event frames. An optimal non-parametric (robust)detector is thus more appropriate for this case of statistical similarity and presence of outliers.However we show that a simple “chi-squared” detector (relying on a comparison of a framestatistic to a threshold) is equivalent in form to the robust detector and can thus be used inWISNs (Sect. 4.3). Furthermore, through the use of composite hypothesis testing, we showthat the chi-squared detector can be made uniformly most powerful (UMP) through properthreshold selection. The UMP property signifies that the detector achieves a probability ofdetection PD higher or equal to the detection of all other detectors given the worst-casescenario probability of false alarm PFA. In other words, no detector performs better giventhe same probability of false alarm.
4.2 Lightweight image processing detector
The simple algorithm we selected is based on difference images, similar to the techniquesfound in the image change detection literature (Radke et al. 2005). We describe this detector,which we refer to as the “chi-squared” detector, in relation to the detector proposed by Aachand Kaup (1993, 1995), where we use entire difference frames instead of blocks (noting thatthe technique is also applicable to blocks of any size). We now overview the basics of thetechnique. In essence, a difference image D = B − A between two consecutive frames Aand B reveals all the pixels that have changed between these frames containing both relevantand irrelevant changes (such as the tree swaying). The Mean Squared Error (MSE) of thedifference image is computed as the relevant statistic, and it is compared to a theoretically-obtained robust threshold T . We now present the specific details of this detector.
In Aach and Kaup (1993, 1995) [and in (Radke et al. 2005)], the difference imageD is computed and divided into smaller blocks. Importantly, each pixel of the differenceimage is modeled as a Gaussian random variable with 0 mean and variance σ 2
i , where i = 0corresponds to a non-event frame and i = 1 corresponds to an event frame. In order to con-serve computational energy, in this work we use the entire difference image instead of theblock-based solution. The resulting detector hypothesis test can be summarized as:
H0 : no event, Dk ∼ N (0, σ 20 ) ∀k (7)
H1 : event, Dk ∼ N (0, σ 21 ) ∀k (8)
with σ 20 < σ 2
1 and where Dk is the kth difference pixel in D = B − A. Since the entiredifference image is utilized in the detection, instead of considering individual pixels we mayconsider a new random variable defined as:
X =n∑
k=1
D2k = σ 2
j
n∑k=1
D2k
σ 2j
= σ 2j Y, for J ∈ {0, 1} (9)
123
146 Multidim Syst Sign Process (2009) 20:135–164
where Y has distribution chi-squared with n degrees of freedom and where n is the totalnumber of pixels in the difference frame. The new detection hypothesis test is thus given by:
H0 : X ∼ 1
σ 20
fχ2,n
(x
σ 20
)(10)
H1 : X ∼ 1
σ 21
fχ2,n
(x
σ 21
)(11)
where fχ2,n(x) is the probability density function (pdf) of the chi-squared distribution withn degrees of freedom.1 Significantly, the hypothesis test to distinguish between an event andnon-event is given by the comparison of a single statistic (x) to a threshold T as shown inEqs. 12 and 13, where σ 2
0 is the variance of a null frame, F−1χ2,n
is the inverse chi-squared
cumulative distribution function (cdf) and α is the desired probability of false alarm.2
xH1><H0
T (12)
T = σ 20 F−1
χ2,n(1 − α) (13)
4.3 Lightweight detector properties
In this Section we wish to analyze some of the properties of the simple chi-squared detectorof Eqs. 12 and 13. We begin by showing that the simple chi-squared detector can be madeuniformly most powerful (UMP) (Van Trees 2001). To achieve this we show that if thereexists a real positive number γ , such that σ 2
0 < γ and σ 21 > γ , where the actual σ 2
0 , σ 21 are
unknown, then there exists a UMP detector where a realization x from Eq. 9 is compared toa threshold T , such that the probability of false alarm PFA = α is given by:
α = supσ 2
0 <γ
∞∫T
1
σ 20
fχ2,n
(x
σ 20
)dx (14)
Proposition 1 Suppose there exists a γ > 0, such that σ 20 < γ and σ 2
1 > γ in Eqs. 10 and11. Then there exists a UMP test of the form
xH1><H0
γ f −1χ2,n
(1 − α) (15)
for false alarm rate not exceeding α. Proposition 1 is a composite hypothesis test in whichthe parameters for the null and alternate hypotheses are unknown, but the regions for theseparameters are divided by a threshold γ . The proposition says that if the parameter spaceis divided as thus, then a test that compares the actual x in Eq. 9 to a threshold, achievesoptimal detection when the worst case false alarm is considered (the use of sup in Eq. 14).
1 We note that σi appears in the detector as σ 20 while it appears as 1
σ20
and 1σ2
1in the distributions of the two
hypotheses.2 The threshold T is obtained directly by writing α = Pr{announceH1|H0} which results in an integrationof the null hypothesis pdf 1
σ20
fχ2,n( xσ2
0) over the interval from T to ∞.
123
Multidim Syst Sign Process (2009) 20:135–164 147
Proof If we can show that the likelihood ratio is monotonically increasing in x for σ 21 > σ 2
0 ,then the UMP test of the form in Eq. 15 follows from a theorem on composite hypothesistesting (Van Trees 2001). It can easily be shown that the log-likelihood ratio is given by12
(1σ 2
0− 1
σ 21
)x + n
2 ln
(σ 2
0σ 2
1
). Since σ 2
1 > σ 20 , this ratio is strictly increasing in x . To show
that T is as given on the left side of Eq. 15, we note that the probability of false alarm isgiven by 1 − fχ2,n(T/σ 2
0 ) by applying an integration change of variable in Eq. 14. To getthe sup in Eq. 14, it suffices to set σ 2
0 = γ .
Having established that the simple detector of Eqs. 12 and 13 can be made uniformlymost powerful, we next show that the form of the detector is equivalent to that of a robust(non-parametric) detector. This is an important property given that the statistical similarityof event and non-event frames along with difference-frame distributions that are not quiteGaussian render H1 and H0 almost indistinguishable when the entire frame is used. Thuswe would like to maximize the event detection assuming that σ 2
1 ≈ σ 20 rather than assuming
that the statistics are significantly different. This can be re-phrased as
max∂β
∂σ 21
|σ 21 =σ 2
0(16)
where β = Pr{declare H1 | H1 occurs} is the probability of detection.
Proposition 2 The test
xH1><H0
T (17)
maximizes Eq. 16 for a false alarm rate not exceeding α, i.e. T is chosen so that
α >
∫ ∞
T
1
σ 20
fχ2,n
(x
σ 20
)dx . (18)
Proof By the proof of the Neyman-Pearson lemma (Van Trees 2001), the optimal test canbe shown to be of the form
∂ 1σ2
1fχ2,n
(x
σ21
)
∂σ 21
∣∣∣σ 2
1 =σ 20
1σ 2
0fχ2,n
(xσ 2
0
) H1><H0
T̃ , (19)
which is equivalent to
x − nσ 20
2σ 40
H1><H0
T̃ . (20)
Letting T = 2σ 40 T̃ + nσ 2
0 proves the proposition.
In summary, given the actual statistics of the difference image, a non-parametric (robust)detector is appropriate to perform event detection. However the simple chi-squared detectoris equivalent in form to the robust detector and can be made uniformly most powerful throughthreshold selection. The simple image difference test may thus be used at the camera nodeswith acceptable performance within its class of algorithm complexity.
123
148 Multidim Syst Sign Process (2009) 20:135–164
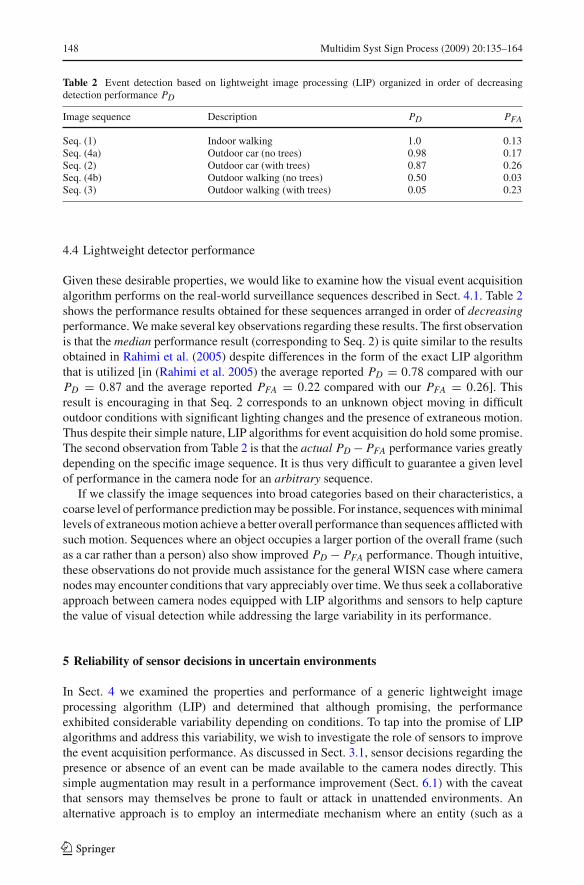
Table 2 Event detection based on lightweight image processing (LIP) organized in order of decreasingdetection performance PD
Image sequence Description PD PFA
Seq. (1) Indoor walking 1.0 0.13Seq. (4a) Outdoor car (no trees) 0.98 0.17Seq. (2) Outdoor car (with trees) 0.87 0.26Seq. (4b) Outdoor walking (no trees) 0.50 0.03Seq. (3) Outdoor walking (with trees) 0.05 0.23
4.4 Lightweight detector performance
Given these desirable properties, we would like to examine how the visual event acquisitionalgorithm performs on the real-world surveillance sequences described in Sect. 4.1. Table 2shows the performance results obtained for these sequences arranged in order of decreasingperformance. We make several key observations regarding these results. The first observationis that the median performance result (corresponding to Seq. 2) is quite similar to the resultsobtained in Rahimi et al. (2005) despite differences in the form of the exact LIP algorithmthat is utilized [in (Rahimi et al. 2005) the average reported PD = 0.78 compared with ourPD = 0.87 and the average reported PFA = 0.22 compared with our PFA = 0.26]. Thisresult is encouraging in that Seq. 2 corresponds to an unknown object moving in difficultoutdoor conditions with significant lighting changes and the presence of extraneous motion.Thus despite their simple nature, LIP algorithms for event acquisition do hold some promise.The second observation from Table 2 is that the actual PD − PFA performance varies greatlydepending on the specific image sequence. It is thus very difficult to guarantee a given levelof performance in the camera node for an arbitrary sequence.
If we classify the image sequences into broad categories based on their characteristics, acoarse level of performance prediction may be possible. For instance, sequences with minimallevels of extraneous motion achieve a better overall performance than sequences afflicted withsuch motion. Sequences where an object occupies a larger portion of the overall frame (suchas a car rather than a person) also show improved PD − PFA performance. Though intuitive,these observations do not provide much assistance for the general WISN case where cameranodes may encounter conditions that vary appreciably over time. We thus seek a collaborativeapproach between camera nodes equipped with LIP algorithms and sensors to help capturethe value of visual detection while addressing the large variability in its performance.
5 Reliability of sensor decisions in uncertain environments
In Sect. 4 we examined the properties and performance of a generic lightweight imageprocessing algorithm (LIP) and determined that although promising, the performanceexhibited considerable variability depending on conditions. To tap into the promise of LIPalgorithms and address this variability, we wish to investigate the role of sensors to improvethe event acquisition performance. As discussed in Sect. 3.1, sensor decisions regarding thepresence or absence of an event can be made available to the camera nodes directly. Thissimple augmentation may result in a performance improvement (Sect. 6.1) with the caveatthat sensors may themselves be prone to fault or attack in unattended environments. Analternative approach is to employ an intermediate mechanism where an entity (such as a
123
Multidim Syst Sign Process (2009) 20:135–164 149
cluster head) receives readings from one or more sensors as shown in Fig. 2 and performsattack/fault detection. In this Section we wish to investigate the form and performance ofsuch a cluster head (CH) detector in the face of both occasional errors (faults) and in the faceof deliberately stealthy attacks (Sect. 3.2). We proceed by obtaining the form of the optimalNeyman-Pearson (NP) detector in Sect. 5.1, analyzing the effects of a stealthy attack in Sect.5.2 and finally obtaining the performance of the CH detector in Sect. 5.3.
5.1 Cluster head (CH) detector
In detection problems we are generally faced with the task of deciding between two ormore hypotheses based on received data. The Neyman-Pearson (NP) is an optimal detectorappropriate for cases where a priori probabilities of the hypotheses are not available, and forcases where the probability of detection PD and the probability of false alarm PFA may not beof equal significance to the application (otherwise a Bayesian detector may be appropriate).According to the NP approach, we obtain a detector by maximizing PD for a desired falsealarm rate PFA = α. The resulting optimal detector is a likelihood ratio detector �(z) givenby Eq. 21, where z is the received data vector and where the comparison threshold T ischosen according to Eq. 22.
�(z) = p(z; H1)
p(z; H0)
H1><H0
T (21)
PFA =∫
z:�(z)>Tp(z; H0) d z ≤ α (22)
For the case of n binary sensors of Sect. 3.2, the data vector z consists of Bernoullirandom variables from a distribution which is Bern(p) (hypothesis H0) or a distributionBern(r) (hypothesis H1). By applying Eq. 21 it can easily be shown that the NP detector forthis case is given by Eq. 23, where w(z) is the weight (the number of 1 s) in the data vector z.
�(z) = rw(z)(1 − r)n−w(z)
pw(z)(1 − p)n−w(z)
H1><H0
T (23)
∑z:�(z)>T
pw(z)(1 − p)n−w(z) ≤ α (24)
The threshold T is chosen to satisfy a desired α based on Eq. 24, where the summation isover all the possible data vectors z such that �(z) exceeds T . However this is equivalent tosumming over all possible weights w for w ∈ [0, n] as shown in Eq. 25. The notation IP
denotes the indicator function which is equal to 1 if the proposition P is true and is equal to 0otherwise. Finally, the probability of detection β resulting from the use of the �(z) detectoris given by Eq. 26.
n∑w=0
(nw)pw(z)(1 − p)n−w(z) I �(z)>T ≤ α (25)
β =n∑
w=0
(nw)rw(z)(1 − r)n−w(z) I �(z)>T (26)
123
150 Multidim Syst Sign Process (2009) 20:135–164
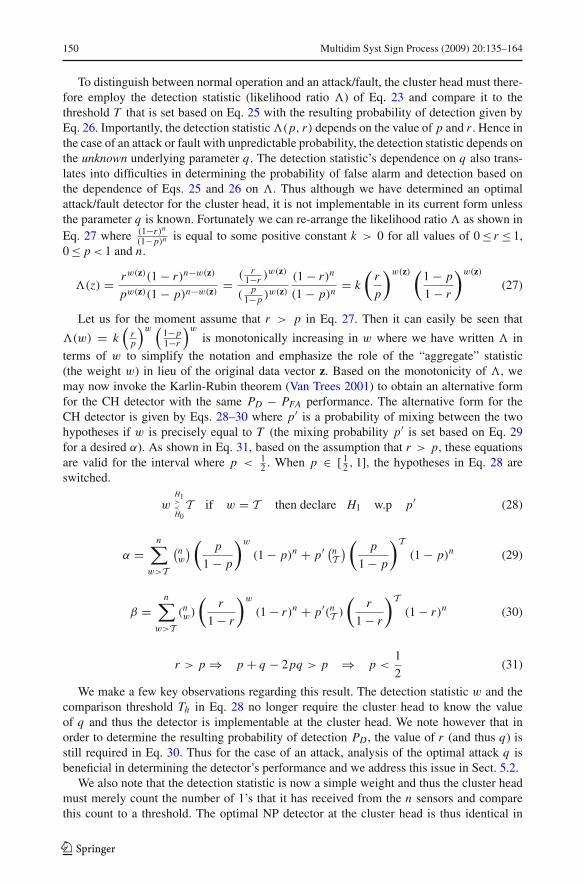
To distinguish between normal operation and an attack/fault, the cluster head must there-fore employ the detection statistic (likelihood ratio �) of Eq. 23 and compare it to thethreshold T that is set based on Eq. 25 with the resulting probability of detection given byEq. 26. Importantly, the detection statistic �(p, r) depends on the value of p and r . Hence inthe case of an attack or fault with unpredictable probability, the detection statistic depends onthe unknown underlying parameter q . The detection statistic’s dependence on q also trans-lates into difficulties in determining the probability of false alarm and detection based onthe dependence of Eqs. 25 and 26 on �. Thus although we have determined an optimalattack/fault detector for the cluster head, it is not implementable in its current form unlessthe parameter q is known. Fortunately we can re-arrange the likelihood ratio � as shown inEq. 27 where (1−r)n
(1−p)n is equal to some positive constant k > 0 for all values of 0 ≤ r ≤ 1,0 ≤ p < 1 and n.
�(z) = rw(z)(1 − r)n−w(z)
pw(z)(1 − p)n−w(z) = ( r1−r )w(z)
(p
1−p )w(z)
(1 − r)n
(1 − p)n= k
(r
p
)w(z) (1 − p
1 − r
)w(z)
(27)
Let us for the moment assume that r > p in Eq. 27. Then it can easily be seen that
�(w) = k(
rp
)w (1−p1−r
)w
is monotonically increasing in w where we have written � in
terms of w to simplify the notation and emphasize the role of the “aggregate” statistic(the weight w) in lieu of the original data vector z. Based on the monotonicity of �, wemay now invoke the Karlin-Rubin theorem (Van Trees 2001) to obtain an alternative formfor the CH detector with the same PD − PFA performance. The alternative form for theCH detector is given by Eqs. 28–30 where p′ is a probability of mixing between the twohypotheses if w is precisely equal to T (the mixing probability p′ is set based on Eq. 29for a desired α). As shown in Eq. 31, based on the assumption that r > p, these equationsare valid for the interval where p < 1
2 . When p ∈ [ 12 , 1], the hypotheses in Eq. 28 are
switched.
wH1><H0
T if w = T then declare H1 w.p p′ (28)
α =n∑
w>T
(nw
) (p
1 − p
)w
(1 − p)n + p′ (nT
) (p
1 − p
)T(1 − p)n (29)
β =n∑
w>T(nw)
(r
1 − r
)w
(1 − r)n + p′(nT )
(r
1 − r
)T(1 − r)n (30)
r > p ⇒ p + q − 2pq > p ⇒ p <1
2(31)
We make a few key observations regarding this result. The detection statistic w and thecomparison threshold Th in Eq. 28 no longer require the cluster head to know the valueof q and thus the detector is implementable at the cluster head. We note however that inorder to determine the resulting probability of detection PD , the value of r (and thus q) isstill required in Eq. 30. Thus for the case of an attack, analysis of the optimal attack q isbeneficial in determining the detector’s performance and we address this issue in Sect. 5.2.
We also note that the detection statistic is now a simple weight and thus the cluster headmust merely count the number of 1’s that it has received from the n sensors and comparethis count to a threshold. The optimal NP detector at the cluster head is thus identical in
123
Multidim Syst Sign Process (2009) 20:135–164 151
form to the detectors commonly used in practice as discussed in Sect. 3.2 (where the weightwas set based on experimental trials or based on an expected average count of c ± ε).The optimal NP detector however makes use of a threshold T that is set based on a de-sired probability of false alarm α and based on the probability p of an event. Setting thethreshold based on Eq. 29 thus provides a greater level of control and flexibility to meetthe PFA requirements of the application. Furthermore, this detector is guaranteed to pro-vide the best probability of detection PD for a chosen PFA = α (a property of Neyman-Pearson detectors). In Sect. 5.3 we examine the actual performance of this cluster head (CH)detector and compare it to the performance of a detector based on the expected averagec ± ε.
5.2 Attack analysis results
As discussed in Sect. 3.2, sensors deployed in unattended environments may experienceerrors due to occasional faults or distributed (stealthy or unstealthy) attacks (Buttyan andHubaux 2002; Czarlinska and Kundur 2008). In the case of occasional faults, the probabilityof error q for sensor i may be quite small while in the case of a general attack, this proba-bility may be arbitrarily large and unknown a priori. Instead of proceeding with an arbitraryattack strategy however, an intelligent attacker may take into account the presence of anattack/fault detection mechanism such as the NP-based detector or the c ± ε detector at thecluster head. In this case the attacker wishes to select a probability of attack q that minimizesthe probability of attack detection. This requirement translates into a stealth condition wherethe attacker wishes to select q such that Pr{w(Xp) = w(Zp,q)} is maximized. Throughcombinatorial analysis (Czarlinska et al. 2007), this probability can be expressed as shownin Eqs. 32 and 33 where we have generalized the stealth condition to allow a deviation ofεr ∈ Z away from perfect stealth and where a, b and c are binomial coefficients definedin Eq. 33.
Pr{∣∣w(Zp,q) − w(Xp)
∣∣ < εr}
=� l+εr
2 �∑m= l−εr
2 �
n∑k=1
n∑l=1
a (k, m) b (k, l, m) c(k) · pk(1 − p)n−k · ql(1 − q)n−l (32)
a(k, m) ={ ( k
m
)if k ≥ m
0 o.w(33)
b(k, l, m) ={ (n−k
l−m
)if n − k ≥ l − m
0 o.w(34)
c(k) ={ (n
k
)if n ≥ k
0 o.w(35)
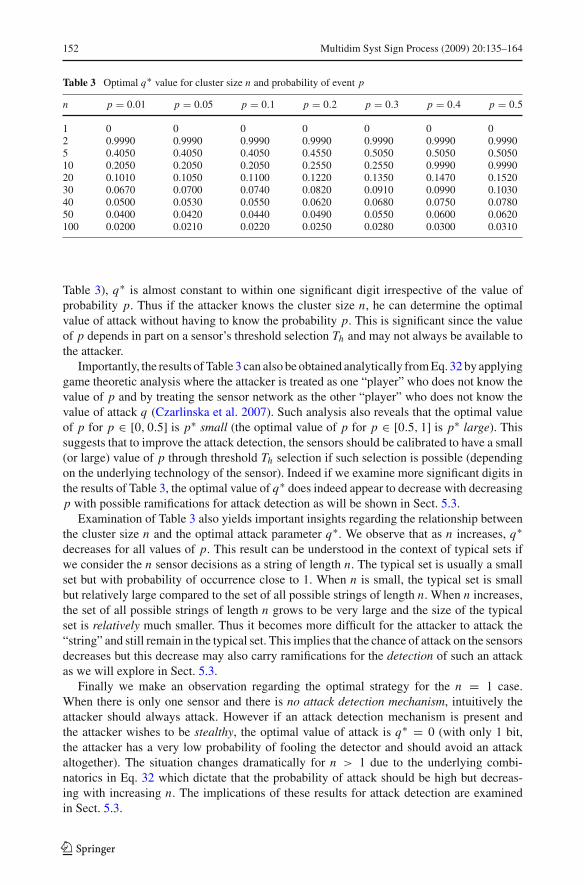
The stealth condition of Eq. 32 is unfortunately cumbersome to inspect. Plotting Eq. 32for different values of cluster size n and probability of an event p nevertheless yields a uniquevalue of probability q that maximizes the equation (i.e. it is the global peak of Eq. 32). Theresults of such plotting are summarized in Table 3 which shows the optimal value of attackprobability q∗ for each pair (n, p) (the stealth condition is symmetric in p and thus the effectof p is the same as the effect of 1 − p and we only consider p ∈ [0, 0.5]). We make afew key observations regarding this result. For a given value of cluster size n (i.e. a row in
123
152 Multidim Syst Sign Process (2009) 20:135–164
Table 3 Optimal q∗ value for cluster size n and probability of event p
n p = 0.01 p = 0.05 p = 0.1 p = 0.2 p = 0.3 p = 0.4 p = 0.5
Table 3), q∗ is almost constant to within one significant digit irrespective of the value ofprobability p. Thus if the attacker knows the cluster size n, he can determine the optimalvalue of attack without having to know the probability p. This is significant since the valueof p depends in part on a sensor’s threshold selection Th and may not always be available tothe attacker.
Importantly, the results of Table 3 can also be obtained analytically from Eq. 32 by applyinggame theoretic analysis where the attacker is treated as one “player” who does not know thevalue of p and by treating the sensor network as the other “player” who does not know thevalue of attack q (Czarlinska et al. 2007). Such analysis also reveals that the optimal valueof p for p ∈ [0, 0.5] is p∗ small (the optimal value of p for p ∈ [0.5, 1] is p∗ large). Thissuggests that to improve the attack detection, the sensors should be calibrated to have a small(or large) value of p through threshold Th selection if such selection is possible (dependingon the underlying technology of the sensor). Indeed if we examine more significant digits inthe results of Table 3, the optimal value of q∗ does indeed appear to decrease with decreasingp with possible ramifications for attack detection as will be shown in Sect. 5.3.
Examination of Table 3 also yields important insights regarding the relationship betweenthe cluster size n and the optimal attack parameter q∗. We observe that as n increases, q∗decreases for all values of p. This result can be understood in the context of typical sets ifwe consider the n sensor decisions as a string of length n. The typical set is usually a smallset but with probability of occurrence close to 1. When n is small, the typical set is smallbut relatively large compared to the set of all possible strings of length n. When n increases,the set of all possible strings of length n grows to be very large and the size of the typicalset is relatively much smaller. Thus it becomes more difficult for the attacker to attack the“string” and still remain in the typical set. This implies that the chance of attack on the sensorsdecreases but this decrease may also carry ramifications for the detection of such an attackas we will explore in Sect. 5.3.
Finally we make an observation regarding the optimal strategy for the n = 1 case.When there is only one sensor and there is no attack detection mechanism, intuitively theattacker should always attack. However if an attack detection mechanism is present andthe attacker wishes to be stealthy, the optimal value of attack is q∗ = 0 (with only 1 bit,the attacker has a very low probability of fooling the detector and should avoid an attackaltogether). The situation changes dramatically for n > 1 due to the underlying combi-natorics in Eq. 32 which dictate that the probability of attack should be high but decreas-ing with increasing n. The implications of these results for attack detection are examinedin Sect. 5.3.
123
Multidim Syst Sign Process (2009) 20:135–164 153
0 0.1 0.2 0.3 0.4 0.5 0.6 0.7 0.8 0.9 10
0.1
0.2
0.3
0.4
0.5
0.6
0.7
0.8
0.9
1
Probability of False Alarm
Pro
babi
lity
of D
etec
tion
NP, KRC
ε = 0 ε = 1 ε = 2
ε = 3
ε =4
ε = 5
ε =6
n = 50, p = 0.01, q = 0.1
0 0.1 0.2 0.3 0.4 0.5 0.6 0.7 0.8 0.90.1
0.2
0.3
0.4
0.5
0.6
0.7
0.8
0.9
1
Probability of False Alarm
Pro
babi
lity
of D
etec
tion
NP, KRC
ε = 0
ε = 1
ε = 2
ε = 3
ε = 4
ε = 5
ε = 6
n = 50, p = 0.1, q = 0.1
Fig. 8 a n = 50, p = 0.01 and q = 0.1. b n = 50, p = 0.1 and q = 0.1
5.3 Cluster head detector performance
As discussed in Sect. 5.1, a detector for attack/fault identification at the cluster head may bebased on the Neyman-Pearson design or on an average expected count c where c ≈ np ± ε
for a cluster size of n sensors with probability of event p. In this section we wish to comparethe performance of these two approaches and also obtain some general insights into thePD − PFA performance curve for different values of p and n as well as for various attackprobabilities q .
In Figs. 8 and 9, the PD − PFA performance of the NP and c ± ε detectors are depictedfor n = 50 sensors, various (p, q) pairs and various values of ε “slack” in the c detector. Ascan be seen from these figures, the performance of the average expected c detector followsthe general trend of the NP detector although it typically does not achieve the same overallperformance. Nevertheless, by choosing a different value of ε, it is possible to achieve adesired trade-off between the probability of detection PD (vertical axis) and the probabilityof false alarm PFA (horizontal axis). The average expected c detector may thus be usefulfor certain applications, in particular ones where the probability of an event p is expectedto be small (based on the phenomenon of interest and the selection of the sensor thresholdTh) as in Fig. 8a. As a side note, we observe that the performance of the NP detector basedon Eqs. 23, 25 and 26 which we denote by “NP” is the same as the performance of the NPdetector based on the Karlin-Rubin simplification of Eqs. 28–30 which we denote by “KR”in Figs. 8 and 9. Thus we are justified in utilizing the simplified form of the NP detector toobtain the same performance.
Finally based on Figs. 8 and 9, we observe that the NP detector performs better for smallervalues of probability p for p ∈ [0, 0.5] (by symmetry for p ∈ [0.5, 1] it performs better forvalues of p closer to 1). This result is consistent with the results of Sect. 5.2 where based onanalysis of the stealth condition of Eq. 32 we noted that it was best to calibrate the sensorsto a small value of p or to a large value of p. Indeed based on Figs. 8 and 9 and the resultsof Table 3, the worst PD − PFA performance is obtained for values of p closest to p = 0.5.This can be understood from Eq. 31 where r = p + q − 2pq . When p = 0.5, r = 0.5 andthus the detector is not able to distinguish between the H0 and H1 hypotheses. At an intuitivelevel, when p = 0.5, the probability of obtaining a decision of value 1 is the same as theprobability of obtaining a sensor decision of value 0. This situation corresponds to the largestlevel of uncertainty that the cluster head can experience and makes it easier for an attackerto fool the detector.
123
154 Multidim Syst Sign Process (2009) 20:135–164
Fig. 9 n = 50, p = 0.47 andq = 0.47
0 0.1 0.2 0.3 0.4 0.5 0.6 0.7 0.8 0.9 10
0.1
0.2
0.3
0.4
0.5
0.6
0.7
0.8
0.9
1
Probability of False Alarm
Pro
babi
lity
of D
etec
tion
NP, KRC
ε = 1
ε = 2
ε = 3
ε = 4
ε = 5
ε = 6
ε = 0 n = 50, p = 0.47, q = 0.47
0 0.1 0.2 0.3 0.4 0.5 0.6 0.7 0.8 0.9 10
0.1
0.2
0.3
0.4
0.5
0.6
0.7
0.8
0.9
1
Probability of False Alarm
Pro
babi
lity
of D
etec
tion
n=5n=10n=20n=30n=40n=100
p = 0.05
0 0.1 0.2 0.3 0.4 0.5 0.6 0.7 0.8 0.9 10
0.1
0.2
0.3
0.4
0.5
0.6
0.7
0.8
0.9
1
Probability of False Alarm
Pro
babi
lity
of D
etec
tion
p = 0.1
n=5n=10n=20n=30n=40n=100
Fig. 10 The PD − PFA performance curves for various values of n and the optimal value of q∗ correspondingto that n for a p = 0.05 and b p = 0.1
Having compared the performance of the NP and c detectors for various values of p, wenow wish to investigate the performance of the NP detector for an optimal attack parameterq∗. Fig. 10a depicts the PD − PFA performance of the NP detector for p = 0.05 and forvarious values of cluster size n. Crucially, each performance curve is obtained assuming thevalue of attack parameter q that is optimal for the given (p, n) pair as obtained in Table 3.Figure 10b is obtained similarly but for a value of p = 0.1. Based on these two figures, wemake the important observation that the PD − PFA performance decreases as the number ofsensors n is increased. This somewhat surprising result is an outcome of the stealth conditionof the attacker. That is, if the attacker is not stealthy, increasing the number of sensors willincrease the detection performance. If however the attacker is stealthy, then he selects anoptimal value of q∗ based on Eq. 32 or Table 3. As discussed in Sect. 5.2, this optimal valueof q decreases with increasing cluster size n. Thus the attack becomes more rare (which is adesirable property) but by the same token becomes more difficult to detect when it does occur.
Based on the performance of the NP detector in the face of an optimal attack q∗, we arebrought back to the question of the level of sensor redundancy that should be employed todetect the attack and to suitably complement the event acquisition already provided throughlightweight image processing.
123
Multidim Syst Sign Process (2009) 20:135–164 155
6 Performance of combined approach for event acquisition
As discussed in Sect. 4, lightweight image processing (LIP) may offer a suitable PD − PFA
performance for event acquisition in WISNs. This performance however exhibits significantvariability depending on the conditions experienced during image capture. To exploit thepotential of LIP algorithms while reducing their variability, we wish to augment the eventacquisition process with sensors. As explored in Sect. 5 however, sensors are prone to occa-sional faults or deliberate and stealthy attacks. We may thus consider a variety of methods atthe camera nodes for exploiting the sensor decisions and the LIP algorithm to improve relia-bility as discussed in Sect. 3.1. In this section we wish to explore the implications of utilizinga cluster head fault/attack detector mechanism before making the sensor decisions availableto the camera nodes. Based on this input, the camera nodes may trust the sensor decisions,the LIP decision or rely on a combination of both (Sect. 6.2). For perspective, we wish tocompare this scenario with the case where sensor decisions are made available directly tothe camera nodes without a cluster head fault/attack detection mechanism (Sect. 6.1).
6.1 Direct sensor decisions approach
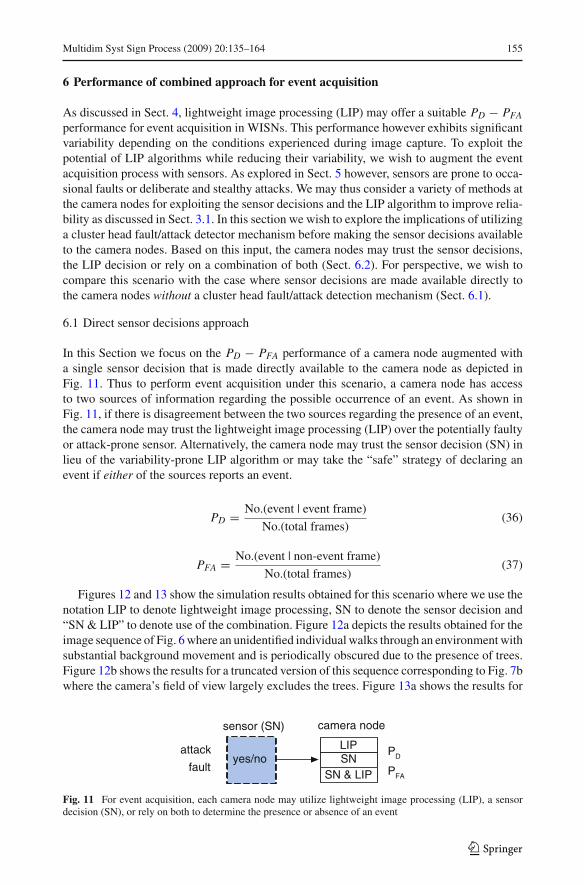
In this Section we focus on the PD − PFA performance of a camera node augmented witha single sensor decision that is made directly available to the camera node as depicted inFig. 11. Thus to perform event acquisition under this scenario, a camera node has accessto two sources of information regarding the possible occurrence of an event. As shown inFig. 11, if there is disagreement between the two sources regarding the presence of an event,the camera node may trust the lightweight image processing (LIP) over the potentially faultyor attack-prone sensor. Alternatively, the camera node may trust the sensor decision (SN) inlieu of the variability-prone LIP algorithm or may take the “safe” strategy of declaring anevent if either of the sources reports an event.
PD = No.(event | event frame)
No.(total frames)(36)
PFA = No.(event | non-event frame)
No.(total frames)(37)
Figures 12 and 13 show the simulation results obtained for this scenario where we use thenotation LIP to denote lightweight image processing, SN to denote the sensor decision and“SN & LIP” to denote use of the combination. Figure 12a depicts the results obtained for theimage sequence of Fig. 6 where an unidentified individual walks through an environment withsubstantial background movement and is periodically obscured due to the presence of trees.Figure 12b shows the results for a truncated version of this sequence corresponding to Fig. 7bwhere the camera’s field of view largely excludes the trees. Figure 13a shows the results for
yes/noLIP
sensor (SN)
SNSN & LIP
camera node
attack
faultPD
PFA
Fig. 11 For event acquisition, each camera node may utilize lightweight image processing (LIP), a sensordecision (SN), or rely on both to determine the presence or absence of an event
123
156 Multidim Syst Sign Process (2009) 20:135–164
0 0.1 0.2 0.3 0.4 0.5 0.6 0.7 0.8 0.9 10
0.1
0.2
0.3
0.4
0.5
0.6
0.7
0.8
0.9
1
Probability of Attack q
Pro
babi
lity
of D
etec
tion
LIPSNSN & LIP
walk with tree
αIM
= 0.29
αs
≈ 0.1
αs
≈ 0.5
αs
≈ 0.8
0 0.1 0.2 0.3 0.4 0.5 0.6 0.7 0.8 0.9 10
0.1
0.2
0.3
0.4
0.5
0.6
0.7
0.8
0.9
1
Probability of Attack q
Pro
babi
lity
of D
etec
tion
LIPSNSN & LIP
walk without trees
αIM
= 0.03
αs
≈ 0.1
αs
≈ 0.5
αs
≈ 0.8
Fig. 12 Probability of detection PD versus probability of sensor error q for the LIP, SN and SN & LIPapproaches for image sequence a walking with trees from Fig. 6 b walking without trees from Fig. 7b
0 0.1 0.2 0.3 0.4 0.5 0.6 0.7 0.8 0.9 10
0.1
0.2
0.3
0.4
0.5
0.6
0.7
0.8
0.9
1
Probability of Attack q
Pro
babi
lity
of D
etec
tion LIP
SNSN & LIP
car with tree
αIM
= 0.25
αs = 0.1
αs = 0.5
αs = 0.8
0 0.1 0.2 0.3 0.4 0.5 0.6 0.7 0.8 0.9 10
0.1
0.2
0.3
0.4
0.5
0.6
0.7
0.8
0.9
1P
roba
bilit
y of
Det
ectio
n
Probability of Attack q
LIPSNSN & LIP
car without trees
αIM
= 0.26
αs = 0.1
αs = 0.5
αs = 0.8
Fig. 13 Probability of detection PD versus probability of sensor error q for the LIP, SN and SN & LIPapproaches for image sequence a car with trees from Fig. 5 b car without trees from Fig. 7a
the image sequence of Fig. 5 where the passing of an unknown vehicle is captured in thepresence of significant background variability. Finally Fig. 13b shows the results obtainedfor a truncated version of the passing car and corresponds to the image sequence depicted inFig. 7a. Importantly, the horizontal axes in Figs. 12 and 13 correspond to the probability qof sensor error (due to attack or fault) and the vertical axes correspond to the probability ofdetection PD . The resulting probability of false alarm for the sensor αs is also shown in thefigures for each PD segment along with the probability of false alarm for the LIP algorithmαI M . These probabilities are obtained experimentally based on Eqs. 36 and 37 where No.denotes the number of frames where a certain type of decision was made.
Based on Figs. 12 and 13 we confirm that the PD − PFA performance of the lightweightimage processing exhibits great variability from sequence to sequence. As expected, thisperformance tends to improve for image sequences with better characteristics (such as lessbackground variability). The level of improvement itself however experiences variability ascan be seen by comparing Fig. 12a, b with Fig. 13a, b. We also note the inherent result that theprobability of detection PD and the probability of false alarm PFA for the image processingalgorithm remain constant over the entire range of q . This is fully expected since the visualalgorithm at the camera node is independent of the sensor readings. The lack of predictabilityand control in the LIP algorithm for an arbitrary sequence is a visible disadvantage. However
123
Multidim Syst Sign Process (2009) 20:135–164 157
the constancy of the performance over the range of q is a clear advantage as can be seen bycomparing the SN and SN & LIP curves in Figs. 12 and 13.
Specifically, the PD − PFA performance of the single sensor is excellent for a smallprobability of error q . However if this probability of error is caused by an attack, it maybecome arbitrarily large and dramatically decrease the event acquisition performance (theperformance decreases linearly with increasing q). Indeed in this setup the sensor does notperform a fault/attack detection and therefore an attacker need not be stealthy in the attack, butrather choose any implementable probability of attack q . The combined SN & LIP approachhowever inherits the best of both approaches; the good performance of the sensor given asmall q and the invariance of the LIP approach over the range of q . Thus we observe that thePD − PFA performance of the combined approach is always better than or equal to the bestperformance from among the other two methods. Specifically, for a fixed probability of falsealarm PFA, the probability of detection PD of the combined approach is described by Eq. 38.It is important to note that the probability of false alarm of the sensor αs varies depending onq . Thus for a direct comparison of PD with the LIP, we have to locate the point on the SN &LIP curve where αs ≈ αI M in order to obtain the result of Eq. 38 (as can be seen from thefigures however, the SN & LIP curves lie above the LIP curve for all values of q).
PDcombined ≥ max(PDLIP , PDSN ) (38)
Since combining the LIP with a single sensor decision without cluster head checkingimproves the performance in uncertain environments, it is important to determine if includingcluster head checking and increasing the number of sensors results in a justifiably improvedlevel of performance. Indeed the performance achieved with the “direct sensor approach”may be sufficient for certain applications.
6.2 Cluster head aided event acquisition
In this Section we wish to investigate the role of cluster head checking based on the CHdetector of Sect. 5 and sensor redundancy n in improving the PD − PFA performance inuncertain environments.
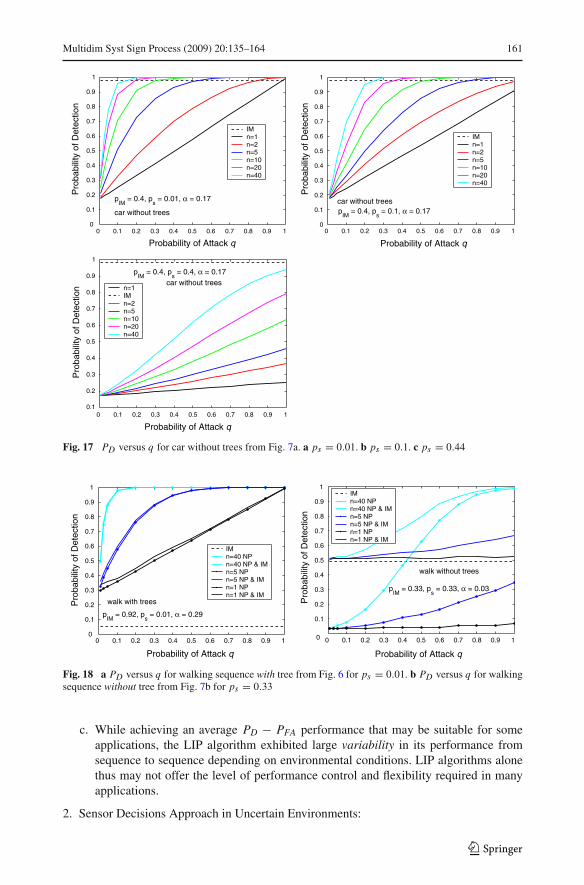
We begin by comparing the relative performance of the LIP algorithm with the perfor-mance of the CH detector (based on decisions from n sensors). Figures 14–17 show the eventacquisition performance of multiple sensors with cluster head detection. Figure 14 corre-sponds to the image sequence of an individual walking with the presence of trees while Fig. 15corresponds to the image sequence of the individual without the background trees. Figure 16corresponds to the car sequences with the presence of trees while Fig. 17 corresponds to thecar sequence without background trees. As before the horizontal axis represents the proba-bility of attack q while the vertical axis corresponds to the probability of detection PD . Theprobability of detection PD of the LIP algorithm for each sequence is also shown in the figuresfor comparison and all probabilities are determined experimentally from Eqs. 36 and 37. Asbefore, the notation IM denotes the image processing (LIP) based performance. The numberof sensors n reporting their decisions to the cluster head is varied from n = 1 to n = 40.
In assessing the relative performance of the LIP algorithm and the CH detector with nsensors in Figs. 14–17 we maintain the same probability of false alarm α. That is, we setαs = αI M
.= α. This is made possible through the adjustability of the CH detector fromSect. 5 through Eq. 29. In contrast, in Sect. 6.1 a single sensor was used instead of a CHdetector. Thus the probability of false alarm αs was not adjustable but rather varied with theattack parameter q .
123
158 Multidim Syst Sign Process (2009) 20:135–164
0 0.1 0.2 0.3 0.4 0.5 0.6 0.7 0.8 0.9 10
0.1
0.2
0.3
0.4
0.5
0.6
0.7
0.8
0.9
1
Probability of Attack q
Pro
babi
lity
of D
etec
tion
IMn=1n=2n=5n=10n=20n=40
walk with trees
pIM
= 0.92, ps = 0.01, α = 0.29
0 0.1 0.2 0.3 0.4 0.5 0.6 0.7 0.8 0.9 10
0.1
0.2
0.3
0.4
0.5
0.6
0.7
0.8
0.9
1
Probability of Attack q
Pro
babi
lity
of D
etec
tion
IMn=1n=2n=5n=10n=20n=40
walk with trees
pIM
= 0.92, ps = 0.1, α = 0.29
0 0.1 0.2 0.3 0.4 0.5 0.6 0.7 0.8 0.9 10
0.1
0.2
0.3
0.4
0.5
0.6
0.7
0.8
0.9
1
Probability of Attack q
Pro
babi
lity
of D
etec
tion
IMn=1n=2n=5n=10n=20n=40
walk with trees
pIM
= 0.92, ps = 0.4, α = 0.29
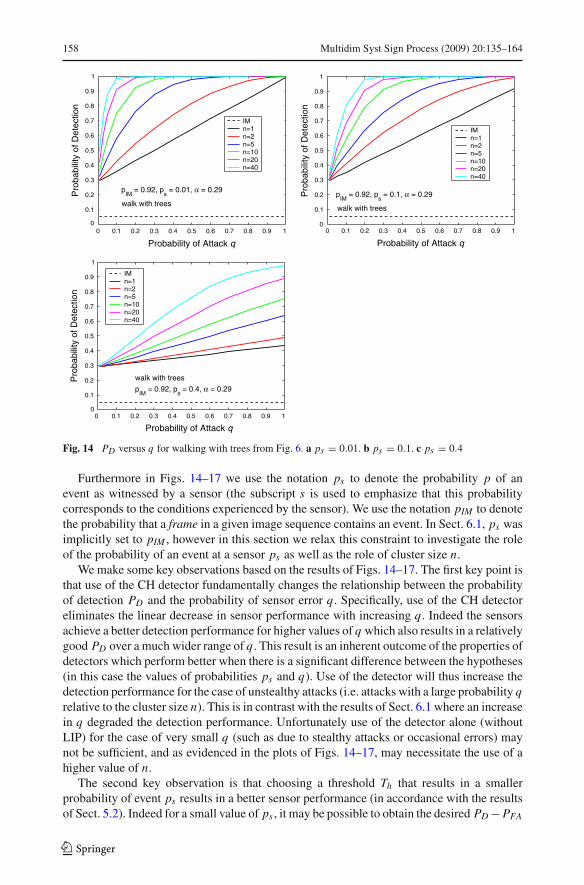
Fig. 14 PD versus q for walking with trees from Fig. 6. a ps = 0.01. b ps = 0.1. c ps = 0.4
Furthermore in Figs. 14–17 we use the notation ps to denote the probability p of anevent as witnessed by a sensor (the subscript s is used to emphasize that this probabilitycorresponds to the conditions experienced by the sensor). We use the notation pIM to denotethe probability that a frame in a given image sequence contains an event. In Sect. 6.1, ps wasimplicitly set to pIM , however in this section we relax this constraint to investigate the roleof the probability of an event at a sensor ps as well as the role of cluster size n.
We make some key observations based on the results of Figs. 14–17. The first key point isthat use of the CH detector fundamentally changes the relationship between the probabilityof detection PD and the probability of sensor error q . Specifically, use of the CH detectoreliminates the linear decrease in sensor performance with increasing q . Indeed the sensorsachieve a better detection performance for higher values of q which also results in a relativelygood PD over a much wider range of q . This result is an inherent outcome of the properties ofdetectors which perform better when there is a significant difference between the hypotheses(in this case the values of probabilities ps and q). Use of the detector will thus increase thedetection performance for the case of unstealthy attacks (i.e. attacks with a large probability qrelative to the cluster size n). This is in contrast with the results of Sect. 6.1 where an increasein q degraded the detection performance. Unfortunately use of the detector alone (withoutLIP) for the case of very small q (such as due to stealthy attacks or occasional errors) maynot be sufficient, and as evidenced in the plots of Figs. 14–17, may necessitate the use of ahigher value of n.
The second key observation is that choosing a threshold Th that results in a smallerprobability of event ps results in a better sensor performance (in accordance with the resultsof Sect. 5.2). Indeed for a small value of ps , it may be possible to obtain the desired PD − PFA
123
Multidim Syst Sign Process (2009) 20:135–164 159
0 0.1 0.2 0.3 0.4 0.5 0.6 0.7 0.8 0.9 10
0.1
0.2
0.3
0.4
0.5
0.6
0.7
0.8
0.9
1
Probability of Attack q
Pro
babi
lity
of D
etec
tion
IMn=1n=2n=5n=10n=20n=40
walk without trees
pIM
= 0.33, ps = 0.01, α = 0.03
0 0.1 0.2 0.3 0.4 0.5 0.6 0.7 0.8 0.9 10
0.1
0.2
0.3
0.4
0.5
0.6
0.7
0.8
0.9
1
Probability of Attack q
Pro
babi
lity
of D
etec
tion
IMn=1n=2n=5n=10n=20n=40
walk without tree
pIM
= 0.33, ps = 0.1, α = 0.03
0 0.1 0.2 0.3 0.4 0.5 0.6 0.7 0.8 0.9 10
0.1
0.2
0.3
0.4
0.5
0.6
0.7
0.8
0.9
1
Probability of Attack q
Pro
babi
lity
of D
etec
tion
IMn=1n=2n=5n=10n=20n=40
walk without trees
pIM
= 0.33, ps = 0.33, α = 0.03
Fig. 15 PD versus q for walking without trees from Fig. 7b. a ps = 0.01. b ps = 0.1. c ps = 0.33
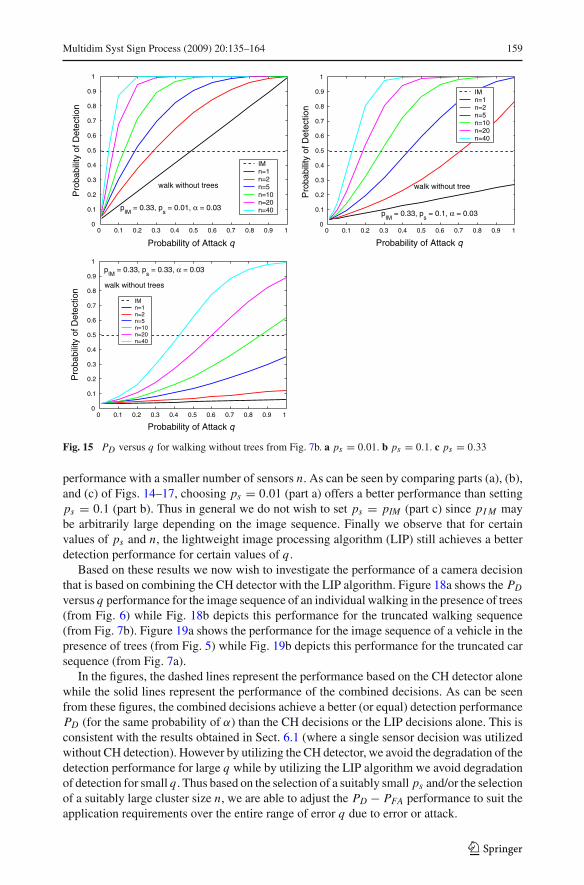
performance with a smaller number of sensors n. As can be seen by comparing parts (a), (b),and (c) of Figs. 14–17, choosing ps = 0.01 (part a) offers a better performance than settingps = 0.1 (part b). Thus in general we do not wish to set ps = pIM (part c) since pI M maybe arbitrarily large depending on the image sequence. Finally we observe that for certainvalues of ps and n, the lightweight image processing algorithm (LIP) still achieves a betterdetection performance for certain values of q .
Based on these results we now wish to investigate the performance of a camera decisionthat is based on combining the CH detector with the LIP algorithm. Figure 18a shows the PD
versus q performance for the image sequence of an individual walking in the presence of trees(from Fig. 6) while Fig. 18b depicts this performance for the truncated walking sequence(from Fig. 7b). Figure 19a shows the performance for the image sequence of a vehicle in thepresence of trees (from Fig. 5) while Fig. 19b depicts this performance for the truncated carsequence (from Fig. 7a).
In the figures, the dashed lines represent the performance based on the CH detector alonewhile the solid lines represent the performance of the combined decisions. As can be seenfrom these figures, the combined decisions achieve a better (or equal) detection performancePD (for the same probability of α) than the CH decisions or the LIP decisions alone. This isconsistent with the results obtained in Sect. 6.1 (where a single sensor decision was utilizedwithout CH detection). However by utilizing the CH detector, we avoid the degradation of thedetection performance for large q while by utilizing the LIP algorithm we avoid degradationof detection for small q . Thus based on the selection of a suitably small ps and/or the selectionof a suitably large cluster size n, we are able to adjust the PD − PFA performance to suit theapplication requirements over the entire range of error q due to error or attack.
123
160 Multidim Syst Sign Process (2009) 20:135–164
0 0.1 0.2 0.3 0.4 0.5 0.6 0.7 0.8 0.9 10
0.1
0.2
0.3
0.4
0.5
0.6
0.7
0.8
0.9
1
Probability of Attack q
Pro
babi
lity
of D
etec
tion
IMn=1n=2n=5n=10n=20n=40
car with trees
pIM
= 0.44, ps = 0.01, α = 0.25
0 0.1 0.2 0.3 0.4 0.5 0.6 0.7 0.8 0.9 10
0.1
0.2
0.3
0.4
0.5
0.6
0.7
0.8
0.9
1
Probability of Attack q
Pro
babi
lity
of D
etec
tion
IMn=1n=2n=5n=10n=20n=40
pIM
= 0.44, ps = 0.1, α = 0.25
car with trees
0 0.1 0.2 0.3 0.4 0.5 0.6 0.7 0.8 0.9 10
0.1
0.2
0.3
0.4
0.5
0.6
0.7
0.8
0.9
1
Probability of Attack q
Pro
babi
lity
of D
etec
tion
IMn=1n=2n=5n=10n=20n=40
car with trees
pIM
= 0.44, ps = 0.44, α = 0.25
Fig. 16 PD versus q for car with trees from Fig. 5. a ps = 0.01. b ps = 0.1. c ps = 0.44
7 Summary and conclusions
Wireless Image Sensor Networks (WISNs) consisting of untethered camera nodes and sensorsmay be deployed in a variety of unattended and possibly hostile environments to obtainsurveillance data. In such settings, the WISN nodes must perform reliable event acquisitionto limit the energy, computation and delay drains associated with forwarding large volumesof image data wirelessly to a sink node.
In this work we investigated the event acquisition properties of WISNs that employ var-ious techniques at the camera nodes to distinguish between event and non-event frames inuncertain environments that may include attacks. These techniques include lightweight imageprocessing, decisions from n sensors with/without cluster head fault and attack detection, anda combination approach relying on both image processing and sensor decisions. In closing,we summarize the resulting properties and observations for event acquisition in WISNs:
1. Lightweight Image Processing (LIP) Approach in Uncertain Environments:
a. LIP algorithms are generally compatible with low-power, low-complexity cameranodes (Rahimi et al. 2005). Indeed analysis demonstrates that through proper thresh-old selection (Sect. 4.3), simple LIP algorithms (such as based on the comparison of asingle frame statistic to a threshold) can be made robust and achieve the best detectionperformance for a given worst-case probability of false alarm.
b. The typical probabilities of detection and false alarm obtained in our experiments wereconsistent with the average probabilities reported in the literature with our PD = 0.87and our PFA = 0.26.
123
Multidim Syst Sign Process (2009) 20:135–164 161
0 0.1 0.2 0.3 0.4 0.5 0.6 0.7 0.8 0.9 10
0.1
0.2
0.3
0.4
0.5
0.6
0.7
0.8
0.9
1
Probability of Attack q
Pro
babi
lity
of D
etec
tion
IMn=1n=2n=5n=10n=20n=40
pIM
= 0.4, ps = 0.01, α = 0.17
car without trees
0 0.1 0.2 0.3 0.4 0.5 0.6 0.7 0.8 0.9 10
0.1
0.2
0.3
0.4
0.5
0.6
0.7
0.8
0.9
1
Probability of Attack q
Pro
babi
lity
of D
etec
tion
IMn=1n=2n=5n=10n=20n=40
car without trees p
IM = 0.4, p
s = 0.1, α = 0.17
0 0.1 0.2 0.3 0.4 0.5 0.6 0.7 0.8 0.9 10.1
0.2
0.3
0.4
0.5
0.6
0.7
0.8
0.9
1
Pro
babi
lity
of D
etec
tion
Probability of Attack q
n=1IMn=2n=5n=10n=20n=40
car without trees p
IM = 0.4, p
s = 0.4, α = 0.17
Fig. 17 PD versus q for car without trees from Fig. 7a. a ps = 0.01. b ps = 0.1. c ps = 0.44
Fig. 18 a PD versus q for walking sequence with tree from Fig. 6 for ps = 0.01. b PD versus q for walkingsequence without tree from Fig. 7b for ps = 0.33
c. While achieving an average PD − PFA performance that may be suitable for someapplications, the LIP algorithm exhibited large variability in its performance fromsequence to sequence depending on environmental conditions. LIP algorithms alonethus may not offer the level of performance control and flexibility required in manyapplications.
2. Sensor Decisions Approach in Uncertain Environments:
Fig. 19 PD versus q for car sequence with tree from Fig. 5 for (a) ps = 0.01 (b) ps = 0.44
a. Sensors deployed in unattended outdoor environments may be prone to occasionalfaults or deliberate attacks that may be carried out in a stealthy manner (i.e. such as toavoid detection). Although quality testing may provide an estimate for the probabilityof a fault, an estimate for the probability of an attack may not be generally availablea priori. Without verification mechanisms, the reliability of the sensor decisions maynot be adequate for some applications.
b. An optimal Neyman-Pearson (NP) fault/attack detector based on the comparison ofa single statistic to a threshold can be implemented at the cluster head to verify thesensor decisions. A detector where the comparison threshold is based on the averageexpected weight (i.e. the count or degree of aggregation) can also be implemented.This detector follows the performance of the NP detector closely, especially for smallvalues of the probability of an event p.
c. For the case of stealthy attacks, use of a cluster head (CH) detector forces the attackerto select a smaller probability of attack q , especially for a larger cluster size n. Thishas the dual effect of rendering attacks more rare but also harder to detect despite theability to predict the optimal attack parameter as given in the analysis of Sect. 5.2.
3. Combined LIP and Sensor Approach:
a. For the case of no cluster head attack/fault verification, combining a single sensordecision with a decision based on a LIP algorithm does provide an improved event ac-quisition performance. Specifically, for a fixed probability of false alarm, the combineddecision achieves a probability of detection PD higher than or equal to the PD of LIPand SN over the entire range of the probability of sensor error q . Although better thanLIP or SN alone, the detection performance does decrease with increasing q , whichwithout cluster head detection, may be arbitrarily large depending on the attacker.
b. Combining decisions from n sensors with cluster head verification and LIP decisionsprovides the best overall performance over the entire range of attack probability q .Specifically, by utilizing the CH detector we avoid the degradation of the detectionperformance for large q while by utilizing the LIP algorithm we avoid degradation ofdetection for small q .
c. Choosing a sensor threshold Th that results in a smaller probability of event ps (depend-ing on the underlying sensor technology) results in a better sensor performance andallows the use of a smaller cluster size n to achieve the desired PD − PFA performance.
123
Multidim Syst Sign Process (2009) 20:135–164 163
Importantly we note that in this work we have focused on the sensor-camera collabora-tion paradigm under different error and attack scenarios. Paradigms that additionally exploitspatial correlations among the cameras may further improve the overall event detection per-formance of the network. Although such paradigms may require additional setup informationto determine the visual correlation among the camera nodes, a study of the trade-offs of suchsystems is of great interest for future work.
References
Aach, T., & Kaup, A. (1993). Statistical model-based change detection in moving video. Signal Processing,31, 165–180.
Aach, T., & Kaup, A. (1995). Bayesian algorithms for adaptive change detection in image sequences usingmarkov random fields. Signal Processing: Image Communication, 1(2), 147–160.
Akyildiz, I., & Kasimoglu, I. (2004). Wireless sensor and actor networks: Research challenges. Ad HocNetworks Journal, 2(4), 3351–3677.
Akyildiz, I., Melodia, T., & Chowdhury, K. (2007). A survey on wireless multimedia sensor networks. Com-puter Networks, 51(4), 921–960.
Bandyopadhyay, S., & Coyle, E. (2003). An energy efficient hierarchical clustering algorithm for wirelesssensor networks. In INFOCOM 2003, pp. 1713–1723.
Basharat, A., Catbas, N., & Shah, M. (2005). A framework for intelligent sensor network with video camera forstructural health monitoring of bridges. In Proceedings Third IEEE International Conference on PervasiveComputing and Communications Workshops, PerCom 2005 Workshops, pp. 385–389.
Buttyan, L., & Hubaux, J. P. (2002). Report on a working session on security in wireless ad hoc networks.Mobile Computing and Communications Review, 6(4), 1–17.
Chan, H., Perrig, A., & Song, D. (2003). Random key predistribution schemes for sensor networks. In IEEESecurity and Privacy, pp. 197–213.
Chow, K. Y., Lui, K. S., & Lam, E. (2006). Balancing image quality and energy consumption in visual sensornetworks. In IEEE International Symposium on Wireless Pervasive Computing (p. 5). Phuket, Thailand.
Chow, K. Y., Lui, K. S., & Lam, E. (2007). Efficient on-demand image transmission in visual sensor networks.Eurasip Journal on Advances in Signal Processing, V, 11 pp.
Czarlinska, A., & Kundur, D. (2008). Reliable scalar-visual event-detection in wireless visual sensor networks.In IEEE CCNC ’08: Consumer Communications & Networking Conference (pp. 660–664). Las Vegas, NV.
Czarlinska, A., Luh, W., & Kundur, D. (2007). Attacks on sensing in hostile wireless sensor-actuator environ-ments. In IEEE Globecom ’07: Global Telecommunications Conference (pp. 1001–1005). Washington, DC.
Eltoweissy, M., Moharrum, M., & Mukkamala, R. (2006). Dynamic key management in sensor networks.IEEE Communications Magazine, 44(4), 122–130.
Eltoweissy, M., Wadaa, A., Olariu, S., & Wilson, L. (2005). Scalable cryptographic key management inwireless sensor networks. Journal of Ad Hoc Networks: Special Issue on Data Communications andTopology Control in Ad Hoc Networks, 7, 796–802.
Feng, W. C., Walpole, J., Feng, W. C., & Pu, C. (2001). Moving towards massively scalable video-basedsensor networks. In Workshop on New Visions for Large-Scale Networks: Research and Applications(p. 385). Washington, DC.
He, T., Krishnamurthy, S., Luo, L., Yan, T., Gu, L., Stoleru, R., Zhou, G., Cao, Q., Vicaire, P., Stankovic,J. A., & Abdelzaher, T. F. (2006). Vigilnet: An integrated sensor network system for energy-efficientsurveillance. ACM Transactions on Sensor Networks, 2(1), 1–38.
He, Z., & Wu, D. (2006). Resource allocation and performance analysis of wireless video sensors. IEEETransactions on Circuits and Systems for Video Technology, 16(5), 590–599.
Ma, H., & Liu, Y. (2005). Correlation based video processing in video sensor networks. In IEEE InternationalConference on Wireless Networks, Communications and Mobile Computing (p. 987). Maui, Hawaii.
Maniezzo, D., Yao, K., & Mazzini, G. (2002). Energetic trade-off between computing and communicationresource in multimedia surveillance sensor network. In 4th IEEE Conference on Mobile and WirelessCommunications Networks (MWCN) (p. 373). Stockholm, Sweden.
Olariu, S., Eltoweissy, M., & Younis, M. (2007). ANSWER: Autonomous networked sensor system. Journalof Parallel and Distributed Computing, 67(1), 111–124.
Ott, R., & Longnecker, M. (2001). An introduction to statistical methods & data analysis. Duxbury Press.Radke, R., Al-Kofahi, S. A. O., & Roysam, B. (2005). Image change detection algorithms: A systematic
survey. IEEE Transactions on Image Processing, 14(3), 294–307.
123
164 Multidim Syst Sign Process (2009) 20:135–164
Rahimi, M., Baer, R., Iroezi, O. I., Garcia, J. C., Warrior, J., Estrin, D., & Srivastava, M. (2005). Cyclops: Insitu image sensing and interpretation in wireless sensor networks. In ACM SenSys ’05, pp. 192–204.
Raymond, D., & Midkiff, S. (2008). Denial-of-service in wireless sensor networks: Attacks and defenses.IEEE Pervasive Computing, 7(1), 74–81.
Rodriguez, V. (2003). Resource management for scalably encoded information: The case of image trans-mission over wireless networks. In IEEE Proceedings 2003 International Conference on Multimedia andExpo (ICME 2003) (pp. I-813–816). Baltimore, MD.
Rosin, P. L. (2002). Thresholding for change detection. Computer Vision and Image Understanding, 86(2),79–95.
Soro, S., & Heinzelman, W. (2005). On the coverage problem in video-based wireless sensor networks. IEEEBroadband Networks, 2, 932–939.
Van Trees, H. L. (2001). Detection, estimation, and modulation theory part I. John Wiley & Sons, Inc.Veeraraghavan, K., Peng, D., & Sharif, H. (2005). Energy efficient multi-resolution visual surveillance on
wireless sensor networks. In IEEE International Conference on Electro Information Technology (6 pp.).Lincoln, NE.
Wu, M., & Chen, C. (2007). Collaborative image coding and transmission over wireless sensor networks.EURASIP Journal on Advances in Signal Processing, 2007, 1–9.
Yu, C., Soro, S., Sharma, G., & Heinzelman, W. (2007). Lifetime-distortion trade-off in image sensornetworks. IEEE ICIP, V, 129–132.
Author Biographies
Alexandra Czarlinska is a Ph.D. candidate in the Wireless Commu-nications Group (WCL) in the Department of Electrical & ComputerEngineering at Texas A&M University. She received her B.A.Sc.degree in Engineering Science (Electrical Option) in 2002 from the Uni-versity of Toronto Canada where she was the recipient of the NationalScholarship Award. Her current research focuses on the identificationand prevention of new security attacks in mobile wireless sensor andactuator networks and on applications of game theory.
Deepa Kundur received the B.A.Sc., M.A.Sc., and Ph.D. degreesall in Electrical and Computer Engineering in 1993, 1995, and 1999,respectively, from the University of Toronto, Canada. In January 2003,she joined the Department of Electrical and Computer Engineering atTexas A&M University, where she is currently an Associate Professorand leads the SeMANTIC (Sensor Media Algorithms and Network-ing for Trusted Intelligent Computing) Research Group of the WirelessCommunications Laboratory. Her research interests include security andprivacy for scalar and broadband sensor networks, multimedia security,digital rights management, and steganalysis for computer forensics. Shehas given tutorials in the area of information security at ICME-2003 andGlobecom-2003, and was a Guest Editor of the June 2004 Proceedingsof the IEEE Special Issue on Enabling Security Technologies for Dig-ital Rights Management. She currently serves as the Vice Chair for the
Security Interest Group of the IEEE Multimedia Communications Technical Committee and is an AssociateEditor for the IEEE Transactions on Multimedia, IEEE Communication Letters, and EURASIP Journal onInformation Security.