Wireshark Lab: TCP v7.0 Supplement to Computer Networking: A Top-Down Approach, 7th ed., J.F. Kurose and K.W. Ross “Tell me and I forget. Show me and I remember. Involve me and I understand.” Chinese proverb
In this lab, we’ll investigate the behavior of the celebrated TCP protocol in detail. We’ll do so by analyzing a trace of the TCP segments sent and received in transferring a 150KB file (containing the text of Lewis Carrol’s Alice’s Adventures in Wonderland) from your computer to a remote server. We’ll study TCP’s use of sequence and acknowledgement numbers for providing reliable data transfer; we’ll see TCP’s congestion control algorithm – slow start and congestion avoidance – in action; and we’ll look at TCP’s receiver-advertised flow control mechanism. We’ll also briefly consider TCP connection setup and we’ll investigate the performance (throughput and round-trip time) of the TCP connection between your computer and the server. 在本实验中,我们将详细研究著名的 TCP 协议的行为。 我们将通过从您的电脑向远程服务器传输一份 150KB 的文件(一份 Lewis Carrol 的“爱丽丝梦游仙境”文本),并分析 TCP传输内容的发送和接收过程来实现。 我们将研究 TCP对序列和确认号的使用,以提供可靠的数据传输;我们将看到 TCP的拥塞控制算法 – 慢启动和拥塞避免 – 在过程中,我们将看看 TCP 的接收器发送流量控制的机制。 我们还将简要地观察 TCP 连线的设置,我们还会研究计算机和服务器之间 TCP 连线的性能(吞吐量和往返时间)。 Before beginning this lab, you’ll probably want to review sections 3.5 and 3.7 in the text1. 在开始本实验之前,您应该先查看课本中的第 3.5和 3.7节。 1. Capturing a bulk TCP transfer from your computer to a remote server (捕获从计算机到远程服务器的批量 TCP传输)
1 References to figures and sections are for the 7th edition of our text, Computer Networks, A Top-down Approach, 7th ed., J.F. Kurose and K.W. Ross, Addison-Wesley/Pearson, 2016.
Before beginning our exploration of TCP, we’ll need to use Wireshark to obtain a packet trace of the TCP transfer of a file from your computer to a remote server. You’ll do so by accessing a Web page that will allow you to enter the name of a file stored on your computer (which contains the ASCII text of Alice in Wonderland), and then transfer the file to a Web server using the HTTP POST method (see section 2.2.3 in the text). We’re using the POST method rather than the GET method as we’d like to transfer a large amount of data from your computer to another computer. Of course, we’ll be running Wireshark during this time to obtain the trace of the TCP segments sent and received from your computer. 在开始我们对 TCP的探索之前,我们需要使用Wireshark来获取文件从计算机到远程服务器的 TCP 传输的数据包内容。您可以通过访问一个网页,在网页上输入您计算机上存储的文件名称(包含 Alice in Wonderland 的 ASCII 文本),然后使用HTTP POST 方法将文件传输到 Web 服务器(见文中第 2.2.3 节)。我们使用POST 方法而不是 GET 方法,因为我们希望将大量数据从您的计算机传输到另一台计算机。当然,我们将在此期间运行 Wireshark 以获取从您的计算机发送和接收的 TCP区段的内容。 Do the following: 执行以下步骤:
• Start up your web browser. Go the http://gaia.cs.umass.edu/wireshark-labs/alice.txt and retrieve an ASCII copy of Alice in Wonderland. Store this file somewhere on your computer. 启动Web浏览器。 在 http://gaia.cs.umass.edu/wireshark-labs/alice.txt查看Alice in Wonderland的 ASCII档案文件。 将此文件存储在计算机上的某个位置。
• Next go to http://gaia.cs.umass.edu/wireshark-labs/TCP-wireshark-file1.html. 接下来去 http://gaia.cs.umass.edu/wireshark-labs/TCP-wireshark-file1.html.
• You should see a screen that looks like: 你将会看到如下图的网页
• Use the Browse button in this form to enter the name of the file (full path name)
on your computer containing Alice in Wonderland (or do so manually). Don’t yet press the “Upload alice.txt file” button. 使用此表单中的“Browse…”按钮在计算机上输入包含 Alice in Wonderland的文件名(完整路径名)(或手动执行)。这个时候请不要按下“Upload alice.txt file”按钮。
• Now start up Wireshark and begin packet capture (Capture->Start) and then press OK on the Wireshark Packet Capture Options screen (we’ll not need to select any options here). 启动Wireshark并开始数据包捕获 (Capture-> Start),然后在Wireshark数据包捕获选项视窗上按 OK (我们不需要在此处选择任何选项)(详细操作因Wireshark版本略有不同)。
• Returning to your browser, press the “Upload alice.txt file” button to upload the file to the gaia.cs.umass.edu server. Once the file has been uploaded, a short congratulations message will be displayed in your browser window. 返回浏览器,按“Upload alice.txt file”按钮将文件上传到 gaia.cs.umass.edu服务器。文件上传后,浏览器窗口中会显示一条简短的祝贺消息。
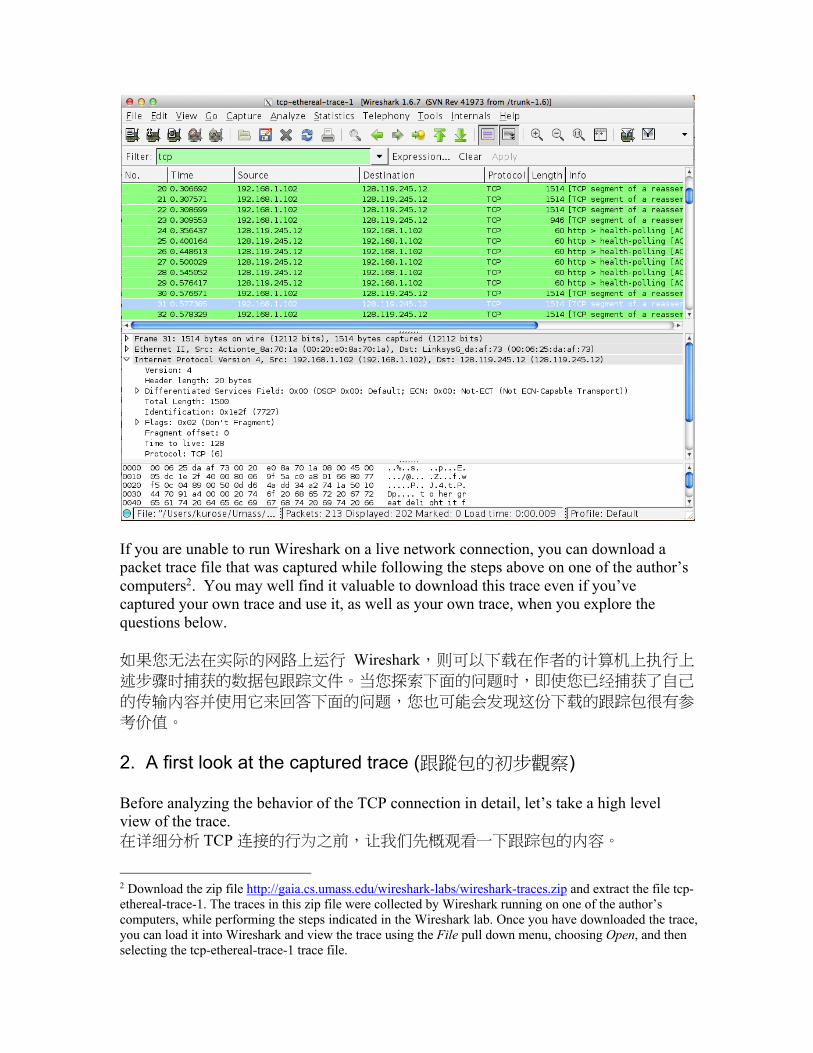
• Stop Wireshark packet capture. Your Wireshark window should look similar to the window shown below. 停止Wireshark数据包捕获。 您的Wireshark视窗内容应该类似于下面显示的内容。
If you are unable to run Wireshark on a live network connection, you can download a packet trace file that was captured while following the steps above on one of the author’s computers2. You may well find it valuable to download this trace even if you’ve captured your own trace and use it, as well as your own trace, when you explore the questions below. 如果您无法在实际的网路上运行 Wireshark,则可以下载在作者的计算机上执行上述步骤时捕获的数据包跟踪文件。当您探索下面的问题时,即使您已经捕获了自己
的传输内容并使用它来回答下面的问题,您也可能会发现这份下载的跟踪包很有参
考价值。 2. A first look at the captured trace (跟蹤包的初步觀察) Before analyzing the behavior of the TCP connection in detail, let’s take a high level view of the trace. 在详细分析 TCP连接的行为之前,让我们先概观看一下跟踪包的内容。
2 Download the zip file http://gaia.cs.umass.edu/wireshark-labs/wireshark-traces.zip and extract the file tcp-ethereal-trace-1. The traces in this zip file were collected by Wireshark running on one of the author’s computers, while performing the steps indicated in the Wireshark lab. Once you have downloaded the trace, you can load it into Wireshark and view the trace using the File pull down menu, choosing Open, and then selecting the tcp-ethereal-trace-1 trace file.
• First, filter the packets displayed in the Wireshark window by entering “tcp” (lowercase, no quotes, and don’t forget to press return after entering!) into the display filter specification window towards the top of the Wireshark window. 首先,在Wireshark视窗顶部的显示的过滤器指定窗口中输入“tcp”(小写,无引号,并且不要忘记在输入后按 enter键!),过滤Wireshark视窗中显示的数据包。
What you should see is series of TCP and HTTP messages between your computer and gaia.cs.umass.edu. You should see the initial three-way handshake containing a SYN message. You should see an HTTP POST message. Depending on the version of Wireshark you are using, you might see a series of “HTTP Continuation” messages being sent from your computer to gaia.cs.umass.edu. Recall from our discussion in the earlier HTTP Wireshark lab, that is no such thing as an HTTP Continuation message – this is Wireshark’s way of indicating that there are multiple TCP segments being used to carry a single HTTP message. In more recent versions of Wireshark, you’ll see “[TCP segment of a reassembled PDU]” in the Info column of the Wireshark display to indicate that this TCP segment contained data that belonged to an upper layer protocol message (in our case here, HTTP). You should also see TCP ACK segments being returned from gaia.cs.umass.edu to your computer. 您应该看到的是计算机和 gaia.cs.umass.edu 之间的一系列 TCP 和 HTTP 讯息。您应该看到包含 SYN 讯息的初始三次握手。您应该看到 HTTP POST 讯息。根据您使用的 Wireshark 的版本,您可能会看到从您的计算机向 gaia.cs.umass.edu 发送一系列“HTTP Continuation”讯息。 回想一下我们在早期的 HTTP Wireshark实验室中的讨论,这不是 HTTP Continuation消息 – 这是Wireshark指示有多个 TCP区段用于承载单个 HTTP 讯息的方式。在 Wireshark 的最新版本中,您将在 Wireshark显示的 Info 列中看到“[重新组装的 PDU 的 TCP 段]”,以指示此 TCP 区段包含属于上层协议讯息的数据(在我们的示例中为,HTTP)。您还应该看到从gaia.cs.umass.edu返回到您的计算机的 TCP ACK区段。 Answer the following questions, by opening the Wireshark captured packet file tcp-ethereal-trace-1 in http://gaia.cs.umass.edu/wireshark-labs/wireshark-traces.zip (that is download the trace and open that trace in Wireshark; see footnote 2). Whenever possible, when answering a question you should hand in a printout of the packet(s) within the trace that you used to answer the question asked. Annotate the printout3 to explain your answer. To print a packet, use File->Print, choose Selected packet only, choose Packet summary line, and select the minimum amount of packet detail that you need to answer the question.
3 What do we mean by “annotate”? If you hand in a paper copy, please highlight where in the printout you’ve found the answer and add some text (preferably with a colored pen) noting what you found in what you ‘ve highlight. If you hand in an electronic copy, it would be great if you could also highlight and annotate.
1. What is the IP address and TCP port number used by the client computer (source) that is transferring the file to gaia.cs.umass.edu? To answer this question, it’s probably easiest to select an HTTP message and explore the details of the TCP packet used to carry this HTTP message, using the “details of the selected packet header window” (refer to Figure 2 in the “Getting Started with Wireshark” Lab if you’re uncertain about the Wireshark windows. 将文件传输到 gaia.cs.umass.edu的客户端计算机(源)使用的 IP地址和TCP端口号是什么? 要回答这个问题,最简单的方法是使用“所选数据包标头的详细信息”视窗,选择 HTTP讯息并探索用于携带此 HTTP讯息的TCP数据包的详细信息(如果你不确定是哪一个Wireshark视窗。请参阅“Getting Started with Wireshark”实验中的图 2 )
2. What is the IP address of gaia.cs.umass.edu? On what port number is it sending and receiving TCP segments for this connection? gaia.cs.umass.edu的 IP地址是什么? 在哪个端口号上发送和接收此连接的TCP区段?
If you have been able to create your own trace, answer the following question: 如果您能够连网并使用Wireshark创建自己的跟踪包,请回答以下问题:
3. What is the IP address and TCP port number used by your client computer (source) to transfer the file to gaia.cs.umass.edu? 客户端计算机(源)将文件传输到 gaia.cs.umass.edu所使用的 IP地址和TCP端口号是多少?
Since this lab is about TCP rather than HTTP, let’s change Wireshark’s “listing of captured packets” window so that it shows information about the TCP segments containing the HTTP messages, rather than about the HTTP messages. To have Wireshark do this, select Analyze->Enabled Protocols. Then uncheck the HTTP box and select OK. You should now see a Wireshark window that looks like: 由于本实验是关于 TCP而不是 HTTP,让我们更改Wireshark的“捕获数据包列表”视窗,以便显示有关包含 HTTP讯息的 TCP区段的信息,而不是 HTTP讯
This is what we’re looking for - a series of TCP segments sent between your computer and gaia.cs.umass.edu. We will use the packet trace that you have captured (and/or the packet trace tcp-ethereal-trace-1 in http://gaia.cs.umass.edu/wireshark-labs/wireshark-traces.zip; see earlier footnote) to study TCP behavior in the rest of this lab. 这就是我们正在寻找的 – 在您的计算机和 gaia.cs.umass.edu之间发送的一系列 TCP区段。我们将使用您捕获的数据包跟踪(和/或 http://gaia.cs.umass.edu/wireshark-labs/wireshark-traces.zip中的数据包跟踪 tcp-ethereal-trace-1:请参阅前面的脚注 )在本实验的其余部分研究 TCP行为。 3. TCP Basics (TCP基础) Answer the following questions for the TCP segments: 回答下列关于 TCP区段的问题:
4. What is the sequence number of the TCP SYN segment that is used to initiate the TCP connection between the client computer and gaia.cs.umass.edu? What is it
in the segment that identifies the segment as a SYN segment? 用于在客户端计算机和 gaia.cs.umass.edu之间启动 TCP连接的 TCP SYN区段的序列号是什么? 将区段标识为 SYN区段的区段有什么功能?
5. What is the sequence number of the SYNACK segment sent by gaia.cs.umass.edu to the client computer in reply to the SYN? What is the value of the Acknowledgement field in the SYNACK segment? How did gaia.cs.umass.edu determine that value? What is it in the segment that identifies the segment as a SYNACK segment? gaia.cs.umass.edu发送给客户端计算机以回复 SYN的 SYNACK区段的序列号是多少? SYNACK区段中的 Acknowledgment栏位的值是多少? Gaia.cs.umass.edu是如何确定此 Acknowledgment的数值的? 在将区段标识为 SYNACK区段的区段在连线中有什么功能?
6. What is the sequence number of the TCP segment containing the HTTP POST command? Note that in order to find the POST command, you’ll need to dig into the packet content field at the bottom of the Wireshark window, looking for a segment with a “POST” within its DATA field. 包含 HTTP POST命令的 TCP区段的序列号是多少? 请注意,为了找到POST命令,您需要深入了解Wireshark窗口底部的数据包内容字段,在其DATA栏位中查找带有“POST”的区段。
7. Consider the TCP segment containing the HTTP POST as the first segment in the TCP connection. What are the sequence numbers of the first six segments in the TCP connection (including the segment containing the HTTP POST)? At what time was each segment sent? When was the ACK for each segment received? Given the difference between when each TCP segment was sent, and when its acknowledgement was received, what is the RTT value for each of the six segments? What is the EstimatedRTT value (see Section 3.5.3, page 242 in text) after the receipt of each ACK? Assume that the value of the EstimatedRTT is equal to the measured RTT for the first segment, and then is computed using the EstimatedRTT equation on page 242 for all subsequent segments. 将包含 HTTP POST的 TCP区段视为 TCP连接中的第一个区段。在这个TCP连线中前六个 TCP区段的序列号是什么(包括包含 HTTP POST的段)? 每区段发送的时间是什么时候? 收到的每个区段的 ACK是什么时候? 鉴于发送每个 TCP区段的时间与收到确认的时间之间的差异,六个区段中每个区段的 RTT值是多少? 收到每个 ACK后,EstimatedRTT值(参见本节中的第 3.5.3节,第 242页)是什么? 假设第一个 EstimatedRTT的值等于第一个区段的测量 RTT,然后使用课本第 242页的 EstimatedRTT公
式计算所有后续区段。(译注:中译本的页数可能不同)
Note: Wireshark has a nice feature that allows you to plot the RTT for each of the TCP segments sent. Select a TCP segment in the “listing of captured packets” window that is being sent from the client to the gaia.cs.umass.edu server. Then select: Statistics->TCP Stream Graph->Round Trip Time Graph. 注意:Wireshark有一个很好的功能,允许您为发送的每个 TCP区段绘制 RTT。 在从客户端发送到 gaia.cs.umass.edu服务器的“捕获的数据包列表”窗口中选择一个 TCP段。 然后选择:Statistics-> TCP Stream Graph-> Round Trip Time Graph。
8. What is the length of each of the first six TCP segments?4 前六个 TCP区段的长度是多少?
9. What is the minimum amount of available buffer space advertised at the received for the entire trace? Does the lack of receiver buffer space ever throttle the sender? 对于整个跟踪包,收到的最小可用缓冲区空间量是多少? 缺少接收器缓冲区空间是否会限制发送方传送 TCP区段?
10. Are there any retransmitted segments in the trace file? What did you check for (in the trace) in order to answer this question? 在跟踪文件中是否有重传的区段? 为了回答这个问题,您检查了什么(在跟踪包中)?
11. How much data does the receiver typically acknowledge in an ACK? Can you identify cases where the receiver is ACKing every other received segment (see Table 3.2 on page 250 in the text). 接收器通常在 ACK中确认多少数据? 您是否可以识别接收方每隔一个接收到的区段才发送确认的情况(参见本文第 250页的表 3.2)。
12. What is the throughput (bytes transferred per unit time) for the TCP connection? Explain how you calculated this value.
4 The TCP segments in the tcp-ethereal-trace-1 trace file are all less that 1460 bytes. This is because the computer on which the trace was gathered has an Ethernet card that limits the length of the maximum IP packet to 1500 bytes (40 bytes of TCP/IP header data and 1460 bytes of TCP payload). This 1500 byte value is the standard maximum length allowed by Ethernet. If your trace indicates a TCP length greater than 1500 bytes, and your computer is using an Ethernet connection, then Wireshark is reporting the wrong TCP segment length; it will likely also show only one large TCP segment rather than multiple smaller segments. Your computer is indeed probably sending multiple smaller segments, as indicated by the ACKs it receives. This inconsistency in reported segment lengths is due to the interaction between the Ethernet driver and the Wireshark software. We recommend that if you have this inconsistency, that you perform this lab using the provided trace file.
4. TCP congestion control in action (TCP壅塞控制) Let’s now examine the amount of data sent per unit time from the client to the server. Rather than (tediously!) calculating this from the raw data in the Wireshark window, we’ll use one of Wireshark’s TCP graphing utilities - Time-Sequence-Graph(Stevens) - to plot out data. 现在让我们检查从客户端服务器的每单位时间发送的数据量。 而不是(繁琐地!)从Wireshark窗口中的原始数据计算这些数值,我们将使用Wireshark的TCP图形工具 – 时序图(Stevens) - 来绘制数据。
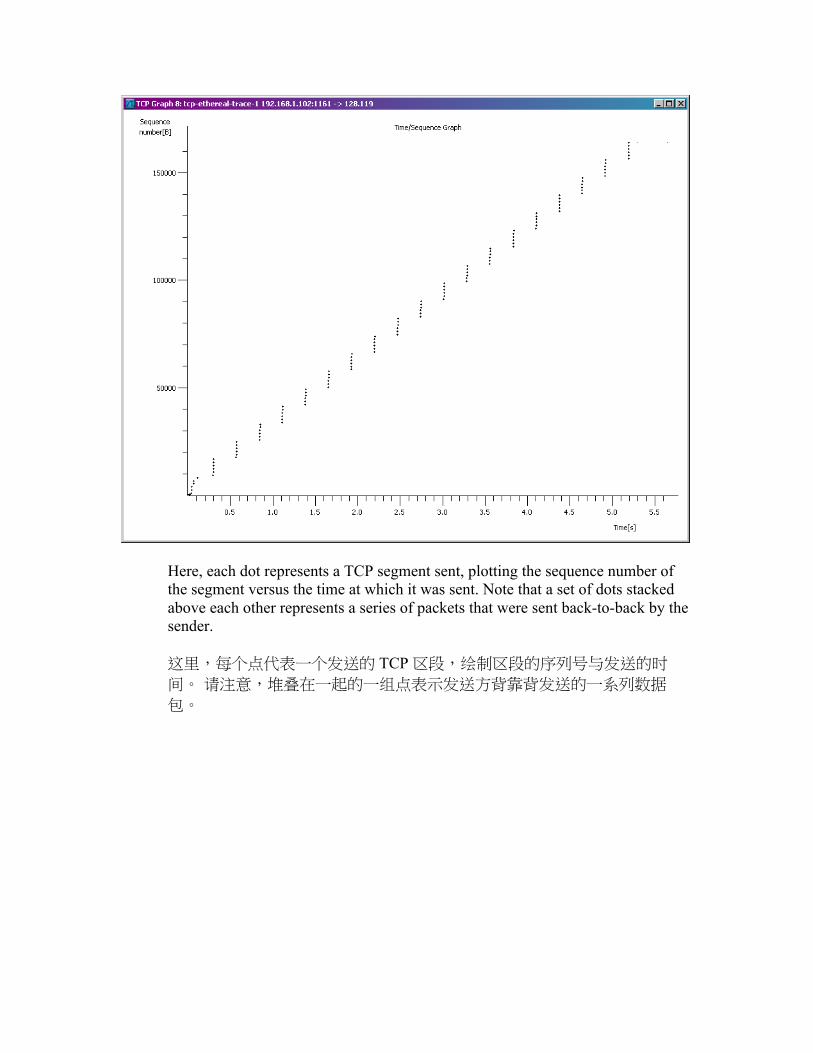
• Select a TCP segment in the Wireshark’s “listing of captured-packets” window. Then select the menu : Statistics->TCP Stream Graph-> Time-Sequence-Graph(Stevens). You should see a plot that looks similar to the following plot, which was created from the captured packets in the packet trace tcp-ethereal-trace-1 in http://gaia.cs.umass.edu/wireshark-labs/wireshark-traces.zip (see earlier footnote ): 在Wireshark的“捕获数据包列表”窗口中选择一个 TCP区段。然后选择菜单:Statistics-> TCP Stream Graph-> Time-Sequence-Graph(Stevens)。您应该看到一个类似于下图的图,该图是根据 http://gaia.cs.umass.edu/wireshark-labs/wireshark-traces.zip中的跟踪数据包 tcp-ethereal-trace-1中捕获的资料所创建的。(见前面的附注):
Here, each dot represents a TCP segment sent, plotting the sequence number of the segment versus the time at which it was sent. Note that a set of dots stacked above each other represents a series of packets that were sent back-to-back by the sender. 这里,每个点代表一个发送的 TCP区段,绘制区段的序列号与发送的时间。 请注意,堆叠在一起的一组点表示发送方背靠背发送的一系列数据包。
Answer the following questions for the TCP segments the packet trace tcp-ethereal-trace-1 in http://gaia.cs.umass.edu/wireshark-labs/wireshark-traces.zip 根据在 http://gaia.cs.umass.edu/wireshark-labs/wireshark-traces.zip中的数据跟踪包tcp-ethereal-trace-1内容回答以下有关 TCP区段的问题
13. Use the Time-Sequence-Graph(Stevens) plotting tool to view the sequence number versus time plot of segments being sent from the client to the gaia.cs.umass.edu server. Can you identify where TCP’s slowstart phase begins and ends, and where congestion avoidance takes over? Comment on ways in which the measured data differs from the idealized behavior of TCP that we’ve studied in the text. 使用时序图(Stevens)绘图工具查看从客户端发送到 gaia.cs.umass.edu服务器的区段的序列号与时间关系图。您能否确定 TCP的慢启动阶段的开始和结束位置,以及拥塞避免接管的位置? 评论测量数据与我们在文本中研究的 TCP的理想化行为的不同之处。
14. Answer each of two questions above for the trace that you have gathered when you transferred a file from your computer to gaia.cs.umass.edu 根据你使用Wireshark所收集到的资料(将文件从计算机传输到gaia.cs.umass.edu时的跟踪包信息),回答问题 13中的两个问题。