Wisconsin Dairy Farms by Herd Size, 2007 Source: USDA/NASS, Farms, Land in Farms, and Livestock Operations Summary . 2,100 3,500 5,800 1,700 820 280 0 2,000 4,000 6,000 8,000 1-29 Head 30-49 Head 50-99 Head 100-199 Head 200-499 Head 500 + Head
Transcript
Wisconsin Dairy Farms by Herd Size, 2007Wisconsin Dairy Farms by Herd Size, 2007
Source: USDA/NASS, Farms, Land in Farms, and Livestock Operations Summary.
* Preliminary estimate.1Includes fluid milk and cream.
Source: ERS/USDA, Livestock, Dairy and Poultry Outlook.
U.S. Per Capita Fluid Milk1 Consumption, 1982-2007*
Milk UtilizationMilk Utilization
13.8%
35.0% 37.6%
13.6% 13.2%
37.2%33.2%
16.4%13.6%
40.0%
32.4%
14.0%
0%
10%
20%
30%
40%
50%
1996 2001 2006
Butter Cheese Fluid All Other
Source: IDFA, Dairy Facts, 2006.
U.S. Utilization of Milk by Product Type
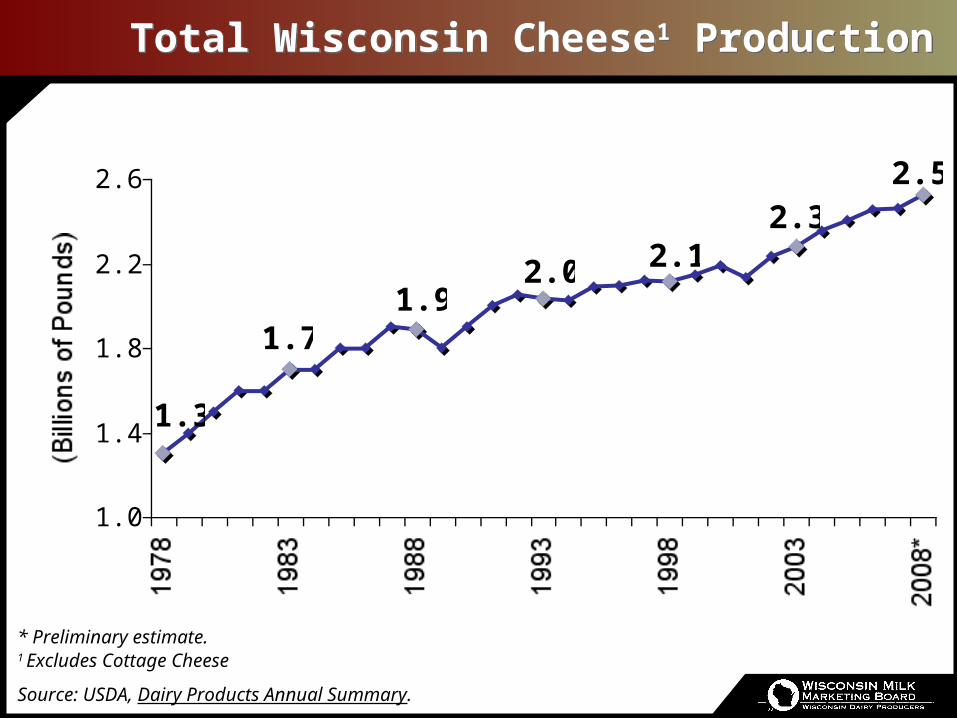
Total Wisconsin Cheese1 ProductionTotal Wisconsin Cheese1 Production
* Preliminary estimate.1 Excludes Cottage Cheese
Source: USDA, Dairy Products Annual Summary.
0
70
140
210
280
350
420
1978 1983 1988 1993 1998 2003 2008*
0
500
1,000
1,500
2,000
2,500
3,000 (Millions of Pounds)
Number of Cheese Plants Cheese Production
# of Plants Cheese Production
Wisconsin Cheese1 Production & Number of Plants
2.52.3
2.12.01.9
1.7
1.3
1.0
1.4
1.8
2.2
2.6
1978 1983 1988 1993 1998 2003 2008*
(Billions of Pounds)
Total Wisconsin Cheese1 ProductionTotal Wisconsin Cheese1 Production
* Preliminary estimate.1 Excludes Cottage Cheese
Source: USDA, Dairy Products Annual Summary.
U.S. Cheese ConsumptionU.S. Cheese Consumption
27.529.0
30.0 30.5 31.632.7
10
14
18
22
26
30
34
(Pounds)
1997 1999 2001 2003 2005 2007
Per Capita Cheese Consumption, 1997-2007*
* Preliminary estimate.
Source: USDA/ERS, Livestock, Dairy, and Poultry Outlook.
U.S. Cheese ConsumptionU.S. Cheese Consumption
19.9
24.125.9
27.5
30.532.7
10
14
18
22
26
30
34
(Pounds)
1982 1987 1992 1997 2002 2007
Per Capita Cheese Consumption, 1982-2007*
* Preliminary estimate.
Source: USDA/ERS, Livestock, Dairy, and Poultry Outlook.
82.251.9
49.445.2
39.536.5
32.724.2
22.8
22.321.0
Greece
France
Malta
Germany
Austria
Cyprus
United States
Argentina
Australia
United Kingdom
Canada
(Pounds)
International Cheese ConsumptionInternational Cheese Consumption
Source: USDA/FAS, Production, Supply and Distribution Online Database; EuroStat Yearbook; US Census Bureau, International Database; USDA/ERS, Livestock, Dairy and Poultry Outlook.