28
Wisconsin Health Care Workforce 2016 Report Wisconsin Hospital Association | 2016 Workforce Report Wisconsin Health Care Workforce 2016 Report

Wisconsin Health Care Workforce 2016 Report
Wisconsin Hospital Association | 2016 Workforce Report
Wisconsin Health Care Workforce 2016 Report


About This Report
As chief executive officer of a Wisconsin hospital and chair of the Wisconsin Hospital Association Council on Workforce Development, I am often asked about the health care workforce issues that challenge leaders like me on a daily basis. Many of these issues are not new, such as the aging workforce, which is really a mere reflection of the aging population. Yes, the workforce is aging in place as are so many Wisconsin residents. The challenges this places on the continuation of delivering high-quality, high-value health care that Wisconsin is nationally known for are great. However, I am confident my fellow health care leaders, along with Wisconsin’s fine educational institutions, dedicated elected officials and policymakers remain committed to upholding this quality. Innovations in health care delivery models such as expanding team-based care not only in settings previously underutilized along with the recognition and incorporation of emerging roles into existing models are just a few of the approaches creative and bold leaders are using.
WHA has long been recognized as a leader in health care workforce. This 2016 Wisconsin Health Care Workforce Report is the 13th annual report based on data collected by WHA in its Annual Personnel Survey. This survey is a tool that collects data from all WHA member hospitals. The Personnel Survey is a supplement to the Annual Survey published and collected by the WHA Information Center each year. The Personnel Survey collects workforce information to better track, analyze, and understand workforce issues that affect Wisconsin hospitals. The Personnel Survey is sent to all Wisconsin hospitals, and the data collected has been included in publications and data sets since 2000—with a nearly 100 percent completion rate each year and includes vacancy rate data for 19 different health care occupations. Since this survey has been administered by WHA for more than 15 years and the survey design has remained relatively unchanged, it facilitates the development of reliable trends and forecasts. I know I am not alone in my appreciation for the information and guidance this data and resulting reports provides.
However, as important as this data is for addressing workforce issues, it cannot by itself answer all the questions. First, the data collected by WHA is from hospitals only. It does not reflect the demand of other health care employers such as extended care and skilled nursing facilities. It does not reflect the demand of those employing health care workers in the community. And perhaps most importantly, the understanding of the “supply” side of the workforce equation is grossly lacking in Wisconsin. Apart from Wisconsin’s nursing data, which is often cited as the “gold standard” in data collection, no reputable, reliable or reproducible method of standardized data collection exists for all other health care workers in Wisconsin. Existing health care resources are often scarce, and health care leaders, elected officials and educational institutions all are faced with difficult budgetary decisions. Funding priorities related to workforce, especially those with taxpayer dollars, should be based on sound, quantifiable data and not individual, anecdotal stories, no matter how compelling these stories may be.
High-quality care depends largely on a high-quality workforce. This report should assist you as a health care leader in making the important decisions that impact that workforce.
Nicole Clapp, FACHEPresident/CEO, Grant Regional Health Center, LancasterChair, WHA Council on Workforce Development
Nicole Clapp

Table of Contents Introduction . . . . . . . . . . . . . . . . . . . . . . . . . . . . . . . . . . . . . . . . . . . . . . . . . . . . . . . . . . . . . . . . . . . . . . . . . . . . 12016 Health Care Workforce Trends . . . . . . . . . . . . . . . . . . . . . . . . . . . . . . . . . . . . . . . . . . . . . . . . . . . . . 2 Brief Review of Global and U.S. Population Demographics . . . . . . . . . . . . . . . . . . . . . . . . . . . . 2 Global Trends . . . . . . . . . . . . . . . . . . . . . . . . . . . . . . . . . . . . . . . . . . . . . . . . . . . . . . . . . . . . . . 2 U.S. Trends. . . . . . . . . . . . . . . . . . . . . . . . . . . . . . . . . . . . . . . . . . . . . . . . . . . . . . . . . . . . . . . . . 215-Year Retrospective Review of Select Health Care Occupations . . . . . . . . . . . . . . . . . . . . . . . . . 3 Wisconsin Health Care Report Data Sources. . . . . . . . . . . . . . . . . . . . . . . . . . . . . . . . . . . . . . . . . 3 Registered Nurses . . . . . . . . . . . . . . . . . . . . . . . . . . . . . . . . . . . . . . . . . . . . . . . . . . . . . . . . . . . . . . . . . 3 Licensed Practical Nurses . . . . . . . . . . . . . . . . . . . . . . . . . . . . . . . . . . . . . . . . . . . . . . . . . . . . . . . . . . 6 Certified Nurse Aides . . . . . . . . . . . . . . . . . . . . . . . . . . . . . . . . . . . . . . . . . . . . . . . . . . . . . . . . . . . . . . 6 Pharmacists . . . . . . . . . . . . . . . . . . . . . . . . . . . . . . . . . . . . . . . . . . . . . . . . . . . . . . . . . . . . . . . . . . . . . . . 8 Pharmacy Technicians/Aides. . . . . . . . . . . . . . . . . . . . . . . . . . . . . . . . . . . . . . . . . . . . . . . . . . . . . . . . 9 Dieticians . . . . . . . . . . . . . . . . . . . . . . . . . . . . . . . . . . . . . . . . . . . . . . . . . . . . . . . . . . . . . . . . . . . . . . . . . 10 Other Technicians . . . . . . . . . . . . . . . . . . . . . . . . . . . . . . . . . . . . . . . . . . . . . . . . . . . . . . . . . . . . . . . . . 11 Physical Therapists . . . . . . . . . . . . . . . . . . . . . . . . . . . . . . . . . . . . . . . . . . . . . . . . . . . . . . . . . . . . . . . . 12 Occupational Therapists . . . . . . . . . . . . . . . . . . . . . . . . . . . . . . . . . . . . . . . . . . . . . . . . . . . . . . . . . . . 12 Respiratory Therapists . . . . . . . . . . . . . . . . . . . . . . . . . . . . . . . . . . . . . . . . . . . . . . . . . . . . . . . . . . . . . 13 Advanced Practice Clinicians . . . . . . . . . . . . . . . . . . . . . . . . . . . . . . . . . . . . . . . . . . . . . . . . . . . . . . . 14 Physician Assistants . . . . . . . . . . . . . . . . . . . . . . . . . . . . . . . . . . . . . . . . . . . . . . . . . . . . . . . . 14 Advanced Practice Nurses . . . . . . . . . . . . . . . . . . . . . . . . . . . . . . . . . . . . . . . . . . . . . . . . . . . . . . . . . . 14 Nurse Practitioners . . . . . . . . . . . . . . . . . . . . . . . . . . . . . . . . . . . . . . . . . . . . . . . . . . . . . . . . . 14 Certified Registered Nurse Anesthetists . . . . . . . . . . . . . . . . . . . . . . . . . . . . . . . . . . . . . . 15 Clinical Nurse Specialists. . . . . . . . . . . . . . . . . . . . . . . . . . . . . . . . . . . . . . . . . . . . . . . . . . . . 15 Certified Nurse Midwives . . . . . . . . . . . . . . . . . . . . . . . . . . . . . . . . . . . . . . . . . . . . . . . . . . . 15Educational Preparation of Select Health Care Professions . . . . . . . . . . . . . . . . . . . . . . . . . . . . . . . . 16 Nursing . . . . . . . . . . . . . . . . . . . . . . . . . . . . . . . . . . . . . . . . . . . . . . . . . . . . . . . . . . . . . . . . . . . . . . . . . . . 16 Certified Nurse Aides . . . . . . . . . . . . . . . . . . . . . . . . . . . . . . . . . . . . . . . . . . . . . . . . . . . . . . . . . . . . . . 17 Pharmacy Techs/Aides . . . . . . . . . . . . . . . . . . . . . . . . . . . . . . . . . . . . . . . . . . . . . . . . . . . . . . . . . . . . . 18WHA’s 3 P Model of Care Delivery . . . . . . . . . . . . . . . . . . . . . . . . . . . . . . . . . . . . . . . . . . . . . . . . . . . . . . 18 Practice . . . . . . . . . . . . . . . . . . . . . . . . . . . . . . . . . . . . . . . . . . . . . . . . . . . . . . . . . . . . . . . . . . . . . . . . . . . 18 Policy . . . . . . . . . . . . . . . . . . . . . . . . . . . . . . . . . . . . . . . . . . . . . . . . . . . . . . . . . . . . . . . . . . . . . . . . . . . . . 18 Payment . . . . . . . . . . . . . . . . . . . . . . . . . . . . . . . . . . . . . . . . . . . . . . . . . . . . . . . . . . . . . . . . . . . . . . . . . . 18Optimal Utilization of Team-Based Care . . . . . . . . . . . . . . . . . . . . . . . . . . . . . . . . . . . . . . . . . . . . . . . . . 19Evidence-Based Care Requires Evidence. . . . . . . . . . . . . . . . . . . . . . . . . . . . . . . . . . . . . . . . . . . . . . . . . . 19 Importance of Data . . . . . . . . . . . . . . . . . . . . . . . . . . . . . . . . . . . . . . . . . . . . . . . . . . . . . . . . . . . . . . . . 19WHA Summary and Recommendations . . . . . . . . . . . . . . . . . . . . . . . . . . . . . . . . . . . . . . . . . . . . . . . . . . 20 Summary. . . . . . . . . . . . . . . . . . . . . . . . . . . . . . . . . . . . . . . . . . . . . . . . . . . . . . . . . . . . . . . . . . . . . . . . . . 20 Recommendations . . . . . . . . . . . . . . . . . . . . . . . . . . . . . . . . . . . . . . . . . . . . . . . . . . . . . . . . . . . . . . . . . 20 Educators . . . . . . . . . . . . . . . . . . . . . . . . . . . . . . . . . . . . . . . . . . . . . . . . . . . . . . . . . . . . . . . . . . 20 Employers . . . . . . . . . . . . . . . . . . . . . . . . . . . . . . . . . . . . . . . . . . . . . . . . . . . . . . . . . . . . . . . . . . 21 Policymakers . . . . . . . . . . . . . . . . . . . . . . . . . . . . . . . . . . . . . . . . . . . . . . . . . . . . . . . . . . . . . . . 21References and Additional Resources . . . . . . . . . . . . . . . . . . . . . . . . . . . . . . . . . . . . . . . . . . . . . . . . . . . . 22

Wisconsin Health Care Workforce 2016 Report 1
IntroductionWisconsin hospital and health care system leaders stand at an important crossroads in 2016. For years, workforce experts have been closely monitoring both the anticipated as well as actual shortages in the health care labor market. A rapidly aging population in Wisconsin is even outpacing the aging population nationwide, placing multiple burdens on an already taxed health care delivery system. The aging population is not just impacting those patients that Wisconsin hospitals serve, but also impacts the actual workforce itself. As the general population ages, so does the workforce. The recession of 2008 might have slowed the number of health care workers who retired, but as the economy has recovered, the data now shows the “Great Recession” is being followed by the “Great Retirement,” indicating the long-awaited “silver tsunami” of impending retirements has begun to crash ashore.
After years of relative equilibrium, the job market for nurses is heating up in many markets, driving up wages and sign-on bonuses for the nation’s fifth-largest occupation (1). The last nursing shortage, more than a decade ago, resolved when a surge of nursing graduates filled many positions, and the recession led many older nurses to delay retirement. As the economy continues to improve, nurses who held on to jobs through the uneven recovery are now retiring or cutting back hours. The departures come at the same time as demand for nurses has increased, due largely to expanded insurance coverage from job growth and the Affordable Care Act (ACA) as well as the health care needs of the nation’s aging population.
This retirement wave, which might be more appropriately described as a tsunami, has led to reports of wage increases across Wisconsin. National data show a stable nurse workforce in recent years, with the average U.S. nurse’s wage flat and enough new graduates to offset retirees (2). Although Wisconsin data also shows a relatively flat market over the past few years, this data lags the emerging regional pockets of shortages with reports of significant difficulty in hiring nurses, especially in specialty areas such as intensive care, obstetrics and surgery. WHA members report the proliferation of new nursing jobs outside of hospitals has also strained supply. Adding to this already-challenging environment is the phenomena of turnover, or “churn.” In Wisconsin, registered nurses have a 13.4 percent turnover rate. Medical laboratory techs have an even higher rate of 18.6 percent. And perhaps most alarming of all is the staggering rate of turnover among certified nurse aides (CNAs). This demanding and low-paying position has a turnover rate of 23 percent (3).
For Wisconsin hospitals, which employ more than half of the state’s 87,000 nurses, too few nurses means a scramble for essential staff and higher labor costs that can impact bottom lines. Costly temporary and agency nurses along with overtime pay drive up expenses. A once common strategy of the 1990s, sign-on bonuses of $5,000, $10,000 or more, are “back with a vengeance” (3) and are increasingly common in many parts of the country. Similar bonuses are apparent in many advertisements in Wisconsin, and those seen frequently in publications such as Nursing Matters. Nationally about 2.5 percent of nursing positions listed in September 2016 at career website Indeed.com offered job seekers a signing bonus, up from 0.5 percent in 2013 (1).
Projections by leading experts and researchers, based in part on analysis of demographic trends, retirement rates, and health care graduation rates, show that there will not be enough health care workers to meet the growing demand in the coming decade (4). And so, standing at this crossroads, Wisconsin health care leaders are faced with difficult decisions. One choice is to continue the journey of the past several years: monitor workforce data, reports and recommendations and make small incremental change—in essence, reacting to the health care workforce environment. Bold leaders will choose another path, utilizing data to make significant changes as they proactively address workforce shortages through the re-evaluation of existing approaches and health care delivery models. No longer can leaders simply replace exiting workers. For most occupations, the pipeline is running dry, or cannot be increased to a rate that meets demand. Completely redesigned delivery models, incorporating new roles as well as traditional roles doing new things, must be considered if Wisconsin hospitals are to remain national leaders in quality and value.
Turnover rate among CNAs:
23%

2
The data collected by the Wisconsin Hospital Association (WHA), along with other sources, was used to develop the 2016 Workforce Report. For the past 16 years WHA has been collecting in-depth health care workforce data. This data enables WHA to not only report results, but to make actual workforce projections. The data collected primarily is a reflection of the “demand” data. As important as this data is for addressing workforce issues, it cannot by itself answer all the questions. First, the data collected by WHA is from hospitals only. It does not reflect the demand of other health care employers such as extended care and skilled nursing facilities. It does not reflect the demand of those employing health care workers in the community. And perhaps most importantly, the understanding of the “supply” side of the workforce equation is grossly lacking in Wisconsin. Apart from nursing data, which is often cited as the “gold standard” in data collection and will be discussed in depth later in this report, no reputable, reliable or reproducible method of standardized data collection exists for all other health care workers in Wisconsin. Existing health care resources are often scarce and health care leaders, elected officials and educational institutions all are faced with difficult budgetary decisions. Funding priorities related to workforce, especially those with taxpayer dollars, should be based on sound, quantifiable data and not individual, anecdotal stories, no matter how compelling these stories may be.
2016 Health Care Workforce TrendsBrief Review of Global and U.S. Population Demographics
Global Trends
The median age of the world’s population is increasing due in large part to a decline in birth rate and a 20-year increase in the average life span during the second half of the 20th century. These factors, combined with elevated births in the U.S. during the two decades after World War II (i.e., the “Baby Boom”), will result in increased numbers of persons over age 65 years during 2010--2030. The growing number of older adults increases demands on hospitals and health care systems and on medical and social services. Chronic diseases, more common with older adults, contribute to disability, and diminish quality of life and increased health and long-term care costs. Whereas life expectancy reflects, in part, the success of health and wellness interventions, hospitals and health care systems must now respond to the challenges created by this achievement, including the growing burden of chronic illnesses, injuries and disabilities and increasing concerns about future caregiving and health care costs.
U.S. Trends
In the United States, the proportion of the population over 65 years of age is projected to increase from 12.4 percent in 2000 to 19.6 percent in 2030. The number of persons over 65 years of age is expected to increase from approximately 35 million in 2000 to an estimated 71 million in 2030, and the number of persons over 80 years of age is expected to increase from 9.3 million in 2000 to 19.5 million in 2030. Unlike in many undeveloped countries in the world where the leading causes of death are infectious disease and acute illness, the U.S. has experienced an epidemiologic transition. In 2001, the leading causes of death in the U.S. and other developed countries were primarily cardiovascular diseases and cancer, followed by respiratory diseases and injuries. The epidemiologic transition, combined with the increasing number of older persons, represents a challenge for public health. In the United States, approximately 80 percent of all persons aged greater than 65 years have at least one chronic condition, and 50 percent have at least two.
Diabetes, which causes excess morbidity and increased health care costs, affects approximately one in five (18.7 percent) persons aged 65 years and over, and as the population ages, the impact of diabetes will intensify. The largest increases in diabetes are expected among adults aged over 75 years, from 1.2 million women and 0.8 million men in 2000 to 4.4 million women and 4.2 million men in 2050. As U.S. adults live longer, the prevalence of Alzheimer’s disease, which doubles every five years after age 65, also is expected to increase. Approximately 10 percent of adults aged 65 years and older and 47 percent of adults aged 85 years and older suffer from this degenerative and debilitating disease.
The increased number of persons aged 65 years and over has led to significantly increased health care costs. The health care cost per capita for persons aged over 65 years in the United States is three to five times greater than the cost for persons aged under 65 years, and the rapid growth in the number of older persons, coupled with continued advances in medical technology, is expected to create upward pressure on health and long-term care spending (5).
Wisconsin Health Care Workforce 2016 Report 73
15-Year Retrospective Review of Select Health Care Occupations
Wisconsin Health Care Report Data Sources
Data for the WHA 2016 Wisconsin Health Care Workforce Report are from two primary sources. First, the WHA Personnel Survey is a tool that collects data from all WHA member hospitals. The Personnel Survey is a supplement to the Annual Survey published and collected by the WHA Information Center each year. The Personnel Survey collects workforce information to better track, analyze, and understand workforce issues that affect Wisconsin hospitals. The Personnel Survey is sent to all Wisconsin hospitals and the data collected has been included in publications and data sets since 2000—with a nearly 100 percent completion rate each year and includes vacancy rate data for 19 different health care occupations.
This survey has been administered by WHA for more than 15 years and the survey design has remained relatively unchanged, which facilitates the development of reliable trends and forecasts. One recent, but notable change, was for the first time this year advanced practice nurses were divided into four categories: certified registered nurse anesthetists (CRNAs); certified nurse midwives (CNMs); clinical nurse specialists (CNSs); and, nurse practitioners (NPs). This was done to more accurately identify present day, practice-specific workforce shortages, but will not allow for trending and forecasting for these distinct occupations until several years of data are collected in this manner.
The second data source are the findings from the 2016 Survey of registered nurses (RNs) in Wisconsin. Wisconsin requires (mandatory) all licensed RNs to complete a comprehensive professional survey at the time of re-licensure. In 2016, 87,444 RNs completed the survey. After the WHA Information Center cleaned the data, the 2016 Wisconsin Health Care Workforce Report includes data from 76,830 respondents.
Registered Nurses (RNs)
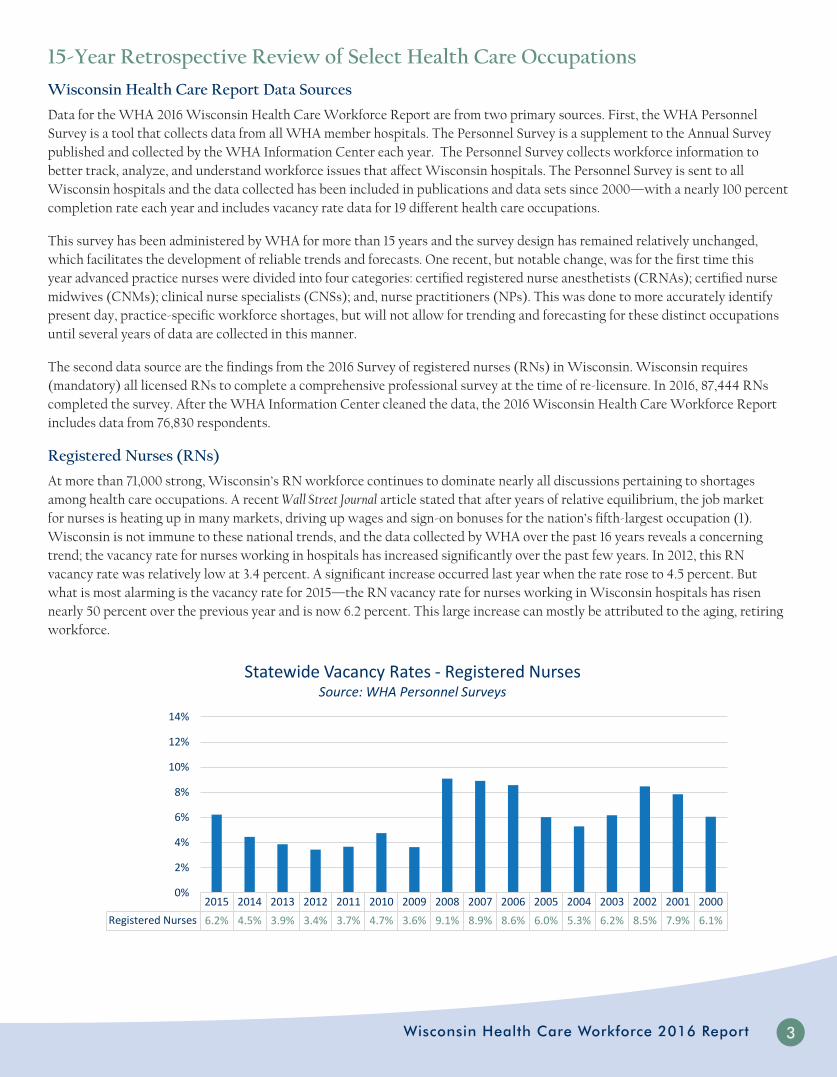
At more than 71,000 strong, Wisconsin’s RN workforce continues to dominate nearly all discussions pertaining to shortages among health care occupations. A recent Wall Street Journal article stated that after years of relative equilibrium, the job market for nurses is heating up in many markets, driving up wages and sign-on bonuses for the nation’s fifth-largest occupation (1). Wisconsin is not immune to these national trends, and the data collected by WHA over the past 16 years reveals a concerning trend; the vacancy rate for nurses working in hospitals has increased significantly over the past few years. In 2012, this RN vacancy rate was relatively low at 3.4 percent. A significant increase occurred last year when the rate rose to 4.5 percent. But what is most alarming is the vacancy rate for 2015—the RN vacancy rate for nurses working in Wisconsin hospitals has risen nearly 50 percent over the previous year and is now 6.2 percent. This large increase can mostly be attributed to the aging, retiring workforce.
2015 2014 2013 2012 2011 2010 2009 2008 2007 2006 2005 2004 2003 2002 2001 2000
Registered Nurses 6.2% 4.5% 3.9% 3.4% 3.7% 4.7% 3.6% 9.1% 8.9% 8.6% 6.0% 5.3% 6.2% 8.5% 7.9% 6.1%
0%
2%
4%
6%
8%
10%
12%
14%
Statewide Vacancy Rates - Registered NursesSource: WHA Personnel Surveys

4
For the first time, the WHA Wisconsin Health Care Workforce Report includes detailed information obtained during the 2016 registered nurse re-licensure survey. Some data that is concerning regarding the aging nursing workforce includes the number of nurses over 55 years of age. More than one third of Wisconsin nurses are over age 55. When specific work settings are examined, the aging workforce shows some variation, with those nurses choosing to work in hospitals being the youngest, and those working in public health and academia being the oldest. Whereas this might be viewed as good news for those responsible for attracting and retaining nurses working in hospitals, the average age for these nurses is 42 years old. Wisconsin hospitals would best be served by staying ahead of the “silver tsunami” (the term used for the large wave of retiring adults in the U.S.) by paying special attention to hiring and retention strategies focused on the millennial adult. A summary of the survey is below. Areas of special concern for Wisconsin hospitals are highlighted.
Gender Valid online respondents
% of total
Female 71,377 92.9%
Male 5,453 7.1%
Age Distribution (n=76,830)
Less than 25 1,164 1.5%
25-34 17,015 22.1%
35-44 16,586 21.6%
45-54 16,168 21.0%
55-64 18,852 24.5%
65 and older 7,045 9.2%
Ethnicity (n=76,830)
Non-Hispanic 75,525 98.3%
Hispanic 1,305 1.7%
Race (n=76,830)
White 72,905 94.9%
Black/African American 1,431 1.9%
Asian 1,191 1.6%
Other 1,303 1.7%
Highest Degree Held in Nursing (n=76,830)
Diploma in nursing 5,049 6.6%
Associate degree in nursing 27,389 35.6%
Bachelor degree in nursing 35,515 46.2%
Master degree in nursing 7,862 10.2%
Doctorate of nursing practice 421 0.5%
Doctor of nursing science/nursing doctorate 17 0.0%
PhD in Nursing 254 0.3%
Employment Status (n=76,830)
Actively working as a nurse 63,498 82.6%
Actively working in health care, not nursing 3,088 4.0%
Actively working in another field 1,333 1.7%

Wisconsin Health Care Workforce 2016 Report 95
Employment Status (n=76,830)
Unemployed, seeking work in nursing 1,076 1.4%
Unemployed, seeking work in another field 131 0.2%
Unemployed, not seeking work 2,089 2.7%
Retired 5,615 7.3%
Age 55 & over by work setting 55 and over 55 and over % Average Age
Academic education 778 45.8% 52
Ambulatory care 3,666 30.1% 46
Home health 1,221 33.6% 48
Hospital * 7,496 21.9% 42
Nursing home/extended care 2,061 33.8% 47
Public/community health 1,076 41.5% 50
Other 2,178 43.8% 51*Data from the 2016 RN re-licensure survey reveals that registered nurses working in hospitals are on average the youngest group in the state
Registered nurse workforce (n=76,830)
Working in health care 66,586 86.7%
Working in health care in Wisconsin 61,893 80.6%
Primary place of work in current Wisconsin labor market (n=63,145)
Academic education 1,622 2.6%
Ambulatory care 11,853 18.8%
Home health 3,506 5.6%
Hospital ** 33,119 52.4%
Nursing home/extended care 5,923 9.4%
Public/community health 2,517 4.0%
Other 4,605 7.3%**Data from the 2016 RN re-licensure survey reveals that Wisconsin hospitals remain the largest employer of registered nurses
Nursing positions at primary place of work in Wisconsin (n=63,145)
Staff Nurse 39,234 62.1%
Case manager 5,558 8.8%
Nurse manager 4,498 7.1%
Advanced practice nurse 4,308 6.8%
Administrator 917 1.5%
Nurse executive 728 1.2%
Nurse faculty 1,152 1.8%
Other 6,750 10.7%
Plans to leave direct patient care in Wisconsin (n=49,672)
Less than 2 years 3,101 6.2%
2-4 years 6,658 13.4%
5-9 years 10,346 20.8%
10 or more years 28,016 56.4%
106
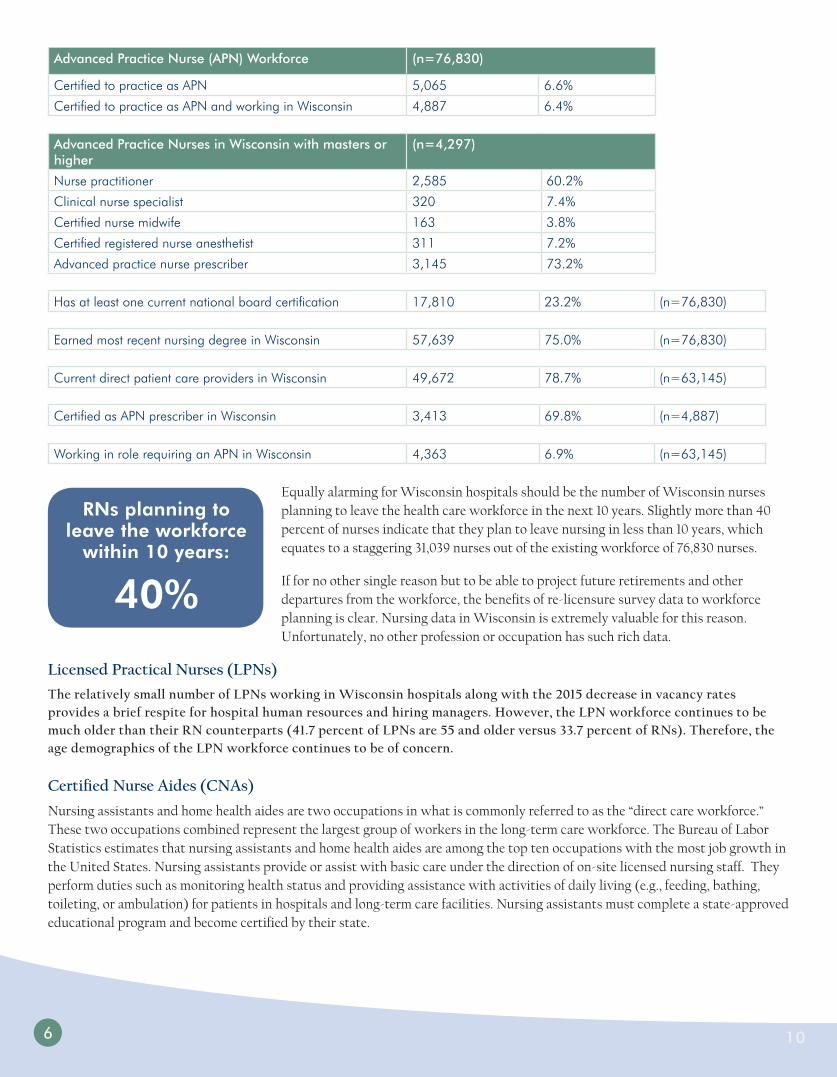
Advanced Practice Nurse (APN) Workforce (n=76,830)
Certified to practice as APN 5,065 6.6%
Certified to practice as APN and working in Wisconsin 4,887 6.4%
Advanced Practice Nurses in Wisconsin with masters or higher
(n=4,297)
Nurse practitioner 2,585 60.2%
Clinical nurse specialist 320 7.4%
Certified nurse midwife 163 3.8%
Certified registered nurse anesthetist 311 7.2%
Advanced practice nurse prescriber 3,145 73.2%
Has at least one current national board certification 17,810 23.2% (n=76,830)
Earned most recent nursing degree in Wisconsin 57,639 75.0% (n=76,830)
Current direct patient care providers in Wisconsin 49,672 78.7% (n=63,145)
Certified as APN prescriber in Wisconsin 3,413 69.8% (n=4,887)
Working in role requiring an APN in Wisconsin 4,363 6.9% (n=63,145)
Equally alarming for Wisconsin hospitals should be the number of Wisconsin nurses planning to leave the health care workforce in the next 10 years. Slightly more than 40 percent of nurses indicate that they plan to leave nursing in less than 10 years, which equates to a staggering 31,039 nurses out of the existing workforce of 76,830 nurses.
If for no other single reason but to be able to project future retirements and other departures from the workforce, the benefits of re-licensure survey data to workforce planning is clear. Nursing data in Wisconsin is extremely valuable for this reason. Unfortunately, no other profession or occupation has such rich data.
Licensed Practical Nurses (LPNs)
The relatively small number of LPNs working in Wisconsin hospitals along with the 2015 decrease in vacancy rates provides a brief respite for hospital human resources and hiring managers. However, the LPN workforce continues to be much older than their RN counterparts (41.7 percent of LPNs are 55 and older versus 33.7 percent of RNs). Therefore, the age demographics of the LPN workforce continues to be of concern.
Certified Nurse Aides (CNAs)
Nursing assistants and home health aides are two occupations in what is commonly referred to as the “direct care workforce.” These two occupations combined represent the largest group of workers in the long-term care workforce. The Bureau of Labor Statistics estimates that nursing assistants and home health aides are among the top ten occupations with the most job growth in the United States. Nursing assistants provide or assist with basic care under the direction of on-site licensed nursing staff. They perform duties such as monitoring health status and providing assistance with activities of daily living (e.g., feeding, bathing, toileting, or ambulation) for patients in hospitals and long-term care facilities. Nursing assistants must complete a state-approved educational program and become certified by their state.
RNs planning to leave the workforce
within 10 years:
40%

Wisconsin Health Care Workforce 2016 Report 117
The vacancy rate of CNAs in Wisconsin hospitals is 10 percent, which is approaching an all-time high. Not since 2006 have Wisconsin hospitals had CNA vacancy rates greater than 10 percent. If the vacancy rate continues to follow this trend, vacancy rates of 15-20 percent are possible, which would impact hospitals. These vacancy rates are already being seen in Wisconsin’s nursing homes and assisted living facilities. In these care settings, the average caregiver vacancy rates are 14.5 percent, with 1 in 4 providers experiencing rates of 20 percent and higher. There are an estimated 11,500 vacant caregiver positions in Wisconsin long-term and residential care facilities (6).
The vacancy rates and associated demand for CNAs are not unique to Wisconsin hospitals. There were approximately 1.22 million nursing assistants and 704,500 home health aides nationally in 2014. Nationally, demand for nursing assistants and home health aides are both projected to grow by 34 percent between 2014 and 2025 (7).
National Demand Nursing Assistants Home Health Aides
Estimated demand, 2014 1,219,500 704,500
Total demand growth, 2014-2025: 414,700 (34%) 240,000 (34%)
Changing demographics impact 411,100 238,400
Increased insurance coverage impact 3,600 1,600
Projected demand, 2025 1,634,200 944,500
Exhibit 1: Estimated Demand: Nursing Assistants & Home Health Aides in the United States, 2014–2025
2015 2014 2013 2012 2011 2010 2009 2008 2007 2006 2005 2004 2003 2002 2001 2000
Licensed Practical Nurses 5.5% 8.8% 4.1% 5.3% 3.3% 4.7% 8.0% 10.4% 9.3% 8.1% 7.9% 5.1% 4.8% 8.4% 8.6% 9.2%
0%
2%
4%
6%
8%
10%
12%
14%
Statewide Vacancy Rates - Licensed Practical NursesSource: WHA Personnel Surveys
2015 2014 2013 2012 2011 2010 2009 2008 2007 2006 2005 2004 2003 2002 2001 2000
CNAs 10.1% 7.9% 7.1% 5.3% 6.1% 7.3% 6.2% 9.8% 9.4% 10.5% 11.1% 5.7% 2.2% 4.9% 7.2% 13.9%
0%
2%
4%
6%
8%
10%
12%
14%
Statewide Vacancy Rates - CNAsSource: WHA Personnel Surveys

8
Demand projections account for the implementation of health system reform and the resulting increase in the number of Americans with health insurance. However, for CNAs and home health aides, the increased insurance expansion had minimal impact because these workers primarily serve older individuals who are already covered by Medicare. As such, almost all the demand growth projected for nursing assistants and home health aides is associated with changing demographics. The analysis considers projected growth in nursing home and residential care stays, hospital visits and other services provided by nursing assistants and projected growth in home health visits that involve an aide. With the elderly population expected to continue expanding in coming years, there is high projected growth in demand for nursing home, residential care, hospitals and other care delivery settings where nursing assistants are employed. If the use and delivery patterns for long-term care continue to emphasize home health services, there will also be high projected demand for home health aides. The bottom line for Wisconsin hospitals is that the increased demand for CNAs by health care employers outside of hospitals coupled with a shrinking supply will make it increasingly difficult to attract and retain CNAs. Caregivers are leaving because they can get better pay, better benefits, and/or better hours from non-health care employers such as large retailers and fast food chains (6). The number of CNAs over the age of 55 is low when compared to RNs and LPNs. This fact should not be viewed as encouraging, as it reflects the high turnover and churn in the occupation previously discussed in this report. Young individuals entering the CNA workforce do not stay long, and “career CNAs” are extremely rare.
Pharmacists
The vacancy rate for Wisconsin pharmacists working in hospitals remains relatively low for 2015 at 3.1 percent, with only a slight increase over 2014.
Following a six-year trend with vacancy rates hovering around 3 percent, the vacancy rates for pharmacists working in Wisconsin hospitals continues to be among the lowest of all health care occupations. While the high vacancy rates from 2005-2008 have abated, more than 20 percent of the pharmacist workforce is over the age of 55 and expected retirements for this important health care work group will most likely impact vacancy rates over the next decade.
Lor
2015 2014 2013 2012 2011 2010 2009 2008 2007 2006 2005 2004 2003 2002 2001 2000Registered Nurses 18.3% 18.2% 18.1% 17.1% 18.0% 17.5% 16.4% 13.9% 14.5% 13.8% 13.1% 12.4% 10.9% 10.1% 7.7% 7.3%
Licensed Practical Nurses 43.3% 39.3% 41.2% 41.8% 40.6% 38.4% 38.7% 36.1% 37.2% 47.1% 31.0% 26.7% 21.7% 23.2% 15.9% 14.3%
CNAs 10.8% 11.2% 11.4% 12.5% 12.8% 13.0% 10.4% 15.0% 11.6% 11.2% 9.9% 10.1% 4.8% 10.8% 8.5% 8.7%
0%5%
10%15%20%25%30%35%40%45%50%
Statewide Staff 55 & Over - Nursing Source: WHA Personnel Surveys

Wisconsin Health Care Workforce 2016 Report 139
Pharmacy Technicians/Aides
Pharmacy technicians/aides experienced a sharp increase in hospital-based vacancy rates in 2015, from 3.2 percent to 5.2 percent. This represents a nearly 65 percent increase in the overall rate and should be cautiously monitored over the next year. Pharmacy technicians assist the pharmacist in certain activities such as medication profile reviews for drug incompatibilities, typing of prescription labels, prescription packaging, handling of purchase records and inventory control, generally under the supervision of a registered pharmacist. Very little is known about this important element of the workforce. Since the role of pharmacy technician is largely unregulated in Wisconsin, workforce demographics provide little clue as to forecasting future changes in workforce composition. What is known is that this role is used by many Wisconsin hospitals and drugstores in the several tech-check-tech programs. In these pilot programs recently approved by the Department of Safety and Professional Services (DSPS) and the Wisconsin Pharmacy Examining Board (PEB), and currently being tested by several hospitals, pharmacy technicians are able to serve in advanced roles previously allowed only by pharmacists. So far, data has shown that this alternative health care delivery model is safe and effective. If a workforce shortage among pharmacy techs continues or even increases over the next few years, tech-check-tech programs could be seriously threatened.
2015 2014 2013 2012 2011 2010 2009 2008 2007 2006 2005 2004 2003 2002 2001 2000
Pharmacists 3.1% 2.7% 3.1% 3.0% 2.7% 2.9% 4.9% 9.8% 9.3% 8.8% 6.8% 5.1% 2.6% 6.2% 8.5% 4.8%
0%
2%
4%
6%
8%
10%
12%
Statewide Vacancy Rates - Pharmacists Source: WHA Personnel Surveys
2015 2014 2013 2012 2011 2010 2009 2008 2007 2006 2005 2004 2003 2002 2001 2000
Pharmacy Tech/Aides 5.2% 3.2% 4.8% 3.5% 3.3% 2.6% 3.3% 6.4% 6.7% 6.2% 3.8% 2.9% 2.3% 4.1% 5.0% 3.3%
0%
2%
4%
6%
8%
10%
12%
Statewide Vacancy Rates - Pharmacy Techs/AidesSource: WHA Personnel Surveys

1410
2015 2014 2013 2012 2011 2010 2009 2008 2007 2006 2005 2004 2003 2002 2001 2000Pharmacists 21.7% 21.5% 21.8% 20.7% 22.7% 22.1% 21.6% 18.9% 19.3% 19.3% 16.9% 15.8% 12.9% 14.1% 9.5% 9.2%Pharmacy Tech/Aides 15.2% 15.4% 15.6% 14.2% 14.7% 13.6% 13.1% 9.9% 10.4% 10.2% 8.4% 8.6% 4.3% 6.9% 4.9% 5.4%Dietitians/Nutritionists 19.3% 21.5% 18.9% 18.9% 19.4% 15.9% 17.2% 13.6% 13.5% 10.5% 11.0% 8.6% 8.4% 7.7% 5.0% 3.9%
0%
5%
10%
15%
20%
25%
Statewide Staff 55 & Over - Pharmacists & Dietitians Source: WHA Personnel Surveys
Dietitians
Although WHA has collected data on hospital-employed dietitian vacancy rates for more than 15 years, very little has been included in previous Health Care Workforce Reports. This profession is increasingly viewed as important not only in the overall care of the hospitalized client, but especially as an integral member of the care team for specific patient populations such as those with diabetes. As previously mentioned in this report, patients with diabetes are a segment of the patient population that is growing at an alarming rate. In this illness, as well as many others, diet plays a leading role in the treatment plan. When utilized correctly, patient-defined and patient-centered team-based care will directly rely upon the expertise of dieticians. A more than double increase (2.4 percent in 2014 to 5.9 percent in 2015) in the vacancy rates of dieticians working in hospitals could seriously impact this team-based care approach. Consistent with other occupations discussed in this report, little data exists to help answer the questions as to why this vacancy rate has increased so dramatically.
2015 2014 2013 2012 2011 2010 2009 2008 2007 2006 2005 2004 2003 2002 2001 2000
Dietitians/Nutritionists 5.9% 2.4% 2.1% 2.6% 1.9% 3.2% 2.5% 9.2% 8.6% 4.9% 4.6% 3.1% 1.7% 1.0% 1.7% 9.7%
0%
2%
4%
6%
8%
10%
12%
Statewide Vacancy Rates - Dietitians/Nutritionists Source: WHA Personnel Surveys

Wisconsin Health Care Workforce 2016 Report 11
Other Technicians
Similar to the analysis of dieticians, previous WHA Wisconsin Health Care Workforce Reports have omitted significant discussion of the important role of various direct patient care technicians such as surgical techs and lab techs. Not only are people who hold these roles aging, they are also experiencing higher vacancy rates. The relatively stable and relatively low vacancy rates seen following the recession in 2008 have increased significantly in 2015.
2015 2014 2013 2012 2011 2010 2009 2008 2007 2006 2005 2004 2003 2002 2001 2000
Lab Tech 5.5% 3.0% 2.2% 4.1% 3.2% 2.3% 3.5% 4.7% 4.1% 4.0% 4.1% 3.7% 2.3% 4.3% 3.9% 3.7%
Lab Technologists 4.5% 2.5% 2.0% 2.1% 2.4% 2.1% 5.0% 9.7% 8.7% 7.7% 2.5% 4.8% 1.8% 3.4% 2.9% 1.9%
Medical Records Tech 1.7% 1.3% 0.7% 1.9% 1.4% 2.2% 1.8% 2.2% 2.1% 4.6% 2.7% 2.3% 3.6% 3.4% 4.8% 4.3%
Radiology Tech 2.4% 2.6% 2.1% 1.8% 2.3% 1.7% 1.7% 7.0% 7.2% 4.2% 4.1% 4.5% 5.4% 9.2% 8.4% 6.0%
Surgical Tech 7.1% 3.5% 2.9% 2.8% 3.8% 2.0% 3.5% 9.1% 9.0% 7.0% 5.2% 6.1% 3.7% 8.2% 8.0% 6.0%
0%
2%
4%
6%
8%
10%
12%
Statewide Vacancy Rates - Other Techs Source: WHA Personnel Surveys
2015 2014 2013 2012 2011 2010 2009 2008 2007 2006 2005 2004 2003 2002 2001 2000Lab Tech 16.5% 18.0% 16.7% 19.7% 16.8% 16.1% 13.0% 11.2% 8.7% 9.2% 8.3% 11.4% 9.2% 7.6% 6.9% 8.2%Lab Technologists 31.8% 33.0% 34.5% 35.4% 36.2% 33.2% 30.5% 28.2% 25.0% 25.3% 21.4% 22.3% 19.5% 16.5% 10.9% 8.1%Medical Records Tech 18.8% 26.0% 25.8% 21.1% 18.2% 22.0% 22.8% 16.0% 16.4% 16.9% 15.6% 10.5% 13.0% 12.6% 8.6% 7.9%Radiology Tech 14.4% 13.8% 12.9% 12.4% 13.1% 12.7% 11.4% 9.4% 10.1% 10.1% 9.4% 8.5% 7.2% 7.1% 5.3% 4.2%Surgical Tech 16.3% 15.5% 14.4% 13.6% 14.8% 13.3% 11.3% 9.2% 9.0% 7.6% 7.7% 8.0% 6.4% 5.4% 4.3% 4.3%
0%5%
10%15%20%25%30%35%40%
Statewide Staff 55 & Over - Other Techs Source: WHA Personnel Surveys

12
Physical Therapists
As seen in the chart below, vacancy rates for physical therapists (PTs) employed by hospitals has remained relatively stable over the past four years. There is also little know about the actual PT workforce due to limited data.
Occupational Therapists
The near doubling of the occupational therapist vacancy rate reported on in last year’s Workforce Report has shown only slight improvement. The 4.4 percent vacancy rate is not overly concerning overall, but as what is now a theme in this report, the unknown data points for this profession could possibly either change or reinforce this concern.
2015 2014 2013 2012 2011 2010 2009 2008 2007 2006 2005 2004 2003 2002 2001 2000
Physical Therapists 3.7% 2.7% 3.2% 4.2% 5.9% 5.2% 6.9% 13.7% 12.3% 12.2% 9.9% 7.1% 4.0% 5.6% 4.8% 2.7%
0%
2%
4%
6%
8%
10%
12%
14%
Statewide Vacancy Rates - Physical Therapists Source: WHA Personnel Surveys
2015 2014 2013 2012 2011 2010 2009 2008 2007 2006 2005 2004 2003 2002 2001 2000
Occupational Therapists 4.4% 4.6% 2.5% 4.2% 5.3% 6.0% 6.7% 12.4%10.4%13.6%11.1% 4.4% 2.1% 2.1% 3.2% 1.6%
0%
2%
4%
6%
8%
10%
12%
14%
Statewide Vacancy Rates - Occupational Therapists Source: WHA Personnel Surveys

Wisconsin Health Care Workforce 2016 Report 13
Respiratory Therapists
Vacancy rates for respiratory therapists is on a steady climb, increasing from 2.2 percent in 2012 to 4.4 percent in 2015. This doubling of vacancy rates is the highest seen since the recession.
When viewed collectively, it is clear the therapist workforce is aging in place like all other health care professions. The number of therapists over the age of 55 is not as high as in some professions, such as nursing and lab techs, but the overall trend line for therapists reveals a steadily-aging group.
2015 2014 2013 2012 2011 2010 2009 2008 2007 2006 2005 2004 2003 2002 2001 2000
Respiratory Therapists 4.4% 3.6% 2.5% 2.2% 2.9% 3.7% 3.3% 8.5% 8.5% 8.3% 6.1% 7.2% 4.9% 7.1% 3.7% 3.6%
0%
2%
4%
6%
8%
10%
12%
14%
Statewide Vacancy Rates - Respiratory Therapists Source: WHA Personnel Surveys
2015 2014 2013 2012 2011 2010 2009 2008 2007 2006 2005 2004 2003 2002 2001 2000
Occupational Therapists 17.8% 20.4% 15.4% 16.0% 10.2% 9.5% 8.2% 5.9% 6.6% 6.0% 4.7% 4.9% 4.6% 3.9% 3.4% 3.3%Physical Therapists 14.2% 13.2% 11.5% 11.0% 10.5% 10.4% 10.0% 7.4% 7.6% 7.0% 5.7% 5.9% 4.3% 2.6% 3.4% 2.3%Respiratory Therapists 19.2% 18.8% 18.5% 16.8% 17.4% 15.9% 14.2% 12.8% 14.1% 13.4% 11.9% 10.6% 10.7% 6.9% 4.4% 4.9%
0%
5%
10%
15%
20%
25%
Statewide Staff Age 55 & Over - Therapies Source: WHA Personnel Surveys
14
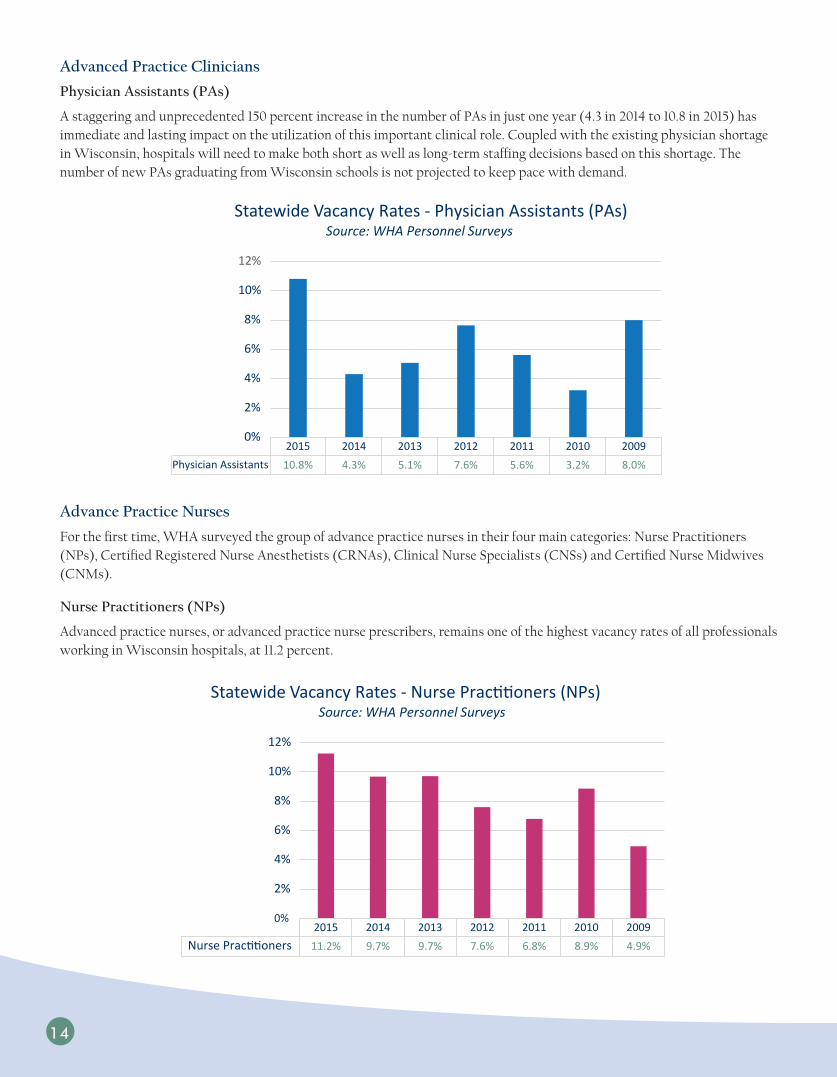
Advanced Practice Clinicians
Physician Assistants (PAs)
A staggering and unprecedented 150 percent increase in the number of PAs in just one year (4.3 in 2014 to 10.8 in 2015) has immediate and lasting impact on the utilization of this important clinical role. Coupled with the existing physician shortage in Wisconsin, hospitals will need to make both short as well as long-term staffing decisions based on this shortage. The number of new PAs graduating from Wisconsin schools is not projected to keep pace with demand.
Advance Practice Nurses
For the first time, WHA surveyed the group of advance practice nurses in their four main categories: Nurse Practitioners (NPs), Certified Registered Nurse Anesthetists (CRNAs), Clinical Nurse Specialists (CNSs) and Certified Nurse Midwives (CNMs).
Nurse Practitioners (NPs)
Advanced practice nurses, or advanced practice nurse prescribers, remains one of the highest vacancy rates of all professionals working in Wisconsin hospitals, at 11.2 percent.
2015 2014 2013 2012 2011 2010 2009
Physician Assistants 10.8% 4.3% 5.1% 7.6% 5.6% 3.2% 8.0%
0%
2%
4%
6%
8%
10%
12%
Statewide Vacancy Rates - Physician Assistants (PAs) Source: WHA Personnel Surveys
2015 2014 2013 2012 2011 2010 2009
Nurse Practitioners 11.2% 9.7% 9.7% 7.6% 6.8% 8.9% 4.9%
0%
2%
4%
6%
8%
10%
12%
Statewide Vacancy Rates - Nurse Practitioners (NPs) Source: WHA Personnel Surveys
Wisconsin Health Care Workforce 2016 Report 15
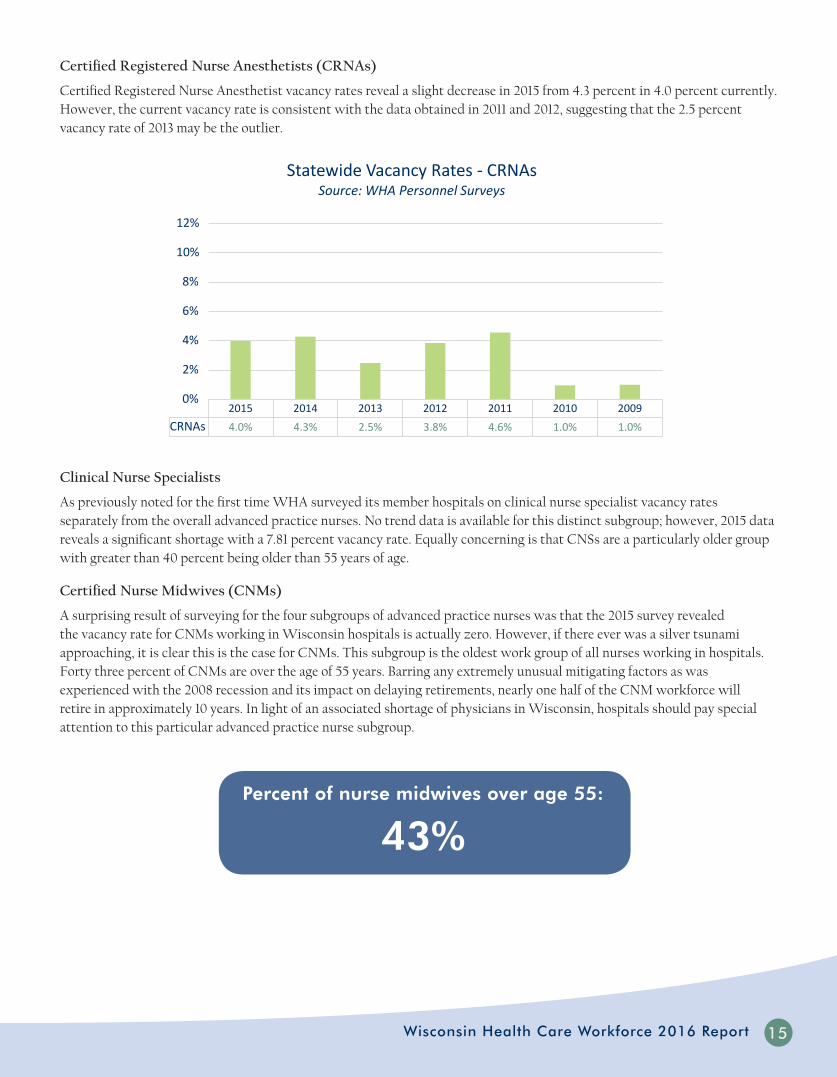
Certified Registered Nurse Anesthetists (CRNAs)
Certified Registered Nurse Anesthetist vacancy rates reveal a slight decrease in 2015 from 4.3 percent in 4.0 percent currently. However, the current vacancy rate is consistent with the data obtained in 2011 and 2012, suggesting that the 2.5 percent vacancy rate of 2013 may be the outlier.
Clinical Nurse Specialists
As previously noted for the first time WHA surveyed its member hospitals on clinical nurse specialist vacancy rates separately from the overall advanced practice nurses. No trend data is available for this distinct subgroup; however, 2015 data reveals a significant shortage with a 7.81 percent vacancy rate. Equally concerning is that CNSs are a particularly older group with greater than 40 percent being older than 55 years of age.
Certified Nurse Midwives (CNMs)
A surprising result of surveying for the four subgroups of advanced practice nurses was that the 2015 survey revealed the vacancy rate for CNMs working in Wisconsin hospitals is actually zero. However, if there ever was a silver tsunami approaching, it is clear this is the case for CNMs. This subgroup is the oldest work group of all nurses working in hospitals. Forty three percent of CNMs are over the age of 55 years. Barring any extremely unusual mitigating factors as was experienced with the 2008 recession and its impact on delaying retirements, nearly one half of the CNM workforce will retire in approximately 10 years. In light of an associated shortage of physicians in Wisconsin, hospitals should pay special attention to this particular advanced practice nurse subgroup.
2015 2014 2013 2012 2011 2010 2009
CRNAs 4.0% 4.3% 2.5% 3.8% 4.6% 1.0% 1.0%
0%
2%
4%
6%
8%
10%
12%
Statewide Vacancy Rates - CRNAs Source: WHA Personnel Surveys
Percent of nurse midwives over age 55:
43%
16
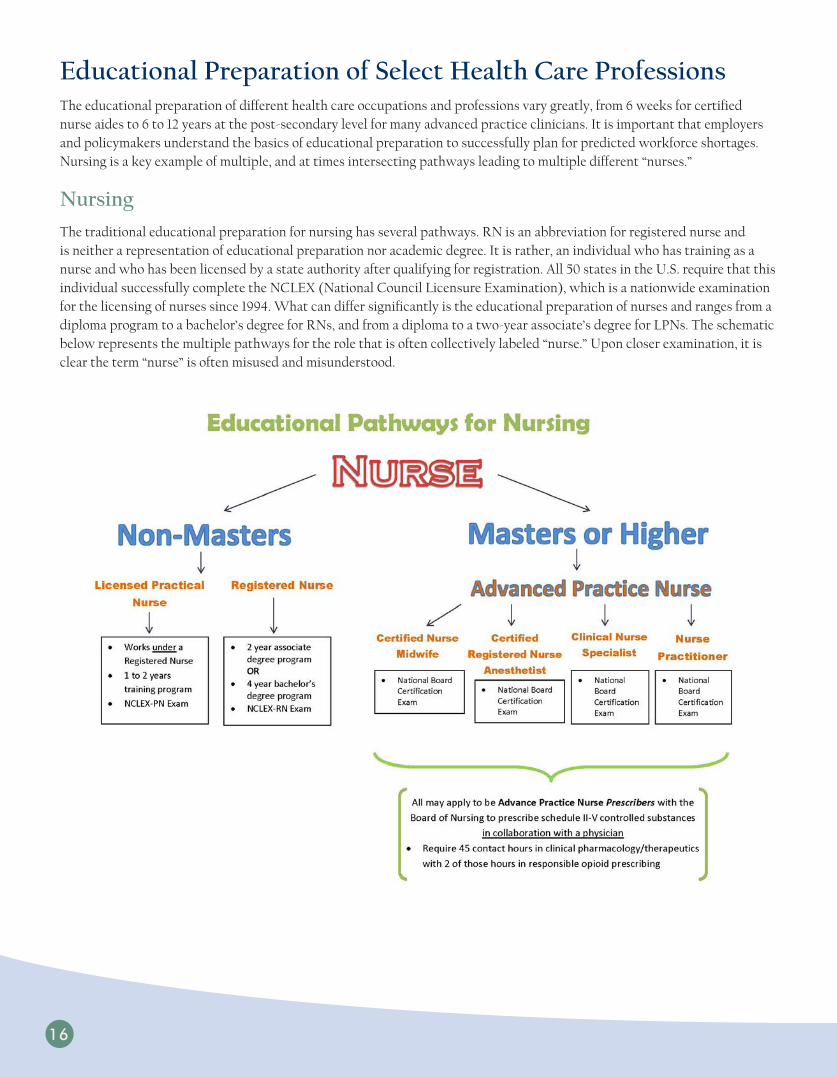
Educational Preparation of Select Health Care ProfessionsThe educational preparation of different health care occupations and professions vary greatly, from 6 weeks for certified nurse aides to 6 to 12 years at the post-secondary level for many advanced practice clinicians. It is important that employers and policymakers understand the basics of educational preparation to successfully plan for predicted workforce shortages. Nursing is a key example of multiple, and at times intersecting pathways leading to multiple different “nurses.”
Nursing
The traditional educational preparation for nursing has several pathways. RN is an abbreviation for registered nurse and is neither a representation of educational preparation nor academic degree. It is rather, an individual who has training as a nurse and who has been licensed by a state authority after qualifying for registration. All 50 states in the U.S. require that this individual successfully complete the NCLEX (National Council Licensure Examination), which is a nationwide examination for the licensing of nurses since 1994. What can differ significantly is the educational preparation of nurses and ranges from a diploma program to a bachelor’s degree for RNs, and from a diploma to a two-year associate’s degree for LPNs. The schematic below represents the multiple pathways for the role that is often collectively labeled “nurse.” Upon closer examination, it is clear the term “nurse” is often misused and misunderstood.

Wisconsin Health Care Workforce 2016 Report 17
Shared Faculty Models of Nursing Education
Wisconsin is amid an unprecedented shortage of registered nurses due to the increasing demand for health care as baby boomers approach retirement, the aging nursing workforce and the decline of interest in nursing as a career because of expanding opportunities for women in previously male-dominant professions. The shortage of faculty in schools of nursing with associate, baccalaureate and graduate programs is a continuing and expanding problem. Over the past several years, the deficit of faculty has reached critical proportions as the current faculty workforce rapidly advances toward retirement and the pool of younger replacement faculty decreases. Unfortunately, the shortage of faculty is contributing to the current nursing shortage by limiting the number of students admitted to nursing programs. In 2004, an American Association of Colleges of Nursing survey determined that 32,797 qualified applications to baccalaureate, master’s, and doctoral programs were not accepted, and an insufficient number of faculty was cited by 47.8 percent of responding schools as the major reason for not accepting all qualified applicants (8).
Partnerships between clinical facilities and academic programs offer the benefit of engaging both partners in discussion about how nursing is practiced in the real world and how it should be taught. During these times of possibly dramatic transitions in what constitutes nursing, formal collaboration between service and education will better identify emerging clinical issues, analyze actual roles and expectations of practicing nurses and develop the required nursing curriculum.
In addition to looking internally, nursing may benefit from examining curricular designs, models, and teaching strategies from other health disciplines that offer effective learning and require fewer clinical faculty, such as expanded use of non-faculty clinical preceptors, concentrated clinical experience (e.g., 40 hours/week) late in the program, and increased use of simulations in the clinical laboratory in lieu of patient care assignments. Nursing must be open to a variety of clinical teaching models that may have a faculty-sparing effect.
Certified Nurse Aides
In Wisconsin, all approved nurse aide training programs must provide students with comprehensive instruction on the requirements to work in all types of licensed health care facilities (e.g., nursing homes, home health agencies, hospices, hospitals, intermediate care facilities for individuals with intellectual disabilities). The Wisconsin Department of Health Services (DHS), Division of Quality Assurance (DQA) approves nurse aide training programs that satisfy the standards outlined in Chapter 146 Wisconsin Statutes and Chapter 129 of the Wisconsin Administrative Code. The training program must be a minimum of 120 hours in length and must include a minimum of 32 hours of supervised clinical experience in an approved clinical setting. Sixteen classroom hours must be completed before a student can begin his or her clinical training.
The 120 hours of training requirement is not consistent nationwide and ranges from 75 hours to 150 hours. Generally, to be employed as a nurse aide in Wisconsin (commonly referred to as certified nursing assistant, or CNA) an individual must complete 120 hours of training. In many other states, only 75 hours of training are required, which is the amount of training required under federal law. All states also require an individual to pass a competency evaluation program (examination) in order to be employed as a CNA.
DHS approves training programs and examinations for CNAs. If an individual has successfully completed training and passed the examination, DHS places their name on the CNA registry, which indicates they have DHS approval to work as a CNA. 2013 Wisconsin Act 357 requires DHS to approve “bridge” training programs that are designed for individuals who received CNA training of less than 120 hours in another state. DHS is currently establishing standards for these programs by administrative rule.
Per Act 357, DHS must ensure that a bridge training program, combined with the training an individual received in the other state, will result in the individual having received substantially the same instruction provided in a 120-hour training program. An individual who completes a bridge training program must pass the same examination as an individual who completes the normal 120-hour course before their name may be added to the registry. The Act provides that an individual who successfully completes a bridge training program and passes an examination may have their name placed on the CNA registry.

18
Pharmacy Techs/Aides
Although pharmacy technicians may work in department stores, grocery stores and general merchandise stores, the majority work at pharmacies, drug stores and hospitals. Unlike pharmacists, pharmacy technicians are not the sole dispensers of medication and mostly assist in measuring, mixing, counting and labeling dosages of medications. The demand is great for pharmaceutical-support professionals capable of filling prescription medications. The Bureau of Labor Statistics predicts employment growth of about 9 percent between 2014 and 2024—faster than the average growth rate for all occupations—and during that period 34,700 new positions will need to be filled. Attending a postsecondary education program with an emphasis in pharmacy technology is helpful but not required in Wisconsin. Vocational schools and community colleges offer these programs, which usually last one year or less. Hospitals and some drugstore chains also offer company-based, on-the-job training.
WHA’s 3 P Model of Care DeliveryWHA has developed a conceptual model outlining three major elements that impact, influence and ultimately determine what specific patient care is delivered by advanced practice clinicians (APCs) in many hospital settings. These three elements are the 3 “Ps”: practice, policy and payment, and are meant to be understood from a top down, progressively narrowing of conditions that result in the limited amount of patient care delivery associated with various health care professions. In the example provided in this report, a nurse practitioner providing care to a patient is used, but this model is applicable to all health care occupations and professions that have recognized and agreed-upon scopes of practice and are allowed to bill for their services regardless of payer source.
Practice
The first “P” is practice and pertains to scope of practice. Scope of practice describes the procedures, actions and processes that a health care practitioner is permitted to undertake in keeping with the terms of their professional license. The scope of practice is limited to that which the law allows for specific education and experience, and specific demonstrated competency. This “education, experience and training” model is generally accepted as defining scope of practice for providers in Wisconsin, and language mirroring this definition is evident in several key Wisconsin rules and regulations such as Chapter N8, the Wisconsin rule that defines and regulates the practice of advanced practice nurse prescribers (APNPs).
Policy
The second “P” is policy and pertains to all policy that further defines, clarifies, or restricts the first P, practice. These policies may be statute, rules or regulations imposed by lawmakers or policymakers or may include policies instituted and maintained by employers (hospitals).
Payment
The third “P” is payment, and in the 3 P model is the final determination of what actual patient care is usually delivered by APCs in Wisconsin hospitals. For example, if a particular service or treatment is allowed by the APC’s scope of practice and allowed by related statutes, rules, regulations and hospital policies, but is not a service in which payment will be received, this particular treatment or service will usually not be delivered by the APC.

Wisconsin Health Care Workforce 2016 Report 19
Optimal Utilization of Team-Based CareIt is evident that current workforce supply is strained and is a major impetus to re-evaluating current workforce and health care delivery models. A cornerstone of all teams is collaboration, and WHA supports team-based care models that keep this important tenet integral to its design. Team-based care that is patient-centered, condition-defined and community-appropriate should be promoted. Wisconsin has already begun to move from a physician-centric model to one that values and utilizes other health professionals. As previously stated, workforce supply issues are one motivator of this shift in delivery model, but the push from payers for greater value along with patients becoming more consumer oriented are additional factors driving this change (9). Commitments to delivering health care in a team-based model requires both team member commitment, as well as recognition of its value by hospital and health care leaders. This model is to “a large extent dependent on health care system leadership and the willingness of team members to collaborate and share in decision making.” (9)
Evidence-Based Care Requires EvidenceImportance of Data
Health reform initiatives are transforming health service delivery and the workforce needed to provide care. New models of care, value-based payment, and team-based approaches to care are changing the numbers and types of health care workers needed. The demand for accurate, timely, and comprehensive workforce data has never been greater as state and federal policymakers seek to understand the size, skill mix, and competencies of today’s health workforce. Health delivery system reform initiatives are under way in many Wisconsin hospitals, supporting transitions to value-based payment and encouraging the development of innovative team-based delivery models. These changes could have a substantial effect on demand for health workers. Often referred to as “supply side” data, information and demographics regarding health care providers can allow stakeholders to identify current or potential gaps in access and move to ensure that safe care is available to Wisconsin residents. The demand for accurate, timely, and comprehensive workforce data has never been greater as
• Differs among payers, settings and delivery model
• State statute and regulations• Work setting policies
• Scope of Practice, determined by education, training and experience
WHA 3 P Model of Care Delivery
Payment
Policy
Practice
• Nurse practitioner (NP) has been educated and trained to conduct initial patient history and physical
• Hospital policy outlines care offered by NPs• Wisconsin requirement that NPs work in collaboration with physician
Example of WHA 3 P Model of Care Delivery
Payment
Policy
Practice
• Differs among payors and can determine care that is delivered by NP

20
state and federal policymakers seek to understand the size, skill mix, and competencies of today’s health workforce relative to anticipated future workforce needs. Budget constraints create challenges for stakeholders looking for ways to build on existing data sources and foster new collaborations to create the data systems needed to inform health workforce policy. As already demonstrated with nursing re-licensure data in Wisconsin, additional data collected through the licensure process of other professions are a potentially rich source of information.
WHA Summary and RecommendationsSummary
Data presented in this report suggest the tsunami wave of retirements has begun to reach the shores of Wisconsin hospitals. Although cumulative data shows a relatively flat health care job market over the past few years, 2015 data suggests that data lagged regional pockets of shortages with reports of significant difficulty in hiring health care workers, especially nurses in specialty areas such as intensive care, obstetrics and surgery. Other critical health care worker positions are also experiencing near all-time high vacancy rates such as CNAs and PAs. It is clear Wisconsin hospital and health care system leaders stand at an important crossroads in 2016. Data from the 2016 WHA Personnel Survey enables hospital leaders to make choices in workforce hiring decisions, training programs and the design and delivery of team-based care systems. This report also helps educators and policymakers identify relevant and timely initiatives that provide high-quality care in the most efficient manner.
Recommendations
Educators
• Professional associations, accrediting bodies, and ultimately educational institutions play a key role in defining and establishing professional practice; the first “P” in the WHA Practice-Policy-Payment model. Furthermore, education, training and experience are often cited as the three pillars defining scope of practice. Educational institutions should adapt and promote curriculum that is reflective of changing patient needs and health care environments.
• Whereas emerging roles such as patient navigator have been identified as important members of the health care team, both the educational preparation as well as the specific job responsibilities of these roles remain unclear and are poorly defined. Educational facilities should partner with employers in determining the need for, along with the essential preparation for these emerging health care roles. When appropriate, educational preparation for these non-clinical, non-direct care positions should be focused and as short as possible; perhaps minimally at the certificate or diploma level of preparation and at most the associate degree level. Requiring that other health care team members whose educational preparation is at the bachelors, masters or doctoral level incorporate these care coordination roles into their already demanding jobs is both unrealistic and an inefficient use of resources.
• Wisconsin is in the midst of an unprecedented shortage of registered nurses. This shortage is expected to persist for several reasons but primarily due to increasing demand for health care as baby boomers approach retirement and the nursing workforce ages. Intensifying the overall nursing shortage is the increasing deficit of full-time master’s and doctorally-prepared nursing faculty. Partnerships between clinical facilities and academic programs, or shared faculty models, should once again be viewed as one potential solution to the faculty shortage. Increasing formal partnerships between schools of nursing and clinical facilities while simultaneously identifying and capitalizing on specific benefits that are attractive and useful to both partners is but one specific strategy in establishing this partnership. Several other strategies have been outlined in this report.

Wisconsin Health Care Workforce 2016 Report 21
• Remain focused on health care occupations with longstanding shortages such as CNAs and advance practice providers. As reliable forecast models for professions other than nursing become available in Wisconsin, scarce state resources for public educational institutions can be directed toward these educational programs.
• Explore the merits of outcomes-based funding for educational programs. Although performance and outcomes-based funding for both private and public educational institutions has traditionally been met with skepticism, the application of these metrics are more easily applied to professional studies such as nursing, therapies, dentistry, pharmacology and other health care roles.
Employers
• Keeping the focus of delivering high-quality, high-value, safe and accessible care should be the impetus for the consideration of more fully developing integrated health care teams. Patient-centered and patient-defined, team-based care should be innovative and responsive to the needs of the patients and the populations served by individual hospitals and systems.
• Hospitals will need to examine their own policies with an eye on identifying institutionally supported barriers on practice. These policies represent the important second “P” in the Practice-Policy-Payment model that often times determines the level of care individual health care practitioners can provide. Several examples of these barriers have been provided in this report, and a diligent examination by hospital leaders will most likely reveal additional areas.
• Nursing vacancy rates should remain a focus for employers as WHA trend data suggests a significant shortage in the next 5 to 10 years. Additionally, entry-level, direct patient care positions such as CNAs and home health aides show even greater vacancy rates coupled with high turnover rates. Creative recruitment and retention strategies that do not include sign-on bonuses must be considered. One such strategy is partnering with educational institutions in shared faculty models. This “grow your own” approach has been shown to be an effective method to recruit and retain the best and brightest of the students taking part.
Policymakers
• Policymakers should understand how regulatory issues such as billing and reimbursement impact multiple members of a team-based care system in delivering high-quality care and thus is the final “P” in the WHA Practice-Policy-Payment model. An adequately staffed, trained and coordinated workforce should remain a focus for Wisconsin policymakers. Policymakers should work with hospitals and health care systems in identifying specific regulatory barriers that prevent care from being delivered even though the first two “P”s, practice and policy, clearly allow for such care.
• Regulatory reform and changes should be evidence based. An essential element of this evidence is quantitative data. Apart from registered and licensed professional nurses, there is a significant dearth of evidence on even the basic demographics of Wisconsin’s health care workforce. In addition to basic demographic data, practice setting, intent to retire, and educational preparation are but a few of the data that must be collected in order to make sound workforce projections that are meaningful to Wisconsin residents. Licensure renewal is a golden opportunity to collect workforce data on a regular, consistent and standardized manner.
• Support the ongoing efforts to increase the number of health care providers who both train and practice in the state of Wisconsin. Build on the success of graduate medical education, Wisconsin based residency programs that have shown to be effective in retaining physicians. Utilize similar approaches in funding Wisconsin based graduate training programs for other advanced practice roles such as nurse practitioners and physician assistants.

References and Additional Resources1. Wall Street Journal, Nurses Are Again in Demand. Nov 7, 2016. Accessed at
http://www.wsj.com/articles/nurses-are-again-in-demand-1478514622.
2. Wisconsin Center for Nursing, Wisconsin Registered Nursing Supply and Demand Forecasting Update: 2014-2040. Accessed at http://www.wisconsincenterfornursing.org/documents/2014%20WI%20RN%20Forecast%20Model%20Update_FINAL%20Oct%2031%202016.pdf.
3. Wisconsin Healthcare Human Resources Association, WisHHRA 2016 Employment and HR Staffing Survey. May 2016.
4. Buerhaus, PI. As cited in The Wall Street Journal, Nurses Are Again in Demand. Nov 7, 2016. Accessed at http://www.wsj.com/articles/nurses-are-again-in-demand-1478514622.
5. Morbidity and Mortality Weekly Report, Centers for Disease Control and Prevention, Public Health and Aging: Trends in Aging — United States and Worldwide. Accessed at http://www.cdc.gov/mmwr/preview/mmwrhtml/mm5206a2.htm.
6. Wisconsin Health Care Association/Wisconsin Center for Assisted Living, Leading Age Wisconsin, The Long-Term Care Workforce Crisis: A 2016 Report. Accessed at http://files.constantcontact.com/eebfe59f101/13778233-9d91-46b2-b406-e4694a787c76.pdf.
7. Health Resources and Services Administration (HRSA), Health Workforce Projections: Nursing Assistants and Home Health Aides. Aug 2016.
8. Berlin, L. Wilsey. S., & Bednash, G. (2005). Salaries of instructional and administrative nursing faculty in Baccalaureate and Graduate programs in nursing. As cited in American Association of Colleges of Nursing, Faculty Shortages in Baccalaureate and Graduate Nursing Programs, Mar 2015.
9. Wisconsin Council on Medical Education and Workforce, A Work in Progress: Building Wisconsin’s Future Physician Workforce. Accessed at http://www.wcmew.org/wp-content/uploads/2016/08/2016physicianReportWCMEW.pdf, 2016.
22

Wisconsin Health Care Workforce 2016 Report

The Wisconsin Hospital Association, PO Box 259038, Madison, WI 53725-9038; 608-274-1820; www.wha.org
12-2016-TPS-650


