36
ALABAMA HOUSING FINANCE AUTHORITY 2003 Financial Statements and Information Wish you were here
ALABAMA HOUSINGFINANCE AUTHORITY
2003 Financial Statements and Information
Wish you were here

ALABAMA HOUSING FINANCE AUTHORITY
COMPARATIVE FINANCIAL STATEMENTS
SEPTEMBER 30, 2003 AND 2002

ALABAMA HOUSING FINANCE AUTHORITY SEPTEMBER 30, 2003 AND 2002 TABLE OF CONTENTS
PAGE Management�s Discussion and Analysis ..................................................................................................1 Independent Auditors� Report ..................................................................................................................6 Audited Financial Statements Statements of Net Assets ..........................................................................................................................8 Statements of Revenues, Expenses and Changes in Net Assets ...............................................................9 Statements of Cash Flows.......................................................................................................................10 Notes to Financial Statements.................................................................................................................12 OTHER FINANCIAL INFORMATION Additional Segment Data........................................................................................................................24

1
ALABAMA HOUSING FINANCE AUTHORITY MANAGEMENT�S DISCUSSION AND ANALYSIS Introduction This section of the Alabama Housing Finance Authority�s (�Authority�) annual financial report presents management�s discussion and analysis of the financial position and results of operations at and for the fiscal year ended September 30, 2003. This information is being presented to provide additional information regarding the activities of the Authority and to meet the disclosure requirements of Government Accounting Standards Board Statement No. 34, Basic Financial Statements - and Management�s Discussion and Analysis - for State and Local Government. This analysis should be read in conjunction with the Report of Independent Auditors, the audited financial statements and accompanying notes. Operations of the Authority include issuance of bonds to fund loans to qualified borrowers for single family houses and multifamily developments. The Authority is entirely self-funded and does not draw upon the general taxing authority of the State of Alabama. The financial transactions of the Authority are recorded in the funds, which consist of a separate set of self-balancing accounts that comprise its assets, liabilities, net assets, revenues and expenses as appropriate.
Required Basic Financial Statements The basic financial statements of the Authority report information about the Authority using accounting methods similar to those used by private sector companies. These statements offer information about the Authority�s activities. The Statement of Net Assets includes all of the Authority�s assets and liabilities and provides information about the nature and amounts of investments in resources (assets) and the obligations to Authority creditors (liabilities). The assets and liabilities are presented in order of liquidity. All of the current year�s revenues and expenses are accounted for in the Statement of Revenues, Expenses and Changes in Net Assets. This statement measures the activities of the Authority�s operations over the past year and can be used to determine whether the Authority has successfully recovered all of its costs through its services provided. The final required financial statement is the Statement of Cash Flows. The primary purpose of this statement is to provide information about the Authority�s cash receipts and cash payments during the reporting period. The statement reports cash receipts, cash payments and net changes in cash resulting from operating, investing, non-capital financing and financing activities and provides information regarding the sources and uses of cash and the change in the cash balance during the reporting period.

2
ALABAMA HOUSING FINANCE AUTHORITY MANAGEMENT�S DISCUSSION AND ANALYSIS (Continued) Condensed Financial Information Condensed Statements of Net Assets The following table presents condensed information about the net assets of the Authority as of September 30, 2003 and 2002, and changes in the balances of selected items during the fiscal year ended September 30, 2003 (in thousands): CONDENSED STATEMENTS OF NET ASSETS 2003 2002 Change ASSETS CURRENT ASSETS Cash and restricted cash $ 2,142 $ 245 $ 1,897 Accrued interest receivable and restricted accrued interest 8,446 9,044 (598) Mortgages and restricted mortgages 13,271 18,127 (4,856) Investments and restricted investments 230,136 229,880 256 Other assets and restricted other assets 1,811 927 884
Total current assets 255,806 258,223 (2,417)
NONCURRENT ASSETS Mortgages, restricted mortgages and restricted mortgage-backed securities 950,875 1,126,656 (175,781) Restricted HOME program mortgages 120,034 109,503 10,531 Investments and restricted investments 93,238 36,943 56,295 Restricted deferred debt financing costs 7,785 9,775 (1,990)
Total noncurrent assets 1,171,932 1,282,877 (110,945)
TOTAL ASSETS $ 1,427,738 $ 1,541,100 $ (113,362) LIABILITIES AND NET ASSETS CURRENT LIABILITIES Bonds and notes payable $ 168,923 $ 98,846 $ 70,077 Accrued interest payable 21,917 25,303 (3,386) Other liabilities 1,484 2,133 (649)
Total current liabilities 192,324 126,282 66,042
NONCURRENT LIABILITIES Bonds and notes payable 877,565 1,075,306 (197,741) Refundable HOME program grants 120,903 109,503 11,400 Other liabilities 34,207 39,298 (5,091)
Total noncurrent liabilities 1,032,675 1,224,107 (191,432)
TOTAL LIABILITIES 1,224,999 1,350,389 (125,390)
NET ASSETS Invested in capital assets, net of related debt 376 114 262 Restricted 162,809 173,280 (10,471) Unrestricted 39,554 17,317 22,237
Total net assets 202,739 190,711 12,028
TOTAL LIABILITIES AND NET ASSETS $ 1,427,738 $ 1,541,100 $ (113,362)

3
ALABAMA HOUSING FINANCE AUTHORITY MANAGEMENT�S DISCUSSION AND ANALYSIS (Continued) Condensed Statements of Net Assets (Continued) Current assets decreased $2,417,000, from September 30, 2002 to September 30, 2003, primarily due to a decrease in mortgage loans held for sale in the Authority�s general fund. Restricted and unrestricted mortgage loans and restricted mortgage-backed securities decreased by $175,781,000, due to rapid mortgage loan repayments and prepayments during 2003. While the Authority purchased new loans of approximately $132,600,000, this was exceeded by loan repayments and prepayments of approximately $308,300,000, in 2003. Restricted HOME program loans increased $10,531,000, due to an increase in lending under this program. Restricted and unrestricted investments increased $56,295,000, primarily due to repayments received in the past six months of mortgage-backed securities prepayments and repayments that will be available for bond redemptions scheduled for October 1, 2003. See Note 11, �Early Retirement of Bonds� for additional information. Bonds and notes payable, current and noncurrent, decreased $127,665,000, due to the early redemption of bonds and scheduled debt service payments exceeding the amount of new bonds and notes issued. Refundable HOME program grants increased $11,400,000, due to increased lending activity in that program. The following chart summarizes the Authority�s debt activity from September 30, 2002 to September 30, 2003 (in thousands): Debt Debt Balance Debt Debt Balance 9/30/2002 Issued Paid 9/30/2003 Bonds payable $ 1,161,302 $ 75,268 $ 193,982 $ 1,042,588 Notes payable 12,850 15,550 24,500 3,900 Refundable HOME grants 109,503 11,410 10 120,903 $ 1,283,655 $ 102,228 $ 218,492 $ 1,167,391 Other liabilities, current and noncurrent, decreased $5,740,000, because of a decrease in accrued arbitrage rebate payable related to the net decrease in fair value of mortgage-backed securities. See Note 3, �Mortgage-Backed Securities,� for further information. The Authority�s general fund also had a decrease in other liabilities due to increased recognition of deferred commitment fees related to the rapid repayments and prepayments of the related mortgage-backed securities.

4
ALABAMA HOUSING FINANCE AUTHORITY MANAGEMENT�S DISCUSSION AND ANALYSIS (Continued) Revenues, Expenses, and Changes in Net Assets The following table presents condensed statements of revenues, expenses and changes in net assets for the Authority as of September 30, 2003 and 2002, and the change from the prior year (in thousands): CONDENSED STATEMENTS OF REVENUES, EXPENSES AND CHANGES IN NET ASSETS 2003 2002 Change OPERATING REVENUES Interest on mortgage loans and mortgage-backed securities $ 57,044 $ 64,118 $ (7,074) Investment income 6,433 17,822 (11,389) Loan fees and other income 7,925 2,138 5,787 Total operating revenues 71,402 84,078 (12,676) OPERATING EXPENSES Interest on bonds and notes 53,571 57,580 (4,009) Amortization of deferred debt financing costs 2,226 1,397 829 Program, general and administrative 3,046 4,934 (1,888) Total operating expenses 58,843 63,911 (5,068) OPERATING INCOME 12,559 20,167 (7,608) CAPITAL CONTRIBUTIONS AND EXTRAORDINARY LOSS Owner contributions (reductions) (19) 396 (415) Extraordinary loss on early retirement of bonds (512) - (512) Total capital contributions and extraordinary loss (531) 396 (927) CHANGE IN NET ASSETS 12,028 20,563 (8,535) NET ASSETS AT BEGINNING OF YEAR 190,711 170,148 20,563 NET ASSETS AT END OF YEAR $ 202,739 $ 190,711 $ 12,028 Interest on mortgage loans and mortgage-backed securities decreased $7,074,000, due to the decrease in mortgage loan and mortgage-backed securities balances during 2003, reflecting the increase in repayments and prepayments discussed in the balance sheet section. Mortgage loans and mortgage-backed securities earning higher rates from older bond issues are prepaying faster than normal and new mortgage-backed securities originated during the fiscal year have lower interest rates, plus loan originations declined in 2003.
5
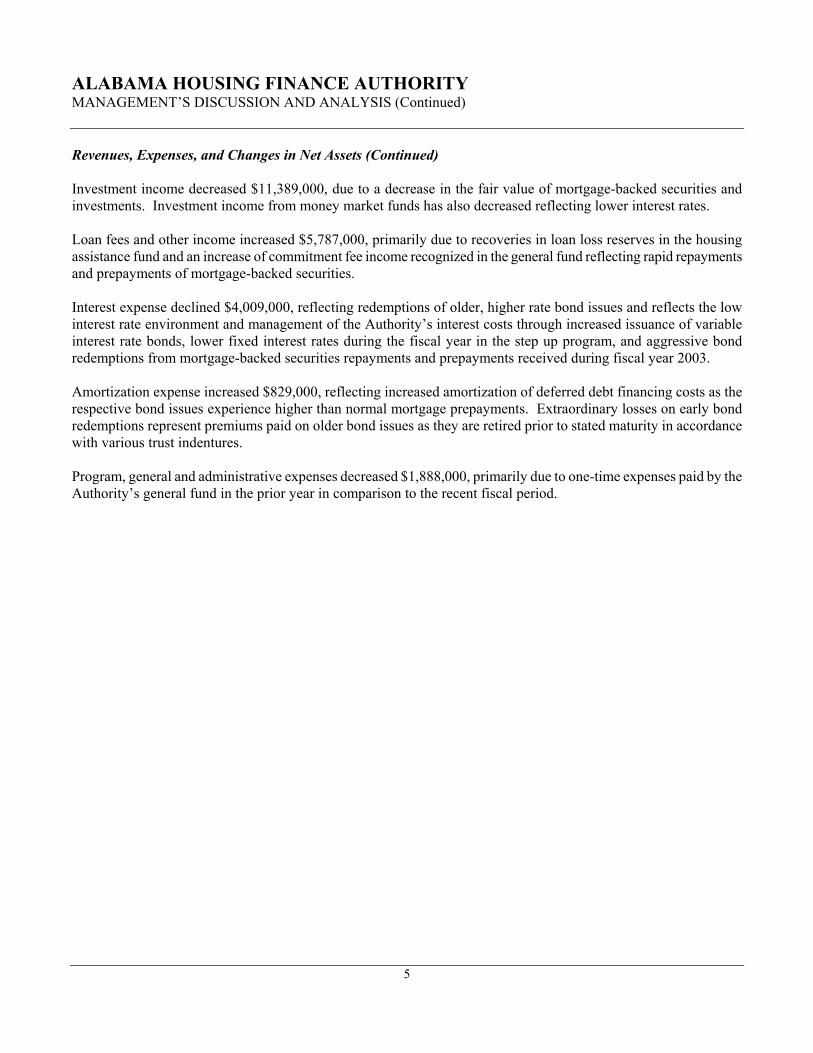
ALABAMA HOUSING FINANCE AUTHORITY MANAGEMENT�S DISCUSSION AND ANALYSIS (Continued) Revenues, Expenses, and Changes in Net Assets (Continued) Investment income decreased $11,389,000, due to a decrease in the fair value of mortgage-backed securities and investments. Investment income from money market funds has also decreased reflecting lower interest rates. Loan fees and other income increased $5,787,000, primarily due to recoveries in loan loss reserves in the housing assistance fund and an increase of commitment fee income recognized in the general fund reflecting rapid repayments and prepayments of mortgage-backed securities. Interest expense declined $4,009,000, reflecting redemptions of older, higher rate bond issues and reflects the low interest rate environment and management of the Authority�s interest costs through increased issuance of variable interest rate bonds, lower fixed interest rates during the fiscal year in the step up program, and aggressive bond redemptions from mortgage-backed securities repayments and prepayments received during fiscal year 2003. Amortization expense increased $829,000, reflecting increased amortization of deferred debt financing costs as the respective bond issues experience higher than normal mortgage prepayments. Extraordinary losses on early bond redemptions represent premiums paid on older bond issues as they are retired prior to stated maturity in accordance with various trust indentures. Program, general and administrative expenses decreased $1,888,000, primarily due to one-time expenses paid by the Authority�s general fund in the prior year in comparison to the recent fiscal period.

6
Independent Auditors� Report Board of Directors Alabama Housing Finance Authority Montgomery, Alabama We have audited the accompanying basic financial statements of the Alabama Housing Finance Authority, a component unit of the State of Alabama, as of and for the year ended September 30, 2003. These basic financial statements are the responsibility of the Alabama Housing Finance Authority�s management. Our responsibility is to express an opinion on these basic financial statements based on our audit. The financial statements of the Authority as of September 30, 2002, were audited by other auditors whose report dated December 6, 2002, expressed an unqualified opinion on those statements. We conducted our audit in accordance with auditing standards generally accepted in the United States of America. Those standards require that we plan and perform the audit to obtain reasonable assurance about whether the basic financial statements are free of material misstatement. An audit includes examining, on a test basis, evidence supporting the amounts and disclosures in the basic financial statements. An audit also includes assessing the accounting principles used and significant estimates made by management, as well as evaluating the overall basic financial statement presentation. We believe that our audit provides a reasonable basis for our opinion. In our opinion, the basic financial statements referred to above present fairly, in all material respects, the financial position of the Alabama Housing Finance Authority at September 30, 2003, and the results of its operations and its cash flows for the year then ended in conformity with accounting principles generally accepted in the United States of America.

7
The Management�s Discussion and Analysis on pages 1 through 5 is supplementary information required by the Governmental Accounting Standards Board. We have applied certain limited procedures, which consisted principally of inquiries of management regarding the methods of measurement and presentation of the supplementary information. However, we did not audit the information and express no opinion on it. Our audit was performed for the purpose of forming an opinion on the basic financial statements taken as a whole. The accompanying additional segment data is presented for purposes of additional analysis and is not a required part of the basic financial statements. Such information has been subjected to the auditing procedures applied in our audit of the 2003 basic financial statements and, in our opinion, is fairly stated, in all material respects, in relation to the 2003 basic financial statements taken as a whole.
December 3, 2003
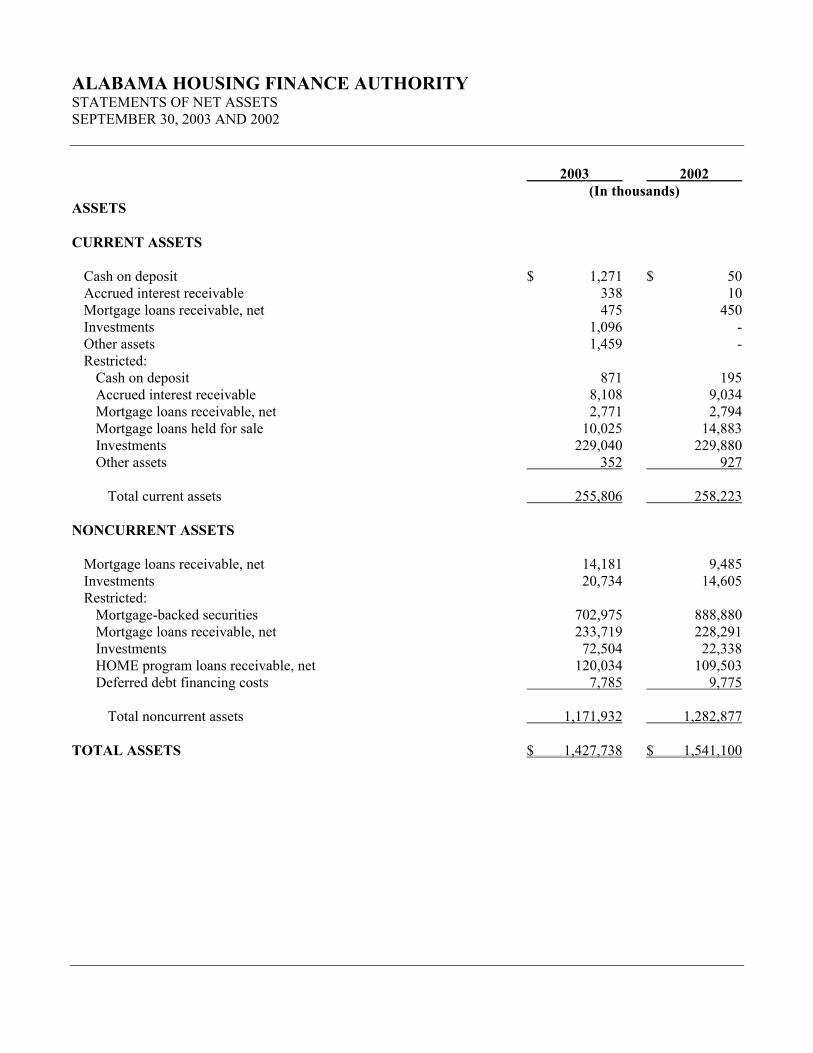
ALABAMA HOUSING FINANCE AUTHORITY STATEMENTS OF NET ASSETS SEPTEMBER 30, 2003 AND 2002
2003 2002 (In thousands) ASSETS CURRENT ASSETS Cash on deposit $ 1,271 $ 50 Accrued interest receivable 338 10 Mortgage loans receivable, net 475 450 Investments 1,096 - Other assets 1,459 - Restricted: Cash on deposit 871 195 Accrued interest receivable 8,108 9,034 Mortgage loans receivable, net 2,771 2,794 Mortgage loans held for sale 10,025 14,883 Investments 229,040 229,880 Other assets 352 927 Total current assets 255,806 258,223 NONCURRENT ASSETS Mortgage loans receivable, net 14,181 9,485 Investments 20,734 14,605 Restricted: Mortgage-backed securities 702,975 888,880 Mortgage loans receivable, net 233,719 228,291 Investments 72,504 22,338 HOME program loans receivable, net 120,034 109,503 Deferred debt financing costs 7,785 9,775 Total noncurrent assets 1,171,932 1,282,877 TOTAL ASSETS $ 1,427,738 $ 1,541,100

See independent auditors� report and notes to financial statements.
8
2003 2002 (In thousands) LIABILITIES AND NET ASSETS CURRENT LIABILITIES Bonds payable, net of unamortized discounts $ 165,023 $ 85,996 Notes payable 3,900 12,850 Accrued interest payable 21,917 25,303 Accrued arbitrage rebate 484 273 Other liabilities 1,000 1,860 Total current liabilities 192,324 126,282 NONCURRENT LIABILITIES Bonds payable, net of unamortized discounts 877,565 1,075,306 Refundable HOME program grants 120,903 109,503 Accrued arbitrage rebate 25,020 27,643 Deferred commitment fees 9,187 11,655 Total noncurrent liabilities 1,032,675 1,224,107 TOTAL LIABILITIES 1,224,999 1,350,389 NET ASSETS Invested in capital assets, net of related debt 376 114 Restricted 162,809 173,280 Unrestricted 39,554 17,317 Total net assets 202,739 190,711 TOTAL LIABILITIES AND NET ASSETS $ 1,427,738 $ 1,541,100
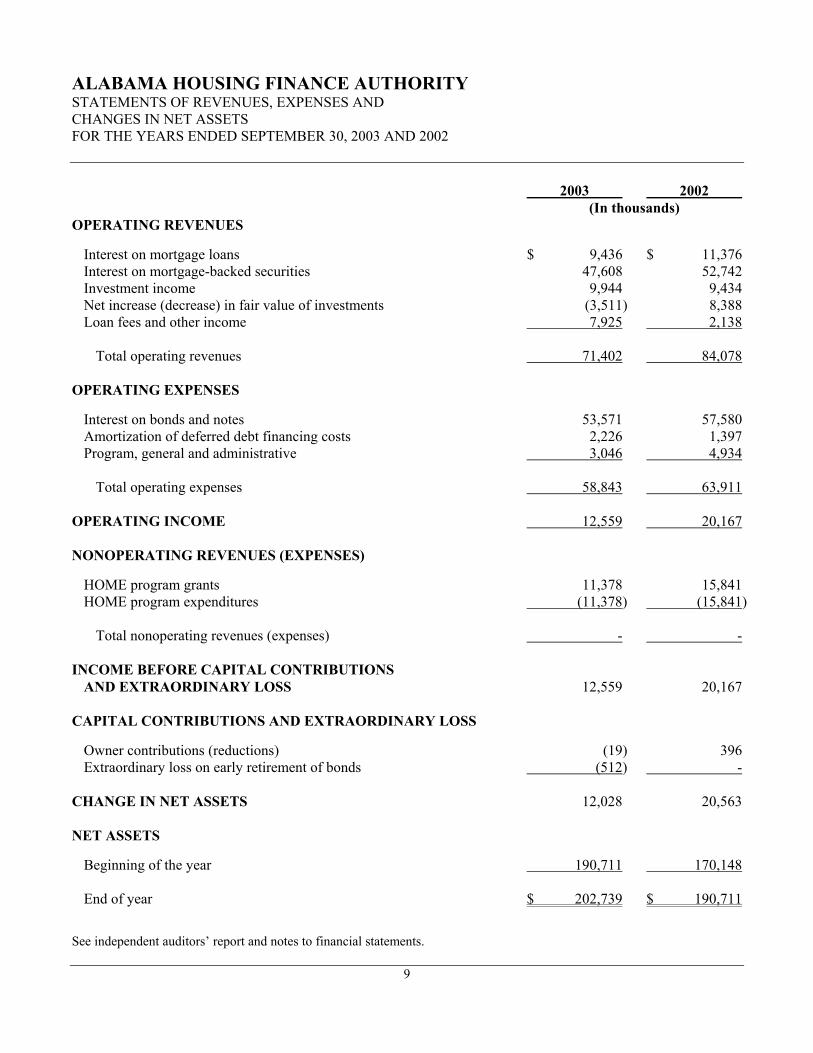
ALABAMA HOUSING FINANCE AUTHORITY STATEMENTS OF REVENUES, EXPENSES AND CHANGES IN NET ASSETS FOR THE YEARS ENDED SEPTEMBER 30, 2003 AND 2002
See independent auditors� report and notes to financial statements.
9
2003 2002 (In thousands) OPERATING REVENUES Interest on mortgage loans $ 9,436 $ 11,376 Interest on mortgage-backed securities 47,608 52,742 Investment income 9,944 9,434 Net increase (decrease) in fair value of investments (3,511) 8,388 Loan fees and other income 7,925 2,138 Total operating revenues 71,402 84,078 OPERATING EXPENSES Interest on bonds and notes 53,571 57,580 Amortization of deferred debt financing costs 2,226 1,397 Program, general and administrative 3,046 4,934 Total operating expenses 58,843 63,911 OPERATING INCOME 12,559 20,167 NONOPERATING REVENUES (EXPENSES) HOME program grants 11,378 15,841 HOME program expenditures (11,378) (15,841) Total nonoperating revenues (expenses) - - INCOME BEFORE CAPITAL CONTRIBUTIONS AND EXTRAORDINARY LOSS 12,559 20,167 CAPITAL CONTRIBUTIONS AND EXTRAORDINARY LOSS Owner contributions (reductions) (19) 396 Extraordinary loss on early retirement of bonds (512) - CHANGE IN NET ASSETS 12,028 20,563 NET ASSETS Beginning of the year 190,711 170,148 End of year $ 202,739 $ 190,711

ALABAMA HOUSING FINANCE AUTHORITY STATEMENTS OF CASH FLOWS FOR THE YEARS ENDED SEPTEMBER 30, 2003 AND 2002
See independent auditors� report and notes to financial statements.
10
2003 2002 (In thousands) CASH FLOWS FROM OPERATING ACTIVITIES Purchase of mortgage-backed securities $ (49,386) $ (79,555) Proceeds from sales/maturities of mortgage-backed securities 230,065 99,329 Purchase of mortgage loans (38,010) (36,120) Principal payments received on mortgage loans 30,516 12,850 Purchase of mortgage loans held for sale (45,152) (88,987) Proceeds from mortgage loans held for sale 49,949 80,628 Interest received from mortgage loans 9,298 11,456 Interest received from mortgage-backed securities 49,472 53,551 Payments for arbitrage (127) (192) Cash paid to suppliers for goods and services (1,523) (1,555) Cash payments to employees for services (1,533) (1,543) Loan fees, commitment fees and other income received 1,561 3,972 Net cash provided by operating activities 235,130 53,834 CASH FLOWS FROM NON CAPITAL FINANCING ACTIVITIES Proceeds from bonds issued 75,268 147,040 Net borrowings under line of credit 15,550 36,060 Principal payments on bonds (193,982) (97,210) Payments of debt financing costs (236) (837) Principal payments on note (24,500) (25,410) Proceeds from HOME grants, net 11,400 15,011 Contributions/distributions to owners, net (19) 396 Interest paid on bonds and note (58,039) (60,987) Net cash provided (used) in non capital financing activities (174,558) 14,063 CASH FLOWS FROM CAPITAL AND RELATED FINANCING ACTIVITIES Purchase of furniture and equipment (405) (51)

ALABAMA HOUSING FINANCE AUTHORITY STATEMENTS OF CASH FLOWS FOR THE YEARS ENDED SEPTEMBER 30, 2003 AND 2002
See independent auditors� report and notes to financial statements.
11
2003 2002 (In thousands) CASH FLOWS FROM INVESTING ACTIVITIES Purchases of investments $ (978,937) $ (790,187) Proceeds from sales of investments 922,830 724,892 Interest received from investments 8,368 10,513 HOME program mortgage loans funded (10,531) (15,011) Net cash used by investing activities (58,270) (69,793) NET INCREASE (DECREASE) IN CASH ON DEPOSIT 1,897 (1,947) CASH ON DEPOSIT AT BEGINNING OF YEAR 245 2,192 CASH ON DEPOSIT AT END OF YEAR $ 2,142 $ 245 RECONCILIATION OF OPERATING INCOME TO NET CASH PROVIDED BY OPERATING ACTIVITIES Operating income $ 12,559 $ 20,167 Adjustments to reconcile operating income to net cash provided by operating activities: Depreciation 143 48 Accretion of premiums and discounts on investments, net 6 308 Amortization of deferred debt financing costs 2,226 733 Amortization of deferred commitment fees (3,405) (1,392) Gross unrealized (gain) loss on investments 4,776 (20,212) Provision (recovery) for loan losses, net (2,608) (227) Extraordinary gain (loss) on early retirement of bonds (512) 664 Commitment fees received 937 1,330 Interest received from investments (8,368) (10,513) Interest paid on bonds and notes 58,039 59,752 Changes in operating assets and liabilities: Accrued interest receivable 597 163 Mortgage loans receivable (7,518) (23,359) Mortgage loans held for sale 4,858 (8,275) Mortgage-backed securities 180,679 19,774 Other assets (621) 405 Accrued interest payable (3,386) (1,646) Accrued arbitrage rebate (2,412) 14,502 Other liabilities (860) 1,612 NET CASH PROVIDED BY OPERATING ACTIVITIES $ 235,130 $ 53,834

ALABAMA HOUSING FINANCE AUTHORITY NOTES TO FINANCIAL STATEMENTS SEPTEMBER 30, 2003 AND 2002
12
1. AUTHORITY LEGISLATION The Alabama Housing Finance Authority (Authority) is a public corporation created, organized and existing under
Act No. 80-585 (Act) enacted by the Legislature of the State of Alabama at its 1980 regular session. Pursuant to the Act, the Authority is authorized to issue bonds to finance residential housing for persons and families of low and moderate income in the State of Alabama. The Authority is a component unit of the State of Alabama.
2. SUMMARY OF SIGNIFICANT ACCOUNTING POLICIES Basis of Accounting The Authority�s accounts are organized as funds, which include accounts of the assets, liabilities, net assets,
revenues and expenses of the Authority�s single family and multifamily mortgage revenue bond programs (Program Funds), the HOME Program, the Housing Assistance Program and a General Fund. Each Program Fund accounts for the proceeds from the bonds issued, the debt service requirements of the bonds and the related program investments, as required by the various bond resolutions established under the various trust indentures of each program.
The Authority uses the accrual method of accounting. The Authority�s Program Funds, HOME Fund, Housing
Assistance Fund and General Fund have been presented on a combined basis, as the Authority is considered a single enterprise fund for financial reporting purposes. Current assets include cash and amounts convertible to cash during the next normal operating cycle or one year. Current liabilities include those obligations to be liquidated with current assets. All inter-fund balances and transactions have been eliminated in the accompanying financial statements.
Revenues and expenses from the Program Funds, Housing Assistance Fund and General Fund are reported as
operating revenues and expenses. Revenues derived from Program Funds serve as security for the single family and multifamily mortgage revenue bond programs.
As permitted by Governmental Accounting Standards Board (GASB) Statement No. 20, Accounting and
Financial Reporting for Proprietary Funds and Other Governmental Entities that Use Proprietary Fund Accounting, the Authority has elected not to adopt Financial Accounting Standards Board (FASB) statements and interpretations issued after November 30, 1989, unless the GASB specifically adopts such FASB statements or interpretations.
All federal financial assistance received in connection with the Authority�s administration of the HOME Program
is reported as nonoperating revenues in the accompanying financial statements. Expenditures of HOME Program funds, whether for repayable or conditionally forgivable loans, are reported as nonoperating expenses in accordance with GASB Statement No. 24, Accounting and Financial Reporting for Certain Grants and Financial Assistance.

ALABAMA HOUSING FINANCE AUTHORITY NOTES TO FINANCIAL STATEMENTS SEPTEMBER 30, 2003 AND 2002
13
2. SUMMARY OF SIGNIFICANT ACCOUNTING POLICIES (Continued) Use of Estimates in the Preparation of Financial Statements
In preparing financial statements in conformity with generally accepted accounting principles, management is required to make estimates and assumptions that affect the reported amounts of assets and liabilities and the disclosure of contingencies at the date of the financial statements and revenues and expenses during the reporting period. Actual results could differ from those estimates.
Cash and Cash Equivalents Cash and cash equivalents represents funds on deposit with various financial institutions and uninvested funds
held by the Trustees of the Authority�s various mortgage revenue bond programs. At September 30, 2003, all cash on deposit was held by the Authority�s trustees in the name of the Authority. All cash on deposit at September 30, 2003 was covered by federal depository insurance, collateralized by the various financial institutions or the Security for Alabama Funds Enhancement Act.
Investments The Act authorizes the Authority to invest in bonds or other obligations issued or guaranteed by the U.S.
Government, any agency thereof, or the State of Alabama. In addition, the Authority may invest in interest-bearing bank and savings and loan association deposits, any obligations in which a State chartered savings and loan association may invest its funds, any agreement to repurchase any of the foregoing, or any combination thereof. Each of the trust indentures established under the Authority�s mortgage revenue bond programs contains further restrictions on the investment of non-expended bond proceeds; however, each trust indenture must be consistent with the Authority�s authorizing legislation with respect to the definition of eligible investments.
Investments consist of unexpended bond proceeds, temporary and debt service reserve funds established under the
provisions of various trust indentures and investments of the Authority�s general fund. In connection with the Authority�s mortgage revenue bond programs, unexpended bond proceeds are maintained in trust, invested in various types of investment contracts until such time as the proceeds can be used to purchase Program Certificates originated under the Authority�s program guidelines. The Authority�s guidelines generally require the investment contract issuer to collateralize the principal amount invested in the contract, unless the issuer has sufficiently high credit ratings, as established by independent rating agencies, to maintain the desired ratings of the Authority�s bond issues. The uncollateralized investment agreements generally require the issuer to collateralize the principal amount on deposit from time to time in the event the issuer�s credit rating drops below acceptable standards. The Authority continually monitors the credit ratings of all parties to guaranteed investment contracts.
The provisions of GASB Statement No. 31, Accounting and Financial Reporting for Certain Investments and for
External Investment Pools, permit the recording of guaranteed investment contracts at cost if the contracts are non-participating. Non-participating contracts are those that are non-negotiable and non-transferable and redeemable at contract or stated value, rather than fair value based on current market rates. All of the Authority�s investment contracts are non-participating and are therefore reported at cost. Investments other than non-participating investment contracts are reported at fair value.

ALABAMA HOUSING FINANCE AUTHORITY NOTES TO FINANCIAL STATEMENTS SEPTEMBER 30, 2003 AND 2002
14
2. SUMMARY OF SIGNIFICANT ACCOUNTING POLICIES (Continued) Mortgage-Backed Securities
Mortgage-backed securities consist of Government National Mortgage Association (GNMA) or Federal National Mortgage Association (FNMA) pass-through certificates, all of which are pledged as security for the mortgage revenue bonds. The fair value of program investments was based on quoted market prices obtained from an independent financial news and information service where available. If quoted market prices were not available, fair values were based on quoted market prices of comparable investments.
In accordance with GASB Statement No. 31, investment securities other than non-participating guaranteed
investment contracts (see above) are recorded at fair value and unrealized gains or losses are reported in the statements of revenues, expenses and changes in net assets. The Authority records a portion of net unrealized gains on investment securities as a liability to the extent that such gains would be rebateable to the United States government under Section 103A of the Internal Revenue Code, as amended (the Code), for tax-exempt bond issues sold after 1981. Such rebateable earnings, which totaled $3,057,000 in 2003 and $14,064,000 in 2002, are classified as a reduction of unrealized gains on investment securities in the statements of revenues, expenses and changes in net assets. The Code requires that such excess investment earnings be rebated to certain single family borrowers upon payoff of their respective mortgages or remitted to the Internal Revenue Service. Gains on sales of securities in these bond issues would create excess rebateable earnings. This liability is recorded on the statements of net assets as accrued arbitrage rebate.
Commitment Fees Commitment fees are deferred and recognized as income over the life of the applicable loans as an adjustment of
their yields. Mortgage Loans Receivable Mortgage loans are carried at their unpaid principal balances less an allowance for loan losses. Allowances for
loan losses are provided through charges against operations based upon management�s evaluation of the loan portfolio and the underlying security.
Mortgage Loans Held for Sale Mortgage loans held for sale are recorded at the lower of cost or fair value.

ALABAMA HOUSING FINANCE AUTHORITY NOTES TO FINANCIAL STATEMENTS SEPTEMBER 30, 2003 AND 2002
15
2. SUMMARY OF SIGNIFICANT ACCOUNTING POLICIES (Continued) HOME Program Loans Receivable HOME Program loans include loans originated under the HOME Program. This program is designed to assist
very low income borrowers, and, as such, some mortgages originated under the program are structured in such a way that repayment will only occur in limited circumstances. The Authority originated three loans that are forgivable for both principal and interest. These loans are not recorded as assets or liabilities of the Authority and totaled $2,950,000 at September 30, 2003 and 2002.
Deferred Debt Financing Costs Issuance costs on bonds are deferred and amortized, on a yield method, over the terms of the related bond issues. 3. MORTGAGE-BACKED SECURITIES Mortgage-backed securities held by the Authority include securitized mortgage obligations, backed by pools of
single family and multifamily mortgage loans originated under the Authority�s program guidelines. These securities are �fully modified pass through� mortgage-backed securities which require monthly payments by an FHA-approved lender, as the issuer of the guaranteed security, and are either insured or registered in the Authority�s name. GNMA and FNMA guarantee timely payment of principal and interest on guaranteed securities. At September 30, 2003, mortgage-backed securities consisted of program certificates with interest rates ranging from 4.42% to 8.625%. The cost of program investments at September 30, 2003 and 2002 was $671,178,000 and $851,856,000, respectively. As a result of changes in the fair value of mortgage-backed securities, the Authority recorded unrealized (losses) gains of ($2,169,000) and $7,469,000 for the years ended September 30, 2003 and 2002, respectively. It is the intention of the Authority to hold these securities until the underlying loan is paid in full.
4. INVESTMENTS Investments include unexpended bond proceeds, temporary and debt service reserve funds established under the
provisions of various trust indentures and investments of the Authority�s general fund. Guaranteed investment contracts generally carry fixed rates of return for varying periods of time specified in the
Trust Indentures. Approximately 1.04% and .29% of the carrying amount of these investments at September 30, 2003 and 2002, respectively, are collateralized by the depository institutions with U.S. Government and agency securities, as required by the respective contracts, in amounts ranging from 103% to 120% of the par value of the investments, depending upon the maturities and types of collateral held. Substantially all of the remaining uncollateralized investment contracts contain provisions which require the issuers to collateralize the deposit in the event their credit ratings fall below certain minimum levels, or in certain other circumstances. The cost basis of the guaranteed investment contracts approximates their fair value.

ALABAMA HOUSING FINANCE AUTHORITY NOTES TO FINANCIAL STATEMENTS SEPTEMBER 30, 2003 AND 2002
16
4. INVESTMENTS (Continued) The Authority�s investments in U.S. Government and agency securities are held by the Authority�s trustees in
book-entry form through the trustees� custodial agents, in the name of the trustees or custodial agents. The cost basis of the U.S. Government and agency securities at September 30, 2003 and 2002 was $82,476,557 and $20,156,000, respectively.
The Authority recorded realized gains (losses) of ($1,790,000) and $2,240,000 for the years ended September 30,
2003 and 2002, respectively. Unrealized gains (losses) totaled ($1,721,000) and $6,148,000 for the years ended September 30, 2003 and 2002, respectively.
Investments in money market funds and repurchase agreements are carried at fair value, which is equal to the
amortized cost basis. Investments consist of the following at September 30 (in thousands):
2003 2002
Non-participating guaranteed investment contracts (at cost): Collateralized investment contracts:
Morgan Guaranty Trust Company, 6.10% (single family series 1997-D) $ 843 $ 193
Uncollateralized investment contracts (at cost): AIG Matched Funding Corp., 5.235% to 6.53% (single family series 1994-A, 1996-B, 1996-D, 1997-A, 1997-C, 1998-A, 1999-B, 1999-C, 2001-A) 7,409 3,548
Bayerishe Landesbank, 4.75% to 6.15%, variable (single family series 1995-B, 1998-B, 2001-B, 2002-B, multifamily series 1989-C, 1992-B) 22,089 21,498
Compass Bank, variable (multifamily series 2003-A) 3,676 -
Financial Guaranty Insurance Corp., 4.00% to 6.50% (single family series 1994-B, 1995-A, multifamily series 2000-K, 2001-A) 1,749 1,132
Trinity, 6.51%, variable (single family series 1996-C, 2002-A, 2002-C) 39,647 38,748
Westdeutsche Landesbank, 4.00% to 6.52% (single family series 1997-B, 2000-A, 2000-B, multifamily series 1996-D&E) 5,449 1,706
Total non-participating guaranteed investment contracts 80,862 66,825
U.S. Government securities (at fair value) 83,671 20,901
Money market funds and repurchase agreements (at fair value) 158,841 179,097
$ 323,374 $ 266,823

ALABAMA HOUSING FINANCE AUTHORITY NOTES TO FINANCIAL STATEMENTS SEPTEMBER 30, 2003 AND 2002
17
4. INVESTMENTS (Continued) Investments are classified in the accompanying statements of net assets as follows (in thousands): 2003 2002
Current assets � Investments $ 1,096 $ - Current assets � Restricted Investments 229,040 229,880 Noncurrent assets � Investments 20,734 14,605 Noncurrent assets � Restricted Investments 72,504 22,338 $ 323,374 $ 266,823
5. MORTGAGE LOANS RECEIVABLE The Authority�s single family bond programs are designed to provide mortgage loans to qualified home-buyers
within the State of Alabama. The Authority�s guidelines generally require the mortgage loans to be either FHA insured, guaranteed by the Department of Veterans Affairs or conventionally financed with traditional primary mortgage insurance and, in the case of pre-1987 single family programs, insured with mortgage pool policies. Mortgage loans receivable, net consist of the following at September 30 (in thousands):
2003 2002 Single family mortgage loans (7.92% to 13.85%):
Conventional $ 16,894 $ 22,572 FHA insured 3,037 4,173 VA insured 3,298 4,085
Step up down payment assistance loans (5.02% to 8.40%) 3,245 1,719 Down payment assistance/habitat loans 11,942 12,642 38,416 45,191 Less allowance for loan losses (756) (4,690) Total single family mortgages loans 37,660 40,501 Multifamily mortgage loans (1.03% to 8.07%) 213,486 200,519 $ 251,146 $ 241,020
Under the Authority�s program guidelines, all conventionally financed single family mortgage loans with an
initial loan-to-value ratio of greater than 80% are insured by private mortgage insurance carriers. In addition, each single family mortgage loan is insured under supplemental mortgage pool insurance contracts with two insurers. The two mortgage pool insurers, together with the approximate percentage of single family mortgage loans outstanding at September 30, 2003, are as follows: General Electric Mortgage Insurance Company (35.5%), Mortgage Guaranty Insurance Company (59%), and Republic Mortgage Insurance Company (5.5%).

ALABAMA HOUSING FINANCE AUTHORITY NOTES TO FINANCIAL STATEMENTS SEPTEMBER 30, 2003 AND 2002
18
5. MORTGAGE LOANS RECEIVABLE (Continued) The Authority�s multifamily bond programs are designed to finance multifamily housing units in the State of
Alabama. The Authority does not actively monitor the operating performance or financial condition of the multifamily properties financed by the bonds, as the Authority principally functions as a conduit to provide tax-exempt financing. Multifamily mortgage loans are collateralized by varying methods, including first-liens on multifamily residential rental properties located within the State of Alabama, letters of credit, surety bonds and guarantees provided by third parties.
Mortgage loans receivable are classified in the accompanying statements of net assets as follows (in thousands): 2003 2002
Current assets � Mortgage loans receivable, net $ 475 $ 450 Current assets � Restricted Mortgage loans receivable, net 2,771 2,794 Noncurrent assets � Mortgage loans receivable, net 14,181 9,485 Noncurrent assets � Restricted Mortgage loans receivable, net 233,719 228,291 $ 251,146 $ 241,020
6. BONDS PAYABLE Bonds payable are limited obligations of the Authority, and are not a debt or liability of the State of Alabama or
any subdivisions thereof. Each bond issue is secured, as described in the applicable trust indenture, by all revenues, moneys, investments, mortgage loans, and other assets in the funds and accounts of the program. Substantially all of the Authority�s assets are pledged as security for the bonds. The provisions of the applicable trust indentures require or allow for redemption of bonds through the use of unexpended bond proceeds and excess funds accumulated primarily through prepayment of mortgage loans and program certificates. All outstanding bonds are subject to redemption at the option of the Authority, in whole or in part at any time after certain dates, as specified in the respective series indentures.
All single family and multifamily variable rate bonds bear interest at a weekly rate until maturity or earlier
redemption. The remarketing agent for each bond issue establishes the weekly rate according to each indenture's remarketing agreement. The weekly rates are communicated to the various bond trustees for preparation of debt service payments. The weekly rate, as set by the remarketing agent, allows the bonds to trade in the secondary market at a price equal to 100% of the principal amount of the bonds outstanding, with each rate not exceeding maximum rates permitted by law.
The Authority�s publicly offered multifamily bonds are considered conduit debt obligations and are secured by
several forms of credit enhancement, including FHA insured mortgage loans, GNMA guaranteed certificates, and letters of credit from financial institutions including collateralized, insured, and uncollateralized and uninsured arrangements. The Authority has no obligation for the bonds beyond the resources provided above.

ALABAMA HOUSING FINANCE AUTHORITY NOTES TO FINANCIAL STATEMENTS SEPTEMBER 30, 2003 AND 2002
19
6. BONDS PAYABLE (Continued) Bonds payable consists of the following at September 30 (in thousands): Aggregate Principal Original Outstanding Maturity 2003 2002 Value Single family bond programs:
1992 Series A converted, 1994 Series A-B, 1995 Series A-B, 1996 Series B-D, 1997 Series A-D, 1998 Series A-B (3.70% to 6.90%) due 1994 to 2029 $ 346,620 $ 463,260 $ 789,250
1999 Series B-C, 2000 Series A-B, 2001 Series A-B, 2002 Series A-C (2.50% to 6.25%, variable), due 2001 to 2032 337,745 370,270 459,105
2000/2003 Step-Up Program (4.42% to 7.80%), due 2034 64,615 35,765 73,539 2001 Series C (4.02%), due 2001 to 2006 17,110 23,110 29,110 2002 Series D (3.00%), due 2002 to 2007 20,920 26,200 26,200
Multifamily bond programs:
1989 Series A-F (6.00% to 7.50%, variable), due 1989 to 2024 $ 2,545 $ 7,010 $ 17,640 1991 Series A-D (5.00% to 7.00%, variable), due 1992 to 2009 2,865 4,570 8,525 1992 Series A-I (5.90% to 7.63%, variable), due 1993 to 2023 5,083 5,123 36,890 1994 Series A-F (7.10% to 7.65%), due 1994 to 2024 33,484 46,560 51,320 1995 Series A-M (5.65% to 8.65%, variable), due 1996 to 2030 27,433 30,883 32,090 1996 Series A-F (6.20% to 8.10%, variable), due 2000 to 2038 47,670 47,685 53,755 1997 Series A-B (4.00% to 5.55%, variable), due 1999 to 2016 4,275 4,485 10,350 1999 Series A-B (4.80% to 5.70%, variable), due 2000 to 2029 6,775 6,885 7,200 2000 Series A-K (4.25% to 5.95%, variable), due 2003 to 2033 41,685 41,945 45,325 2001 Series A-D (4.875% to 6.83%), due 2013 to 2034 16,024 16,026 16,026 2002 Series A-J (4.65% to 5.55%, variable), due 2012 to 2035 31,245 31,525 31,525 2003 Series A-H (4.255% to 6.95%, variable), due 2014 to 2036 36,494 - 36,500
$ 1,042,588 $ 1,161,302

ALABAMA HOUSING FINANCE AUTHORITY NOTES TO FINANCIAL STATEMENTS SEPTEMBER 30, 2003 AND 2002
20
6. BONDS PAYABLE (Continued) Principal and interest payments on bonds after 2003 are scheduled as follows (in thousands): Fiscal year ending Single Family Bonds Multifamily Bonds Total September 30 Principal Interest Principal Interest Principal Interest 2004 $ 163,729 $ 25,843 $ 1,294 $ 7,870 $ 165,023 $ 33,713 2005 21,255 39,950 1,458 8,369 22,713 48,319 2006 20,730 38,983 1,592 8,308 22,322 47,291 2007 16,015 38,125 1,732 8,243 17,747 46,368 2008 11,590 37,366 8,017 8,173 19,607 45,539 2009-2013 72,400 174,882 20,254 36,196 92,654 211,078 2014-2018 92,095 149,629 13,461 32,209 105,556 181,838 2019-2023 124,530 114,386 16,440 29,701 140,970 144,087 2024-2028 141,580 67,848 91,535 16,179 233,115 84,027 2029-2033 59,285 29,604 55,270 8,725 114,555 38,329 2034-2038 63,801 4,399 44,525 1,877 108,326 6,276 $ 787,010 $ 721,015 $ 255,578 $ 165,850 $ 1,042,588 $ 886,865 7. NOTES PAYABLE The Authority has established a $50,000,000 line of credit to make funds available for the purchase of loans
during the origination period of its single family mortgage revenue bond programs. Outstanding borrowings under the line of credit were $3,900,000 and $12,850,000 as of September 30, 2003 and 2002, respectively. Borrowings under the credit facility are secured by a pledge of approximately $33,031,000 in mortgage loans receivable and mortgage loans held for sale at September 30, 2003.
8. NET ASSETS
Net assets comprise the various net earnings from operating and non-operating revenues, expenses and contributions of capital. Net assets are classified in the following three components; invested in capital assets, net of related debt; restricted net assets; and unrestricted net assets. Invested in capital assets, net of related debt, consists of all capital assets, net of accumulated depreciation and reduced by outstanding debt that is attributable to the acquisition, construction and improvement of those assets; debt related to unspent proceeds or other restricted cash and investments is excluded from the determination. Restricted consists of net assets for which constraints are placed thereon by external parties, such as lenders, grantors, contributors, laws, regulations and enabling legislation, including self-imposed legal mandates. Unrestricted consists of all other net assets not included in the above categories.

ALABAMA HOUSING FINANCE AUTHORITY NOTES TO FINANCIAL STATEMENTS SEPTEMBER 30, 2003 AND 2002
21
8. NET ASSETS (Continued) The various trust indentures generally permit transfers to the Authority�s general fund for administrative fees and
reimbursements of costs associated with the administration of the mortgage revenue bond programs. Otherwise, the cash and investments of the various program funds are retained in the trust indentures to satisfy debt service obligations with respect to the applicable bonds, and are restricted to this purpose. Such amounts are reflected as restricted components of net assets.
Under the terms of the Authority�s multifamily mortgage revenue bond programs, certain funds on hand in excess
of stipulated minimum balances are periodically remitted to the owners of the multifamily developments financed by the bond issue, and are classified as owners� reserve in the accompanying financial statements. Funds remaining on hand at the conclusion of these programs are to be remitted to such owners. Therefore, such amounts are reflected as restricted components of net assets.
The Authority�s Board of Directors has designated its unrestricted net assets as of September 30, 2003 and 2002
totaling $39,554,000 and $17,317,000, respectively, for funding of future single family mortgage revenue bond programs, to support its single family mortgage loan origination and warehousing operations, and to cover its operating expense budget for the following fiscal year.
9. RETIREMENT PLANS Substantially all full-time employees of the Authority participate in a defined contribution retirement plan, the
Alabama Housing Finance Authority Money Purchase Thrift Plan (the Plan), which provides retirement benefits to Plan participants. The Plan is administered by an independent third-party administrator. To be eligible, an employee must be over age 21 and contribute 5% of his or her compensation to the Plan annually. The Authority contributes an amount equal to 7% of each participant�s compensation annually. The Authority�s and employees� contributions to the Plan were $111,362 and $79,542, respectively, in fiscal 2003 and $102,000 and $73,000, respectively, in fiscal 2002.
The Authority established the Alabama Housing Finance Authority Employees' Pension Plan ("Plan"), a single-employer defined benefit pension plan, on September 26, 2002. All plan investments are reported at fair value. The Plan provides retirement, death, disability and termination benefits to plan participants and beneficiaries.
Benefit provisions are established under a formal, written plan document and assets are held under a separate tax-qualified plan trust. The plan and trust information can be obtained from the Alabama Housing Finance Authority, 2000 Interstate Park, Suite 408, Montgomery, AL 36123-0909. A separate stand-alone financial report for the pension plan is not available.
The Plan is funded in full by the Alabama Housing Finance Authority. Plan participants do not contribute to the plan. The contribution rates to fund the plan are determined annually by an independent actuarial valuation of plan liabilities and assets. This report contains applicable actuarial assumptions and methods and plan liability and asset calculations including the annual required contribution (ARC).

ALABAMA HOUSING FINANCE AUTHORITY NOTES TO FINANCIAL STATEMENTS SEPTEMBER 30, 2003 AND 2002
22
9. RETIREMENT PLANS (Continued) The required contributions to fund the annual pension cost of the Plan for the years ended September 30, 2003 and 2002 was $303,786 and $403,277, respectively, or about 19.9% and 27.2% of covered participant compensation, respectively. Actual employer contributions to the plan totaled $1,611,635 and $-0- for the years ended September 30, 2003 and 2002, respectively. The net pension (asset) obligation at September 30, 2003 and 2002 was ($320,914) and $1,611,635.
The annual required contribution for the current year was determined as part of the September 30, 2003 actuarial valuation using the individual spread gain actuarial cost method. This method does not separately identify or separately amortize unfunded liabilities. The significant actuarial assumptions utilized were as follows: 4.5% annual projected salary increases, 7% pre-retirement investment returns and 6% post-retirement investment returns. At the plan�s most recent actuarial date, September 30, 2003, the plan had the following participants:
Active participants 33 Vested terminated participants 3 Retired participants and beneficiaries 0 Total 36 10. OPERATING LEASE The Authority leases office space under an operating lease expiring in 2008. Rent expense for the years ended
September 30, 2003 and 2002, totaled $194,967 and $184,761, respectively. These amounts are included in program, general and administrative expenses in the accompanying financial statements. Future minimum rental payments required under this lease for the year ending September 30 (in thousands):
2004 $ 183 2005 183 2006 188 2007 193 2008 198 Thereafter 50 11. EARLY RETIREMENT OF BONDS
The Authority�s mortgage revenue bonds are subject to certain extraordinary redemption provisions. During the years ended September 30, 2003 and 2002, the Authority called approximately $167,583,000 and $77,567,000 (net of unamortized discounts), respectively, of bonds in advance of their scheduled maturities. The loss on early retirement of these bonds recognized in the financial statements is comprised of the premium paid to retire the bonds.

ALABAMA HOUSING FINANCE AUTHORITY NOTES TO FINANCIAL STATEMENTS SEPTEMBER 30, 2003 AND 2002
23
12. RECLASSIFICATIONS Certain elements in the 2002 financial statement presentation have been reclassified to conform to the 2003
presentation. 13. SUBSEQUENT EVENTS From October 1, 2003 through December 3, 2003, the Authority called approximately $88,065,000 of bonds prior
to their scheduled maturities in the single family bond program, issued $11,616,000 of bonds in the multifamily bond program, and redeemed $3,450,000 of multifamily bonds prior to their scheduled maturities.

OTHER FINANCIAL INFORMATION

ALABAMA HOUSING FINANCE AUTHORITY STATEMENTS OF NET ASSETS SINGLE FAMILY BOND SERIES ADDITIONAL SEGMENT DATA (IN THOUSANDS) SEPTEMBER 30, 2003
24
1991 D,1992 A, 1994 A-B, 1995 A-C 1999 A-C 1996 A-D 2000 A-C 1997 A-D 2001 A-B 2003 2000/2003 Combined
1998 A-B 2002 A-C First Step Step Up 2001 C 2002 D Single Family CURRENT ASSETS Cash on deposit $ - $ - $ - $ - $ - $ - $ - Accrued interest receivable - - - - - - - Mortgage loans receivable, net - - - - - - - Investments - - - - - - - Other assets - - - - - - - Restricted: Cash on deposit - - - - - - - Accrued interest receivable 2,280 1,822 - 322 300 273 4,997 Mortgage loans receivable, net - - - - - - - Mortgage loans held for sale - - - - - - - Investments 81,121 129,156 36 1,199 49 10 211,571 Other assets - - - - - - - Total current assets 83,401 130,978 36 1,521 349 283 216,568
NONCURRENT ASSETS Mortgage loans receivable, net - - - - - - - Investments - - - - - - - Restricted: Mortgage-backed securities 308,340 233,827 - 65,973 36,401 41,370 685,911 Mortgage loans receivable, net - - - - - - - Investments - 2,105 - - 28,704 15,075 45,884 HOME program loans receivable, net - - - - - - - Deferred debt financing costs 3,302 3,869 112 198 110 194 7,785 Total noncurrent assets 311,642 239,801 112 66,171 65,215 56,639 739,580
TOTAL ASSETS $ 395,043 $ 370,779 $ 148 $ 67,692 $ 65,564 $ 56,922 $ 956,148 LIABILITIES AND NET ASSETS
CURRENT LIABILITIES Bonds payable, net $ 59,790 $ 91,845 $ - $ 814 $ 6,000 $ 5,280 $ 163,729 Notes payable - - - - - - - Accrued interest payable 9,998 7,917 - 327 10 9 18,261 Accrued arbitrage rebate 76 408 - - - - 484 Due to (from) other funds 147 112 - - (1,612) - (1,353) Other liabilities 39 29 - - - - 68 Total current liabilities 70,050 100,311 - 1,141 4,398 5,289 181,189
NONCURRENT LIABILITIES Bonds payable, net 286,830 245,900 - 63,801 11,110 15,640 623,281 Refundable HOME program grants - - - - - - - Accrued arbitrage rebate 13,652 11,368 - - - - 25,020 Deferred commitment fees - - - - - - - Total noncurrent liabilities 300,482 257,268 - 63,801 11,110 15,640 648,301
TOTAL LIABILITIES 370,532 357,579 - 64,942 15,508 20,929 829,490
NET ASSETS Restricted 24,511 13,200 148 2,750 50,056 35,993 126,658 Unrestricted - - - - - - - Total net assets 24,511 13,200 148 2,750 50,056 35,993 126,658
TOTAL LIABILITIES AND NET ASSETS $ 395,043 $ 370,779 $ 148 $ 67,692 $ 65,564 $ 56,922 $ 956,148

ALABAMA HOUSING FINANCE AUTHORITY STATEMENTS OF REVENUES, EXPENSES, AND CHANGES IN NET ASSETS SINGLE FAMILY BOND SERIES ADDITIONAL SEGMENT DATA (IN THOUSANDS) FOR THE YEAR ENDED SEPTEMBER 30, 2003
25
1991 D,1992 A, 1994 A-B, 1995 A-C 1999 A-C 1996 A-D 2000 A-C 1997 A-D 2001 A-B 2003 2000/2003 Combined
1998 A-B 2002 A-C First Step Step Up 2001 C 2002 D Single Family OPERATING REVENUES Interest on mortgage loans $ - $ - $ - $ - $ - $ - $ - Interest on mortgage-backed securities 21,325 15,278 - 3,327 3,187 3,233 46,350 Investment income 2,926 3,480 - 5 999 284 7,694 Net increase (decrease) in fair value of investments (22) (571) - 558 (1,548) (830) (2,413) Loan fees and other income - - - 52 - - 52 Total operating revenues 24,229 18,187 - 3,942 2,638 2,687 51,683 OPERATING EXPENSES Interest on bonds and notes 22,154 17,272 - 3,377 828 720 44,351 Amortization of deferred debt financing costs 1,212 738 - 30 116 130 2,226 Program, general and administrative 87 74 - 4 74 6 245 Total operating expenses 23,453 18,084 - 3,411 1,018 856 46,822 OPERATING INCOME 776 103 - 531 1,620 1,831 4,861 NONOPERATING REVENUES (EXPENSES) HOME program grants - - - - - - - HOME program expenditures - - - - - - - Total nonoperating revenues (expenses) - - - - - - - INCOME BEFORE CAPITAL CONTRIBUTIONS, TRANSFERS AND EXTRAORDINARY LOSS 776 103 - 531 1,620 1,831 4,861 CAPITAL CONTRIBUTIONS, TRANSFERS AND EXTRAORDINARY LOSS Owner contributions (reductions) - - - - - - - Transfers in (out) (458) (245) 148 114 (30) - (471) Extraordinary loss on early retirement of bonds (512) - - - - - (512) CHANGES IN NET ASSETS (194) (142) 148 645 1,590 1,831 3,878 NET ASSETS Beginning of year 24,705 13,342 - 2,105 48,466 34,162 122,780 End of year $ 24,511 $ 13,200 $ 148 $ 2,750 $ 50,056 $ 35,993 $ 126,658

ALABAMA HOUSING FINANCE AUTHORITY STATEMENTS OF NET ASSETS MULTIFAMILY BOND SERIES AND OTHER FUNDS ADDITIONAL SEGMENT DATA (IN THOUSANDS) SEPTEMBER 30, 2003
1989 1991 1992 1994 1995 1996 1997 1999
A-F A-D A-I A-F A-M A-F A-B A-B CURRENT ASSETS Cash on deposit $ - $ - $ - $ - $ - $ - $ - $ - Accrued interest receivable - - - - - - - - Mortgage loans receivable, net - - - - - - - - Investments - - - - - - - - Other assets - - - - - - - - Restricted: Cash on deposit 2 - - - - - - - Accrued interest receivable - 2 9 - 64 33 - 30 Mortgage loans receivable, net 125 155 45 - 165 - - - Mortgage loans held for sale - - - - - - - - Investments 53 144 201 647 210 353 - 105 Other assets - - - - - - 33 - Total current assets 180 301 255 647 439 386 33 135
NONCURRENT ASSETS Mortgage loans receivable, net - - - - - - - - Investments - - - - - - - - Restricted: Mortgage-backed securities - - - - 7,330 2,861 - 6,873 Mortgage loans receivable, net 2,387 2,588 5,300 33,484 14,167 45,075 - - Investments - - - - 6,508 - 4,723 - HOME program loans receivable, net - - - - - - - - Deferred debt financing costs - - - - - - - - Total noncurrent assets 2,387 2,588 5,300 33,484 28,005 47,936 4,723 6,873
TOTAL ASSETS $ 2,567 $ 2,889 $ 5,555 $ 34,131 $ 28,444 $ 48,322 $ 4,756 $ 7,008 LIABILITIES AND NET ASSETS
CURRENT LIABILITIES Bonds payable, net $ 125 $ 155 $ 45 $ - $ 290 $ 15 $ 215 $ 115 Notes payable - - - - - - - - Accrued interest payable 2 2 19 165 196 80 37 29 Program funds held for others - - - - - - - - Due to (from) other funds - - - - - - - - Other liabilities - - - - 1 - - - Total current liabilities 127 157 64 165 487 95 252 144
NONCURRENT LIABILITIES Bonds payable, net 2,420 2,710 5,038 33,484 27,143 47,655 4,060 6,660 Refundable HOME program grants - - - - - - - - Program funds held for others - - - - - - - - Deferred commitment fees - - - - - - - - Total noncurrent liabilities 2,420 2,710 5,038 33,484 27,143 47,655 4,060 6,660
TOTAL LIABILITIES 2,547 2,867 5,102 33,649 27,630 47,750 4,312 6,804
NET ASSETS Restricted 20 22 453 482 814 572 444 204 Unrestricted - - - - - - - - Total net assets 20 22 453 482 814 572 444 204
TOTAL LIABILITIES AND NET ASSETS $ 2,567 $ 2,889 $ 5,555 $ 34,131 $ 28,444 $ 48,322 $ 4,756 $ 7,008

26
Combined Combined Housing 2000 2001 2002 2003 Multi Single HOME Assistance General Combined A-K A-D A-J A-H Family Family Fund Fund Fund Totals $ - $ - $ - $ - $ - $ - $ - $ 398 $ 873 $ 1,271 - - - - - - - - 338 338 - - - - - - - 475 - 475 - - - - - - - - 1,096 1,096 - - - - - - - 230 1,229 1,459 - - - - 2 - 869 - - 871 35 16 17 227 433 4,997 2,639 39 - 8,108 141 46 55 39 771 - - - 2,000 2,771 - - - - - - - - 10,025 10,025 471 162 307 14,816 17,469 211,571 - - - 229,040 - - - - 33 - 319 - - 352 647 224 379 15,082 18,708 216,568 3,827 1,142 15,561 255,806
- - - - - - - 14,181 - 14,181 - - - - - - - 14,852 5,882 20,734 - - - - 17,064 685,911 - - - 702,975 41,265 15,968 31,162 21,317 212,713 - - - 21,006 233,719 - - - - 11,231 45,884 - - 15,389 72,504 - - - - - - 120,034 - - 120,034 - - - - - 7,785 - - - 7,785 41,265 15,968 31,162 21,317 241,008 739,580 120,034 29,033 42,277 1,171,932
$ 41,912 $ 16,192 $ 31,541 $ 36,399 $ 259,716 $ 956,148 $ 123,861 $ 30,175 $ 57,838 $ 1,427,738
$ 60 $ 46 $ 125 $ 103 $ 1,294 $ 163,729 $ - $ - $ - $ 165,023 - - - - - - - - 3,900 3,900 85 109 140 153 1,017 18,261 2,639 - - 21,917 - - - - - 484 - - - 484 - - - - - (1,353) 319 - 1,034 - - - - - 1 68 - 39 892 1,000 145 155 265 256 2,312 181,189 2,958 39 5,826 192,324
41,625 15,978 31,120 36,391 254,284 623,281 - - - 877,565 - - - - - - 120,903 - - 120,903 - - - - - 25,020 - - - 25,020 - - - - - - - - 9,187 9,187 41,625 15,978 31,120 36,391 254,284 648,301 120,903 - 9,187 1,032,675
41,770 16,133 31,385 36,647 256,596 829,490 123,861 39 15,013 1,224,999
142 59 156 (248) 3,120 126,658 - - 33,407 163,185 - - - - - - - 30,136 9,418 39,554 142 59 156 (248) 3,120 126,658 - 30,136 42,825 202,739
$ 41,912 $ 16,192 $ 31,541 $ 36,399 $ 259,716 $ 956,148 $ 123,861 $ 30,175 $ 57,838 $ 1,427,738

ALABAMA HOUSING FINANCE AUTHORITY STATEMENTS OF REVENUES, EXPENSES, AND CHANGES IN NET ASSETS MULTIFAMILY BOND SERIES AND OTHER FUNDS ADDITIONAL SEGMENT DATA (IN THOUSANDS) FOR THE YEAR ENDED SEPTEMBER 30, 2003
1989 1991 1992 1994 1995 1996 1997 1999
A-F A-D A-I A-F A-M A-F A-B A-B OPERATING REVENUES Interest on mortgage loans $ 32 $ 47 $ 289 $ 2,009 $ 699 $ 570 $ - $ - Interest on mortgage-backed securities 54 - - 2 481 171 183 367 Investment income 9 1 12 - 283 4 1 - Net increase (decrease) in fair value of investments (283) - - - (197) (21) (128) (23) Loan fees and other income 2 - - - - - - - Total operating revenues (186) 48 301 2,011 1,266 724 56 344 OPERATING EXPENSES Interest on bonds and notes 114 47 259 2,009 1,514 716 231 350 Amortization of deferred debt financing costs - - - - - - - - Program, general and administrative 20 - 3 - 18 20 11 2 Total operating expenses 134 47 262 2,009 1,532 736 242 352 OPERATING INCOME (LOSS) (320) 1 39 2 (266) (12) (186) (8) NONOPERATING REVENUES (EXPENSES) HOME program grants - - - - - - - - HOME program expenditures - - - - - - - - Total nonoperating revenues (expenses) - - - - - - - - INCOME BEFORE CAPITAL CONTRIBUTIONS, TRANSFERS AND EXTRAORDINARY LOSS (320) 1 39 2 (266) (12) (186) (8) CAPITAL CONTRIBUTIONS, TRANSFERS AND EXTRAORDINARY LOSS Owner contributions (reductions) (120) (26) - 120 - - 342 (33) Transfers in (out) - - - - - - - - Extraordinary loss on early retirement of bonds - - - - - - - - CHANGES IN NET ASSETS (440) (25) 39 122 (266) (12) 156 (41) NET ASSETS Beginning of year 460 47 414 360 1,080 584 288 245 End of year $ 20 $ 22 $ 453 $ 482 $ 814 $ 572 $ 444 $ 204
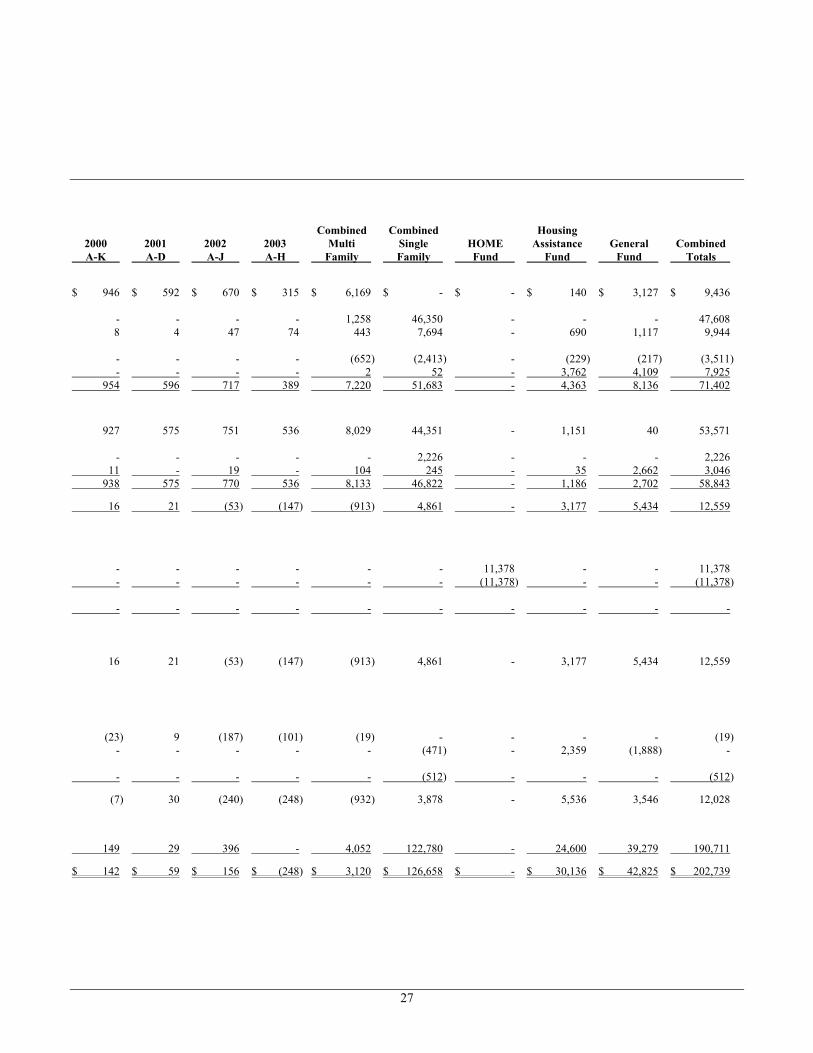
27
Combined Combined Housing 2000 2001 2002 2003 Multi Single HOME Assistance General Combined A-K A-D A-J A-H Family Family Fund Fund Fund Totals $ 946 $ 592 $ 670 $ 315 $ 6,169 $ - $ - $ 140 $ 3,127 $ 9,436 - - - - 1,258 46,350 - - - 47,608 8 4 47 74 443 7,694 - 690 1,117 9,944 - - - - (652) (2,413) - (229) (217) (3,511) - - - - 2 52 - 3,762 4,109 7,925 954 596 717 389 7,220 51,683 - 4,363 8,136 71,402 927 575 751 536 8,029 44,351 - 1,151 40 53,571 - - - - - 2,226 - - - 2,226 11 - 19 - 104 245 - 35 2,662 3,046 938 575 770 536 8,133 46,822 - 1,186 2,702 58,843 16 21 (53) (147) (913) 4,861 - 3,177 5,434 12,559 - - - - - - 11,378 - - 11,378 - - - - - - (11,378) - - (11,378) - - - - - - - - - - 16 21 (53) (147) (913) 4,861 - 3,177 5,434 12,559 (23) 9 (187) (101) (19) - - - - (19) - - - - - (471) - 2,359 (1,888) - - - - - - (512) - - - (512) (7) 30 (240) (248) (932) 3,878 - 5,536 3,546 12,028 149 29 396 - 4,052 122,780 - 24,600 39,279 190,711 $ 142 $ 59 $ 156 $ (248) $ 3,120 $ 126,658 $ - $ 30,136 $ 42,825 $ 202,739


ALABAMA HOUSINGFINANCE AUTHORITYP.O. Box 230909Montgomery, Alabama 36123-0909
2000 Interstate Park Drive, Suite 408Montgomery, Alabama 36109
334/244-9200334/271-6785 (TTY)www.ahfa.com


