54
Finding races and memory errors with compiler instrumentation. AddressSanitizer, ThreadSanitizer. Konstantin Serebryany, Dmitry Vyukov GNU Tools Cauldron 10 July 2012

Finding races and memory errors with compiler instrumentation.
AddressSanitizer, ThreadSanitizer.
Konstantin Serebryany, Dmitry Vyukov
GNU Tools Cauldron10 July 2012

● AddressSanitizer, a memory error detector● ThreadSanitizer, a data race detector● Status of GCC and LLVM implementations
Agenda

AddressSanitizera memory error detector

● Buffer overflow○ Heap○ Stack○ Globals
● Use-after-free (dangling pointer)● Uninitialized memory reads● Leaks● Double free● Invalid free● Overapping memcpy parameters● ...
Memory Bugs in C++

AddressSanitizer overview
● Compile-time instrumentation module○ Platform independent
● Run-time library ○ Supports Linux, MacOS, Android, Windows
● Released in May 2011● Part of LLVM since November 2011

Shadow byte
● Every aligned 8-byte word of memory has only 9 states● First N bytes are addressable, the rest 8-N bytes are not● Can encode in 1 byte (shadow byte)● Extreme: 128 application bytes map to 1 shadow byte.
Addressable
Unaddressable
Shadow
0
7
6
5
4
3
2
1
-1

Mapping: Shadow = (Addr>>3) + Offset
0xffffffff0x40000000
0x3fffffff0x28000000
0x27ffffff0x24000000
0x23ffffff0x20000000
0x1fffffff0x00000000
Application
Shadow
mprotect-ed
Virtual address space

Mapping: Shadow = (Addr>>3) + 0
0xffffffff0x20000000
0x1fffffff0x04000000
0x03ffffff0x00000000
Application
Shadow
mprotect-ed
Virtual address space
● Requires -fPIE -pie (linux)● Gives ~6% speedup on x86_64

*a = ...
Instrumentation: 8 byte access
char *shadow = (a>>3)+Offset;if (*shadow)
ReportError(a);*a = ...

*a = ...
Instrumentation: N byte access (N=1, 2, 4)
char *shadow = (a>>3)+Offset;if (*shadow && *shadow <= ((a&7)+N-1)) ReportError(a);*a = ...

Instrumentation example (x86_64)
shr $0x3,%rax # shift by 3 mov $0x100000000000,%rcx or %rax,%rcx # add offsetcmpb $0x0,(%rcx) # load shadowje 1f <foo+0x1f>ud2a # generate SIGILL*
movq $0x1234,(%rdi) # original store
* May use call instead of UD2

void foo() { char a[328];
<------------- CODE ------------->
}
Instrumenting stack

void foo() { char rz1[32]; // 32-byte aligned char a[328]; char rz2[24]; char rz3[32]; int *shadow = (&rz1 >> 3) + kOffset; shadow[0] = 0xffffffff; // poison rz1 shadow[11] = 0xffffff00; // poison rz2 shadow[12] = 0xffffffff; // poison rz3 <------------- CODE -------------> shadow[0] = shadow[11] = shadow[12] = 0; }
Instrumenting stack

Instrumenting globals
int a;
struct { int original; char redzone[60];} a; // 32-aligned

Run-time library
● Initializes shadow memory at startup● Provides full malloc replacement
○ Insert poisoned redzones around allocated memory○ Quarantine for free-ed memory○ Collect stack traces for every malloc/free
● Provides interceptors for functions like memset● Prints error messages
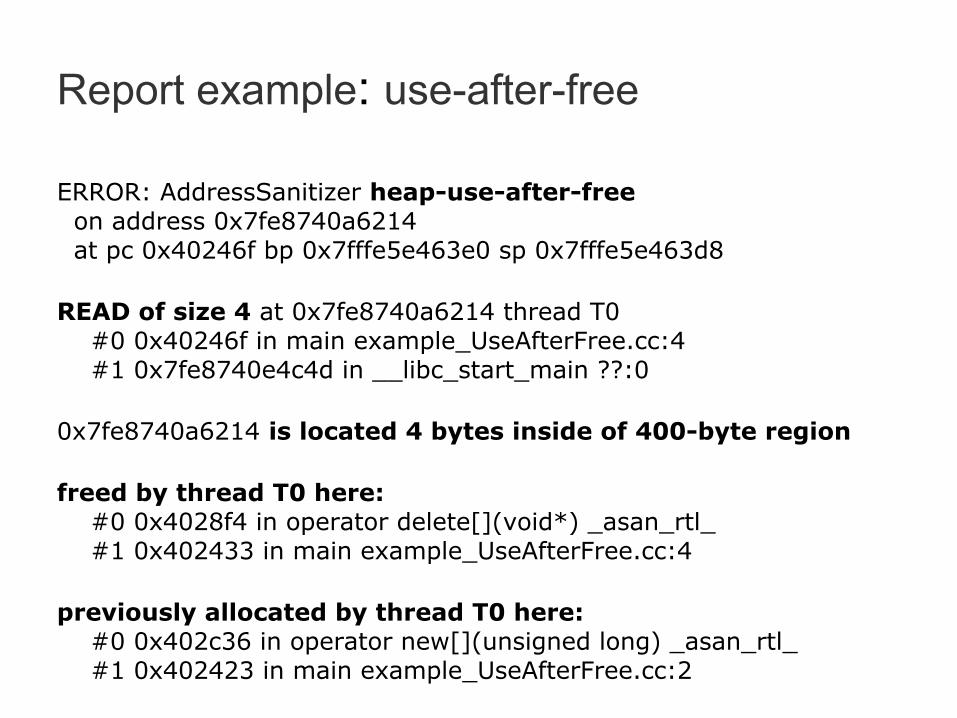
Report example: use-after-free
ERROR: AddressSanitizer heap-use-after-free on address 0x7fe8740a6214 at pc 0x40246f bp 0x7fffe5e463e0 sp 0x7fffe5e463d8
READ of size 4 at 0x7fe8740a6214 thread T0 #0 0x40246f in main example_UseAfterFree.cc:4 #1 0x7fe8740e4c4d in __libc_start_main ??:0
0x7fe8740a6214 is located 4 bytes inside of 400-byte region
freed by thread T0 here: #0 0x4028f4 in operator delete[](void*) _asan_rtl_ #1 0x402433 in main example_UseAfterFree.cc:4
previously allocated by thread T0 here: #0 0x402c36 in operator new[](unsigned long) _asan_rtl_ #1 0x402423 in main example_UseAfterFree.cc:2

Report example: stack-buffer-overflow
ERROR: AddressSanitizer stack-buffer-overflow on address 0x7f5620d981b4 at pc 0x4024e8 bp 0x7fff101cbc90 sp 0x7fff101cbc88
READ of size 4 at 0x7f5620d981b4 thread T0 #0 0x4024e8 in main example_StackOutOfBounds.cc:4 #1 0x7f5621db6c4d in __libc_start_main ??:0 #2 0x402349 in _start ??:0
Address 0x7f5620d981b4 is located at offset 436 in frame <main>of T0's stack: This frame has 1 object(s): [32, 432) 'stack_array'

1.26x slowdown (writes only)1.73x slowdown (reads & writes)
Reads&Writes Only Writes

Real-life performance
● Almost no slowdown for GUI programs○ Chrome, FireFox○ They don't consume all of CPU anyway
● 1.5x - 4x slowdown for server side apps with -O2○ The larger the slower (instruction cache)

Memory overhead● Heap redzones: 16-31 bytes per allocation (minimal)
○ default: 128-255 bytes per allocation● Stack redzones: 32-63 bytes per addr-taken local var● Global redzones: 32-63 bytes per global● Fixed size Quarantine (256M)● Shadow:
○ (Heap + Globals + Stack + Quarantine) / 8● Typical overall memory overhead is 2x - 4x● Stack size increase up to 3x● mmap MAP_NORESERVE 1/8-th of all address space
○ 16T on 64-bit○ 0.5G on 32-bit

Trophies● Chromium (including WebKit); in first 10 months
○ heap-use-after-free: 201○ heap-buffer-overflow: 73○ global-buffer-overflow: 8○ stack-buffer-overflow: 7
● Mozilla● FreeType● FFmepeg● libjpeg-turbo ● Perl● Vim● LLVM● GCC (Bug 52629)● WebRTC● ...

Future work
● Avoid redundant checks (static analysis)● Instrument or recompile libraries● Instrument inline assembler ● Adapt to use in a kernel ● Port to Windows
○ Mostly, frontend work○ Plain C and simple C++ already works○ Help is welcome!

C++ is suddenlya much safer language

Challenge
Implement AddressSanitizer
in Hardware

ThreadSanitizera data race detector

ThreadSanitizer v1
● Based on Valgrind● Used since 2009● Slow (20x-300x slowdown)
○ Still, found thousands races○ Also, faster than others
● Other race detectors for C/C++:○ Helgrind (Valgrind)○ Intel Parallel Inspector (PIN)

ThreadSanitizer v2 overview
● Simple compile-time instrumentation● Redesigned run-time library
○ Fully parallel ○ No expensive atomics/locks on fast path○ Scales to huge apps○ Predictable memory footprint○ Informative reports

Slowdown
Application Tsan1 Tsan2 Tsan1/Tsan2
RPC benchmark 283x 8.5x 33x
Server app test 28x 2x 14x
String util test 30x 2.4x 13x

Compiler instrumentation
void foo(int *p) { *p = 42;}
void foo(int *p) { __tsan_func_entry(__builtin_return_address(0)); __tsan_write4(p); *p = 42; __tsan_func_exit()}

Direct mapping (64-bit Linux)
Application0x7fffffffffff0x7f0000000000
Protected0x7effffffffff0x200000000000
Shadow0x1fffffffffff0x180000000000
Protected0x17ffffffffff0x000000000000
Shadow = N * (Addr & Mask); // Requires -pie

Shadow cellAn 8-byte shadow cell represents one memory access:
○ ~16 bits: TID (thread ID)○ ~42 bits: Epoch (scalar clock)○ 5 bits: position/size in 8-byte word○ 1 bit: IsWrite
Full information (no more dereferences)
TID
Epo
Pos
IsW

N shadow cells per 8 application bytes TID
Epo
Pos
IsW
TID
Epo
Pos
IsW
TID
Epo
Pos
IsW
TID
Epo
Pos
IsW

Example: first accessT1
E1
0:2
W
Write in thread T1

Example: second accessT1
E1
0:2
W
T2
E2
4:8
R
Read in thread T2

Example: third accessT1
E1
0:2
W
T3
E3
0:4
R
T2
E2
4:8
R
Read in thread T3

Example: race?T1
E1
0:2
W
T3
E3
0:4
R
T2
E2
4:8
R
Race if E1 not "happens-before" E3

Fast happens-before
● Constant-time operation○ Get TID and Epoch from the shadow cell○ 1 load from TLS○ 1 compare
● Similar to FastTrack (PLDI'09)

Shadow word eviction
● When all shadow words are filled, one random is replaced

Informative reports● Need to report two stack traces:
○ current (easy)○ previous (hard)
● TSan1: ○ Stores fixed number of frames (default: 10)○ Information is never lost○ Reference-counting and garbage collection

Previous stack traces in TSan2● Per-thread cyclic buffer of events
○ 64 bits per event (type + pc)○ Events: memory access, function entry/exit ○ Information will be lost after some time
● Replay the event buffer on report○ Unlimited number of frames

Function interceptors
● 100+ interceptors ○ malloc, free, ...○ pthread_mutex_lock, ...○ strlen, memcmp, ...○ read, write, ...

Limitations
● Only 64-bit Linux● Heavily relies on TLS
○ Slow TLS on some platforms● Hard to port to 32-bits :(
○ Too small address space○ Expensive atomic 64-bit load/store
● Does not instrument:○ pre-built libraries○ inline assembler

Status of GCC and LLVM implementations

Disclaimer:we are not experienced
GCC hackers

Implementation details
● AddressSanitizer○ Common run-time library + tests: 12 KLOC○ LLVM: 1 KLOC, in trunk, fully functional○ GCC: 400 LOC
■ in google/main branch■ finds only heap bugs, no stack and globals■ some problems (next slide)
● ThreadSanitizer○ Common run-time library + tests: 14 KLOC○ Supports C/C++ and Go○ LLVM: 400 LOC, in trunk, fully functional○ GCC: 400 LOC, separate plugin
■ does not instrument atomic operations

Problems with GCC (AddressSanitizer)
● Compile time: SLOW!○ clang < clang+asan < gcc < gcc+asan (all with -O2)○ 483.xalancbmk (seconds): 170 < 212 < 338 < 446
● Run-time: 10%-15% slower than LLVM (-O2 vs -O2)○ Still, not apples-to-apples
● How to get the address of a memory access? ○ Copied some code from mudflap, ugly
● Has to run before loop optimizations○ Otherwise can’t use build_addr
● Can't deal with bitfield loads● Adding redzones to stack and global objects:
○ GCC: not clear how to implement in IR (GIMPLE)○ LLVM: single IR-only transformation pass

GCC from newcomer's point of view
TREE_THIS_VOLATILE (call) = 1; // GCC
Call->setDoesNotReturn(); // LLVM

GCC from newcomer's point of view (2)
Value *B = IRB.CreateLoad(IRB.CreateIntToPtr(A, Ty));
t = build1 (INDIRECT_REF, shadow_type, build1 (VIEW_CONVERT_EXPR, shadow_ptr_type, t));t = force_gimple_operand (t, &stmts, false, NULL_TREE);gimple_seq_add_seq (&seq, stmts);shadow_value = make_rename_temp (shadow_type,""); g = gimple_build_assign (shadow_value, t);

GCC from newcomer's point of view (3)if (isa<LoadInst>(I) || isa<StoreInst>(I)) ...
base = get_base_address (expr);
if (base == NULL_TREE
|| TREE_CODE (base) == SSA_NAME
|| TREE_CODE (base) == STRING_CST)
return;
tcode = TREE_CODE (expr);
/* Below are things we do not instrument
(no possibility of races or not implemented yet). */
if (/* Compiler-emitted artificial variables. */
(DECL_P (expr) && DECL_ARTIFICIAL (expr))
/* The var does not live in memory -> no possibility of races. */
|| (tcode == VAR_DECL
&& TREE_ADDRESSABLE (expr) == 0
&& TREE_STATIC (expr) == 0)
/* Not implemented. */
|| TREE_CODE (TREE_TYPE (expr)) == RECORD_TYPE
/* Not implemented. */
|| tcode == CONSTRUCTOR
/* Not implemented. */
|| tcode == PARM_DECL
/* Load of a const variable/parameter/field. */
|| is_load_of_const (expr, is_write))
return;
if (tcode == COMPONENT_REF)
{
tree field = TREE_OPERAND (expr, 1);
if (TREE_CODE (field) == FIELD_DECL)
{
fld_off = TREE_INT_CST_LOW (DECL_FIELD_BIT_OFFSET (field));
fld_size = TREE_INT_CST_LOW (DECL_SIZE (field));
if (((fld_off % BITS_PER_UNIT) != 0)
|| ((fld_size % BITS_PER_UNIT) != 0))
{
/* As of now it crashes compilation.
TODO: handle bit-fields as if touching the whole field. */
return;
}
}
}
/* TODO: handle other cases
(FIELD_DECL, MEM_REF, ARRAY_RANGE_REF, TARGET_MEM_REF, ADDR_EXPR). */
if (tcode != ARRAY_REF
&& tcode != VAR_DECL
&& tcode != COMPONENT_REF
&& tcode != INDIRECT_REF
&& tcode != MEM_REF)
return;

Summary● We encourage the GCC community to implement
AddressSanitizer and/or ThreadSanitizer compiler module in gcc trunk
● 90% of work is done (the run-time library, tests)

Q&A
http://code.google.com/p/address-sanitizer/
http://code.google.com/p/thread-sanitizer/

Backup

AddressSanitizer vs Valgrind (Memcheck)
Valgrind AddressSanitizer
Heap out-of-bounds YES YES
Stack out-of-bounds NO YES
Global out-of-bounds NO YES
Use-after-free YES YES
Use-after-return NO Sometimes/YES
Uninitialized reads YES NO
Overhead 10x-300x 1.5x-3x
Platforms Linux, Mac Same as LLVM *

AddressSanitizer vs Mudflap
● Mudflap doesn't work (or is very slow) on any large app
● Otherwise, the functionality is similar


