With D.D. Karopady M. Sreenivasa Rao The Azim Premji Foundation Karthik Muralidharan Department of Economics, UCSD Abhilash Mudaliar Venkatesh Sundararaman South Asia Human Development primary education in India: Lessons from the Andhra Pradesh Randomized Evaluation Studies (AP RESt) HD ESW FAIR 12 January 2011
Transcript
WithD.D. KaropadyM. Sreenivasa RaoThe Azim Premji Foundation
Karthik MuralidharanDepartment of Economics, UCSD
Abhilash MudaliarVenkatesh SundararamanSouth Asia Human Development
Achieving universal quality primary educati on in India:Lessons from the Andhra Pradesh Randomized Evaluation Studies (AP RESt)
HD ESW FAIR12 January 2011
Agenda
Background / motivationDesign of APREStResultsPolicy implications
3
Right to Education (RTE) provides an opportunity to focus on quality
of education
20002001
20022003
20042005
20062007
20082009
70%
75%
80%
85%
90%
95%
100%
Net
pri
mar
y en
rollm
ent
Implementation of SSA
Source: Data for 2000-2007 – World Bank; data for 2009 – Pratham. Definitions may be slightly different. No data for 2008 – extrapolated as mid-point of 2007 and 2009 figures.
SSA launched
RTE launched
SSA has mostly been a success in expanding enrollment
The launching of the RTE when net enrollment is already 96%, presents an opportunity to shift focus from quantity (i.e. just enrollment) to quality (i.e. learning)
4
Higher spending in government schools alone may not be
enough
Source: “Teacher Absence in India”, Journal of the European Economic Association
Motivation and effort-levels of government school teachers in India
are a serious problem
• 92% of 1st Graders cannot read at grade level and 60% of 6-14 year olds cannot read a simple paragraph.
• High levels of teacher absence (25%) ranging from 15% to 42% across states
• 90% of non-capital spending goes to teacher salaries
• Teacher that are paid more – older teachers, more educated teachers and head teachers – are more frequently absent
• Higher absence rates in poorer states (additional spending has highest leakage where it is needed the most)Teach
ers abse
nt on any g
iven day
Teachers
not teach
ing0%
10%
20%
30%
40%
50%
60%
25%
55%
Background / motivationDesign of APREStResultsPolicy implications
Agenda
6
Within two years we had tested 600 schools with five different
interventionsInput only Incentive only
Feedback + Monitoring100 schools
Individual Incentive + Diagnostic Feedback
100 schools
Group Incentive + Diagnostic
Feedback100 schools
Extra Contract Teacher + Diagnostic Feedback
100 schools
Block Grant + Diagnostic Feedback
100 schools
Business as usual100 schools
7
Location of study
• Andhra Pradesh (AP)- 5th most populous state in India
8 Population of 80 million - 23 Districts (2-4 million each)
• Close to All-India averages on many measures of human development
India APGross Enrollment (6-11) (%)
95.9 95.3
Literacy (%) 64.8 60.5
Teacher Absence (%) 25.2 25.3
Infant Mortality (per 1,000)
63 62
Agenda
Background / motivationDesign of APREStResults- Performance pay
Policy implications
9
Performance Pay : Background and Research Questions
1. Can teacher performance-pay improve test scores?2. What, if any, are the negative consequences?3. How do group and individual incentives compare?4. How does teacher behaviour change in response to incentives?5. How does program impact vary by student, school, and teacher traits?6. What is teacher opinion on performance pay?
• Lack of differentiation by performance is a major demotivator for teachers− Teachers with highest job satisfaction were most absent
• Program was designed to recognise and reward good performance
Motivation
Key questions addressed
10
Potential concerns with such a program are addressed pro-actively in the study design
Potential concern How addressed
Teaching to the test
• Test design is such that you cannot do well without deeper knowledge / understanding
• Less of a concern given extremely low levels of learning• Research shows that the process of taking a test can enhance learning
Threshold effects/ Neglecting weak kids
• Minimized by making bonus a function of average improvement of all students, so teachers are not incentivized to focus only on students near some target;
• Drop outs assigned low scores
Cheating / paper leaks• Testing done by independent teams from Azim Premji Foundation,
with no connection to the school
Reduction of intrinsic motivation
• Recognize that framing matters• Program framed in terms of recognition and reward for outstanding
teaching as opposed to accountability
11
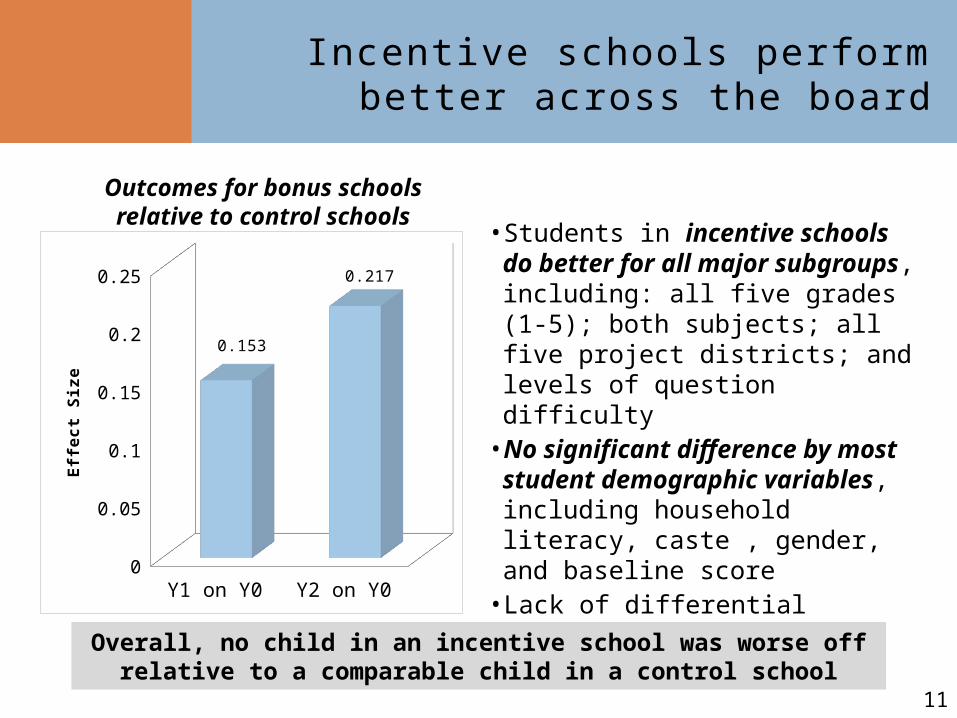
Incentive schools perform better across the board
Outcomes for bonus schools relative to control schools
• Students in incentive schools do better for all major subgroups, including: all five grades (1-5); both subjects; all five project districts; and levels of question difficulty
• No significant difference by most student demographic variables, including household literacy, caste , gender, and baseline score
• Lack of differential treatment effects is an indicator of broad-based gains
Y1 on Y0 Y2 on Y00
0.05
0.1
0.15
0.2
0.25
0.153
0.217
Effec
t Si
ze
Overall, no child in an incentive school was worse off relative to a comparable child in a control school
12
Incentives have broad-based impact
Y1 Y20
0.02
0.04
0.06
0.08
0.1
0.12
0.14
0.16
0.18
0.2
0.14
0.17
0.14
0.18
Mechanical Conceptual
Effec
t Si
ze
Normalized by mechanical / conceptual distribution in control schoolsAll figures statistically significant
True learning: Students in incentive schools perform better on conceptual, not just
mechanical questions
Spillovers: And they also perform better on non-incentive subjects
13
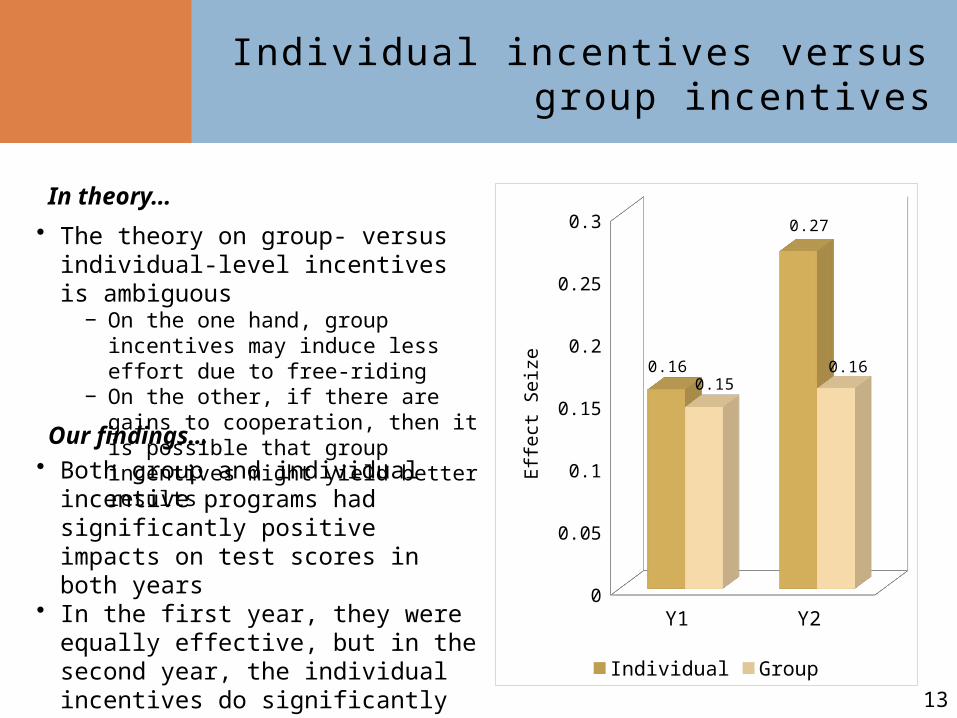
Individual incentives versus group incentives
• The theory on group- versus individual-level incentives is ambiguous
− On the one hand, group incentives may induce less effort due to free-riding
− On the other, if there are gains to cooperation, then it is possible that group incentives might yield better results
• Both group and individual incentive programs had significantly positive impacts on test scores in both years
• In the first year, they were equally effective, but in the second year, the individual incentives do significantly better
• Both were equally cost-effectiveY1 Y2
0
0.05
0.1
0.15
0.2
0.25
0.3
0.16
0.27
0.150.16
Individual Group
Effec
t Sei
ze
In theory…
Our findings…
14
Teacher absence did not change, but effort intensity went up
Teachers in incentive schools did no better under observation…
… But report undertaking various forms of special preparation
Extra homework
Extra classwork
Extra classes Practice tests Focus on weaker children
0%
5%
10%
15%
20%
25%
30%
35%
40%
45%
50%
42%
47%
16%
30%
20%20%23%
5%
14%
7%
Incentive Control
Absence Actively teaching0%
5%
10%
15%
20%
25%
30%
35%
40%
45%
Incentive Control
15
Incentives act as a force-multiplier to magnify the impact
of inputs• Education and training are alone not
impactful, but when combined with incentives are so
- Suggests that qualifications combined with incentives can impact learning outcomes
• Teachers with higher base pay respond less well to incentives
- Suggests that magnitude of incentives matters
• More experienced teachers respond less well to incentives
- Suggests that young teachers respond better new policy initiatives
No characteristic is significant on its own‘Experience’ and ‘salary’ have been normalized* Statistically significant in combination with incentive
Education* Training* Experience* Salary*
-0.1
-0.05
0
0.05
0.1
0.15
Incentives and teacher characteristics
Incentive + Characteristic Characteristic alone
Effec
t Si
ze
16
Teacher opinion on performance pay is overwhelmingly positive
• It is easy to support a program when it only offers rewards and no penalties
• However, teachers also support performance pay under an overall wage-neutral expectation
Increase
d motiva
tion as a re
sult o
f PP
Favo
rable opinion of P
P
Govern
ment should co
nsider i
mplementing PP0%
10%20%30%40%50%60%70%80%90% 75%
85%
67%
Strong teacher support for performance pay
• Significant positive correlation between teacher performance and the extent of performance pay desired beforehand
− Suggests that effective teachers know who they are and there are likely to be sorting benefits from performance pay
Agenda
Background / motivationDesign of APREStResults- Summary
Policy implications
18
Overall, bonuses conditional on performance had a larger impact
than unconditional provision of inputs…
• Pure incentives (individual and group bonuses) are most effective
• The mixed input-incentive program (contract teachers) is next most effective
• Pure inputs (block grants and diagnostic feedback) are least effective
Individual bonuses
Group bonuses
Contract teacher
Block grant Diagnostic feedback
0
0.05
0.1
0.15
0.2
0.25
0.3
0.160.15
0.09 0.09
0.00
0.27
0.160.14
0.05
Combined impact (Maths and Telugu)
Y1 on Y0 Y2 on Y0
Effec
t Si
ze
19
… And were significantly more cost effective
Avg cost for 2 years (INR) Impact (SD)
Cost per 0.1 SD impact
(INR)
Contract teacher 20,000 0.141 14,184
Block grant 20,000 0.049 40,816
Group bonus 12,000 0.161 7,453
Individual bonus 20,000 0.271 7,380
• Overall, the incentive programs are 3× as cost effective as the input programs
• Performance pay was twice as cost effective as an extra contract teacher, and a contract teacher is five times more cost effective than a regular teacher
• Suggests that expanding a performance pay program would be 10 times more cost effective than hiring additional regular teachers
There are three key policy implications from the results so
far
2. Hire new teachers as contract teachers
• RTE is making the financial allocation to reduce PTR from 40:1 to 30:1• Same financial allocation can be used to hire several CTs and reduce PTR even more and
eliminate multi-grade teaching• Can hire new teachers as CTs and regularize into civil-service based on performance
over time
3. Roll out systems for teacher performance measurement and management
• Performance pay is likely to be a highly cost-effective policy for improving learning• The broader point is that of creating a meaningful career ladder for teachers so that
their professional trajectories depend on performance• Teachers are also broadly supportive of instituting a performance pay mechanism
1. Focus on learning levels
• Right to education (RTE) needs to be about quality and not just access• Identify learning gaps early and provide remedial instruction immediately
20
21
Bibliography
• Michael Kremer, Karthik Muralidharan, Nazmul Chaudhury, Jeffrey Hammer, F. Halsey Rogers: “Teacher Absence in India: A Snapshot”
• Karthik Muralidharan and Venkatesh Sundararaman: “The Impact of Diagnostic Feedback to Teachers on Student Learning: Experimental Evidence from India” The Economic Journal, 120 (August), F187–F203
• Jishnu Das, Stefan Dercon, James Habyarimana, Pramila Krishnan, Karthik Muralidharan and Venkatesh Sundararaman: “When Can School Inputs Improve Test Scores?”
• Karthik Muralidharan and Venkatesh Sundararaman: “Contract Teachers: Experimental Evidence from India”
• Karthik Muralidharan and Venkatesh Sundararaman: “Teacher Performance Pay: Experimental Evidence from India”
• Karthik Muralidharan and Venkatesh Sundararaman: “Teacher Opinions on Performance Pay: Evidence from India”


![the yoga upanishads - t. r. sreenivasa ayyangar [english].pdf](https://static.documents.pub/doc/80x56/54510c2db1af9f11098b5096/the-yoga-upanishads-t-r-sreenivasa-ayyangar-englishpdf.jpg)


