63
Experiment Instructions WL 320 Wet Cooling Tower
Experiment Instructions
WL 320 Wet Cooling Tower


i
DTP_1308/2012
All
Rig
hts
Res
erve
dG
.U.N
.T.G
erät
ebau
Gm
bH,B
arsb
ütte
l,G
erm
any
08/2
012
Experiment Instructions
Please read and follow the safety regulations!
Version 1.3 DTP_13
WL 320 WET COOLING TOWER
Revision: December 2007, Dipl.-Ing. Frank JebavyLast modification by: August 2012, Dipl.-Ing. Peter

Table of Contents
1 Introduction . . . . . . . . . . . . . . . . . . . . . . . . . . . . . . . . . . . . . . . . 1
1.1 Aim of the experiments . . . . . . . . . . . . . . . . . . . . . . . . . . . . . . . . . . . 2
1.2 Proper use. . . . . . . . . . . . . . . . . . . . . . . . . . . . . . . . . . . . . . . . . . . . . 2
2 Description of the unit . . . . . . . . . . . . . . . . . . . . . . . . . . . . . . . . 3
2.1 Function. . . . . . . . . . . . . . . . . . . . . . . . . . . . . . . . . . . . . . . . . . . . . . . 3
2.1.1 Water circuit . . . . . . . . . . . . . . . . . . . . . . . . . . . . . . . . . . . . . 3
2.1.2 Air circuit . . . . . . . . . . . . . . . . . . . . . . . . . . . . . . . . . . . . . . . . 4
2.2 Equipment layout. . . . . . . . . . . . . . . . . . . . . . . . . . . . . . . . . . . . . . . . 4
2.3 Measured variables . . . . . . . . . . . . . . . . . . . . . . . . . . . . . . . . . . . . . . 6
2.3.1 Arrangement of sensors . . . . . . . . . . . . . . . . . . . . . . . . . . . . 7
2.4 Description of components . . . . . . . . . . . . . . . . . . . . . . . . . . . . . . . . 8
2.4.1 Cooling column. . . . . . . . . . . . . . . . . . . . . . . . . . . . . . . . . . . 8
2.4.2 Flow meter . . . . . . . . . . . . . . . . . . . . . . . . . . . . . . . . . . . . . . 8
2.4.3 Combined temperature/humidity sensor . . . . . . . . . . . . . . . 9
2.4.4 Pump . . . . . . . . . . . . . . . . . . . . . . . . . . . . . . . . . . . . . . . . . . 9
2.4.5 Spray nozzle . . . . . . . . . . . . . . . . . . . . . . . . . . . . . . . . . . . . 10
2.4.6 Moisture eliminator . . . . . . . . . . . . . . . . . . . . . . . . . . . . . . . 10
2.4.7 Heater. . . . . . . . . . . . . . . . . . . . . . . . . . . . . . . . . . . . . . . . . 10
2.4.8 Fan . . . . . . . . . . . . . . . . . . . . . . . . . . . . . . . . . . . . . . . . . . . 11
2.5 Care/Maintenance . . . . . . . . . . . . . . . . . . . . . . . . . . . . . . . . . . . . . . 12
2.6 Commissioning . . . . . . . . . . . . . . . . . . . . . . . . . . . . . . . . . . . . . . . . 13
2.6.1 Filling / draining the water tanks . . . . . . . . . . . . . . . . . . . . . 14
2.6.2 Assembling a cooling column . . . . . . . . . . . . . . . . . . . . . . . 15
2.6.3 Connecting the sensors . . . . . . . . . . . . . . . . . . . . . . . . . . . 15
2.6.4 Pressure loss measurement . . . . . . . . . . . . . . . . . . . . . . . . 16
2.6.5 Regulating the volumetric water flow . . . . . . . . . . . . . . . . . 16
ii
WL 320 WET COOLING TOWER
08/2012

2.7 PC data acquisition . . . . . . . . . . . . . . . . . . . . . . . . . . . . . . . . . . . . . 17
2.7.1 Software installation . . . . . . . . . . . . . . . . . . . . . . . . . . . . . . 17
2.7.2 Description and operation of the WL 320 software . . . . . . 18
3 Safety . . . . . . . . . . . . . . . . . . . . . . . . . . . . . . . . . . . . . . . . . . . 21
3.1 Risk of death or injury . . . . . . . . . . . . . . . . . . . . . . . . . . . . . . . . . . . 21
3.2 Hazards to the unit and its function . . . . . . . . . . . . . . . . . . . . . . . . . 22
4 Theory . . . . . . . . . . . . . . . . . . . . . . . . . . . . . . . . . . . . . . . . . . . 23
4.1 General . . . . . . . . . . . . . . . . . . . . . . . . . . . . . . . . . . . . . . . . . . . . . . 23
4.2 Changes of state of humid air . . . . . . . . . . . . . . . . . . . . . . . . . . . . . 24
4.2.1 h,x graph. . . . . . . . . . . . . . . . . . . . . . . . . . . . . . . . . . . . . . . 25
4.3 Characteristic variables . . . . . . . . . . . . . . . . . . . . . . . . . . . . . . . . . . 28
4.3.1 Nominal flow rate . . . . . . . . . . . . . . . . . . . . . . . . . . . . . . . . 28
4.3.2 Cooling range . . . . . . . . . . . . . . . . . . . . . . . . . . . . . . . . . . . 28
4.3.3 Cooling limit . . . . . . . . . . . . . . . . . . . . . . . . . . . . . . . . . . . . 29
4.3.4 Wet bulb approach . . . . . . . . . . . . . . . . . . . . . . . . . . . . . . . 30
4.3.5 Cooling coefficient . . . . . . . . . . . . . . . . . . . . . . . . . . . . . . . 31
4.3.6 Water loss. . . . . . . . . . . . . . . . . . . . . . . . . . . . . . . . . . . . . . 31
4.3.7 Heat load . . . . . . . . . . . . . . . . . . . . . . . . . . . . . . . . . . . . . . 31
4.3.8 Specific rain flow density . . . . . . . . . . . . . . . . . . . . . . . . . . 32
4.3.9 Packing density. . . . . . . . . . . . . . . . . . . . . . . . . . . . . . . . . . 32
iii
WL 320 WET COOLING TOWER
08/2012A
llR
ight
sR
eser
ved
G.U
.N.T
.Ger
äteb
auG
mbH
,Bar
sbüt
tel,
Ger
man
y08
/201
2

5 Experiments . . . . . . . . . . . . . . . . . . . . . . . . . . . . . . . . . . . . . . 33
5.1 Introduction . . . . . . . . . . . . . . . . . . . . . . . . . . . . . . . . . . . . . . . . . . . 33
5.2 Performing the experiment . . . . . . . . . . . . . . . . . . . . . . . . . . . . . . . 34
5.3 Evaluation of the experiment . . . . . . . . . . . . . . . . . . . . . . . . . . . . . . 34
5.3.1 Recording the cooling process in the h,x graph . . . . . . . . . 35
5.3.2 Calculating the volumetric air flow . . . . . . . . . . . . . . . . . . . 37
5.3.3 Calculating the cooling capacity . . . . . . . . . . . . . . . . . . . . . 41
5.3.4 Calculating the heat load . . . . . . . . . . . . . . . . . . . . . . . . . . 42
5.3.5 Calculating the wet bulb approach . . . . . . . . . . . . . . . . . . . 44
5.3.6 Calculating the cooling coefficient. . . . . . . . . . . . . . . . . . . . 44
5.3.7 Calculating the water loss. . . . . . . . . . . . . . . . . . . . . . . . . . 44
5.4 Calculating the characteristic variables with different cooling columns. 45
5.4.1 Performing the experiment . . . . . . . . . . . . . . . . . . . . . . . . . 45
5.4.2 Evaluation of the experiment . . . . . . . . . . . . . . . . . . . . . . . 46
5.4.3 Relationship between wet bulb approach and packing density . 48
6 Appendix . . . . . . . . . . . . . . . . . . . . . . . . . . . . . . . . . . . . . . . . . 49
6.1 Technical data . . . . . . . . . . . . . . . . . . . . . . . . . . . . . . . . . . . . . . . . . 49
6.2 h,x graph for humid air . . . . . . . . . . . . . . . . . . . . . . . . . . . . . . . . . . 52
6.3 Worksheets for recording measured values . . . . . . . . . . . . . . . . . . 53
6.4 Symbols and units . . . . . . . . . . . . . . . . . . . . . . . . . . . . . . . . . . . . . . 55
6.5 Latent heat of evaporation. . . . . . . . . . . . . . . . . . . . . . . . . . . . . . . . 57
6.6 Items supplied . . . . . . . . . . . . . . . . . . . . . . . . . . . . . . . . . . . . . . . . . 57
iv
WL 320 WET COOLING TOWER
08/2012

1 Introduction
Industrial cooling towers are used to remove sur-plus heat from water. Cooling towers with openand closed water circuits are available. Both typesfunction as heat exchangers based on the counterflow principle.
In the WL 320 open Wet Cooling Tower, water issprayed into the tower from above and distributedas widely as possible using baffles. Ambient air isblown into the cooling tower in the opposite direc-tion. This causes the water to give up its latent heatof evaporation and the air is humidified. The evap-orated water must be replaced.
The WL 320 Wet Cooling Tower is intended todemonstrate the qualitative and quantitative func-tioning and characteristic variables of a coolingtower.
All of the required measured values are acquiredby sensors and shown on digital displays. A PC isused to evaluate the results of the experiments.
1 Introduction 1
WL 320 WET COOLING TOWER
08/2012A
llR
ight
sR
eser
ved
G.U
.N.T
.Ger
äteb
auG
mbH
,Bar
sbüt
tel,
Ger
man
y08
/201
2
1.1 Aim of the experiments
The aim is to investigate and understand the influ-ence of the
– Volumetric air flow
– Cooling water temperature
– Volumetric water flow
– Packing density
on the performance parameters of the coolingtower. For this purpose the changes of state of thehumid air are shown in an h,x graph.
1.2 Proper use
The WL 320 is an experimental unit for use in edu-cation and training and is specially designed forpractical experiments for small groups of studentsworking independently. The robust overall con-struction and the ease of operation make it ideal forthis purpose.
2 1 Introduction
WL 320 WET COOLING TOWER
08/2012

2 Description of the unit
2.1 Function
2.1.1 Water circuit
The water to be cooled is drawn from a heated wa-ter tank by a Diaphragm pump and pumpedaround the circuit. The water flows regularlythrough a water filter, which is installed in the direc-tion of flow and filters particles out of the water.
The water filter is installed upstream of the flowmeter, thus preventing clogging of the nozzlewithin the flow meter and also the nozzle at thehead of the column.
Once the water temperature has been measuredand the water evenly sprayed over the first stage ofthe cooling column using a spray nozzle, it flowsover the surfaces in the lower section of the col-umn. At the outlet from the column the water tem-perature is measured and the water is finally fedback into the water tank.
During this process a fan creates an air flow in theopposite direction to the water flow. This brings thefluids into contact with each other. The large sur-face area of the cooling column extends the resi-dence time for the water and air, thus supportingthe transfer of heat by exchange of material.
The quantity of water taken up by the air must becompensated by topping up from the supply tank.
2 Description of the unit 3
WL 320 WET COOLING TOWER
08/2012A
llR
ight
sR
eser
ved
G.U
.N.T
.Ger
äteb
auG
mbH
,Bar
sbüt
tel,
Ger
man
y08
/201
2

2.1.2 Air circuit
The ambient air is drawn in by a fan and fedthrough an air chamber into the cooling column.Here the temperature and relative humidity of theair are measured. The turbulence of the air insidethe air chamber creates an even distribution of airover the entire cross-section of the cooling col-umn. The volumetric air flow can be varied using abutterfly valve at the fan outlet.
As the air flows through the cooling column, the hu-midity content of the air increases and the temper-ature of the water decreases.
Droplets of water carried along with the air flow areseparated out by a moisture eliminator located be-fore the outlet aperture in the upper section of thecolumn, and fed back into the cooling column. Thisreduces the water loss.
Sensors at the air outlet from the column measurethe humidity and temperature.
2.2 Equipment layout
The system overview below shows the arrange-ment of the individual components.
4 2 Description of the unit
WL 320 WET COOLING TOWER
08/2012
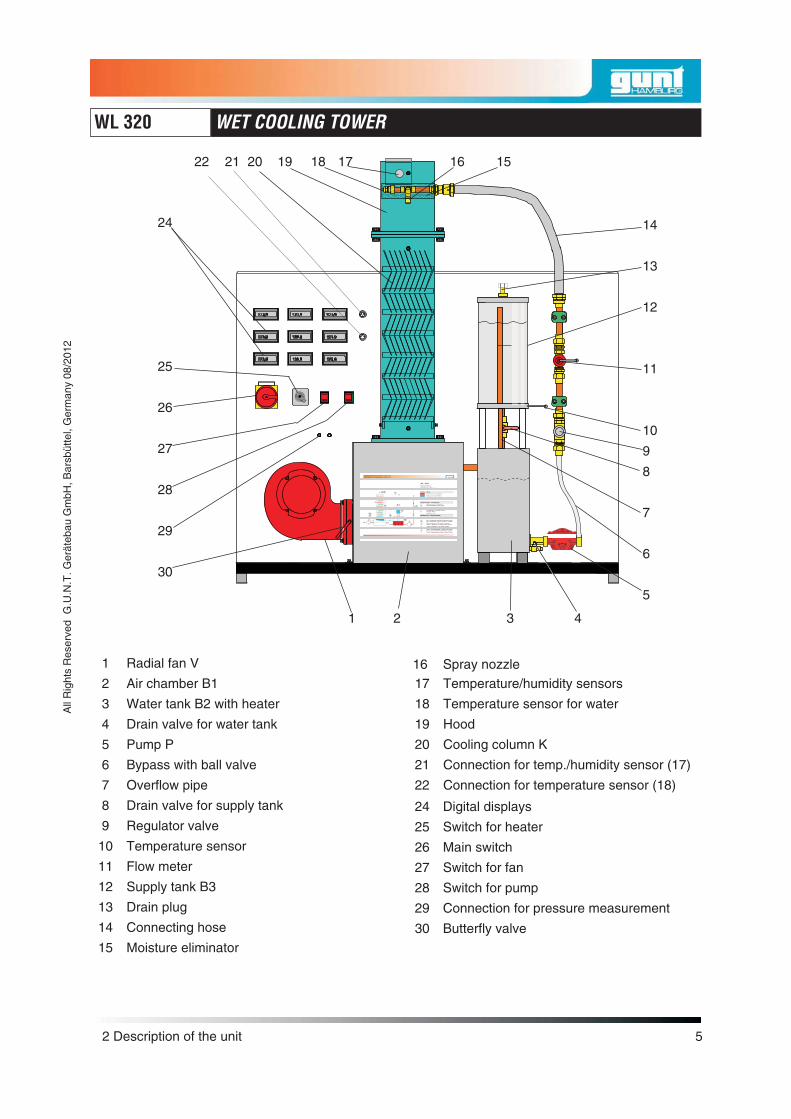
1 Radial fan V 16 Spray nozzle2 Air chamber B1 17 Temperature/humidity sensors
3 Water tank B2 with heater 18 Temperature sensor for water
4 Drain valve for water tank 19 Hood
5 Pump P 20 Cooling column K
6 Bypass with ball valve 21 Connection for temp./humidity sensor (17)
7 Overflow pipe 22 Connection for temperature sensor (18)
8 Drain valve for supply tank 24 Digital displays9 Regulator valve 25 Switch for heater
10 Temperature sensor 26 Main switch11 Flow meter 27 Switch for fan12 Supply tank B3 28 Switch for pump13 Drain plug 29 Connection for pressure measurement14 Connecting hose 30 Butterfly valve15 Moisture eliminator
2 Description of the unit 5
WL 320 WET COOLING TOWER
08/2012A
llR
ight
sR
eser
ved
G.U
.N.T
.Ger
äteb
auG
mbH
,Bar
sbüt
tel,
Ger
man
y08
/201
2
1 2 3 4
14
13
12
11
10
9
8
7
6
5
22 21 20 19 18 17 16 15
24
25
26
27
28
29
30

2.3 Measured variables
The following variables are measured on the ex-perimental unit and displayed digitally:
• Temperature at air inlet [°C]
• Relative humidity at air inlet [%]
• Temperature at air outlet [°C]
• Relative humidity at air outlet [%]
• Temperature at water inlet [°C]
• Temperature at water outlet [°C]
• Differential pressure between cooling col-umn inlet and outlet and across diaphragm atair outlet [Pa]
• Volumetric water flow [l/h]
The experimental unit has PC-based data acquisi-tion program to calculate the following variables:
• Air mass flow rate [kg/s]
• Cooling capacity of air [W]
• Cooling range [K]
• Heating capacity of water [W]
• Wet bulb approach [K]
• Cooling coefficient
• Water loss [kg/h]
• Volumetric air flow [m³/h]
• Differential pressure [Pa]
For experimental purposes the water inlet temper-atures, the volumetric water flows, the cooling col-umns and the volumetric air flows can be varied.
6 2 Description of the unit
WL 320 WET COOLING TOWER
08/2012
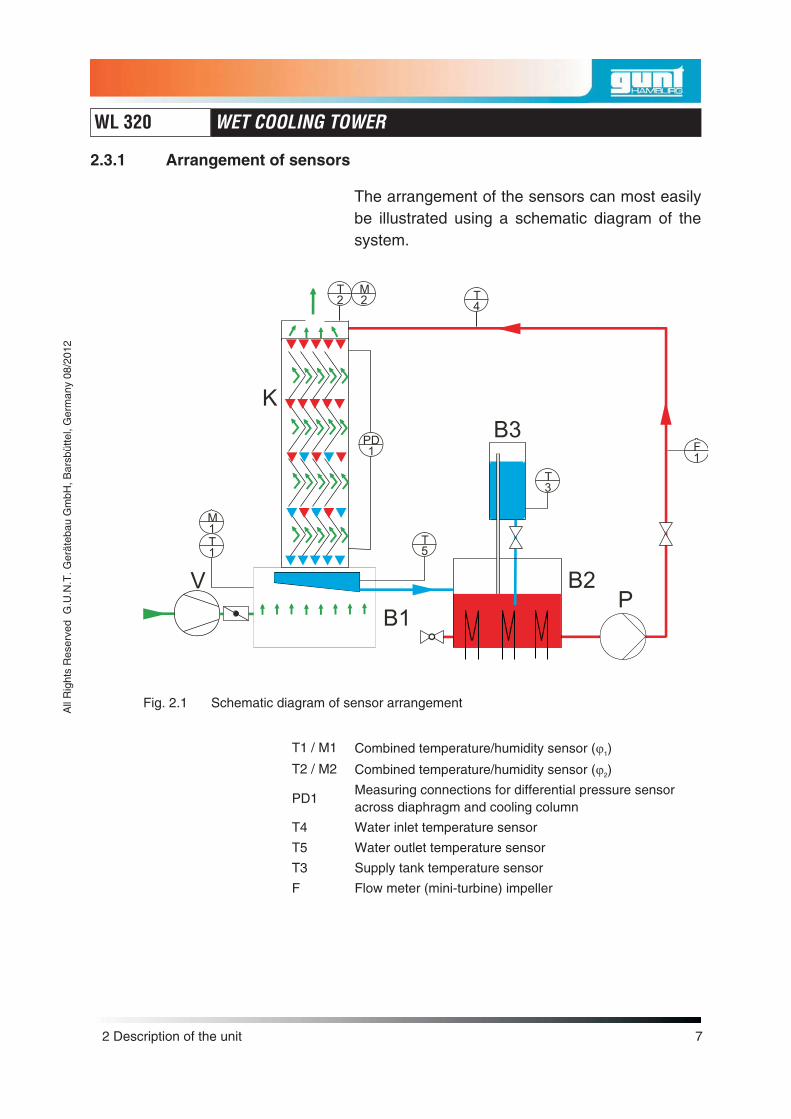
2.3.1 Arrangement of sensors
The arrangement of the sensors can most easilybe illustrated using a schematic diagram of thesystem.
T1 / M1 Combined temperature/humidity sensor (�1)
T2 / M2 Combined temperature/humidity sensor (�2)
PD1Measuring connections for differential pressure sensoracross diaphragm and cooling column
T4 Water inlet temperature sensor
T5 Water outlet temperature sensor
T3 Supply tank temperature sensor
F Flow meter (mini-turbine) impeller
2 Description of the unit 7
WL 320 WET COOLING TOWER
08/2012A
llR
ight
sR
eser
ved
G.U
.N.T
.Ger
äteb
auG
mbH
,Bar
sbüt
tel,
Ger
man
y08
/201
2
Fig. 2.1 Schematic diagram of sensor arrangement

2.4 Description of components
2.4.1 Cooling column
The cooling column is mounted on the air cham-ber. It is transparent, allowing the movement of thewater inside to be observed. The individual stagesin the cooling column are arranged at angles toeach other, to give the maximum possible resi-dence time for the water.
The packing density of a cooling tower is the ratiobetween the total surface area of all the stages andthe volume of the channel. The packing density ofthe cooling column supplied with the experimentalunit (type 1) is 110 m²/m³.
The pressure loss across the column can be mea-sured using a differential pressure sensor.
2.4.2 Flow meter
The flow is measured by passing the mediumthrough the flow housing, thus causing an impellerto rate. This rotary motion is detected by anon-contact opto-electronic sensor and convertedinto a frequency signal. The frequency is propor-tional to the flow velocity.
8 2 Description of the unit
WL 320 WET COOLING TOWER
08/2012

2.4.3 Combined temperature/humidity sensor
The relative humidity is detected using capacitivehumidity measuring elements in the upper andlower sections of the column (see Fig 2.1). Theelectrical capacitance changes as the relative hu-midity of the ambient air changes. The down-stream electronics convert this change in capaci-tance into a standardised signal of 0....10 V DC.
The temperature is detected using a thin film mea-suring element whose electrical resistancechanges with the temperature of its surroundings.This change is also converted into a standardisedsignal of 0....10 V DC.
The sensor in the upper section of the column ispositioned centrally below the air outlet. The sen-sor is secured with a screw (1).
The protective tube (2) is secured to the sensorhousing with six screws around the sensor. Thisprotects it against direct contact with droplets,without preventing the air to be measured fromflowing over it.
2.4.4 Pump
The water to be cooled is pumped around the cir-cuit by a diaphragm pump. The maximum flow rateis determined by the pressure losses in the pipesystem (regulator valve, flow meter and nozzle).The flow can be adjusted using a regulator valve.
2 Description of the unit 9
WL 320 WET COOLING TOWER
08/2012A
llR
ight
sR
eser
ved
G.U
.N.T
.Ger
äteb
auG
mbH
,Bar
sbüt
tel,
Ger
man
y08
/201
2
1 2
Fig. 2.2 Temperature /Humidity sensor

2.4.5 Spray nozzle
The spray nozzle is installed at the water inlet intothe cooling tower. It generates a full cone spraypattern with a square impact area. This ensuresthat a fine spray of water is evenly applied to theentire cross-section of the cooling column.
2.4.6 Moisture eliminator
The moisture eliminator at the cooling tower airoutlet consists of a kind of filter wool, which pre-vents water droplets carried along with the air flowfrom escaping at the top of the tower. The dropletsare trapped in the fibres and fall back. This mini-mises the water loss.
2.4.7 Heater
The cooling load is generated by an electricalheater, which is installed in the water tank. Theheater can be adjusted to 3 levels. These levelsyield the following heating capacities:
Level 1: 0.5 kW
Level 2: 1.0 kW
Level 3: 1.5 kW
The following times are required to heat the waterin the water tank (capacity 6 l) from 20°C to 40°C:
Level 1: Approx. 17 minutes
Level 2: Approx. 8 minutes
Level 3: Approx. 6 minutes
The temperature is regulated using a thermostat. Ifthe temperature exceeds 50°C the heater is turnedoff.
10 2 Description of the unit
WL 320 WET COOLING TOWER
08/2012

2.4.8 Fan
A radial fan is used to generate the air flow. It isflange mounted directly on the air chamber. The airchamber is designed in such a way that the airpasses uniformly through the entire cross-sectionof the column. The volumetric air flow can be regu-lated using a butterfly valve between the radial fanand the air chamber.
2 Description of the unit 11
WL 320 WET COOLING TOWER
08/2012A
llR
ight
sR
eser
ved
G.U
.N.T
.Ger
äteb
auG
mbH
,Bar
sbüt
tel,
Ger
man
y08
/201
2

2.5 Care/Maintenance
The cooling tower is low maintenance and requiresonly minimal care. The cooling tower can be oper-ated either with demineralised water or with nor-mal tap water. To prevent the formation of algaeand sludge when operating with tap water, the sys-tem should be fully drained at regular intervals,and refilled with fresh water.
If the unit will not be used for several days, it shouldbe drained.
12 2 Description of the unit
WL 320 WET COOLING TOWER
08/2012
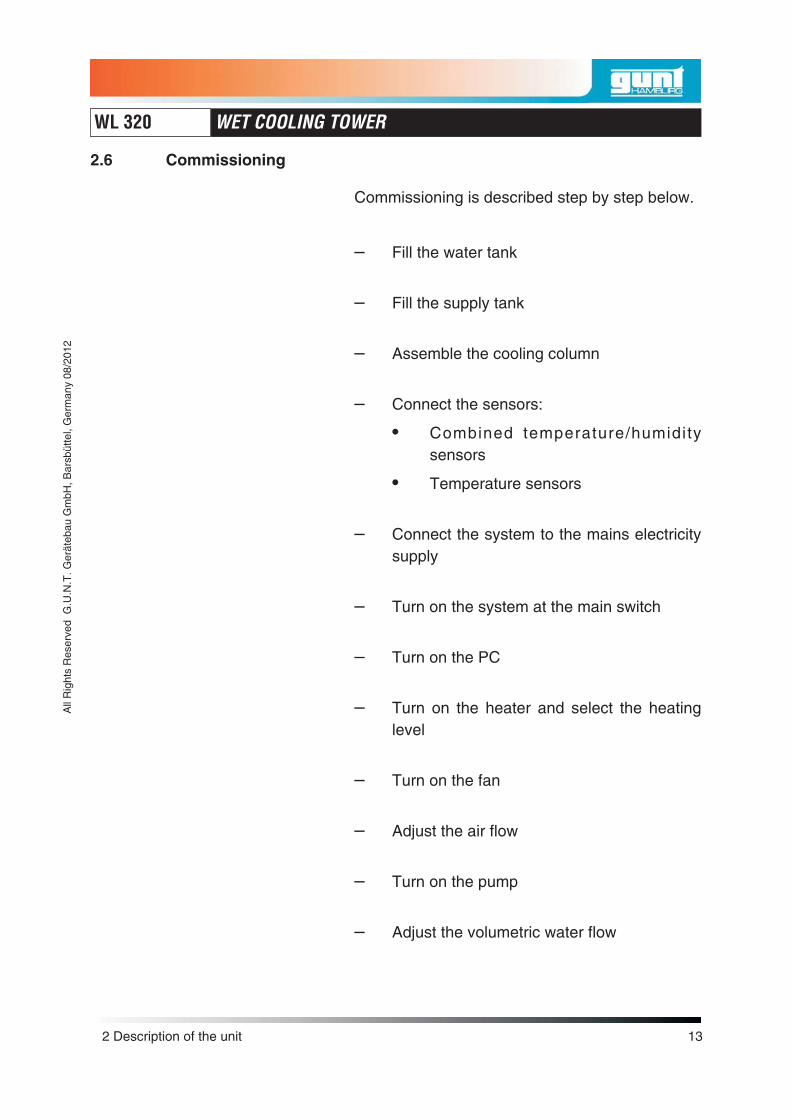
2.6 Commissioning
Commissioning is described step by step below.
– Fill the water tank
– Fill the supply tank
– Assemble the cooling column
– Connect the sensors:
• Combined temperature/humiditysensors
• Temperature sensors
– Connect the system to the mains electricitysupply
– Turn on the system at the main switch
– Turn on the PC
– Turn on the heater and select the heatinglevel
– Turn on the fan
– Adjust the air flow
– Turn on the pump
– Adjust the volumetric water flow
2 Description of the unit 13
WL 320 WET COOLING TOWER
08/2012A
llR
ight
sR
eser
ved
G.U
.N.T
.Ger
äteb
auG
mbH
,Bar
sbüt
tel,
Ger
man
y08
/201
2

2.6.1 Filling / draining the water tanks
Filling:
• Fill the water tank with approx. 6 l water.
• Fill the supply tank with approx. 3 l water.
– Close the drain valve (8) between thewater tank and the supply tank.
– Open the drain plug (13), fill the supplytank with water and then close it again.
– Before performing experiments, openthe drain valve (8) again.
Draining:
– Connect a plastic hose to the drainvalve (4) and place the other end in abucket.
– Open the drain valves (4) and (8) anddrain the water into the bucket.
– Clean the drained water tank withsponge.
– Close the drain valves again.
14 2 Description of the unit
WL 320 WET COOLING TOWER
08/2012
13
8
4

2.6.2 Assembling a cooling column
The procedure for installing the cooling column isas follows:
– Place the cooling column (2) on the air cham-ber (1) and secure with screws.
– Place the hood (19) on the cooling column(20) and secure with screws.
– Fit the connecting hose between the hoodand the water supply pipe and secure itagainst slipping with clamps.
2.6.3 Connecting the sensors
– Plug the temperature sensor (18) connectorinto the socket (3-pin) on the front panel.
– Plug the combined temperature/humiditysensor (17) connector into the socket (5-pin)on the front panel.
2 Description of the unit 15
WL 320 WET COOLING TOWER
08/2012A
llR
ight
sR
eser
ved
G.U
.N.T
.Ger
äteb
auG
mbH
,Bar
sbüt
tel,
Ger
man
y08
/201
2 20
19
2
18
17

2.6.4 Pressure loss measurement
The pressure can be measured at three pressuretapping ports (1, 2, 3). The differential pressureacross the diaphragm at the air outlet is measuredas a basis for calculating the volumetric air flow. Todo this, connect the positive connection of thepressure sensor (+) to the pressure tapping port(1) on the hood. The negative connection of thepressure sensor (-) remains unconnected, i.e. itmeasures the ambient pressure. The pressureloss across the column can be measured at thepressure tapping ports 2 and 3. In each case, con-nect the hose with the higher pressure to the posi-tive connection (+) and the hose with the lowerpressure to the connection (29) marked minus (-).
2.6.5 Regulating the volumetric water flow
The water flow provided by the pump should bemonitored continuously and adjusted as neces-sary. For this purpose, the setting is made using aregulator valve (9).
16 2 Description of the unit
WL 320 WET COOLING TOWER
08/2012
1
2
3+ -
29
9

2.7 PC data acquisition
Connection to a PC is via a USB cable, which isplugged into a sleeve on the right of the unit. Theother end is connected to the PC. When commis-sioning the system with PC support, the followingactions must be carried out:
1. Turn on the system at the main switch.
2. Turn on the PC.
3. Start the software.
If the system is being operated without a PC, thecabling to the PC must be disconnected, to pre-vent possible external signals at the sensors.
2.7.1 Software installation
The following is needed for the installation:
– A fully operationalPCwithUSBport (for mini-mum requirements see Chapter 6).
– G.U.N.T.-CD-ROMAll components necessary to install and runthe program are contained on the CD-ROMdelivered by G.U.N.T.
Note:
The trainer must not be connected to the PC's USBport during the installation of the program. Only af-ter the software has been installed can the trainerbe connected.
2 Description of the unit 17
WL 320 WET COOLING TOWER
08/2012A
llR
ight
sR
eser
ved
G.U
.N.T
.Ger
äteb
auG
mbH
,Bar
sbüt
tel,
Ger
man
y08
/201
2

– Boot the PC.
– Load the G.U.N.T. CD-ROM.
– From the "Installer" folder, launch the"Setup.exe" installation program.
– Follow the installation procedure onscreen.
– After starting, the installation runs automati-cally.
During the course of the installation, various pro-gram components are loaded onto the PC:
– Program for PC-data acquisition.
– Driver routines for the “LabJack®” USBconverter.
Reboot the PC after installation is finished.
2.7.2 Description and operation of the WL 320 software
– Select and start the program by choosing:Start / All Programs / G.U.N.T. / WL 320.
– When the softwar is run for the first time afterinstallation, the language to be used for theprogram is requested.
The language selected can subsequently bechanged at any time on the "Language" menu.
– Various pull-down menus are provided foradditional functions.
Stored measurement data can be imported into aspreadsheet program (e.g. Microsoft Excel) forfurther processing.
The menu item Start takes you to all sections ofthe program:
18 2 Description of the unit
WL 320 WET COOLING TOWER
08/2012

– Charts
– h-x - graph
– System diagram
– Calculation diagramm
– Exit
The “Language” menu appears in all windows.Four languages are available.
For detailed instructions on use of the program re-fer to its Help function. This Help function is ac-cessed by opening the pull-down menu „?” andchoosing „Help”.
• Exit
Quits the Program
2 Description of the unit 19
WL 320 WET COOLING TOWER
08/2012A
llR
ight
sR
eser
ved
G.U
.N.T
.Ger
äteb
auG
mbH
,Bar
sbüt
tel,
Ger
man
y08
/201
2


3 Safety
The experimental instructions, in particular thesafety instructions, should be read carefully priorto commissioning.
Prior to commissioning the system, the partici-pants in the experiment should be briefed on thecorrect use of the system.
In order to ensure hazard-free operation, the fol-lowing must be observed:
3.1 Risk of death or injury
Danger of electric shock!Caution when working on the electrical com-ponents of the system!There is a risk of electric shock. Disconnect the ex-perimentation equipment from the mains beforeworking on it.Have work performed only by suitably qualifiedpersonnel.
DANGER!Never operate the unit without a correctly in-stalled earth wire.Non-compliance with this requirement means thatthe operator and the unit are no longer adequatelyprotected.
Have the earth wire by suitably qualified person-nel.
3 Safety 21
WL 320 WET COOLING TOWER
08/2012
All
Rig
hts
Res
erve
dG
.U.N
.T.G
erät
ebau
Gm
bH,B
arsb
ütte
l,G
erm
any
08/2
012

3.2 Hazards to the unit and its function
DANGER!Never operate heater when dry
If this is disregarded there is a risk of damage byoverheating.
DANGER!Never switch on the pump when dry
If this is disregarded there is a risk of damage tothe pump by lack of cooling.
CAUTION!
Always store the system in a dry and frost-freeplace.
CAUTION!
When cleaning, use only plastic cleaners andwater (no solvents).
If this is disregarded there is a risk of damage tothe plastic parts by aggressive solvents.
NOTE!If demineralised water is used, no limescale will befound.
CAUTION!The humidity sensors at the air outlet are pro-tected by a protective tube against water con-densation on the measurement cell.
If this is disregarded the unit will display incorrectmeasured values.
If this happens, allow the measurement cell to dryin air.
22 3 Safety
WL 320 WET COOLING TOWER
08/2012

4 Theory
4.1 General
In a cooling tower with open water circulation, heatis removed from the water because of the materialand heat exchange between the water and the am-bient air. The more intensive this air/water contact,the more effective the heat exchange. The coolingtower constitutes a special form of heat exchangerbecause in addition to the heat exchange, a mate-rial exchange also occurs as a result ofevaporation.
When a liquid evaporates into the gas phase of an-other material because its vapour pressure in thatgas phase is less than the saturation vapour pres-sure, this is called evaporation. This cools the liq-uid by removing the latent heat of evaporation fromit. The capacity of air to take up water is a measureof its cooling effect. At a relative humidity of 100%the air has reached its maximum capacity to takeup water vapour; no further cooling by evaporationcan occur.
Convective heat transfer makes a further contribu-tion to cooling. This is a pure heat transfer withoutany kind of material exchange. The driving force inthis case is the temperature drop between waterand air.
4 Theory 23
WL 320 WET COOLING TOWER
08/2012
All
Rig
hts
Res
erve
dG
.U.N
.T.G
erät
ebau
Gm
bH,B
arsb
ütte
l,G
erm
any
08/2
012

4.2 Changes of state of humid air
In simplified terms, air without water vapour, i.e.dry air L, can be regarded as an ideal gas in thepressure and temperature ranges encountered inventilation and air conditioning.
As a result of its low partial pressure, the watervapour D can also be regarded as an ideal gas.The mixture of dry air and water vapour is de-scribed as humid air.
The total pressure of the air p is composed of thesum of the partial pressure of the dry air pL and thepartial pressure of the water vapour pD .
p p pL D� � (4.1)
Like the total pressure, the total mass of the air m iscomposed of the sum of the partial mass of the dryair mL and the partial mass of the water vapour mD .
m m mL D� � (4.2)
The states and changes of state of humid air canbe depicted in an h,x graph.
24 4 Theory
WL 320 WET COOLING TOWER
08/2012
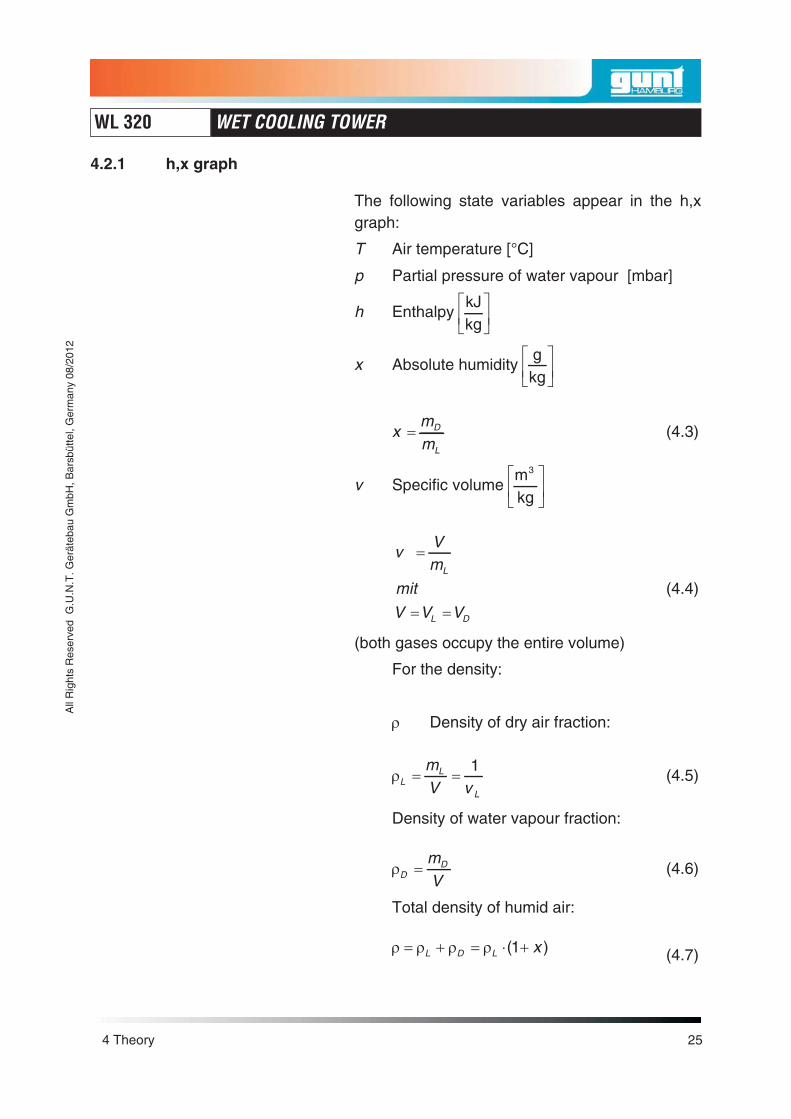
4.2.1 h,x graph
The following state variables appear in the h,xgraph:
T Air temperature [°C]
p Partial pressure of water vapour [mbar]
h EnthalpykJkg�
��
�
x Absolute humiditygkg�
��
�
xmm
D
L
� (4.3)
v Specific volumemkg
3�
��
�
vVm
mit
V V V
L
L D
�
� �
(4.4)
(both gases occupy the entire volume)
For the density:
� Density of dry air fraction:
�LL
L
mV v
� �1
(4.5)
Density of water vapour fraction:
�DDm
V� (4.6)
Total density of humid air:
� � � �� � � � �L D L x( )1 (4.7)
4 Theory 25
WL 320 WET COOLING TOWER
08/2012
All
Rig
hts
Res
erve
dG
.U.N
.T.G
erät
ebau
Gm
bH,B
arsb
ütte
l,G
erm
any
08/2
012

The absolute water content has only a slight influ-ence on the total density of the humid air as x isgenerally less than 20 g/kg.
Nevertheless it is important to note that the densityof the humid air at constant pressure and tempera-ture reduces as the absolute water content in-creases (x increases, �L decreases), i.e. the morehumid the air, the lighter it is.
The reason for this is that the mass of a water mol-ecule is less than the mass of the nitrogen or oxy-gen molecule that it displaces.
The ratio of the partial pressure of the watervapour in the air pD to the saturation pressure ofthe water vapour at air temperature T is the rela-tive humidity � in [%]
� �p
p TD
DS ( )(4.8)
p TDS ( ) � Saturation pressure of water vapour atair temperature T
The quantity of water molecules that the air cantake up in invisible form is strongly dependent onthe temperature. The higher the temperature thegreater the take-up. As the temperature increases,the boiling pressure (saturation pressure) of thewater increases, and with it the ability of the air totake up water.
p p TD DS ( ).
We refer to unsaturated humid air � 100%.
Saturated humid air�=100% means that the par-
tial pressure of the water vapour in the air equalsthe saturation pressure or the boiling pressure ofthe water, so that:
p p TD DS� ( ).
26 4 Theory
WL 320 WET COOLING TOWER
08/2012

If the air contains more water molecules than cor-respond to the saturation pressure, water mole-cules will condense at temperatures above 0°C.We refer to supersaturated humid air; in the h,xgraph this is the area below the saturation line inthe mist area.
4 Theory 27
WL 320 WET COOLING TOWER
08/2012
All
Rig
hts
Res
erve
dG
.U.N
.T.G
erät
ebau
Gm
bH,B
arsb
ütte
l,G
erm
any
08/2
012
0t = 0°C
mist isotherme (t = const.)
h=
const.
v = const.
t = const.
h=
0
h=
const.
help axis
saturation curve
t = const.
h �= const.
�= const.
� = 100%
Fig. 4.1 Extract from h,x graph

4.3 Characteristic variables
4.3.1 Nominal flow rate
The nominal flow rate is the water flow rate forwhich the cooling tower is designed. This experi-mental system is designed for a nominal flow rateof 100 dm³/h. For the following calculations thedensity of water � can be taken to be 1000 kg/m³.
4.3.2 Cooling range
The cooling range z is the difference between thewarm water temperature T4 at the inlet to the cool-ing tower and the cold water temperature T5 at theoutlet from the cooling tower.
z T T� �4 5 (4.9)
28 4 Theory
WL 320 WET COOLING TOWER
08/2012
Fig. 4.2 Energy balance and material balance inWL 320 cooling tower
�mL2
T2
x2
�mL1
T1
x1
Air circuit
Water circuit
�mW1
T4
�mW 2
T5

4.3.3 Cooling limit
The cooling limit is the lowest achievable cold wa-ter temperature. This is the same as the wet bulbtemperature Tf of the ambient air.
Air can be humidified by evaporation of water untila state of saturation is reached. If the water to beevaporated is already at the same temperature asthe air, all it needs for evaporation is the supply oflatent heat, which is taken from the air by reductionof evaporation cooling.
In this situation there is thus a change of state atconstant enthalpy, until the saturation pressure(intersection with the saturation line) is reached.The temperature of this intersection is known in airconditioning technology as the “wet bulb tempera-ture” or “cooling limit”.
In Fig. 4.3 this yields a wet bulb temperature of Tf =11.2°C at a temperature T1 = 17°C and x = 6.2g/kg.In saturated air, the wet bulb temperature is thesame as the dry temperature.
4 Theory 29
WL 320 WET COOLING TOWER
08/2012
All
Rig
hts
Res
erve
dG
.U.N
.T.G
erät
ebau
Gm
bH,B
arsb
ütte
l,G
erm
any
08/2
012
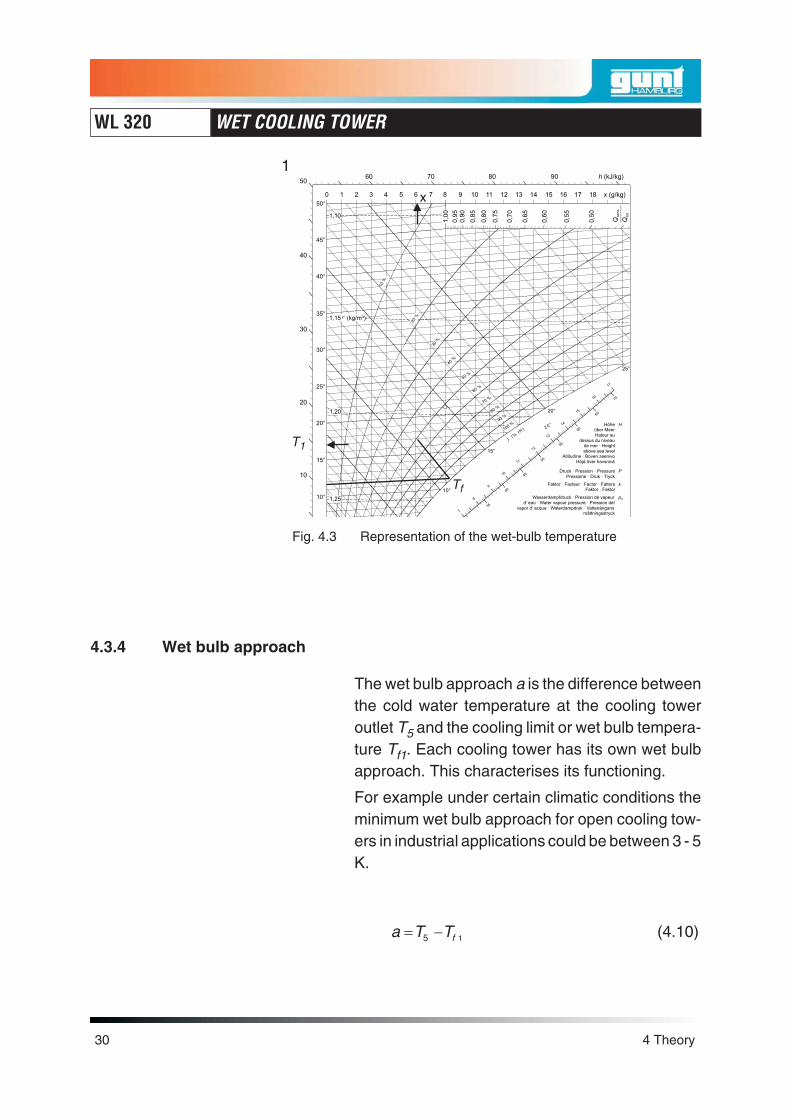
4.3.4 Wet bulb approach
The wet bulb approach a is the difference betweenthe cold water temperature at the cooling toweroutlet T5 and the cooling limit or wet bulb tempera-ture Tf1. Each cooling tower has its own wet bulbapproach. This characterises its functioning.
For example under certain climatic conditions theminimum wet bulb approach for open cooling tow-ers in industrial applications could be between 3 - 5K.
a T Tf� �5 1 (4.10)
30 4 Theory
WL 320 WET COOLING TOWER
08/2012
j (%rH
)
7
8
9
10
11
12
13
14
15
16
17
70
65
60
55
50
45
40
35
5090 h (kJ/kg)807060
0 1 2 3 4 5 6 7 8 9 10 11 12 13 14 15 16 17 18 x (g/kg)
1,0
0
0,9
50
,90
0,8
5
0,8
0
0,7
5
0,7
0
0,6
5
0,6
0
0,5
5
0,5
0
Qse
ns
Qto
t
50°
45°
40°
40
35°
30
30°
25°
20°
20
10
15°
10°
1,10
1,15 r (kg/m³)
1,20
1,25 Wasserdampfdruck · Pression de vapeurd' eau · Water vapour pressure · Pression del
vapor d' acqua · Waterdampdruk · Vattenångansmättningsstryck
Faktor · Facteur · Factor · FattoreFaktor · Faktor
Druck · Pression · PressurePressione · Druk · Tryck
Höheüber MeerHateur au
dessus du niveaude mer · Heightabove sea level
Altitudine · Boven zeenivoHöjd över havsnivå
H
pD
k
P
20°100
%90
%
80%
70%
60%
50%
40%
30%
20%
10
%
25°
20°
15°
10°
Fig. 4.3 Representation of the wet-bulb temperature
Tf
1
x
T1

The final temperature of the cooling water leavingthe cooling tower depends on the temperature ofthe cooling medium (air) and the design of thecooling tower.
4.3.5 Cooling coefficient
The cooling coefficient � is influenced by the ratioof the air/water mass flow rates (see Fig. 4.2). Thecooling limit temperature Tf1, the warm water tem-perature at the cooling tower inlet T4 and the coldwater temperature at the cooling tower outlet T5are required to calculate it. The cooling coefficient� is calculated as follows:
� �� �
�
�
T TT Tf
4 5
4 1
(4.11)
4.3.6 Water loss
Cooling towers with open circuits lose a certainamount of water due to material exchange. Thisamount of water �mWV is given by the difference inthe absolute humidities at the cooling tower inletand outlet, multiplied by the air mass flow rate �mL .
� �� �m x x mWV L� � �2 1 (4.12)
4.3.7 Heat load
The heat load �QW is the product of the water flow
rate �mw , the specific heat capacity of the water cpwand the cooling range z.
�
�Q m c zW w pw� � � (4.13)
4 Theory 31
WL 320 WET COOLING TOWER
08/2012
All
Rig
hts
Res
erve
dG
.U.N
.T.G
erät
ebau
Gm
bH,B
arsb
ütte
l,G
erm
any
08/2
012

4.3.8 Specific rain flow density
The specific flow rain density R is the water flowrate �mw in relation to the area AR where rain hasfallen (horizontal cross-sectional area of the cool-ing unit).
RmA
W
R
��
(4.14)
4.3.9 Packing density
The packing density AB of a cooling tower is the ra-tio of the surfaces of all levels of the cooling columnAs in relation to the volume of the cooling columnVK, in m²/m³.
AA
VBS
K
� � (4.15)
32 4 Theory
WL 320 WET COOLING TOWER
08/2012

5 Experiments
5.1 Introduction
The following section describes experiments thatcan be performed using this experimental unit. Theselection of experiments makes no claims of com-pleteness but is intended to be used as a stimulusfor your own experiments.
The measured results listed should not be viewedas reference or calibration values for all conditions.Depending on the design of the individual compo-nents, the individual’s experimental skills and theambient conditions, greater or lesser variationsmay occur in your own experiments.
For satisfactory operation of the system it shouldbe maintained in good condition by the laboratorymanager or laboratory assistant.
5 Experiments 33
WL 320 WET COOLING TOWER
08/2012
All
Rig
hts
Res
erve
dG
.U.N
.T.G
erät
ebau
Gm
bH,B
arsb
ütte
l,G
erm
any
08/2
012

5.2 Performing the experiment
The experimental system is commissioned as de-scribed in Chapter 2.6. The following experimentalsettings are suggested:
– Cooling column: Type 1
Packing density AB 110 m²/m³
Specific rain flow density R:0.49 kg/s m2
– Heating capacity: 1.0 kWTo generate a heat load, all of the water in thetank should be heated to approx. 30°C.
5.3 Evaluation of the experiment
Once a steady operating condition has been es-tablished, read off the following measured values.
Tab. 5.1 Measuring results for cooling column type 1
AB [m²/m³] 110
T1 [°C] 22.5
�1 [%] 32.4
T2 [°C] 20.0
�2 [%] 74.8
T4 [°C] 32.3
T5 [°C] 18.9
�p [Pa] 119
34 5 Experiments
WL 320 WET COOLING TOWER
08/2012

5.3.1 Recording the cooling process in the h,x graph
5 Experiments 35
WL 320 WET COOLING TOWER
08/2012
All
Rig
hts
Res
erve
dG
.U.N
.T.G
erät
ebau
Gm
bH,B
arsb
ütte
l,G
erm
any
08/2
012
j (%rH
)
5
6
7
8
9
10
11
12
13
14
15
16
17
70
65
60
55
50
45
40
35
30
25
20
15
10
5
0
4
3
2
1
0
50
4 6 8 10 12 14 16 18 20 22 24 26 28 pD (m bar)
h-x Diagrammdiagramme, chart, diagramma, diagram
p = 1013 m bar
Um
rech
nu
ng
sfa
kto
rF
acte
ur
de
tra
nsfo
rma
tio
nC
on
ve
rsio
nfa
cto
r
Co
rre
zio
ne
pe
ra
ltitu
din
eO
mre
ke
nin
gsfa
kto
rO
mva
nd
ling
sfa
kto
r H m 0 200 400 600 800 1000 1500 2000
kPa 101,3 98,9 96,6 94,3 92,1 89,9 84,2 79,5
m bar 1013 989 966 943 921 899 842 795
j
r
1
1
0,976
0,976
0,953
0,953
0,931
0,931
0,901
0,901
0,887
0,887
0,831
0,831
0,785
0,785
p
k
90 h (kJ/kg)807060
0 1 2 3 4 5 6 7 8 9 10 11 12 13 14 15 16 17 18 x (g/kg)
1,0
0
0,9
50
,90
0,8
5
0,8
0
0,7
5
0,7
0
0,6
5
0,6
0
0,5
5
0,5
0
Qse
ns
Qto
t
50°
45°
40°
40
35°
30
30°
25°
20°
20
10
15°
10°
0
5°
0°
-5°
-10°
t sic
(°C
)
-10
h(k
J/k
g)
1,10
1,15 r (kg/m³)
1,20
1,25
1,25
1,30 Relative Luftfeuchtigkeit · Humidité relative · Relative humidity · Umiditàrelativa · Relatieve vochtigheid · Relativ luftfuktighet
Wassergehalt · Teneur en eau · Moisture content · Contenuto d' acquaVochtinhoud · Vatteninnehåll
Dichte · Densité · Density · Peso specifico · Dichtheid · Desitet
Trockenkugel-Temperatur · Température du bulbe sec · Dry bulb temperatureTemperatura bulbo secco · Droge-bol temperatuur · Torr temperatur
Feuchtkugel-Temperatur · Température du bulbe humide · Wetbulb temperature · Temperatura bulbo umido · Natte-bol temperatuur
Våt temperatur
Enthalpie · Enthalpie · Enthalpy · Entalpia · Enthalpie · Enthalpi
Wasserdampfdruck · Pression de vapeurd' eau · Water vapour pressure · Pression del
vapor d' acqua · Waterdampdruk · Vattenångansmättningsstryck
Faktor · Facteur · Factor · FattoreFaktor · Faktor
Druck · Pression · PressurePressione · Druk · Tryck
Höheüber MeerHateur au
dessus du niveaude mer · Heightabove sea level
Altitudine · Boven zeenivoHöjd över havsnivå
H
pD
h
k
P
thyg
tsic
r
x
j
20°
t(°
C)
hyg
100%
90%
80%
70%
60%
50%
40%
30%
20%
10
%
h(k
cal/k
g)
h(k
J/kg
)
25°
20°
15°
10°
5°
0°
-5°
T1
T2
pD1p
D2
h 1h 2
Tf1
Tf2
x1 x2
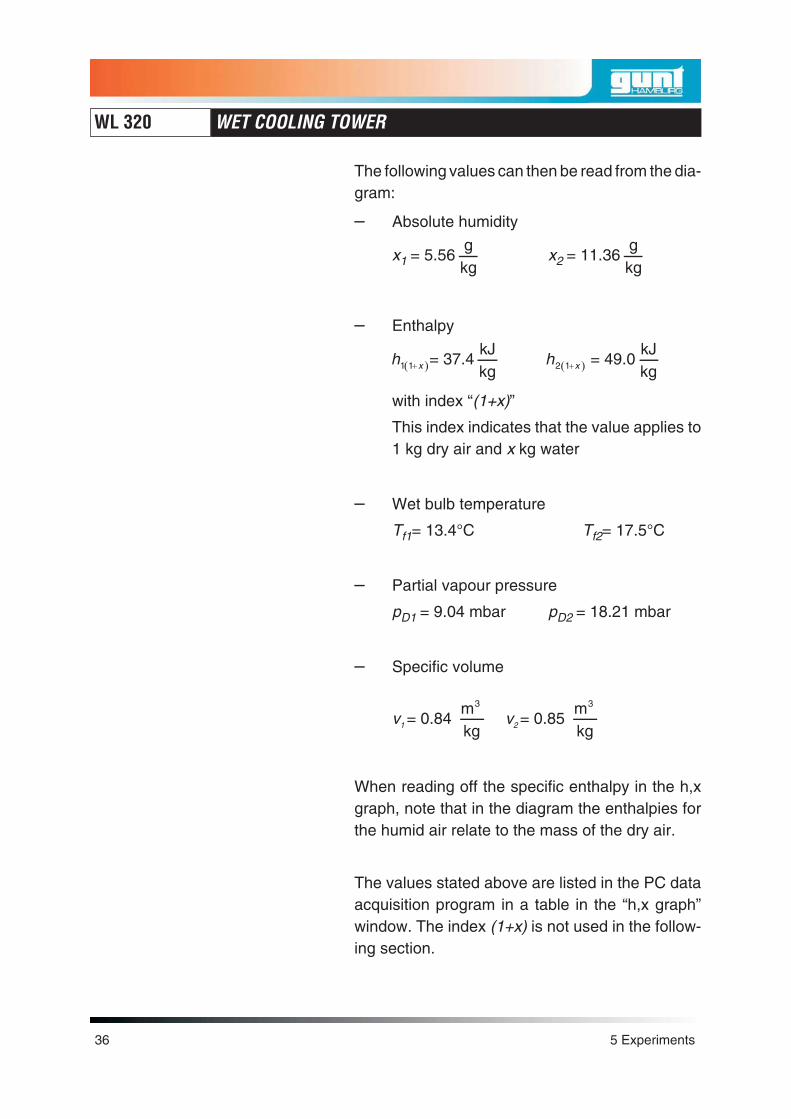
The following values can then be read from the dia-gram:
– Absolute humidity
x1 = 5.56gkg
x2 = 11.36gkg
– Enthalpy
� �h x1 1� = 37.4kJkg � �h x2 1� = 49.0
kJkg
with index “(1+x)”
This index indicates that the value applies to1 kg dry air and x kg water
– Wet bulb temperature
Tf1= 13.4°C Tf2= 17.5°C
– Partial vapour pressure
pD1 = 9.04 mbar pD2 = 18.21 mbar
– Specific volume
v1 = 0.84mkg
3
v2 = 0.85mkg
3
When reading off the specific enthalpy in the h,xgraph, note that in the diagram the enthalpies forthe humid air relate to the mass of the dry air.
The values stated above are listed in the PC dataacquisition program in a table in the “h,x graph”window. The index (1+x) is not used in the follow-ing section.
36 5 Experiments
WL 320 WET COOLING TOWER
08/2012

The variables calculated by the PC are listed in Ta-ble 5.2. The characteristic variables are calculatedbelow.
Tab. 5.2 Calculated variables for cooling column type 1
�mL [kg/s] 0.051
�QL [W] 575.1
z [K] 13.4
�QW [W] 615
a [K] 5.8
� 0.70
�mWV [kg/h] 1.01
5.3.2 Calculating the volumetric air flow
The differential pressure measured across the dia-phragm at the air outlet is used as the basis for cal-culating the volumetric air flow. Index 1 relates tothe values at the channel cross-section and index2 relates to the values at the diaphragmcross-section.
The flow velocity w2 is given theoretically by theBernoulli equation
p w p w1 12
2 22
2 2� � �� �
(5.1)
and the continuity equation
5 Experiments 37
WL 320 WET COOLING TOWER
08/2012
All
Rig
hts
Res
erve
dG
.U.N
.T.G
erät
ebau
Gm
bH,B
arsb
ütte
l,G
erm
any
08/2
012

A w A w1 1 2 2� � � where wAA
w12
12� � (5.2)
gives
wA
A
p p2
22
12
1 22
1
�
�
��
�(5.3)
Taking into account the equation for the air massflow rate,
�m w AL � � �2 2 � (5.4)
after transposition gives:
� ��mA
A
A
p pL �
�
� �2
1
22
22
12
1 2 � (5.5)
The channel cross-sections A1 and A2 are con-stant.
A1 = a �b = 150 �150 = 22500 mm² = 0.0225 m²
A2 = �� �
� � �d mm2
4
80
4
2
� = 5.0265� �10 3 m²
38 5 Experiments
WL 320 WET COOLING TOWER
08/2012
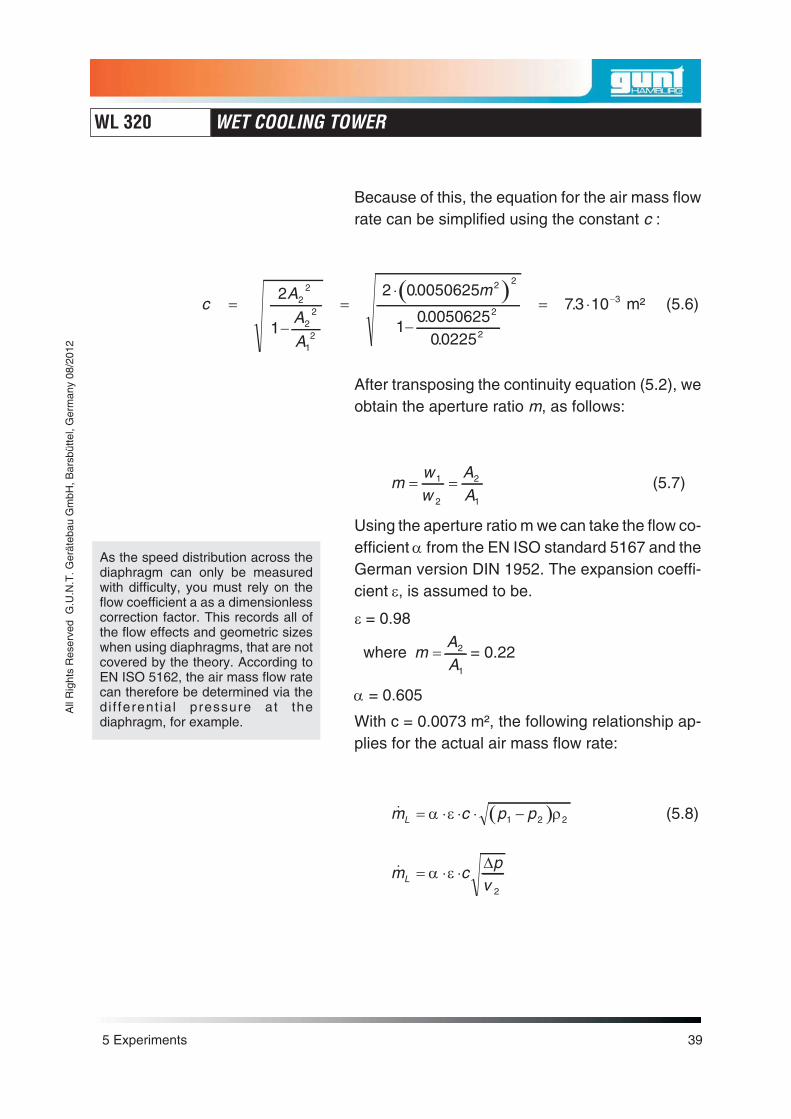
Because of this, the equation for the air mass flowrate can be simplified using the constant c :
� �c
A
A
A
m�
�
��
��
2
1
2 00050625
100050625
00225
722
22
12
2 2
2
2
.
..
.3 10 3� � m² (5.6)
After transposing the continuity equation (5.2), weobtain the aperture ratio m, as follows:
mww
AA
� �1
2
2
1
(5.7)
Using the aperture ratio m we can take the flow co-efficient� from the EN ISO standard 5167 and theGerman version DIN 1952. The expansion coeffi-cient �, is assumed to be.
� = 0.98
where mAA
� 2
1
= 0.22
� = 0.605
With c = 0.0073 m², the following relationship ap-plies for the actual air mass flow rate:
� ��m c p pL � � � � �� � �1 2 2 (5.8)
�m cp
vL � � �� ��
2
5 Experiments 39
WL 320 WET COOLING TOWER
08/2012
All
Rig
hts
Res
erve
dG
.U.N
.T.G
erät
ebau
Gm
bH,B
arsb
ütte
l,G
erm
any
08/2
012
As the speed distribution across thediaphragm can only be measuredwith difficulty, you must rely on theflow coefficient a as a dimensionlesscorrection factor. This records all ofthe flow effects and geometric sizeswhen using diaphragms, that are notcovered by the theory. According toEN ISO 5162, the air mass flow ratecan therefore be determined via thedi f ferent ia l pressure at thediaphragm, for example.

� . . ..
.mL � � � � �0605 098 00073119
08500512m
Nm²m³kg
kgs
2
The volumetric air flow is then calculated from theproduct of the air mass flow rate and the specificvolume of the humid air as follows:
�
�V m vL L� � 2 (5.9)
� . . . .VL � � � �00512 085 00435 156 7kgs
m³kg
m³s
m³h
The actual flow velocity in the channel is then ob-tained by neglecting the small differences in spe-cific volumes:
wVA
L1
1
00435
00225193� � �
�
.
. ².
msm
ms
3
(5.10)
40 5 Experiments
WL 320 WET COOLING TOWER
08/2012

5.3.3 Calculating the cooling capacity
The difference in enthalpy between the air inletand outlet multiplied by the air mass flow rate givesthe cooling capacity of the air.
� ��
�Q h h mL L� � �2 1 (5.11)
� . .QL � ��
��
�
�� � �49 374 00512
kJkg
kJkg
kgs
594 W
The cooling capacity of the air is made up of thecomponent due to evaporation �Qv and the compo-
nent due to convection �Qk .
� � �Q Q QL V k� � (5.12)
The cooling capacity component due to evapora-tion is given by:
� ��
�Q m r x xV L� � � �2 1 (5.13)
where r(30 C)� = 2429.9kJkg
�QV = 0.0512kgs
� 2429.9kJkg
� (0.01136kgkg
- 0.00556kgkg
)
�QV = 722 W
5 Experiments 41
WL 320 WET COOLING TOWER
08/2012
All
Rig
hts
Res
erve
dG
.U.N
.T.G
erät
ebau
Gm
bH,B
arsb
ütte
l,G
erm
any
08/2
012
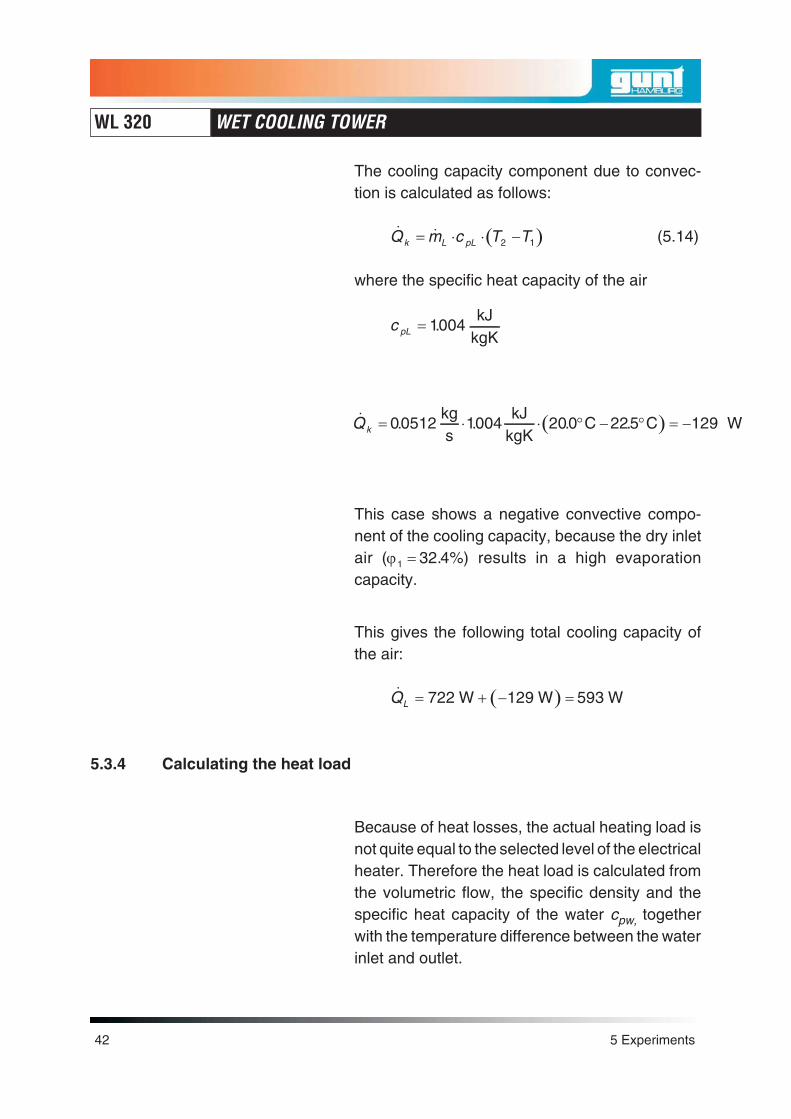
The cooling capacity component due to convec-tion is calculated as follows:
� ��
�Q m c T Tk L pL� � � �2 1 (5.14)
where the specific heat capacity of the air
c pL � 1004.kJ
kgK
� �� . . . .Qk � � � � � � � �00512 1004 200 225 129kgs
kJkgK
C C W
This case shows a negative convective compo-nent of the cooling capacity, because the dry inletair (�1 32 4� . %) results in a high evaporationcapacity.
This gives the following total cooling capacity ofthe air:
� ��QL � � � �722 129 593W W W
5.3.4 Calculating the heat load
Because of heat losses, the actual heating load isnot quite equal to the selected level of the electricalheater. Therefore the heat load is calculated fromthe volumetric flow, the specific density and thespecific heat capacity of the water cpw, togetherwith the temperature difference between the waterinlet and outlet.
42 5 Experiments
WL 320 WET COOLING TOWER
08/2012
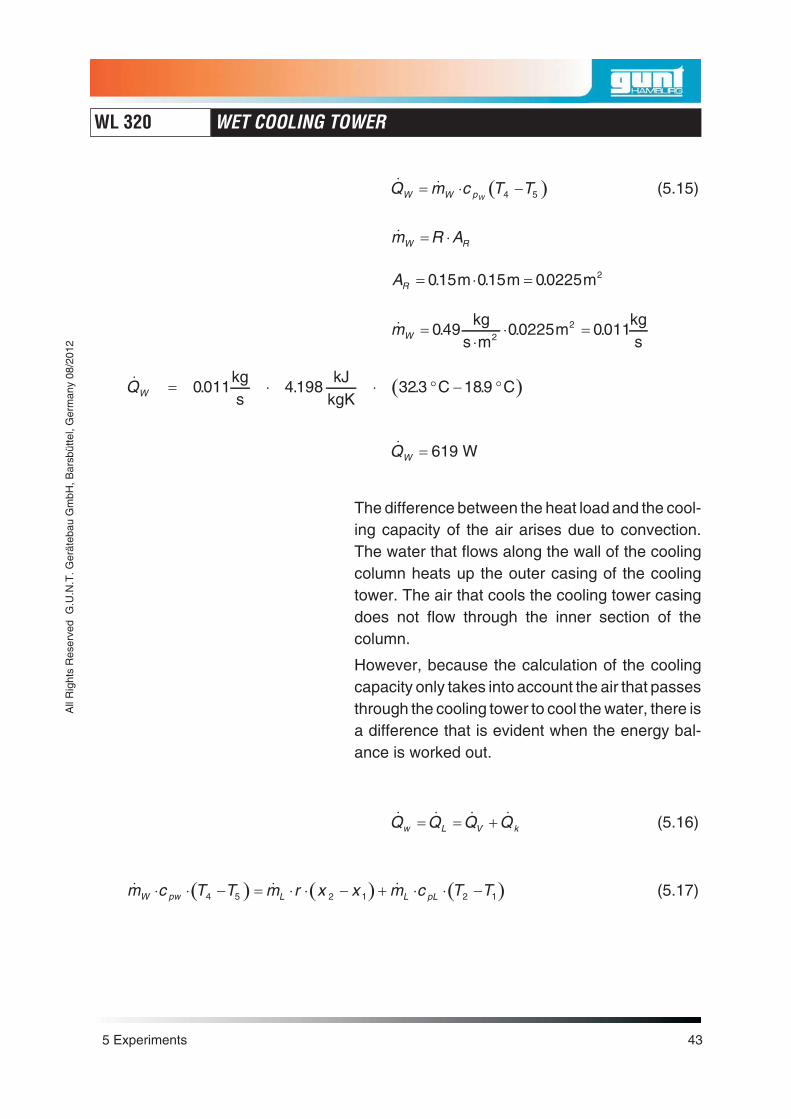
� ��
�Q m c T TW W pW� � �4 5 (5.15)
�m R AW R� �
AR � � �015 015 00225. . .m m m2
� . . .mW ��
� �049 00225 0011kg
s mm
kgs2
2
� �� . . . .QW � � � � � �0011 4 198 323 189kgs
kJkgK
C C
�QW � 619 W
The difference between the heat load and the cool-ing capacity of the air arises due to convection.The water that flows along the wall of the coolingcolumn heats up the outer casing of the coolingtower. The air that cools the cooling tower casingdoes not flow through the inner section of thecolumn.
However, because the calculation of the coolingcapacity only takes into account the air that passesthrough the cooling tower to cool the water, there isa difference that is evident when the energy bal-ance is worked out.
� � � �Q Q Q Qw L V k� � � (5.16)
� � � � � �� � �m c T T m r x x m c T TW pw L L pL� � � � � � � � � � �4 5 2 1 2 1 (5.17)
5 Experiments 43
WL 320 WET COOLING TOWER
08/2012
All
Rig
hts
Res
erve
dG
.U.N
.T.G
erät
ebau
Gm
bH,B
arsb
ütte
l,G
erm
any
08/2
012

5.3.5 Calculating the wet bulb approach
The wet bulb approach a is the difference be-tween the cold water temperature T5 and the cool-ing limit temperature Tf1.
The cooling limit is the lowest achievable cold wa-ter temperature (cooling limit temperature). It is thesame as the wet bulb temperature of the ambientair.
a = T5 - Tf1= 18.9°C - 13.4°C = 5.5 K
5.3.6 Calculating the cooling coefficient
The cooling coefficient � is the ratio of the coolingrange z to the difference between the warm watertemperature at the inlet to the cooling tower andthe wet bulb temperature Tf1
� �� �
��
�
�z
T TT TT Tf f4 1
4 5
4 1
� �� � �� � �
�323 189323 134
0 71. .. .
.C CC C
5.3.7 Calculating the water loss
The quantity of water removed by the air �mWV isgiven by the difference between the absolutehumidities at the cooling tower inlet and outlet,multiplied by the air mass flow rate �mL .
� �� �m x x mWV L� � �2 1
�mWV = (11.36 -5.56)�gkg
� � 0.0512kgs
= 0.297gs
= 1.07lh
44 5 Experiments
WL 320 WET COOLING TOWER
08/2012

5.4 Calculating the characteristic variables with different cooling columns
G.U.N.T also supplies accessories for the WL 320experimental set-up comprising various coolingcolumns with different packing densities.
These allow the influence of the different coolingcolumns on the cooling tower characteristics to beinvestigated in addition to the experiments and cal-culations performed with the standard equipment.
5.4.1 Performing the experiment
The experimental system is commissioned as de-scribed in Chapter 2.6. The following experimentalsettings are suggested:
– Heating capacity: 1.0 kWTo generate a heat load, all of the water in thetank should be heated to approx. 40°C.
– Specific rain flow density:0.49 kg/sm2
– The differential pressure is kept at a constant21 Pa using the butterfly valve.
Assemble the cooling column type 4
– Cooling column: Type 4
Packing density AB: 0 m²/m³
The cooling column type 4 is exchanged for type 2
– Cooling column: Type 2
Packing density AB: 77 m²/m³
The cooling column type 2 is exchanged for type 3
– Cooling column: Type 3
Packing density AB: 200 m²/m³
5 Experiments 45
WL 320 WET COOLING TOWER
08/2012
All
Rig
hts
Res
erve
dG
.U.N
.T.G
erät
ebau
Gm
bH,B
arsb
ütte
l,G
erm
any
08/2
012

5.4.2 Evaluation of the experiment
Once a steady operating condition has been es-tablished, read off the following measured values.
Tab. 5.3 Measuring results for cooling column type 4
AB [m²/m³] 0
T1 [°C] 25.1
�1 [%] 58.8
T2 [°C] 27.1
�2 [%] 92.6
T4 [°C] 44.1
T5 [°C] 22.1
�p [Pa] 21
Tab. 5.4 Calculated variables for cooling column type 4
�mL [kg/s] 0.021
�QL [W] 570
z [K] 23
�QW [W] 1070.6
a [K] 2.7
� 0.89
�mWV [kg/h] 0.74
46 5 Experiments
WL 320 WET COOLING TOWER
08/2012

Tab. 5.5 Measuring results for cooling columntypes 2 and 3
AB [m²/m³] 77 200
T1 [°C] 24.7 24.9
�1 [%] 57.5 54.5
T2 [°C] 24.4 23.1
�2 [%] 86.3 94.8
T4 [°C] 42.7 45.2
T5 [°C] 24.1 22.8
�p [Pa] 21 21
Tab. 5.6 Calculated variables for cooling columntypes 2 and 3
AB [m²/m³] 77 200
�mL [kg/s] 0.021 0.021
�QL [W] 288.8 294.5
z [K] 18.5 22.2
�QW [W] 864.1 1041.6
a [K] 5.3 4.3
� 0.78 0.84
�mWV [kg/h] 0.42 0.47
5 Experiments 47
WL 320 WET COOLING TOWER
08/2012
All
Rig
hts
Res
erve
dG
.U.N
.T.G
erät
ebau
Gm
bH,B
arsb
ütte
l,G
erm
any
08/2
012

5.4.3 Relationship between wet bulb approach and packing density
Tab. 5.7 Comparison of cooling columntypes 1 and 4
AB [m²/m³] 110 0
�QL [W] 575.1 570
z [K] 13.4 23
a [K] 5.8 2.7
� 0.70 0.89
The wet bulb approach for column type 4 withoutbaffles is considerably better than with baffles. It isgenerally recognised that as the water droplet sizereduces, the total surface area of all droplets in-creases markedly (e.g. one litre of water mist cov-ers an area the size of a football pitch).
In contrast to type 1, 2 and 3 columns, type 4 col-umns form no water film or large droplets, only aspray.
The air can take up latent heat of evaporation froma large surface area of the sprayed water dropletsby evaporation of the water. The packing density isnot known, but it is >200 m²/m³ .
Tab. 5.8 Comparison of cooling columntypes 2, 3 and 4
AB [m²/m³] 77 200 0
a [K] 5.3 4.3 2.7
As the packing density increases, the wet bulb ap-proach a decreases. In this case the water mistused as packing must be considered to have avery large packing density.
48 5 Experiments
WL 320 WET COOLING TOWER
08/2012

6 Appendix
6.1 Technical data
Support
Housing: powder-coated, colour white Frame:powder-coated, colour black
Width 1110 mm
Depth 470 mm
Height 1230 mm
Weight Approx. 115 kg
Power supply
230 V / 50 Hz, 16A
Optional alternatives, see rating plate
Heater
Power 1500 W
3 settings, adjustable 500W/1000W/1500W
Thermostat 50 °C, with shutoff
Fan
Power 0.25 kW
Max. differential pressure 430 Pa
Max. volumetric flow 13 m3/min
Pump
Power 0.66 kW
Max. head 70 m
Max. volumetric flow 1,7 l/min
6 Appendix 49
WL 320 WET COOLING TOWER
08/2012
All
Rig
hts
Res
erve
dG
.U.N
.T.G
erät
ebau
Gm
bH,B
arsb
ütte
l,G
erm
any
08/2
012

Cooling column
Diaphragm diameter 80 mm
Cross-section: 150 × 150 mm
WL 320: Cooling column type 1
Packing density 110 m2/m3
Flow cross-section: 150 � 150 mm
L � W � H: 210 � 210 � 630 mm
Weight: Approx. 5 kg
WL 320.01: Cooling column type 2
As for type 1
Packing density: 77 m²/m³
WL 320.02: Cooling column type 3
As for type 1
Packing density: 200 m²/m³
WL 320.03: Cooling column type 4
As for type 1, without baffles
Packing density: 0 m²/m³
WL 320.04: Cooling column type 5
Packing density: Variable
Number of distributor bases: 3
Temperature measuring range: 0 ... 50°C
L � W � H: 210 � 210� 960 mm
Differential pressure transmitter
Measuring range 0 - 10 mbar
Output signal 0 - 10 V DC
Supply 24 V DC
50 6 Appendix
WL 320 WET COOLING TOWER
08/2012

Flow meter with transmitter (water)
Measuring range 12 - 360 l/h
Output signal 0 - 5 V DC
Supply 24 V DC
Combined temperature/humidity sensor
Measuring range, temperature 0 - 50 °C
Output signal 0 - 10 V DC
Measuring range, relative humidity 10 - 100%
Accuracy at 20°C � 5 %
Output signal 1 - 9 V DC
Supply 24 V AC
Temperature sensor with transmitter
Measuring range -5 °C - 105 °C
Allowance DIN EN 60 751 Class B
Digital display
Measuring range 0 - 200 mV DC
Supply 5 V DC
6 Appendix 51
WL 320 WET COOLING TOWER
08/2012
All
Rig
hts
Res
erve
dG
.U.N
.T.G
erät
ebau
Gm
bH,B
arsb
ütte
l,G
erm
any
08/2
012

6.2 h,x graph for humid air
h,x graph for humid air
52 6 Appendix
WL 320 WET COOLING TOWER
08/2012
j (%rH
)
5
6
7
8
9
10
11
12
13
14
15
16
17
70
65
60
55
50
45
40
35
30
25
20
15
10
5
0
4
3
2
1
0
50
0 0,2 0,4 0,6 0,8 1,0 1,2 1,4 1,6 1,8 2,0 2,2 2,4 2,6 2,8 pD (kPa)
4 6 8 10 12 14 16 18 20 22 24 26 28 pD (m bar)
h-x Diagrammdiagramme, chart, diagramma, diagram
p = 1013 m bar
Um
rech
nu
ng
sfa
kto
rF
acte
ur
de
tra
nsfo
rma
tio
nC
on
ve
rsio
nfa
cto
r
Co
rre
zio
ne
pe
ra
ltitu
din
eO
mre
ke
nin
gsfa
kto
rO
mva
nd
ling
sfa
kto
r H m 0 200 400 600 800 1000 1500 2000
kPa 101,3 98,9 96,6 94,3 92,1 89,9 84,2 79,5
m bar 1013 989 966 943 921 899 842 795
j
r
1
1
0,976
0,976
0,953
0,953
0,931
0,931
0,901
0,901
0,887
0,887
0,831
0,831
0,785
0,785
p
k
90 h (kJ/kg)807060
0 1 2 3 4 5 6 7 8 9 10 11 12 13 14 15 16 17 18 x (g/kg)
1,0
0
0,9
50
,90
0,8
5
0,8
0
0,7
5
0,7
0
0,6
5
0,6
0
0,5
5
0,5
0
Qse
ns
Qto
t
50°
45°
40°
40
35°
30
30°
25°
20°
20
10
15°
10°
0
5°
0°
-5°
-10°
t sic
(°C
)
-10
h(k
J/k
g)
1,10
1,15 r (kg/m³)
1,20
1,25
1,25
1,30 Relative Luftfeuchtigkeit · Humidité relative · Relative humidity · Umiditàrelativa · Relatieve vochtigheid · Relativ luftfuktighet
Wassergehalt · Teneur en eau · Moisture content · Contenuto d' acquaVochtinhoud · Vatteninnehåll
Dichte · Densité · Density · Peso specifico · Dichtheid · Desitet
Trockenkugel-Temperatur · Température du bulbe sec · Dry bulb temperatureTemperatura bulbo secco · Droge-bol temperatuur · Torr temperatur
Feuchtkugel-Temperatur · Température du bulbe humide · Wetbulb temperature · Temperatura bulbo umido · Natte-bol temperatuur
Våt temperatur
Enthalpie · Enthalpie · Enthalpy · Entalpia · Enthalpie · Enthalpi
Wasserdampfdruck · Pression de vapeurd' eau · Water vapour pressure · Pression del
vapor d' acqua · Waterdampdruk · Vattenångansmättningsstryck
Faktor · Facteur · Factor · FattoreFaktor · Faktor
Druck · Pression · PressurePressione · Druk · Tryck
Höheüber MeerHateur au
dessus du niveaude mer · Heightabove sea level
Altitudine · Boven zeenivoHöjd över havsnivå
H
pD
h
k
P
thyg
tsic
r
x
j
20°
t(°
C)
hyg
100%
90%
80%
70%
60%
50%
40%
30%
20%
10
%
h(k
cal/k
g)
h(k
J/kg
)
25°
20°
15°
10°
5°
0°
-5°

6.3 Worksheets for recording measured values
Name: Date:
AB [m²/m³]
T1 [°C]
�1 [%]
T2 [°C]
�2 [%]
T4 [°C]
T5 [°C]
�VW [l/h]
�mL [kg/s]
�QL [W]
z [K]
�QW [W]
a [K]
�
�mWV [kg/h]
�p [Pa]
�VL [m³/h]
6 Appendix 53
WL 320 WET COOLING TOWER
08/2012
All
Rig
hts
Res
erve
dG
.U.N
.T.G
erät
ebau
Gm
bH,B
arsb
ütte
l,G
erm
any
08/2
012

Name: Date:
Duration per
experiment:___[min]Experiment 1
Type _2_ 77 [m²/m³]Experiment 2
Type _1_ 110 [m²/m³]Experiment 3
Type _3_ 200 [m²/m³]
T1 [°C]
�1 [%]
T2 [°C]
�2 [%]
T4 [°C]
T5 [°C]
�VW [l/h]
�mL [kg/s]
�QL [W]
z [K]
�QW [W]
a [K]
�
�mWV [kg/h]
�p [Pa]
�VL [m³/h]
54 6 Appendix
WL 320 WET COOLING TOWER
08/2012
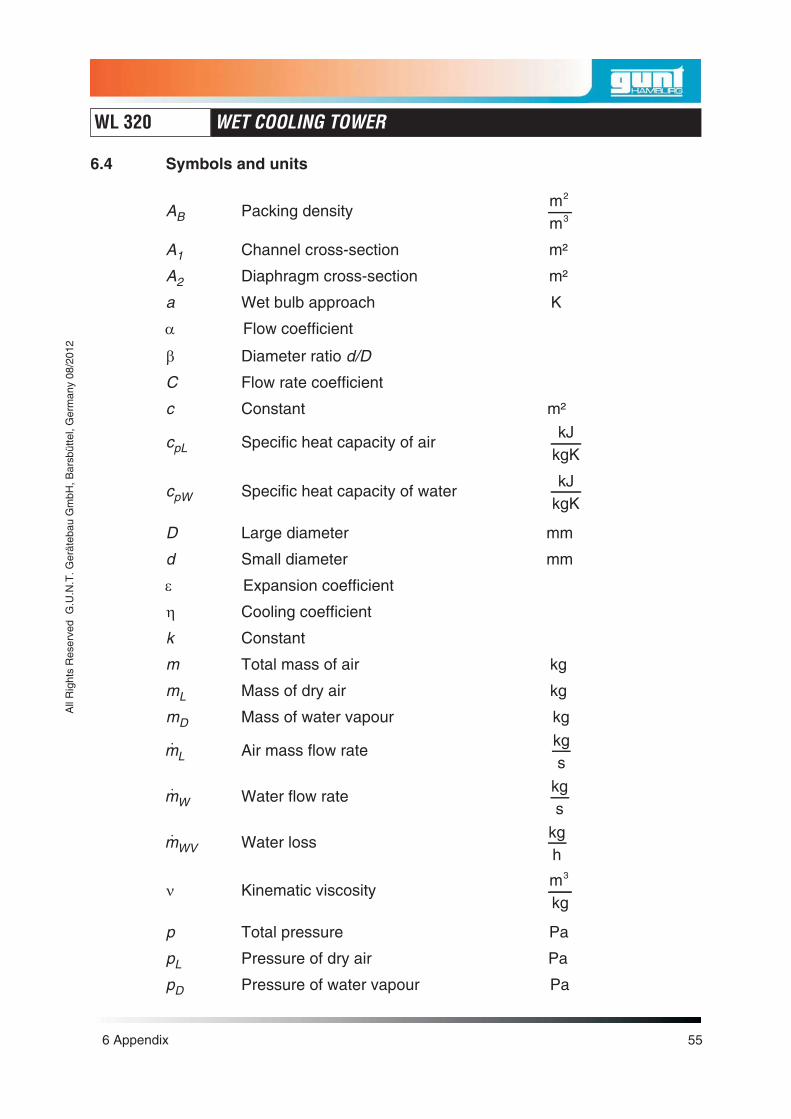
6.4 Symbols and units
AB Packing densitymm
2
3
A1 Channel cross-section m²
A2 Diaphragm cross-section m²
a Wet bulb approach K
� Flow coefficient
� Diameter ratio d/D
C Flow rate coefficient
c Constant m²
cpL Specific heat capacity of airkJ
kgK
cpW Specific heat capacity of waterkJ
kgK
D Large diameter mm
d Small diameter mm
� Expansion coefficient
� Cooling coefficient
k Constant
m Total mass of air kg
mL Mass of dry air kg
mD Mass of water vapour kg
�mL Air mass flow ratekgs
�mW Water flow ratekgs
�mWV Water losskgh
� Kinematic viscositymkg
3
p Total pressure Pa
pL Pressure of dry air Pa
pD Pressure of water vapour Pa
6 Appendix 55
WL 320 WET COOLING TOWER
08/2012
All
Rig
hts
Res
erve
dG
.U.N
.T.G
erät
ebau
Gm
bH,B
arsb
ütte
l,G
erm
any
08/2
012

pDS(T) Saturation pressure of
water vapour at air temperature T Pa
p1 Inlet pressure Pa
p2 Outlet pressure Pa�QL Cooling capacity of air W
�QV Cooling capacity by evaporation W
�QK Cooling capacity by convection W
r Latent heat of evaporationkJkg
R Specific rain flow densitykg
s m2�
� Total densitykgm³
�L Density of dry airkgm³
�D Density of water vapourkgm³
TW1 Water inlet temperature K
Tw2 Water outlet temperature K
Tf1 Wet bulb temperature K
V Volume m³
vL Specific volume of dry airm³kg
vD Specific volume of water vapourm³kg
�VL Volumetric flow airls
�VW Volumetric flow waterls
w1 Inlet speedms
w2 Outlet speedms
x Absolute humiditygkg
56 6 Appendix
WL 320 WET COOLING TOWER
08/2012

6.5 Latent heat of evaporation
Latent heat of evaporation
t in °C r inkJkg t in °C r in
kJkg
6.98 2484.0 43.79 2397.1
17.51 2495.3 45.84 2392.2
24.10 2443.8 60.09 2357.6
28.98 2432.3 75.89 2318.3
32.90 2423.0 85.95 2292.5
36.19 2415.2 93.51 2272.7
39.03 2408.5 99.63 2256.5
41.54 2402.5
Excerpt from water vapour table:
Technische Wärmelehre, 8. überarbeitete Auflage 2001
Fritz Dietzel / Walter Wagner
6.6 Items supplied
1 � Complete table-top unit with coolingcolumn type 1
1 � Experiment Instructions
6 Appendix 57
WL 320 WET COOLING TOWER
08/2012
All
Rig
hts
Res
erve
dG
.U.N
.T.G
erät
ebau
Gm
bH,B
arsb
ütte
l,G
erm
any
08/2
012


