Robinson et al. (2005) Wimmera Land Resource Assessment. DPI Victoria 83 3 Soil-landforms Across the WCMA region a number of land and soil surveys exist that have been carried out by government organisations including the Soil Conservation Authority (SCA), Commonwealth Scientific and Industrial Research Organisation (CSIRO) and the former Department of Agriculture and Rural Affairs (now known as the Department of Primary Industries (DPI)). These studies have used different scales for specific purposes. For example an agricultural and horticultural land suitability for the Shire of West Wimmera at 1:100 000 (Baxter, Williamson & Brown 1996) focused on providing ‘information for broad scale planning’ by defining the ‘capability of the different types of land to support various land uses’. Studies at 1:100 000 scale aim to provide the reader with base information to ‘examine the nature and interactions of features of the natural environment’ while focusing on ‘sustained productivity of the land, its use and management’ (Pitt 1981). As a result, information presented by these previous studies (Table 1) is varied in detail. This posed a primary constraint in the development of consistent and seamless map coverage for the entire WCMA region at 1:100 000 scale. This is further discussed in Section 3.2 (Map creation). 3.1 Concept and definitions Mapping of environmental features or landscape attributes can have decidedly different terminology and accompanying definitions. Terms such as landsystems (‘areas of land each with a characteristic pattern of the environmental variables, climate, geology, topography, soil and vegetation’) and terrain (‘land uniquely defined in terms of topography, underlying lithological and structural characteristics, and soil and vegetation characteristics) have been encountered as part of this study. The definition of mapping units is based upon an ecosystem concept in which several land features are integrated (defined in previous terms and definitions). Climate, geological material, landform and soil are each considered because they affect the inherent properties of the land, and its response to management (Charman & Murphy 1991). In this study the term ‘soil-landform’ is used to describe the map units. The soil-landform unit is an association of a specific landform pattern and its accompanying soils while considering other environmental variables in delineating areas of homogenous soil- landform relationships. At the scale of mapping in this study the soil-landform unit itself is made up of land components or elements. Where possible we have defined the specific associations that exist between soils and land components within a soil-landform. Some of these map units are simple, having only one land component (e.g. some of the larger swamp units or simple plains), whereas others are more complex having several components. 3.2 Map creation In generating a soil-landform map for the WCMA region, a number of factors were considered in the editing and compilation phases. These factors include which studies to include or use, and issues with studies and datasets used in derivation of unit boundary linework. Issues arising from incorporation of existing studies into mapping For the WCMA region, a number of soil and land related studies and surveys have been published (Table 1). These soil and land surveys have varying spatial coverages and were created for a number of purposes and this is reflected in the style and contents of the survey reports. In total, eleven soil and land surveys have been used in assembling the soil-landform units for WCMA region. These surveys are briefly described in Table 1 according to their author, year of publication, responsible organisation, mapping scale and reference locality. Brief comments for all surveys regarding their functional role in the creation of the soil-landform map is discussed further in Table 2 with many of these descriptions sourced from Robinson et al. (2003c).
Transcript
Robinson et al. (2005) Wimmera Land Resource Assessment. DPI Victoria
83
3 Soil-landformsAcross the WCMA region a number of land and soil surveys exist that have been carried out bygovernment organisations including the Soil Conservation Authority (SCA), Commonwealth Scientificand Industrial Research Organisation (CSIRO) and the former Department of Agriculture and RuralAffairs (now known as the Department of Primary Industries (DPI)). These studies have used differentscales for specific purposes.For example an agricultural and horticultural land suitability for the Shire of West Wimmera at1:100 000 (Baxter, Williamson & Brown 1996) focused on providing ‘information for broad scaleplanning’ by defining the ‘capability of the different types of land to support various land uses’.Studies at 1:100 000 scale aim to provide the reader with base information to ‘examine the nature andinteractions of features of the natural environment’ while focusing on ‘sustained productivity of theland, its use and management’ (Pitt 1981). As a result, information presented by these previous studies(Table 1) is varied in detail. This posed a primary constraint in the development of consistent andseamless map coverage for the entire WCMA region at 1:100 000 scale. This is further discussed inSection 3.2 (Map creation).
3.1 Concept and definitionsMapping of environmental features or landscape attributes can have decidedly different terminologyand accompanying definitions. Terms such as landsystems (‘areas of land each with a characteristicpattern of the environmental variables, climate, geology, topography, soil and vegetation’) and terrain(‘land uniquely defined in terms of topography, underlying lithological and structural characteristics,and soil and vegetation characteristics) have been encountered as part of this study.The definition of mapping units is based upon an ecosystem concept in which several land features areintegrated (defined in previous terms and definitions). Climate, geological material, landform and soilare each considered because they affect the inherent properties of the land, and its response tomanagement (Charman & Murphy 1991). In this study the term ‘soil-landform’ is used to describe themap units. The soil-landform unit is an association of a specific landform pattern and its accompanyingsoils while considering other environmental variables in delineating areas of homogenous soil-landform relationships. At the scale of mapping in this study the soil-landform unit itself is made up ofland components or elements. Where possible we have defined the specific associations that existbetween soils and land components within a soil-landform. Some of these map units are simple,having only one land component (e.g. some of the larger swamp units or simple plains), whereasothers are more complex having several components.
3.2 Map creationIn generating a soil-landform map for the WCMA region, a number of factors were considered in theediting and compilation phases. These factors include which studies to include or use, and issues withstudies and datasets used in derivation of unit boundary linework.
Issues arising from incorporation of existing studies into mappingFor the WCMA region, a number of soil and land related studies and surveys have been published(Table 1). These soil and land surveys have varying spatial coverages and were created for a number ofpurposes and this is reflected in the style and contents of the survey reports. In total, eleven soil andland surveys have been used in assembling the soil-landform units for WCMA region. These surveysare briefly described in Table 1 according to their author, year of publication, responsible organisation,mapping scale and reference locality. Brief comments for all surveys regarding their functional role inthe creation of the soil-landform map is discussed further in Table 2 with many of these descriptionssourced from Robinson et al. (2003c).
Robinson et al. (2005) Wimmera Land Resource Assessment. DPI Victoria
84
Table 1 Existing soil and land surveys within the WCMA region used in mapping the catchment
Survey title Author Year Organisation Reference locality Scale
1 Agricultural andhorticultural landsuitability for the WestWimmera Shire
Baxter,Williamson andBrown
1996 Department ofNaturalResources andEnvironment
Shire of WestWimmera
1:100 000
2 Lowan land inventoryassessment
Imhof, Rees andThompson(Williamson ed.)
1997 Department ofNaturalResources andEnvironment
Shire of Lowan 1:100 000
3 Landform mapping andrecharge estimations forthe Old Dimboola Shire
Muller andHocking
2002a Department ofNaturalResources andEnvironment
2002b Department ofNaturalResources andEnvironment
Old DimboolaShire
1:100 000
5 Soil association of theHorsham mapsheet
Badawy 1977a Department ofAgriculture
Horsham 1:100 000
6 Major agricultural soilsof the WimmeraIrrigation Area
Martin et al. 1996 Department ofNaturalResources andEnvironment
WimmeraIrrigation area
1:100 000and
1:35 000
7 Soils of the easternWimmera
Badawy 1984 Department ofAgriculture
Charlton, Donald,Rupanyup
1:100 000
8 Land inventory of theWimmera Systems andRocklands Water SupplyCatchment
White et al. 1985 Department ofConservationForest andLands
Upper Wimmeracatchment
1:100 000
9 A study of land in theGrampians area
Sibley 1967 SoilConservationAuthority
Grampians Ranges 1:250 000and
1:100 000
10 A reconnaissance surveyof the soils of the Shire ofKowree, Victoria
Blackburn andGibbons
1956 CSIRO Kowree 1:250 000
Continued next page
Robinson et al. (2005) Wimmera Land Resource Assessment. DPI Victoria
85
Table 1 continued
Survey title Author Year Organisation Reference locality Scale
11 Natimuk Maher andMartin
1990 Department ofAgriculture andRural Affairs
Natimuk 1:100 000
12 Landscapes and soils ofthe Goroke area
Maher andMartin
1990 Department ofAgriculture andRural Affairs
Goroke 1:100 000
Note that all soil and land surveys are provided as appendices accessable via the CD-ROM as reportsand/or maps.
Robinson et al. (2005) Wimmera Land Resource Assessment. DPI Victoria
86
Table 2 Functional role of soil surveys in creation of the soil-landform map for the WCMA regionSurvey title Functional role in map creation
Agricultural and horticulturalland suitability for the WestWimmera Shire
The maps and accompanying report provided a basis for soil-landform mapping in the west of the Wimmera region. Landforminformation is of a particularly high standard using aerialphotography interpretation procedures. Soil pit data wascollected as part of the project, however inspection site data ismissing. The survey had some inconsistencies with overlappingsurveys including A reconnaissance survey of the soils of the Shire ofKowree, Victoria and Landscapes and soils of the Goroke area.
Lowan land inventoryassessment
This land assessment report describes nine mapping units andhas been used as a mapping base with little refinement over theLowan Shire area. Soils information that relates to units is quitedetailed and informative with toposequence schematics provided.Mapping with the neighbouring surveys was consistent as theearliest survey (West Wimmera) was effectively continued to theeast.
Landform mapping andrecharge estimations for the OldDimboola Shire
Mapping builds upon the soil-landform assessment of the Lowanland inventory assessment and continues mapping further eastpast the Wimmera River. The units were generated for ahydrogeological assessment, however they are extremely similarin nature to that of the Lowan shire mapping. Soil attribution andpoint data is absent here and therefore some of the units havebeen refined, deleted or added to in the development of aconsistent map base. No neighbouring mapping exists to the east,placing a lower confidence on units along the eastern extent.
Landform mapping andrecharge estimations fromHorsham to Dimboola
Mapping builds upon the soil-landform assessment of the Lowanland inventory assessment the recharge estimation landformmapping further north (Landform mapping and recharge estimationsfor the Old Dimboola Shire). The units were generated for ahydrogeological assessment and are likely to exhibit a higherdegree of uncertainty than mapping in the north. Mapping alsohas numerous overlaps with the Natimuk soil-landform mappingand new mapping generated as part of this project for theHorsham mapsheet. Little mapping has been preserved throughnew mapping as a result.
Soil association of the Horshammapsheet
The mapping units used are strictly soil association units anddon’t necessarily conform to landforms. The map base has beenused in the development of new mapping for the Horshammapsheet.
Major agricultural soils of theWimmera Irrigation area
High intensity mapping (1:35 000) has been preserved in the finalsoil-landform map. Soil and landform information is of thehighest standard from previous settlement soil surveys (Murtoa,Horsham, Quantong). Soil descriptions for the map units areextremely detailed and informative relating to landscape andformation processes. While overlap occurred with mapping of thesoil associations, this mapping took precedence due to scale anddetail of mapping.
Continued next page
Robinson et al. (2005) Wimmera Land Resource Assessment. DPI Victoria
87
Table 2 continuedSurvey title Functional role in map creation
Soils of the eastern Wimmera Mapping for the Rupanyup, Donald and Charlton 1:100 000mapsheets as landforms and soil associations provides the basefor the final soil-landform map. Units were refined usingradiometrics, especially prior stream complexes and plains. Thesurvey extends to the east beyond the WCMA boundary and hasonly limited overlap with the Land inventory of the WimmeraSystems and Rocklands Water Supply Catchment mapping. Thereport is quite detailed from a soils perspective with numerousrepresentative profiles included. Landforms defined have beenincorporated, however due to the subtlety of the landscape aredubious in certain areas.
Land inventory of the WimmeraSystems and Rocklands WaterSupply Catchment
This report entails mapping for the upper Wimmera, GrampiansRanges and western Black Range areas as 150 topographic(landform)-soil combinations. Based around the GrampiansRanges storages, the mapping has been produced using aerialphotography interpretation procedures and soils informationassigned using the Factual Key (Northcote 1979) classificationscheme. The survey is quite extensive and provides a very usefulmapping base in the upper Wimmera area. There weremodifications made to mapping using DEM, geology andradiometrics to improve the precision of boundaries as well asdefine new units. While soils information was collected as part ofthe original mapping process, this information has been lost andtherefore placed a limitation on the usefulness of the assignedsoils data. Overlap with the soil-landform mapping for theNatimuk 1:100 000 mapsheet, A study of land in the Grampians areaand new mapping for the Horsham mapsheet saw numerousinconsistencies with these surveys.
A study of land in theGrampians area
The landsystems mapping for the Grampians area provides 18landsystem descriptions with numerous disaggregations of theselandsystems into land units. Soil and landscape information iscaptured in tables and has been used extensively owing to theuseful level of detail recorded in this report. Mapping covers theGrampians Ranges, Horsham south plains and Mount WilliamCreek catchment areas. Overlap with the Wimmera Systems andRocklands Water Supply Catchment and new mapping for theHorsham 1:100 000 mapsheet occur.
A reconnaissance survey of thesoils of the Shire of Kowree,Victoria
Undertaken in the 1950s, this reconnaissance survey providesvery useful background mapping that overlaps with the WestWimmera shire mapping and mapping of the Goroke/Natimuk1:100 000 mapsheets. Unit descriptions have often been reservedthrough all mapping overlaps, however the boundaries andextent of units fluctuates from survey to survey. Soil pointinformation is limited while the mapping provided an extremelyuseful quality checking base for more recent mapping.
Continued next page
Robinson et al. (2005) Wimmera Land Resource Assessment. DPI Victoria
88
Table 2 continuedSurvey title Functional role in map creation
Natimuk Map units represent major landform patterns across the Natimuk1:100 000 mapsheet. All map units include landform elements,morphology and element type as well as dominent soils and othersoils. Descriptions of dominant soils are provided along with areference site. The mapping has proved extremely useful and is ofhigh quality when viewed against the DEM, geology andradiometrics. Little modification occurred to linework exceptalong mapsheet boundaries where linework was altered to allowfor seamless mapping along all tile boundaries. No mapping atthe designated scale (1:100 000) existed south of this tile apartfrom landsystems mapping of the Grampians area and theKowree reconnaissance mapping.
Landscapes and soils of theGoroke area
Map units represent major landform patterns across the Goroke1:100 000 mapsheet. All map units include landscape (includingpercentage coverage), landscape position as well as dominentsoils. Descriptions of dominant soils (depth, texture and colour)are provided for all units. The mapping proved extremely usefuland is of high quality when viewed against the DEM, geologyand radiometrics in addition to pre-existing mapping of the Shireof Kowree and Shire of West Wimmera. Linework was integratedwith the Shire of West Wimmera mapping to develop a seamlessmap along all tile boundaries. Mapping at the designated scale(1:100 000) to the south of this tile included soil-landformmapping of Kowree Shire and West Wimmera Shire.
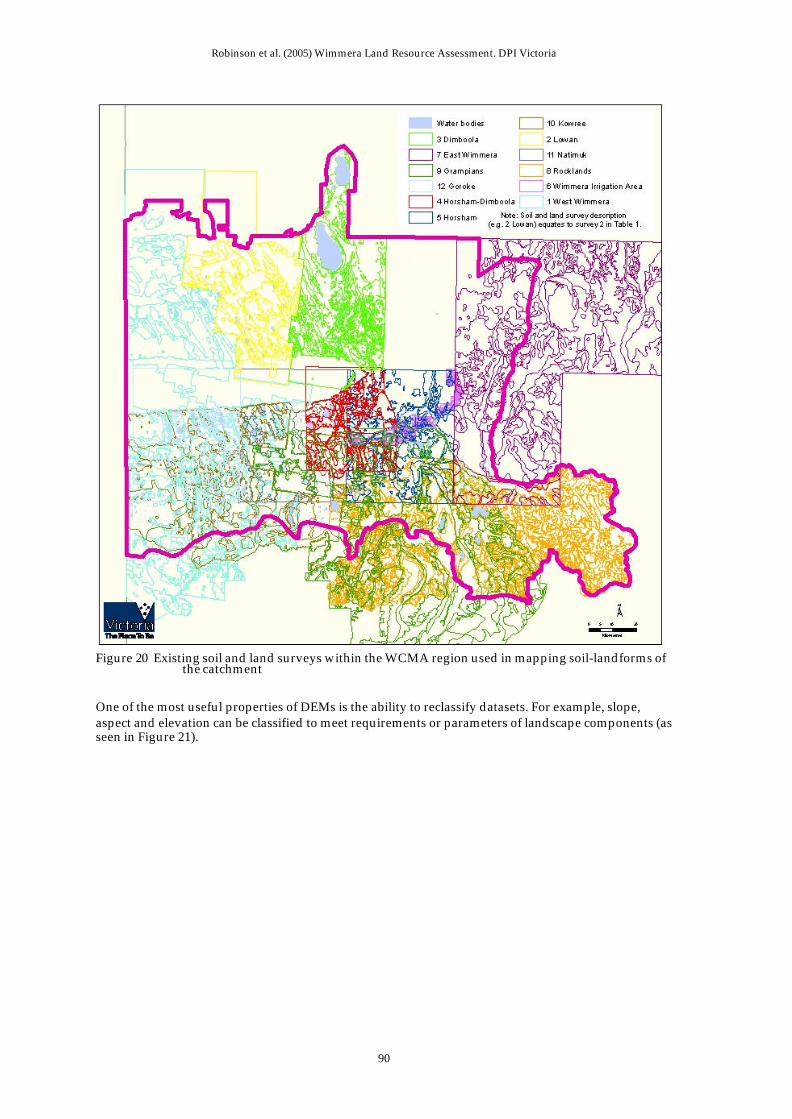
As a number of surveys have been edited to develop a seamless map coverage of the WCMA region,some of existing units (soil-landform or landsystem) have been preserved. All soil-landform unitscreated were assigned a unique numerical code to represent either an existing map unit, or newlycreated unit. The extents of the surveys and data gaps in information are presented in Table 2 andFigure 20. The soil-landform units developed as part of the LRA project for the WCMA region are to beused at 1:100 000 scale. Soil-landform units are listed in the Section 2 (Geomorphology) under relevantgeomorphic tiers. The soil-landform data has also been used to produce inherent susceptibility to landdegradation maps.In future the availability of soil-landform unit information and soil point site data will allow for morespecific and detailed applications. These may be used to provide a clear understanding of the potentialto develop land for specific agricultural enterprises and to identify specific limitations inherent withinthe natural resource base. The ability to access detailed soil point information, as well as soil and landspatial units will benefit many modelling applications currently used to assess land resourcemanagement and water quality aspects, for example, Land Use Impact Model (LUIM), Soil and WaterAssessment Tool (SWAT) and the Catchment Assessment Tool (CAT).Detailed soil-landform unit descriptions are accessible via the CD-ROM. Soil profile descriptions areprovided in Section 4 (Soils) under relevant soil group headings.
Datasets used to refine map boundaries, and create units for areas with no previous surveycoverageA number of geospatial datasets were used in a GIS to aid in refining boundaries between overlappingsoil and land surveys, and to map new soil-landform units for areas with no existing coverage at anadequate scale. Some of these datasets and their use in these processes are explained.
GeologyGeology mapping is available for this region at 1:250 000 scale from the DPI Corporate GeospatialDataset GEOL250 (O'Brien 2001) and was used as a consistent base to assist in boundary refinement,
Robinson et al. (2005) Wimmera Land Resource Assessment. DPI Victoria
89
but also in defining likely sources for soils. Improved 1:100 000 scale geology digital map base wasreleased by DPI’s Geological Survey of Victoria (GSV) for the Ararat 1:100 000 mapsheet and provedinvaluable in associating soils and landforms with the geology of the Western Uplands. Geologicalinformation was also used in soil-landform tabular descriptions (refer to tabular descriptions infollowing section). The nomenclature used conforms to that developed and recently revised by theGSV.
RadiometricsAirborne gamma radio spectrometry (GRS) was useful in the detection of changes in soil properties,but required validation by ground truthing to determine intrinsic soil properties. The use ofradiometrics was particularly relevant in differentiating terrain with unconsolidated material, such asthe plains country, and complemented the digitial elevation data in the Western Uplands.Radiometrics was also used with geology to identify topographical relationships concerning colluvialand alluvial material.
Digital elevation modelsDigital elevation models (DEMs) have become widely used in the last 20 years as they enable bettervisualisation and interrogation of topographic features.A DEM is generically described as ‘a spatially geo-referenced dataset that is a popular way of encodingthe topography for environmental modelling purposes’. DEMs are directly compatible with remotely-sensed data sources and can be used to represent complex terrain units, given an adequate resolution.Generally, DEMs have been derived from topographic data using contour data, spot heights,hydrology and boundaries (shore line, state, 1:100 000 tile) and provide the data to analyse the shape ofthe surface which affects the soils and hydrological properties of the landscape.Some general derivatives from DEMs include:• slope, slope length and slope position• aspect• drainage network and catchment boundaries• hydrological indices and watertable indices• climate variables• input to estimation of soil parameters• input to land component and soil type mapping• viewshed analysis and visualisation• visualisation• environment modelling including salinity, species distribution, spread models etc.
Robinson et al. (2005) Wimmera Land Resource Assessment. DPI Victoria
90
Figure 20 Existing soil and land surveys within the WCMA region used in mapping soil-landforms ofthe catchment
One of the most useful properties of DEMs is the ability to reclassify datasets. For example, slope,aspect and elevation can be classified to meet requirements or parameters of landscape components (asseen in Figure 21).
Robinson et al. (2005) Wimmera Land Resource Assessment. DPI Victoria
91
Aspect classification Slope classification
Figure 21 Three dimensional classification of DEM to three different datasets (aspect, slope andelevation)
DEMs have been developed to generate slope ranges and formulate relationships between slope,landform and soil characteristics. DEMs with a 20 m pixel resolution were developed for the WCMAregion from 1:25 000 scale topographic data. In the more steeply dissected country the DEMs providedan excellent background dataset to assess for changes in landform and associated soils/soildistribution. The DEMs were also used to generate slope classes and relative elevations that conform toerosional landform patterns as defined in McDonald et al. (1990). These derivatives are useful toidentify areas of changing landforms and break-of-slope, indicating the occurrence of a changingprocess, as well as assisting classification of landforms into a consistent format (e.g. cones classified tohills, low hills and rises).
Robinson et al. (2005) Wimmera Land Resource Assessment. DPI Victoria
92
Soil point dataThe collection of soil point site information has been used to define the associations between soils andlandforms. Soil point information has also provided a basis for allocation of dominant soil attributeswithin each soil-landform unit. Nearly 1000 sites exist from soil and land surveys, including thosecollected during the course of this project. Additional soil site information has been used from varioussoil site programs across western Victoria. These programs include the National Soil Fertility Program(CSIRO 1968-1972), Top Crop (Imhof unpublished), Horsham historic sites (Newell & Thorn 1967;Forrest 1978), Wimmera core service (Martin 1969). Over 190 soil profile descriptions are provided onthe CDROM with 161 of these geographically located on the 1:100 000 soil-landform maps. A review ofknown existing soil sites for studies and surveys of the WCMA region is documented in Robinson et al.(2003c).
UnitsIn this study, the soil-landform unit is the principal mapping unit and has been classified and mappedat 1:100 000 scale across the entire WCMA region. Within the geomorphological framework these soil-landform units occur at or below the geomorphological sub-regional level (Tier 3). The generation ofthese units incorporated information from historic reports and office-based GIS techniques inassociation with fieldwork, to ascertain and validate soil descriptions for unique soil-landform units.These soil-landform units provide the base dataset from which the susceptibility to land degradationthemes are derived. This study has identified and provided an inventory of soil-landform units acrossthe area with inherent susceptibility to erosion, waterlogging and soil structure decline.Soils descriptions, classifications and groupings have been defined using soil point data from existingstudies and new fieldwork. Soils are described to national standards and are compared on the basis oftheir attributes and classification, using The Australian Soil Classification (Isbell 1996). Landform (orlandform pattern) has also been classified on the basis of relative relief, such as plains, low hills andmountains, and modal slope variations (gently, undulating, rolling, moderately steep, steep, verysteep-inclined and precipitous). These comply with national standards as set out in the Australian Soil& Land Survey Field Handbook (McDonald et al. 1990). Landforms were further distinguished accordingto changes in their lithology (geology).The soil-landforms of the relevant studies used have been delineated by a combination of aerial photointerpretation, correlation and quality control using airborne radiometrics, DEM and fieldexamination. All soil and land survey prior to 2000 used black and white aerial photographsstereoscopically at a scale of approximately 1:80 000 (1:100 000 soil-landform mapping) and 1:25 000(1:35 000 soil-landform mapping), and reveal geomorphic patterns for the soil-landform mapping ofeach study. Each area was examined in the field to check the accuracy of the aerial photographinterpretation and to collect data regarding the nature of the soils, the native vegetation, the angle andshape of slopes and the nature of the parent material. Climatic data was also considered in delineationof soil-landform units.Representative sites or ‘type sites’ were chosen for each of the most commonly occurring landcomponents in order to examine in detail the nature of the soils, the structure and floristics of theassociated native vegetation and their interrelations with other variables.From the assembly of these studies and additional mapping, over 100 soil-landforms have beendefined for the WCMA region. These range in size from less than 250 ha, to in excess of 100 000 ha.Some of the smaller units occurring near the edge of the study area are widespread in adjacent CMAregions.Data collected on each soil-landform unit is presented in tabular form with accompanying backgroundunit information, photographs, topographic section, three-dimensional representation and location ofwhere the unit occurs within the catchment.
Tabular descriptionsComponents are allotted numbers to aid in identification. Representative parts of each soil-landformunit have been mapped on stereo air photographs at a scale of approximately 1:25 000 to define andmeasure the areas of the individual components. These areas have been extrapolated to give anestimation of the relative proportions of each component. For soil-landform units near the edge of thestudy area, these proportions may not be relevant to adjacent areas. This methodology for defining
Robinson et al. (2005) Wimmera Land Resource Assessment. DPI Victoria
93
components within units has been adopted for many soil-landform units with soil and land surveyspre 2000 using an almost identical procedure with varying scales of photomosaics/stereo pairs foridentification of components (refer to existing studies for comprehensive methodology).Climatic data is derived from climatic geospatial datasets for Victoria. These datasets have beeninterpolated from existing weather station information provided by the Bureau of Meteorology. Datapresented includes: annual rainfall for each soil-landform unit, the wettest month and the driestmonth.Temperature data are the average annual daily values in February (maximum) and July (minimum)extremes.The major seasonal growth limitaton (precipitation less than evapotranspiration) has also been provided.Restrictions to plant growth (growing season) occur to varying extents due to low temperatures inwinter, and lack of available water in summer. These restrictions are of somewhat lower impact todaywith a range of summer dormant, winter active pasture species available on the market. It should benoted that soil moisture storage extends the growing season beyond the point where potentialevapotranspiration exceeds precipitation.Local relief is a measure of the average change in elevation from the top of a hill or ridge to the nearestdrainage line within the landsystem. The DEM combined with representative topographic sectionsenabled an assessment of the relative relief variations across these landscapes. The 1:25 000 streamhydrology network geospatial dataset has been used to determine drainage patterns as well asdrainage density.Native vegetation descriptions for soil-landform units have been assigned using Ecological VegetationClass (EVC) information from the geospatial dataset. Area of disturbance, plantations or waterbodieshave not been included in totals of these units.Soil profile information including parent material, description, surface texture, permeability, depth andsoil type sites has been included. This information has been derived from previous soils allocated tolandforms of existing studies, thus preserving the detail and integrity of this data as well asincorporating new investigations. Soil descriptions derived from existing studies have been updated toreflect changes in soil classification and the adoption of the Australian Soil Classification (Isbell 1996).A key change has been the adoption of the soil colour classes defined within the ASC. Due to thevarying age of soil data earlier soil classification/descriptions (Northcote 1979) are given whereavailable. This should provide a link for those who are mainly familiar with the older scheme.Additionally these soils have all been assigned to soil groups (Wimmera Soil Groups) that reflect acombination of geomorphology and soil relationships. There are 41 soil groups. Land component soilshave been assigned to a Wimmera Soil Group (WSG). This was developed to encompass the variety ofsoils in the existing studies (greater than 200) and to simplify presentation of soil information.Soil site information has been included for sites that are either located specifically within that unit andcomponent (denoted in bold text), or are considered sites suitable as representative of the describedsoil.A five-class system has been used for the estimation of permeability based on profile characteristics suchas porosity and texture. The estimate refers to the vertical hydraulic conductivity of the solum, whichis limited by the least permeable horizon. Sands with no compacted layers have very highpermeabilities while clays, with few pores or cracks, have very low permeabilities. This system hasbeen adopted along with information captured from all the landsystem surveys of the catchment.Soil depth refers to the distance below the surface to solid rock or to a layer that serves as animpediment restricting root penetration and water movement.The main existing land uses have been listed. Active recreation includes the use of vehicles such as trailbikes, dune buggies, four-wheel drive vehicles and other forms of ‘adventure sports’. Passiverecreation refers to less potentially destructive pursuits such as picnicking, camping and bushwalking.The forms of soil deterioration found to occur in each component, the critical features of the landscape,and the processes leading to these forms of soil deterioration are also outlined.An example of a tabular description is presented in Table 3 along with a description of whereinformation derived for soil-landform unit descriptions has been sourced.
Robinson et al. (2005) Wimmera Land Resource Assessment. DPI Victoria
94
Table 3 Tabular unit description example with described sources for relevant informationComponent Component no. (e.g. 1, 2, 3 etc.)
Proportion of landsystem Percentage of overall unit (e.g. 10%)CLIMATE
Rainfall (mm) Annual average rainfall: calculated from the climate geosptial datasets held at CLPR forrainfall (derived from weather stations across Victoria)
Temperature (oC) Minimum (July) and Maximum (January) averagePrecipitation less than potentialevapotranspiration
Geospatial datasets have provided the source for months where precipitation is less thanpotential evapotranspiration
GEOLOGY
Age and lithology Sourced from the 1:250 000 geological mapping held by DPI’s Minerals and Petroleumgroup
Geomorphology Defined in accordance with recent mapping by the Victorian Geomorphological ReferenceGroup
LAND USE Land use is a general assessment of major practices within units. This information isderived from surveyor knowledge and observations collected in field survey
TOPOGRAPHY
Landscape Source: existing land resource assessment surveys and field assessmentElevation range (m) Source: 1:25 000 DEMLocal relief (m) Source: 1:25 000 DEMDrainage pattern 1: 25 000 stream hydrology networkDrainage density (km/km2) 1: 25 000 stream hydrology networkLandform Aerial photograph interpretation and field assessmentLandform element Aerial photograph interpretation and field assessmentSlope and range (%) Aerial photograph interpretation and field assessmentSlope shape Aerial photograph interpretation and field assessmentNATIVE VEGETATION
Ecological Vegetation Class(EVC)
Derived from the EVC geospatial dataset
SOIL
Parent material Sourced from the 1:250 000 geological mapping held by DPI’s Minerals and Petroleumgroup and field survey descriptions
Description (Wimmera soil group) Local soil description (provided via existing soils information or from analysis of soil sites)
Soil type sites Soil type sites have been captured allowing the user to refer to sites that are either locatedspecifically within that unit and component (denoted in bold text), or are considered sites
suitable as representative of the described soil.Surface texture Representative soil site textural informationPermeability Representative soil site textural information
Depth (m) Representative soil site textural informationLAND CHARACTERISTICS,POTENTIAL ANDLIMITATIONS
The land characteristics are a base interpretation by the soil surveyor of the importantcritical land features, processes and forms. This is derived from soil-landform properties
and land features that increase likelihood of erosion and degradation.
Soil-landform unit descriptionsSoil-landform units have been developed using processes outlined previously. There are 106 discretesoil-landform units mapped for the WCMA region excluding the Horsham township and lakes(terminal lakes and Grampians storages). A soil-landform unit is based primarily on land pattern whilethe land component, or element is a subset of these (refer to Australian Soil & Land Survey FieldHandbook, McDonald et al. 1990). Although historical surveys and existing land resource informationwere used as a guide in the development of these soil-landform units, nearly 150 additional soil siteswere collected as part of this project. These additional sites contributed to the detailed soil profileinformation, and when related to the local landform features provide the basis of the soil-landformunit.The soil-landform units defined for this study are listed under geomorphological units in Section 2(Geomorphology) numerically with a brief unit description, as well as the area and proportion of landeach unit consists of. Soil-landform units can be accessed from the ‘soil-landform’ drop-down list onthis CD-ROM and accessed on the CD-ROM by following links from the soil-landform map base.
Robinson et al. (2005) Wimmera Land Resource Assessment. DPI Victoria
95
Within the soil-landform unit descriptions the landform features and characteristics are defined anddescribed. The land component descriptions provide a major soil type, relating this to soil groupingsidentified for the Wimmera region.Map products generated from the soil-landform units for the project include:• Soil-landform unit base map• Soil-landform unit base map with sites provided on the CD-ROM• Land degradation susceptibility maps covering:
• gully and tunnel erosion• sheet and rill erosion• wind erosion• soil structure decline (compaction)• soil pH (topsoil and subsoil)• soil sodicity (topsoil and subsoil).
These maps can be found on the CD-ROM accompanying this report and can be accessed by followingthe links from the CD-ROM index to the map section.