Research Paper Magnetic separation of coal fly ash from Bulgarian power plants Annie S. Shoumkova Abstract Fly ash from three coal-burning power plants in Bulgaria: ‘Maritza 3’, ‘Republika’ and ‘Rousse East’ were subjected to wet low-intensity magnetic separation. The tests were performed at different combinations of magnetic field intensity, flow velocity and diameter of matrix elements. It was found that all parameters investigated affected the separation efficiency, but their influence was interlinked and was determined by the properties of the material and the combination of other conditions. Among the fly ash characteristics, the most important parameters, determining the magnetic separation applica- bility, were mineralogical composition and distribution of minerals in particles. The main factors limiting the process were the presence of paramagnetic Fe-containing mineral and amorphous matter, and the existence of poly-mineral particles and aggregates of magnetic and non-magnetic particles. It was demonstrated that the negative effect of both factors could be considerably limited by the selection of a proper set of separation conditions. The dependences between concentration of ferromagnetic iron in the ash, their magnetic properties and magnetic fraction yields were studied. It was experimentally proved that, for a certain set of separation conditions, the yields of magnetic fractions were directly proportional to the saturation magnetization of the ferromagnetic components of the ash. The main properties of typical magnetic and non- magnetic fractions were studied. Keywords Coal fly ash, magnetic separation, solid waste, Bulgaria Date received: 5 March 2010; accepted: 4 July 2010 Introduction Coal fly ash (FA) are generally aluminosilicate materials, containing also Fe, Ca, Mg, Na, K, Ti, mainly in oxide forms, unburned carbon, and tens of other elements in micro or trace concentrations, some of which are toxic (Turner, 1981) or radioactive (Papp et al., 2002). In recent years a very large number of investigations worldwide have been devoted to the characterization of FAs, in order to esti- mate the potential environmental impact of FA waste, and its significance as a material resource for different industrial applications (Bayat, 1998; Iyer and Scott, 2001; Goodarzi, 2006; Kostakis, 2009). A significant number of the methods and technologies already elaborated for FA utilization includes a magnetic separation step, applied not only when the purpose of the reprocessing is to obtain Fe-containing products (Brown, 1980; Aldrich, 1984; Dobbins and Murtha, 1983; Orlov et al., 1999; Sripriya et al., 2003), but also in cases when iron is an undesirable ingredient – for instance in Al 2 O 3 production (Cohen and Mercier, 1976; McDowell and Seeley, 1981; Styron and Abiodun, 2001), or when limitations on its concentration in the final products exist (Boybay and Demirel, 1982; Molina and Poole, 2004; Paya´ et al., 1996; Prakash et al., 2001). Magnetic separation can be carried out by very different methods, with respect to the aims of its application, require- ments for the quality of the final products, properties of raw materials, etc. With regard to iron concentrate extrac- tion, wet low-intensity magnetic separation, performed in one (Hurst and Styron, 1978; Murtha and Burnet, 1978; Baitenev and Murzaeva, 1984) or two stages (Hwang, 1993; Institute of Physical Chemistry, Bulgarian Academy of Sciences, Sofia, Bulgaria. Corresponding author: Annie S. Shoumkova, Institute of Physical Chemistry, Bulgarian Academy of Sciences, bl. 11 ‘Acad. G. Bonchev’ Str., 1113 Sofia, Bulgaria. Email: [email protected]Waste Management & Research 0(0) 1–12 ! The Author(s) 2010 Reprints and permissions: sagepub.co.uk/journalsPermissions.nav DOI: 10.1177/0734242X10379494 wmr.sagepub.com Waste Manag Res OnlineFirst, published on August 10, 2010 as doi:10.1177/0734242X10379494
Transcript
Research Paper
Magnetic separation of coal fly ash fromBulgarian power plants
Annie S. Shoumkova
AbstractFly ash from three coal-burning power plants in Bulgaria: ‘Maritza 3’, ‘Republika’ and ‘Rousse East’ were subjected to wet
low-intensity magnetic separation. The tests were performed at different combinations of magnetic field intensity, flow
velocity and diameter of matrix elements. It was found that all parameters investigated affected the separation efficiency,
but their influence was interlinked and was determined by the properties of the material and the combination of other
conditions. Among the fly ash characteristics, the most important parameters, determining the magnetic separation applica-
bility, were mineralogical composition and distribution of minerals in particles. The main factors limiting the process were the
presence of paramagnetic Fe-containing mineral and amorphous matter, and the existence of poly-mineral particles and
aggregates of magnetic and non-magnetic particles. It was demonstrated that the negative effect of both factors could be
considerably limited by the selection of a proper set of separation conditions. The dependences between concentration of
ferromagnetic iron in the ash, their magnetic properties and magnetic fraction yields were studied. It was experimentally
proved that, for a certain set of separation conditions, the yields of magnetic fractions were directly proportional to the
saturation magnetization of the ferromagnetic components of the ash. The main properties of typical magnetic and non-
magnetic fractions were studied.
KeywordsCoal fly ash, magnetic separation, solid waste, Bulgaria
Date received: 5 March 2010; accepted: 4 July 2010
Introduction
Coal fly ash (FA) are generally aluminosilicate materials,
containing also Fe, Ca, Mg, Na, K, Ti, mainly in oxide
forms, unburned carbon, and tens of other elements in
micro or trace concentrations, some of which are toxic
(Turner, 1981) or radioactive (Papp et al., 2002). In recent
years a very large number of investigations worldwide have
been devoted to the characterization of FAs, in order to esti-
mate the potential environmental impact of FA waste, and its
significance as a material resource for different industrial
applications (Bayat, 1998; Iyer and Scott, 2001; Goodarzi,
2006; Kostakis, 2009).
A significant number of the methods and technologies
already elaborated for FA utilization includes a magnetic
separation step, applied not only when the purpose of the
reprocessing is to obtain Fe-containing products (Brown,
1980; Aldrich, 1984; Dobbins and Murtha, 1983; Orlov
et al., 1999; Sripriya et al., 2003), but also in cases when
iron is an undesirable ingredient – for instance in Al2O3
production (Cohen and Mercier, 1976; McDowell and
Seeley, 1981; Styron and Abiodun, 2001), or when limitations
on its concentration in the final products exist (Boybay and
Demirel, 1982; Molina and Poole, 2004; Paya et al., 1996;
Prakash et al., 2001).
Magnetic separation can be carried out by very different
methods, with respect to the aims of its application, require-
ments for the quality of the final products, properties of
raw materials, etc. With regard to iron concentrate extrac-
tion, wet low-intensity magnetic separation, performed
in one (Hurst and Styron, 1978; Murtha and Burnet, 1978;
Baitenev and Murzaeva, 1984) or two stages (Hwang, 1993;
Institute of Physical Chemistry, Bulgarian Academy of Sciences, Sofia,Bulgaria.
Corresponding author:Annie S. Shoumkova, Institute of Physical Chemistry, BulgarianAcademy of Sciences, bl. 11 ‘Acad. G. Bonchev’ Str., 1113 Sofia,Bulgaria.Email: [email protected]
Waste Management & Research
0(0) 1–12
! The Author(s) 2010
Reprints and permissions:
sagepub.co.uk/journalsPermissions.nav
DOI: 10.1177/0734242X10379494
wmr.sagepub.com
Waste Manag Res OnlineFirst, published on August 10, 2010 as doi:10.1177/0734242X10379494
Orlov et al., 1999), usually provides magnetic fractions,
having two to six times higher iron content, at yields of
10–30% of the feed material. Wet high intensity magnetic
separation is generally applied for separation of iron–lean
(0.2–6% Fe) fractions, at typical yields of 70–80% (Hurst
and Styron, 1978; Prakash et al., 2001).
The process of wet magnetic separation of some
Bulgarian FAs has also been explored (Shumkov and
Shoumkova, 2002, 2004; Shoumkova, 2006b).
All these investigations demonstrate that the efficiency of
the magnetic separation and the quality of the resulting frac-
tions depends to a high degree on the separation conditions.
Therefore a profound study of magnetic separation process,
the abilities of its management and optimization is of great
importance for the practice, as it would contribute to the
increase of profitability of the reprocessing technologies
and their practical application.
The main aims of the present study were to character-
ize the physical and chemical properties of three types of
Bulgarian FAs, to explore the applicability of the low-inten-
sity magnetic separation process and to check the possibilities
for its management by investigating the influence of the main
technological parameters on separation efficiency.
Materials and methods
Materials
Coal ashes from three Bulgarian power stations: ‘Maritza 3’
(FAM3; 120MW), burning local lignite coals, ‘Republika’
(FAR; 460MW), burning local sub-bituminous coals and
and anthracitic coal, were investigated. The FAM3 and FAR
are taken directly from electrostatic precipitators, and the
FARE represents a mixture of FA and slag. In some studies
also FAs from power plants ‘Varna’ (FAV), ‘Bobovdol’
(FAB) and ‘Maritza East 1’ (FAME1) were used.
Procedure
The FA materials were pretreated by dry sieving and the
fractions <0.125mm (representing 20% for FAM3, 94%
for FAR, and 85% for FARE), were collected and analysed.
Then they were subjected to wet low-intensity magnetic sep-
aration in a laboratory solenoid magnetic separator of matrix
type, because it provided high repeatability and an additional
instrument for process management–gradient variation. In
the separator the gradient is generated by a matrix of steel
spheres and can be approximately calculated by the formula:
gradB � 2 Bj j:d�1 (Svoboda, 2004), where B is the magnetic
flux density, d is the diameter of the matrix elements. The
matrix exhibits low remanent magnetization (0.004T) and
mechanical capturing capacity (0.2–0.8% depending on
d and V). It is situated in a cylindrical canister (radius
0.025m and height 0.125m). Magnetic induction is measured
directly in the geometric centre of the matrix using a
Teslameter Model 310A, Thorn Emi Technology GmbH.
Real flow velocity (V) is calculated from apparent flow veloc-
ity (Vm) and free volume in the matrixes.
The FA–water suspensions were prepared by intensive
stirring (for 5min, at 2000 rpm) of 100 g of ash in 1000 g
water. Then the slurry was passed through the working
camera of the separator where strongly magnetic particles
were captured onto the matrix, forming the magnetic fraction
(MF), while weakly magnetic ones passed through it to form
the non-magnetic fraction (NF). The MF was then washed
by water while the magnetic field was switched on in order to
prevent the mechanical capture of particles in the camera.
The separately collected MF and NF were dewatered,
dried, weighed and analysed.
The main quantitative and qualitative parameters for
magnetic separation process efficiency estimation were
defined as follows: yield of magnetic (YMF) or non-magnetic
(YNF) fraction, the quantity of this fraction obtained,
expressed as wt.% of the initial sample; recovery (RFe), the
quantity of Fe, extracted in MF or NF, expressed as wt.% of
its quantity in initial sample; enrichment factor (FFe), the
ratio of concentration of Fe in MF or NF to that in the
initial FA; selectivity (SFe), the difference between the con-
centration of Fe in MF and NF.
Analytical methods and equipment
In the present study, the chemical composition of FA was
investigated by a combination of standard silicate analysis
for macro elements Si, Al, Fe, Ca andMg, and atomic absorp-
tion spectroscopy (AAS; Perkin-Elmer Model 306 AA spec-
trophotometer) for microelements K, Na and Ti. The content
of unburned carbon (including organic matter) and sulfur was
estimated on the base of the parameter ‘loss on ignition at
1073K’ (LOI1073K), determined by thermogravimetric analy-
sis (TGA; using (Setaram 92 16.18 apparatus). The mineral-
ogy of the samples was studied using X-ray diffraction (XRD;
Siemens Diffractometer D 5000 with CuKa radiation at scan-
ning speed 1�/min). For MoS electromechanical spectrometer
Wissenschaftliche Elektronik GmbH working at regime of
constant acceleration at 293K, 57Co/Rh radiation
(Activity�10mCi), with standard �-Fe was used. Magnetic
properties were determined on the basis of the magnetization
curves obtained by SQUID (ModelMPMS). Themorphology
was observed by a scanning electron microscope (SEM; Jeol
Superprobe 733 and Jeol JSM -5800LV) with an energy dis-
persive X-ray detector (EDX) for chemical analyses. Particle
size distribution data were obtained by laser analyser
(Beckman Coulter LS 230) working in a combined centrifu-
gal–gravitational regime. Specific weight was determined by
electron pycnometer (Micrometrics AccuPyc 1330). Specific
surface and micro- and mezzo-porosity were measured by
inert gas adsorption using a Micrometrics ASAP 2010.
2 Waste Management & Research 0(0)
Results and discussion
Initial fly ash samples
The studied FAs represented inhomogeneous powders, con-
sisting of particles of different shapes, from almost ideal
spherical to highly irregular with different texture and surface
formations (Figure 1).
The chemical composition and physical properties of the
initial FA samples (Table 1) were close to previously reported
(Vassilev et al., 2001; Vassilev and Vassileva, 2009) values.
Particle size analyses showed that the FAs had a quite
inhomogeneous composition, which, in addition to the com-
plicated hydrodynamics of the magnetic separation process,
made the available magnetic separation models (Svoboda,
2004) inapplicable, and the results of the separation difficult
to predict. According to the number statistics, all the samples
consisted exclusively (>99.9%) of respirable size particles
(<10 mm) and predominantly (>80%) of submicron particles.
The mineralogical composition of the three FAs studied
was complicated, but in general it matched the theoretical
expectations based on the composition of parent coals and
burning regimes (Mitchell and Gluskoter, 1976; Hatt
and Bull, 1990; Vassilev and Vassileva, 1996; Vassilev
et al., 1996; Jak et al., 1998; Demir et al., 2001). The main
iron-bearing crystal phases in FAs were impure maghemite,
hematite and Ca-Fe oxide. Unfortunately, the low-intensity
and overlapping of characteristic peaks of magnetite, and
maghemite complicated their definitive recognition and
quantitative determination by XRD (Figure 2). That is the
reason why, although the sets of peaks in obtained
XRD-patterns fitted better to maghemite, it could be
assumed that impure magnetite was present in addition or
instead of it, because the Mossbauer spectroscopy (MoS)
(Figure 2) identified sextets with parameters closer to mag-
netite’s standard. This analysis showed that iron ions were in
third and second oxidation states, high-spin and octahedral
or tetrahedral coordination, but, unfortunately, it provided
only some approximate information about the mineralogy of
Fe-containing minerals, because some of the determined
parameters did not correspond exactly to those of the pure
mineral standards, but denoted the existence of non-stoichio-
metric iron compositions, solid solutions, partially substi-
tuted iron oxides, etc. That is why the most important
information extracted from the MoS was the relative
weight of ‘strongly magnetic’ (magnetite or maghemite),
‘weakly magnetic’ (hematite and goethite) and ‘non-mag-
netic’ (pyrite, Fe-bearing aluminosilicate crystal and glass
phases) iron compounds, estimated on the basis of the sum
Figure 1. SEM micrographs of fly ash particles FAM3 (a), FAR (b) and FARE (c).
Shoumkova 3
of the relative weights (g) of the corresponding partial com-
ponents. The obtained values are shown in Table 1 along
with the data for magnetic properties, estimated on the
basis of the magnetization curves (Figure 3).
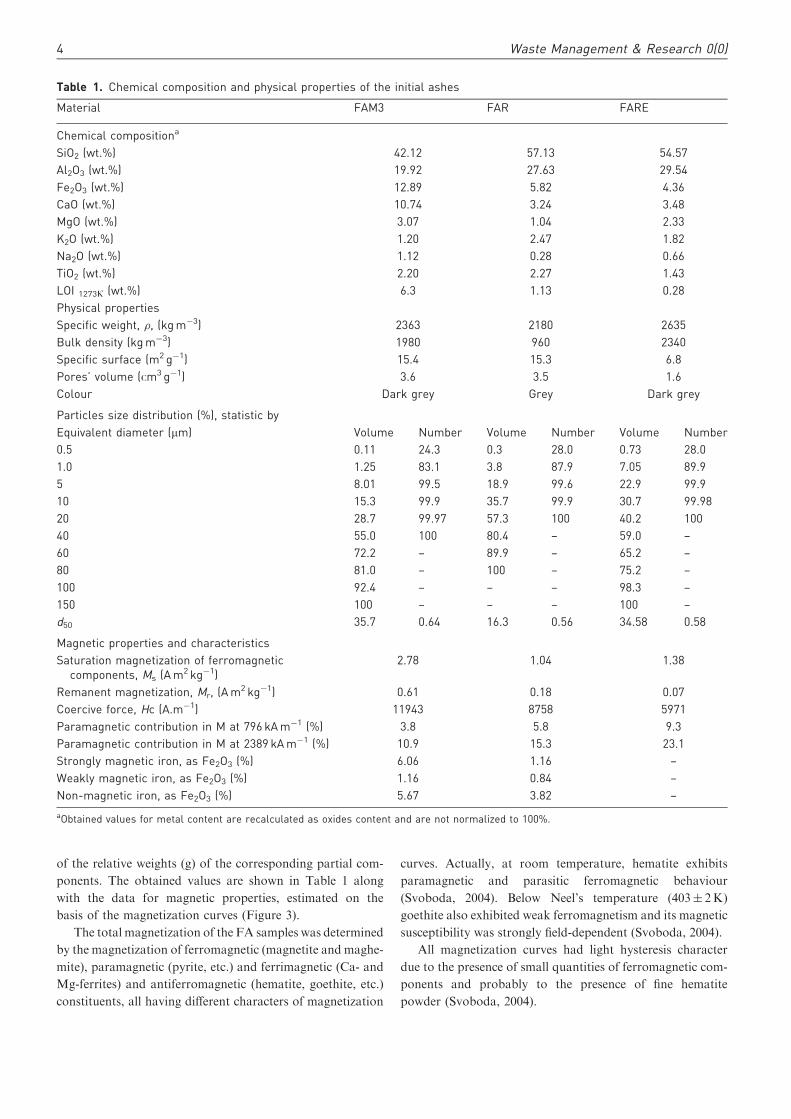
The total magnetization of the FA samples was determined
by the magnetization of ferromagnetic (magnetite and maghe-
mite), paramagnetic (pyrite, etc.) and ferrimagnetic (Ca- and
Mg-ferrites) and antiferromagnetic (hematite, goethite, etc.)
constituents, all having different characters of magnetization
curves. Actually, at room temperature, hematite exhibits
paramagnetic and parasitic ferromagnetic behaviour
(Svoboda, 2004). Below Neel’s temperature (403� 2K)
goethite also exhibited weak ferromagnetism and its magnetic
susceptibility was strongly field-dependent (Svoboda, 2004).
All magnetization curves had light hysteresis character
due to the presence of small quantities of ferromagnetic com-
ponents and probably to the presence of fine hematite
powder (Svoboda, 2004).
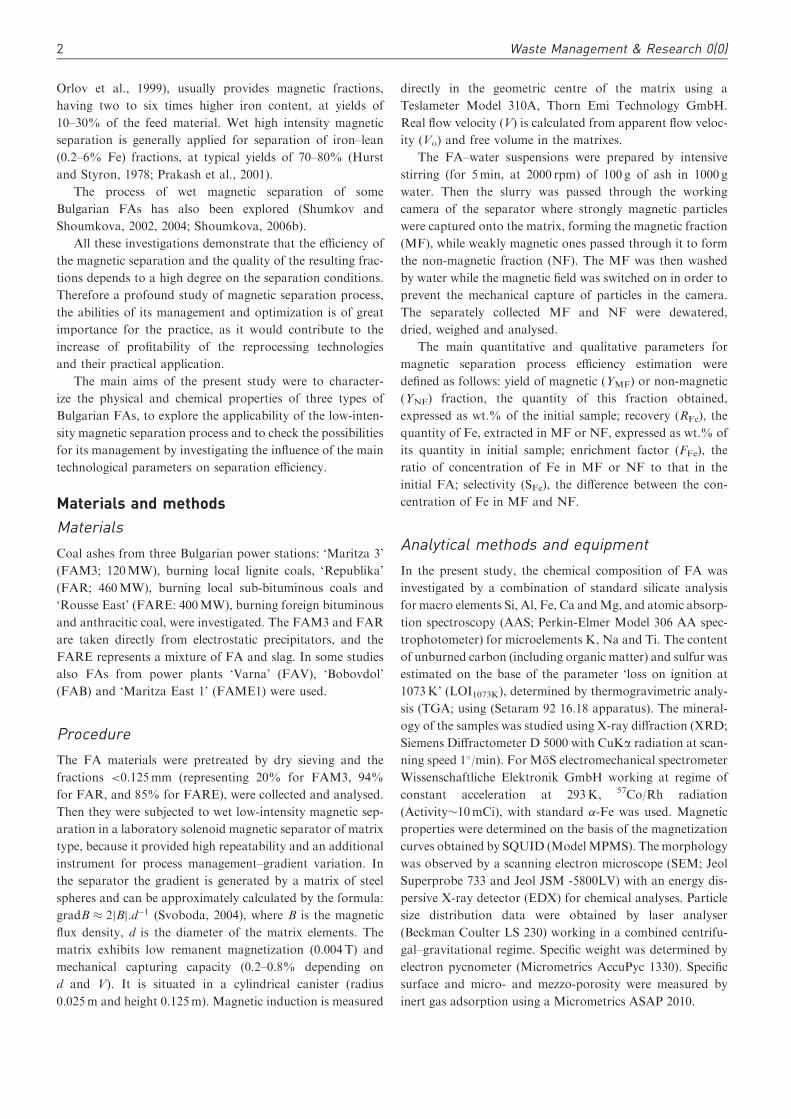
Table 1. Chemical composition and physical properties of the initial ashes
Material FAM3 FAR FARE
Chemical compositiona
SiO2 (wt.%) 42.12 57.13 54.57
Al2O3 (wt.%) 19.92 27.63 29.54
Fe2O3 (wt.%) 12.89 5.82 4.36
CaO (wt.%) 10.74 3.24 3.48
MgO (wt.%) 3.07 1.04 2.33
K2O (wt.%) 1.20 2.47 1.82
Na2O (wt.%) 1.12 0.28 0.66
TiO2 (wt.%) 2.20 2.27 1.43
LOI 1273J(wt.%) 6.3 1.13 0.28
Physical properties
Specific weight, �, (kg m�3) 2363 2180 2635
Bulk density (kg m�3) 1980 960 2340
Specific surface (m2 g�1) 15.4 15.3 6.8
Pores’ volume (pm3 g�1) 3.6 3.5 1.6
Colour Dark grey Grey Dark grey
Particles size distribution (%), statistic by
Equivalent diameter (mm) Volume Number Volume Number Volume Number
0.5 0.11 24.3 0.3 28.0 0.73 28.0
1.0 1.25 83.1 3.8 87.9 7.05 89.9
5 8.01 99.5 18.9 99.6 22.9 99.9
10 15.3 99.9 35.7 99.9 30.7 99.98
20 28.7 99.97 57.3 100 40.2 100
40 55.0 100 80.4 – 59.0 –
60 72.2 – 89.9 – 65.2 –
80 81.0 – 100 – 75.2 –
100 92.4 – – – 98.3 –
150 100 – – – 100 –
d50 35.7 0.64 16.3 0.56 34.58 0.58
Magnetic properties and characteristics
Saturation magnetization of ferromagneticcomponents, Ms (A m2 kg�1)
2.78 1.04 1.38
Remanent magnetization, Mr, (A m2 kg�1) 0.61 0.18 0.07
Coercive force, Hc (A.m�1) 11943 8758 5971
Paramagnetic contribution in M at 796 kA m�1 (%) 3.8 5.8 9.3
Paramagnetic contribution in M at 2389 kA m�1 (%) 10.9 15.3 23.1
Strongly magnetic iron, as Fe2O3 (%) 6.06 1.16 –
Weakly magnetic iron, as Fe2O3 (%) 1.16 0.84 –
Non-magnetic iron, as Fe2O3 (%) 5.67 3.82 –
aObtained values for metal content are recalculated as oxides content and are not normalized to 100%.
4 Waste Management & Research 0(0)
This made the correct measurement of magnetic suscep-
tibility of the samples extremely complicated, because
although the magnetic susceptibility of paramagnetic mate-
rials was independent of the magnetic field, paramagnetic
minerals containing admixtures of magnetically ordered min-
erals exhibited field-dependent magnetic susceptibility
(Svoboda, 2004). This phenomenon can seriously alter the
predictions for the results of magnetic separation based on
the field-independent magnetic susceptibility (Svoboda,
2004). That is why magnetic susceptibility is not discussed
in the investigation, but an attempt for approximate
evaluation of ferromagnetic and paramagnetic contributions
on specific magnetization has been made on the basis of the
data obtained (Table 1).
The maximum magnetization values and the widest hys-
teresis loop were observed for the FAM3 sample having the
highest iron content among the three FAs studied. The data
obtained now and previously, for another three Bulgarian
FAs, show almost linear (Figure 3) correlation between the
concentration of ferromagnetic iron and the saturation mag-
netizations (Ms). Only FAV was found to possess lower Ms
than the expected one, but since it consisted almost entirely
FAM3
(a)
(b)
QQ
Q
Q
Q Q Q Q Q Q
Q
A AA
A
C
C C
CFCF
CF
C
M
M M
M
MI
MI
MI MIMI MIMIMIMI
H
HH H H
H
FAR
FARE
FAM3 FAR
10
100
99
Rel
ativ
e tr
ansm
ittan
ce (
%)
98
97
96–10 –10 –5 0 5 10–8 –6 –4 –2
Velocity (mm s–1) Velocity (mm s–1)
0 2 4 6 8 10
20 30 402-theta-scale
50 60 70
Figure 2. (a) XRD patterns of FAM3, FAR and FARE. Legend: Q, quartz (SiO2); M, maghemite (g-Fe2O3); H, hematite(a-Fe2O3); C, calcite (CaCO3), A, Ca-Al silicate (Ca0.88Al1.77Si2.23O8); Ml, mullite (3Al2O3.2SiO2), CF, calcium iron oxide(CaO.FeO); (b) Mossbauer spectra of FAM3 and FAR. The curve passing through data points is a least-square fitcomposed of Lorentzian shaped components, drawn as lighter curves (3 sextets and 2 doublets for FAM3; 4 sextetsand 2 doublets for FAR).
Shoumkova 5
of spherical particles (Shoumkova, 2006a), this phenomenon
could be explained by the demagnetization effect of the par-
ticles’ shape.
Although in all of the fly ashes Ms was achieved at mag-
netic field strength of 700–800 kAm�1, actually, more than
90% of Ms was reached at about 240 kAm�1 which deter-
mined the applicability of the low-intensity magnetic separa-
tion process.
Magnetic separation results
The experimental conditions, yields and compositions of
some MF and NF are shown in Table 2.
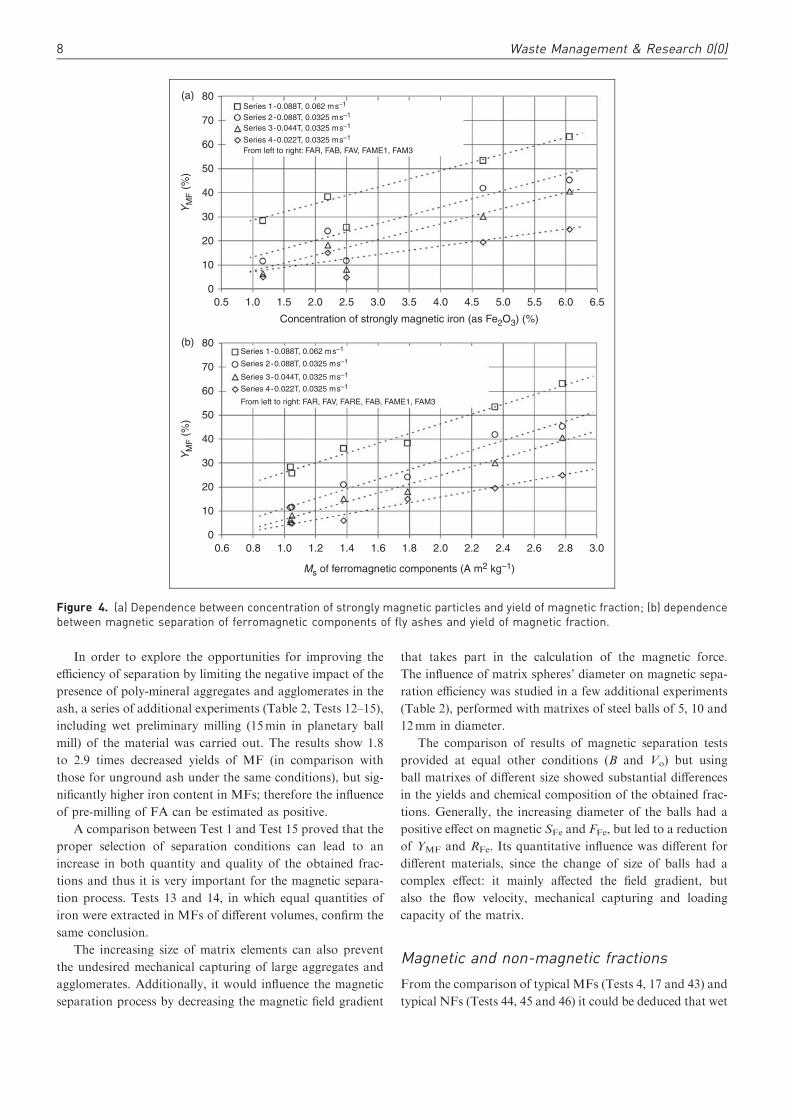
The comparison between some YMF obtained at similar
V/B ratio showed that only two pairs of experiments
(No.6–No.8 and No.9–No.45) confirm Svoboda’s (2004)
model, supposing that at equal other conditions the yield
of MF depends only on V/B. However, the data obtained
(Figure 4(a)) showed good correlation between the concentra-
tion of ferromagnetic iron andYMF for all sets of experimental
conditions. The dependences were quite similar to those
shown in Figure 3; again the values for FAV were much
lower than the expected ones. Figure 4(b) illustrates clearly
that for closer prediction of the YMF, the obtained data for
saturation magnetization (Ms) of ferromagnetic constituents
could be used.
The experimental data for all series separated in the inter-
val 0.022–0.088T showed that the increasing magnetic induc-
tion and/or the decreasing of flow velocity led to improving
RFe and the YMF, but at the expense of Fe2O3 content in the
MF. These dependencies have already been observed
(Shoumkova, 2006b) and could be explained by the fact
that at higher magnetic field intensity and gradient, the selec-
tivity of iron separation gets worse, owing to the retaining of
more weakly magnetic particles (having Fe< 25%) on the
matrix (proved by SEM-EDX for all FAs).
The comparison between the test pairs No.1–No.4 and
No.3–No.5 shows that MFs separated at the lowest B had
less Fe content, which could be explained by the supposition
that at such weak magnetic field the magnetic force acting on
the finest iron-rich particles was too small, while the hydrody-
namic force, being considerably stronger, led to their involve-
ment in the NF. This hypothesis is also confirmed by the
observation that the influence of the velocity on the yield of
MF was more significant at lower magnetic inductions. This
last statement was valid for all FAs, but to a different extent.
For all FA samples the highest selectivity and enrichment
factors were achieved at B¼ 0.022T and V¼ 0.325m s�1.
This observation matched the results from previous studies
(Shoumkova, 2006b), but generally, the magnetic separation
results were worse, as under the same conditions the Fe2O3
content in FAV, FAB and FAME1 were 36.3% (FFe¼ 4.2),
31.9% (FFe¼ 3.5) and 37.7% (FFe¼ 1.4), respectively. The
most likely reason for the low efficiency of separation of
FARE was the uniform distribution of iron in the volume
of material, proved by SEM-EDX studies. Another possible
reason for poor selectivity and low level of extraction was the
presence of large amounts of Fe, incorporated in the glass
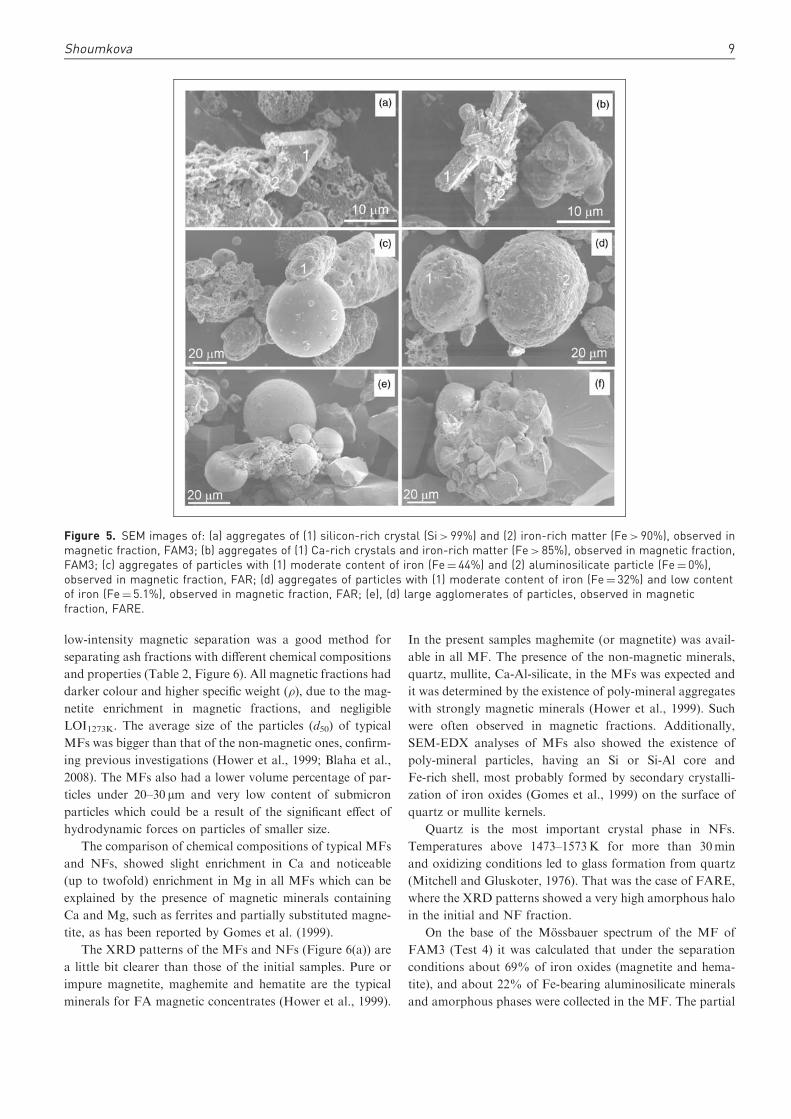
phases. Additional negative impact on magnetic separation
of all FAs may be associated with the presence of agglomer-
ates and aggregates of phases, rich and poor in iron,
observed by SEM-EDX in all samples (Figure 5).
4.0(a) (b)
FAM3
FARE
FAR
3.5
3.0
2.5
2.0
1.5
Sat
urat
ion
mag
netiz
atio
n of
ferr
omag
netic
com
pone
nts
(A m
2 kg
–1)
1.0
0.5
0.00.0 1.0 2.0 3.0 4.0
Concentration of strongly magneticiron (as Fe2O3) (%)
From left to right: FAR, FAB, FAME1, FAM3 OFAV
5.0 6.0 7.0 8.0
3.0
2.0
1.0
0.0
Mag
netiz
atio
n (A
m2
kg–1
)
–1.0
–2.0
–3.0
–4.0–3000 –2000 –1000 0
Magnetic field strength (kA m–1)
1000 2000 3000
Figure 3. (a) Magnetization curves, obtained at 293 K; (b) Saturation magnetization of ferromagnetic components as a functionof their concentration.
6 Waste Management & Research 0(0)
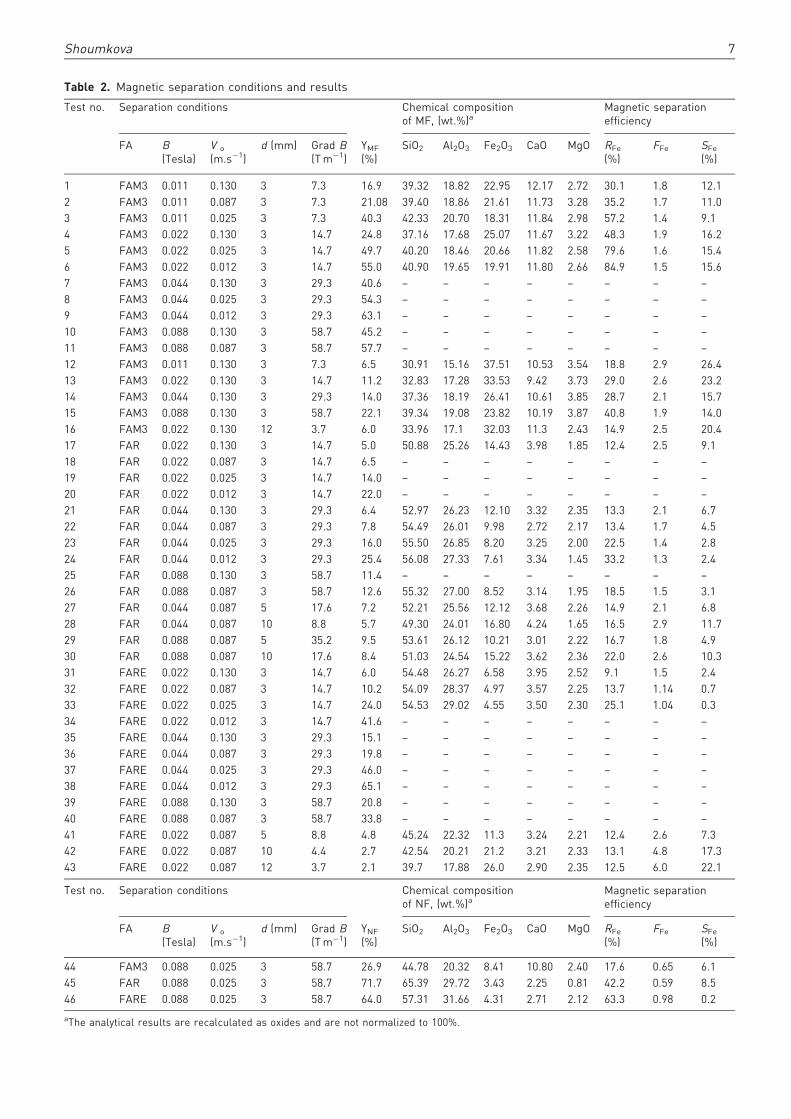
Table 2. Magnetic separation conditions and results
Test no. Separation conditions Chemical compositionof MF, (wt.%)a
aThe analytical results are recalculated as oxides and are not normalized to 100%.
Shoumkova 7
In order to explore the opportunities for improving the
efficiency of separation by limiting the negative impact of the
presence of poly-mineral aggregates and agglomerates in the
ash, a series of additional experiments (Table 2, Tests 12–15),
including wet preliminary milling (15min in planetary ball
mill) of the material was carried out. The results show 1.8
to 2.9 times decreased yields of MF (in comparison with
those for unground ash under the same conditions), but sig-
nificantly higher iron content in MFs; therefore the influence
of pre-milling of FA can be estimated as positive.
A comparison between Test 1 and Test 15 proved that the
proper selection of separation conditions can lead to an
increase in both quantity and quality of the obtained frac-
tions and thus it is very important for the magnetic separa-
tion process. Tests 13 and 14, in which equal quantities of
iron were extracted in MFs of different volumes, confirm the
same conclusion.
The increasing size of matrix elements can also prevent
the undesired mechanical capturing of large aggregates and
agglomerates. Additionally, it would influence the magnetic
separation process by decreasing the magnetic field gradient
that takes part in the calculation of the magnetic force.
The influence of matrix spheres’ diameter on magnetic sepa-
ration efficiency was studied in a few additional experiments
(Table 2), performed with matrixes of steel balls of 5, 10 and
12mm in diameter.
The comparison of results of magnetic separation tests
provided at equal other conditions (B and Vo) but using
ball matrixes of different size showed substantial differences
in the yields and chemical composition of the obtained frac-
tions. Generally, the increasing diameter of the balls had a
positive effect on magnetic SFe and FFe, but led to a reduction
of YMF and RFe. Its quantitative influence was different for
different materials, since the change of size of balls had a
complex effect: it mainly affected the field gradient, but
also the flow velocity, mechanical capturing and loading
capacity of the matrix.
Magnetic and non-magnetic fractions
From the comparison of typical MFs (Tests 4, 17 and 43) and
typical NFs (Tests 44, 45 and 46) it could be deduced that wet
80
Series 2-0.088T, 0.0325 ms–1Series 1-0.088T, 0.062 ms–1
Series 3-0.044T, 0.0325 ms–1
From left to right: FAR, FAB, FAV, FAME1, FAM3Series 4-0.022T, 0.0325 ms–1
70
60
50
40Y
MF (
%)
30
20
10
00.5 1.0 1.5 2.0 2.5 3.0 3.5
Concentration of strongly magnetic iron (as Fe2O3) (%)
4.0 4.5 5.0 5.5 6.0 6.5
80
Series 2-0.088T, 0.0325 ms–1
Series 1-0.088T, 0.062 ms–1
Series 3-0.044T, 0.0325 ms–1
From left to right: FAR, FAV, FARE, FAB, FAME1, FAM3
Series 4-0.022T, 0.0325 ms–1
70
60
50
40
YM
F (
%)
30
20
10
00.6 0.8 1.0 1.2 1.4 1.6 1.8
Ms of ferromagnetic components (A m2 kg–1)
2.0 2.2 2.4 2.6 2.8 3.0
(a)
(b)
Figure 4. (a) Dependence between concentration of strongly magnetic particles and yield of magnetic fraction; (b) dependencebetween magnetic separation of ferromagnetic components of fly ashes and yield of magnetic fraction.
8 Waste Management & Research 0(0)
low-intensity magnetic separation was a good method for
separating ash fractions with different chemical compositions
and properties (Table 2, Figure 6). All magnetic fractions had
darker colour and higher specific weight (�), due to the mag-
netite enrichment in magnetic fractions, and negligible
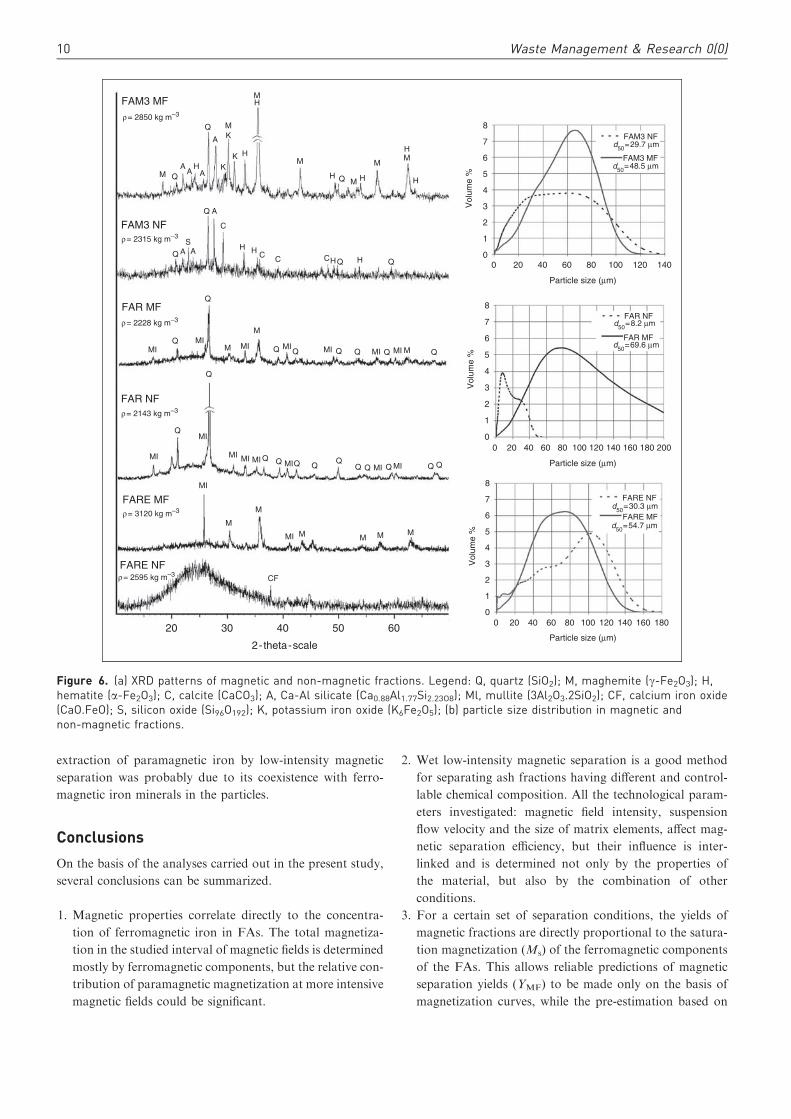
LOI1273K. The average size of the particles (d50) of typical
MFs was bigger than that of the non-magnetic ones, confirm-
ing previous investigations (Hower et al., 1999; Blaha et al.,
2008). The MFs also had a lower volume percentage of par-
ticles under 20–30 mm and very low content of submicron
particles which could be a result of the significant effect of
hydrodynamic forces on particles of smaller size.
The comparison of chemical compositions of typical MFs
and NFs, showed slight enrichment in Ca and noticeable
(up to twofold) enrichment in Mg in all MFs which can be
explained by the presence of magnetic minerals containing
Ca and Mg, such as ferrites and partially substituted magne-
tite, as has been reported by Gomes et al. (1999).
The XRD patterns of the MFs and NFs (Figure 6(a)) are
a little bit clearer than those of the initial samples. Pure or
impure magnetite, maghemite and hematite are the typical
minerals for FA magnetic concentrates (Hower et al., 1999).
In the present samples maghemite (or magnetite) was avail-
able in all MF. The presence of the non-magnetic minerals,
quartz, mullite, Ca-Al-silicate, in the MFs was expected and
it was determined by the existence of poly-mineral aggregates
with strongly magnetic minerals (Hower et al., 1999). Such
were often observed in magnetic fractions. Additionally,
SEM-EDX analyses of MFs also showed the existence of
poly-mineral particles, having an Si or Si-Al core and
Fe-rich shell, most probably formed by secondary crystalli-
zation of iron oxides (Gomes et al., 1999) on the surface of
quartz or mullite kernels.
Quartz is the most important crystal phase in NFs.
Temperatures above 1473–1573K for more than 30min
and oxidizing conditions led to glass formation from quartz
(Mitchell and Gluskoter, 1976). That was the case of FARE,
where the XRD patterns showed a very high amorphous halo
in the initial and NF fraction.
On the base of the Mossbauer spectrum of the MF of
FAM3 (Test 4) it was calculated that under the separation
conditions about 69% of iron oxides (magnetite and hema-
tite), and about 22% of Fe-bearing aluminosilicate minerals
and amorphous phases were collected in the MF. The partial
Figure 5. SEM images of: (a) aggregates of (1) silicon-rich crystal (Si> 99%) and (2) iron-rich matter (Fe> 90%), observed inmagnetic fraction, FAM3; (b) aggregates of (1) Ca-rich crystals and iron-rich matter (Fe> 85%), observed in magnetic fraction,FAM3; (c) aggregates of particles with (1) moderate content of iron (Fe¼ 44%) and (2) aluminosilicate particle (Fe¼ 0%),observed in magnetic fraction, FAR; (d) aggregates of particles with (1) moderate content of iron (Fe¼ 32%) and low contentof iron (Fe¼ 5.1%), observed in magnetic fraction, FAR; (e), (d) large agglomerates of particles, observed in magneticfraction, FARE.
Shoumkova 9
extraction of paramagnetic iron by low-intensity magnetic
separation was probably due to its coexistence with ferro-
magnetic iron minerals in the particles.
Conclusions
On the basis of the analyses carried out in the present study,
several conclusions can be summarized.
1. Magnetic properties correlate directly to the concentra-
tion of ferromagnetic iron in FAs. The total magnetiza-
tion in the studied interval of magnetic fields is determined
mostly by ferromagnetic components, but the relative con-
tribution of paramagnetic magnetization at more intensive
magnetic fields could be significant.
2. Wet low-intensity magnetic separation is a good method
for separating ash fractions having different and control-
lable chemical composition. All the technological param-
eters investigated: magnetic field intensity, suspension
flow velocity and the size of matrix elements, affect mag-
netic separation efficiency, but their influence is inter-
linked and is determined not only by the properties of
the material, but also by the combination of other
conditions.
3. For a certain set of separation conditions, the yields of
magnetic fractions are directly proportional to the satura-
tion magnetization (Ms) of the ferromagnetic components
of the FAs. This allows reliable predictions of magnetic
separation yields (YMF) to be made only on the basis of
magnetization curves, while the pre-estimation based on
FAM3 MF
M
M
M
M
M
M
M M M M
AA
A A
A
S
C
C C C
A
A K
KK
Q
Q
Q
QMI
MI
MI
MI
MI
MI
CF
MI MI MI MI MI
MIMI MI MI MI MIQ Q
QQQQQQ
QQQQ
Q
Q
Q Q Q Q
Q
Q Q
Q
Q
M
MH
M
M
MM
8
7
6
5
4
Vol
ume
%
3
2
1
00 20 40 60 80
Particle size (mm)
100 120
FAM3 NF
FAM3 MF
d50=29.7 mm
d50=48.5 mm
FAR NF
FAR MF
d50=8.2 mm
d50=69.6 mm
FARE NF
FARE MFd50=30.3 mm
d50=54.7 mm
140
8
7
6
5
4
Vol
ume
%
3
2
1
00 20 40 60 80 100 120
Particle size (mm)
140 160 180 200
8
7
6
5
4
Vol
ume
%
3
2
1
00 20 40 60 80 100 120
Particle size (mm)
140 160 180
H
H
HH
H
H
H HHH
r= 2850 kg m–3
FAM3 NFr= 2315 kg m–3
FAR NFr= 2143 kg m–3
FAR MFr= 2228 kg m–3
FARE MF
20 30 40
2-theta-scale
50 60
r= 3120 kg m–3
FARE NFr= 2595 kg m–3
Figure 6. (a) XRD patterns of magnetic and non-magnetic fractions. Legend: Q, quartz (SiO2); M, maghemite (g-Fe2O3); H,hematite (a-Fe2O3); C, calcite (CaCO3); A, Ca-Al silicate (Ca0.88Al1.77Si2.23O8); Ml, mullite (3Al2O3.2SiO2); CF, calcium iron oxide(CaO.FeO); S, silicon oxide (Si96O192); K, potassium iron oxide (K6Fe2O5); (b) particle size distribution in magnetic andnon-magnetic fractions.
10 Waste Management & Research 0(0)
the concentrations of ferromagnetic components could
sometimes be less accurate.
4. The concentrations of iron in the richest magnetic
concentrates obtained for FAM3, FAR and FARE
respectively were 37.5% (RFe¼ 18.8%, SFe¼ 26.4%),
16.8% (RFe¼ 16.5%, SFe¼ 11.7%) and 26% (RFe¼
12.5%, SFe¼ 22.1%). Although these results are not sat-
isfactory enough for the direct utilization of MFs as iron-
bearing raw materials, the additional tests indicated that
after further optimization of the separation conditions,
small yields of higher grade magnetic concentrates could
be obtained.
5. The observations indicate that the mineralogical compo-
sition and the distribution of minerals in particles are fun-
damental parameters in the determination of the
applicability of magnetic separation. The main factors
limiting the process are: (1) the presence of paramagnetic
Fe-containing mineral and amorphous matter; (2) the
existence of poly-mineral particles and the existence of
aggregates of magnetic and non-magnetic particles. The
first factor cannot be managed, but its influence can be
pre-estimated on the base of chemical, XRD and MoS
analyses. The second factor can be affected by the appli-
cation of appropriate pre-treatment (seeding, grinding,
physical or chemical de-agglomeration, etc.). It was exper-
imentally proven that the negative effect of both factors
could be considerably limited by the selection of proper
sets of separation conditions.
6. For the extraction of more concentrated iron fractions,
further optimization should be performed at low magnetic
field induction 0.01<B< 0.02T, high suspension flow
velocity (0.2<V< 0.4m s�1), moderate field gradients
(3<GradB< 30Tm�1), and suitable pre-treatment.
Acknowledgements
Part of the reported data have been included in the PhD thesis,‘High gradient magnetic separation of coal fly ashes’(Shoumkova, 2006a, b) elaborated at the University of
Chemical Technology and Metallurgy, Sofia, Bulgaria, withthe kind support of Professor Dr I. Grancharov and AssociateProfessor Dr S. Shumkov.
The help of the Institut de Materiaux Jean Roxel (Nantes,
France) – Laboratoire de Physique Cristalline for the analysesof physical properties, XRD, MoS and microscopic studies isgreatly appreciated.
List of frequently used abbreviationsand acronyms
AAS atomic absorption spectroscopy
EDX energy dispersive X-ray detector
FA fly ash
FAB fly ash from TPS ‘Bobov dol’
FAM3 fly ash from TPS ‘Maritza 3’
FAME1 fly ash from TPS ‘Maritza East 1’
FAR fly ash from TPS ‘Repulika’
FARE fly ash from TPS ‘Rousse East’
FAV fly ash from TPS ‘Varna’
LOI1073K loss on ignition at 1073K
MF magnetic fraction
MoS Mossbauer spectroscopy
NF non-magnetic fraction
SEM scanning electron microscope
SQUID superconducting quantum interference device
TGA thermogravimetric analysis
TPS thermopower station
XRD X-ray diffraction
References
Aldrich RG (1984) Separation of high grade magnetite from fly ash, US
Patent 4432868.
Baitenev N and Murzaeva G (1984) Magnetic concentrate preparation
from Ekibaztus’s ash. Kompleksnoe Izpolzovanie Mineralnovo Suirja
7: 36–38. (, (in Russian).
Bayat O (1998) Characterisation of Turkish fly ashes. Fuel 77:
1059–1066.
Blaha U, Sapkota B, Appel E, Stanjek H and Rosler W (2008)
Micro-scale grain-size analysis and magnetic properties of
coal-fired power plant fly ash and its relevance for environmen-
tal magnetic pollution studies. Atmospheric Environment 42:
8359–8370.
Boybay M and Demirel T (1982) Process for preparing cryolite from fly
ash, US Patent 4362703.
Brown JW. (1980) Process for recovering magnetite from fly ash. US
Patent 4191336.
Cohen J and Mercier H (1976) Recovery of alumina from non-bauxite
aluminium-bearing raw materials. Light Metals 2: 3–18.
Demir I, Hughes RE and DeMaris PJ (2001) Formation and use of coal
combustion residues from three types of power plants burning
Illinois coals. Fuel 80: 1659–1673.
Dobbins MS and Murtha MJ (1983) Recovery of iron oxide from coal
fly ash. US Patent 4386057.
Gomes S, FrancoisM, AbdelmoulaM, Refait PH, Pellissier C and Evrard
O (1999) Characterization of magnetite in silico-aluminous fly ash by
SEM, TEM, XRD, magnetic susceptibility, and Mossbauer spectros-
copy. Cement and Concrete Research 29: 1705–1711.
Goodarzi F (2006) Characteristics and composition of fly ash from
Canadian coal-fired power plants. Fuel 85: 1418–1427.
Hatt RM and Bull DL (1990) Mineral Matter and Ash Deposition from
Coal. In: Bryers R and Vorres K (eds.), New York, USA:
Engineering Foundation.
Hower JC, Rathbone RF, Robertson JD, Peterson G and Trimble AS
(1999) Petrology, mineralogy, and chemistry of magnetically-
separated sized fly ash. Fuel 78: 197–203.
Hurst VJ and Styron RW. (1978) Fly ash beneficiation process. US
Patent 4121945.
Hwang JY (1993) Wet process for fly ash beneficiation. US Patent
5227047.
Iyer RS and Scott JA (2001) Power station fly ash - a review of value-
added utilization outside of the construction industry. Resources
Conservation and Recycling 31: 217–228.
Jak E, Degterov S, Hayes PC and Pelton AD (1998) Thermodynamic
modelling of the system Al2O3–SiO2–CaO–FeO–Fe2O3 to predict the
flux requirements for coal ash slags. Fuel 77: 77–84.
Kostakis G (2009) Characterization of the fly ashes from the lignite
burning power plants of northern Greece based on their quantitative
mineralogical composition. Journal of Hazardous Materials 166:
972–977.
McDowell WJ and Seeley FG (1981) Recovery of aluminum and other
metal values from fly ash, US Patent 4252777.
Shoumkova 11
Mitchell RS and Gluskoter HJ (1976) Mineralogy of ash of some
American coals: Variations with temperature and source. Fuel 55:
90–96.
Molina A and Poole C (2004) A comparative study using two methods
to produce zeolites from fly ash. Minerals Engineering 17: 167–173.
Murtha MJ and Burnet G (1978) The magnetic fraction of coal fly ash:
its separation, properties, and utilization. Proceedings of Iowa
Academy of Science 85: 10–13.
Orlov S, Entelis I, and Smirnoff B (1999) Method of iron concentrates
preparation. RU 2148093.
Papp Z, Dezs Z and Daroczy S (2002) Significant radioactive contami-
nation of soil around a coal-fired thermal power plant. Journal of
Environmental Radioactivity 59: 191–205.
Paya J, Monzo J, Borrachero MV and Peris-Mora E (1996)
Comparisons among magnetic and non-magnetic fly ash fractions:
Strength development of cement-fly ash mortars. Waste Management
16: 119–124.
Prakash S, Mohanty JK, Dass B and Venugopal R (2001)
Characterisation and removal of iron from fly ash of talcher area,
Orissa, India. Minerals Engineering 14: 123–126.
Shoumkova AS (2006a) Physico-chemical characterization and magnetic
separation of coal fly ash from ‘V‘rna’, ‘Bobov dol’ and ‘Maritza-
East I’ power plants, Bulgaria, Part I Physico-chemical characteriza-
tion. Journal of the University of Chemical Technology and
Metallurgy 41: 175–180.
Shoumkova AS (2006b) Physico-chemical characterization and magnetic
separation of coal fly ash from ‘V‘rna’, ‘Bobov dol’ and ‘Maritza-
East I’ power plants, Bulgaria, Part II Magnetic separation. Journal
of the University of Chemical Technology and Metallurgy 41: 181–186.
Shumkov S and Shoumkova A (2002) Magnetic separation of coal fly
ash. Journal of the University of Chemical Technology and Metallurgy
35: 565–570.
Shumkov SH and Shoumkova AS (2004) Magnetochemical treatment of
coal fly ash. Bulgarian Chemistry and Industry 75: 37–40.
Sripriya R, Rao PVT, Bapat JP, Singh NP and Das P (2003)
Development of an alternative to magnetite for use as heavy media
in coal washeries. International Journal of Mineral Processing 71:
55–71.
Styron RW and Abiodun KS (2001) Method of making mineral filler
and pozzolan product from fly ash, US Patent 6242098.
Svoboda J (2004) Magnetic Methods for the Treatment of Minerals.
Kluwer Academic Publishers. Dordrecht, The Netherlands.
Turner R (1981) Oxidation state of arsenic in coal ash leachate.
Environmental Science and Technology 15: 1062–1065.
Vassilev S, Eskenazy G and Vassileva C (1996) Occurrence, abundance
and origin of minerals in coals and coal ashes. Fuel Processing
Technology 48: 85–106.
Vassilev S, Eskenazy G and Vassileva C (2001) Behavior of elements and
minerals during preparation and combustion of the Pernik coal,
Bulgaria. Fuel Processing Technology 72: 103–129.
Vassilev S and Vassileva C (1996) Mineralogy of combustion wastes
from coal-fired power stations. Fuel Processing Technology 47:
261–280.
Vassilev S and Vassileva C (2009) A new approach for the combined
chemical and mineral classification of the inorganic matter in coal. 1.
Chemical and mineral classification systems. Fuel 88: 235–245.