38
WMRC Reports Waste Management and Research Center Oil Waste Reduction and Recycling Pilot Test Tim Lindsey Tony Montemurro University of Illinois TN94-038 May, 1994 Electronic Version

WMRC Reports Waste Management and Research Center
Oil Waste Reduction and
Recycling Pilot Test
Tim Lindsey
Tony Montemurro
University of Illinois
TN94-038
May, 1994
Electronic Version

About WMRC's Electronic Publications:
This document was originally published in a traditional format.
It has been transferred to an electronic format to allow faster and broader access to important
information and data.
While the Center makes every effort to maintain a level of quality during the transfer from print
to digital format, it is possible that minor formatting and typographical inconsistencies will still
exist in this document.
Additionally, due to the constraints of the electronic format chosen, page numbering will vary
slightly from the original document.
The original, printed version of this document may still be available.
Please contact WMRC for more information:
WMRC One E. Hazelwood Drive Champaign, IL 61820 217-333-8940 (phone)
www.wmrc.uiuc.edu
·�':'�C_
DEPARTMENT OF
NATU RAL RESOURCES
WMRC is a division of the
Illinois Department of Natural
Resources

Oily Waste Reduction and
Recycling Pilot Test
by
Timothy C. Lindsey
HWRIC TN94-038
Hazardous Waste Research and Information Center
One East Hazelwood Drive
Champaign, IL 61820
and
Tony Montemurro
Outboard Marine Corporation
200 Sea-Horse Drive
Waukegan, IL 60085
Prepared for
Hazardous Waste Research and Information Center
One East Hazelwood Drive
Champaign, Illinois 61820
HWRIC Project Number RRT-17
Printed by Authority of the State of Illinois
94/50

This report is part of HWRIC's Technical Report Series. Mention of trade names or
commercial products does not constitute endorsement or recommendation for use.

CONTENTS
Page Number
List of Tables . . . . . . . . . . . . . . . . . . . . . . . . . . . . . . . . . . . . . . . . . . . . . . iv
List of Figures . . . . . . . . . . . . . . . . . . . . . . . . . . . . . . . . . . . . . . . . . . . . . iv
Abstract .................................................. v
1.0 BACKGROUND . . . . . . . . . . . . . . . . . . . . . . . . . . . . . . . . . . . . . . . . 1
2.0 MATERIALS AND METHODS . . . . . . . . . . . . . . . . . . . . . . . . . . . . . . 4
2.1 Ultrafiltration Equipment . . . . . . . . . . . . . . . . . . . . . . . . . . . . . 4
2.2 Single Effect Mechanical Vapor Recompression Evaporator . . . . . . 4
2.3 Atmospheric Evaporator Bench Study . . . . . . . . . . . . . . . . . . . . 5
3.0 RESULTS AND DISCUSSION . . . . . . . . . . . . . . . . . . . . . . . . . . . . . . . 7
3.1 Raw Waste Characteristics . . . . . . . . . . . . . . . . . . . . . . . . . . . 7
3.2 Ultrafiltration Test Results . . . . . . . . . . . . . . . . . . . . . . . . . . . . 7
3.3 Pilot Evaporator Results . . . . . . . . . . . . . . . . . . . . . . . . . . . . . . 8
3.4 Bench Scale Atmospheric Evaporator Test Results ........... 10
3.5 Capital and Operating Cost ........................... 11
4.0 CONCLUSIONS AND RECOMMENDATIONS .................... 12
4. 1 Product Reuse .................................... 1 2
4. 2 System Comparison ................................ 1 2
Tables ................................................... 15
Figures .................................................. 2 2
iii

TABLE 1 1992 PROJECT EVENTS
TABLE 2 ANALYTICAL RESULTS
TABLES
TABLE 3 UF CAPITAL AND OPERATING COST SUMMARY
TABLE 4 MECHANICAL RECOMPRESSION EVAPORATOR CAPITAL AND
OPERATING COST SUMMARY
TABLE 5 ATMOSPHERIC EVAPORATOR CAPITAL AND OPERATING COST
SUMMARY
FIGURES
FIGURE 1 UL TRAFIL TRATION SCHEMATIC
FIGURE 2 UL TRAFIL TER FLUX VERSUS DAYS OF OPERATION
FIGURE 3 PERMEATE/DISTILLATE OIL AND GREASE VERSUS DAYS OF
OPERATION
FIGURE 4 PERMEATE/DISTILLATE COD VERSUS DA VS OF OPERATION
FIGURE 5 PERMEATE/DISTILLATE TDS VERSUS DA VS OF OPERATION
FIGURE 6 PERMEATE/DISTILLATE TOC VERSUS DAYS OF OPERATION
FIGURE 7 RAW FEED WATER QUALITY VERSUS DAYS OF OPERATION
FIGURE 8 A COMPARISON OF CAPITAL AND OPERATING COSTS
FIGURE 9 UL TRAFILTRATION MASS BALANCE
FIGURE 10 VAPOR RECOMPRESSION MASS BALANCE
iv

ABSTRACT
Triad Engineering under the direction of the Illinois Hazardous Waste Research
and Information Center (HWRIC) conducted a study comparing ultrafiltration and vapor
recompression recovery technologies on the water soluble die lubricant (die lube)
waste produced at the OMC Waukegan facility. Water soluble die lube waste disposal
represents an annual disposal expense of approximately $123,000.
A side-by-side comparison of ultrafiltration technology and vapor recompression
technology was conducted for a period of 25 days. This period of time was
considered adequate to evaluate both technologies' ability to perform under normal
production conditions. The permeate quality from the ultrafiltration system was
generally somewhat poorer than the condensate from the vapor recompression
system. However, field trials utilizing both permeate and condensate from the
systems indicated they could be used in the water soluble die lube make up process.
Biological growth and sulfide odors would be a problem with both systems.
The capital costs and operation and maintenance costs of the ultrafiltration
system are slightly lower than the vapor recompression system for this application.
A single sample was also collected and evaluated using atmospheric evaporation. The
capital costs and operating costs for an atmospheric evaporation system are higher
than either the ultrafiltration or the vapor recompression system, primarily due to the
addition of a condenser system to recover distillate.
The payback period for the ultrafiltration system would be 1 . 19 years with an
annual savings after payback of $90,275 per year. The payback period for the vapor
recompression system would be 1 .48 years with an annual savings after payback of
$77,900 per year. The estimated payback period for the atmospheric evaporator
system would be 1.51 years with an annual savings after payback of $56,200 per
year.
V

1.0 BACKGROUND
Outboard Marine Corporation, identified four major categories of hazardous
waste sources within the OMC manufacturing facility in Waukegan, Illinois. These
sources included metal cleaning or treatment wastes, die cast oily wastes,
solvents/fuel, and other miscellaneous sources. Of these four sources, the die casting
operation was identified as the single largest contributor of waste material which
required special handling and disposal as specified under federal regulations for special
industrial or hazardous wastes.
The die casting operation generates wastes which include:
• Die lube water and sludge from sumps around die casting machines
• Oil sludge and hydraulic oils used within the hydraulic components
• Water soluble coolants
• Water soluble die lubricants
Water soluble die lubes are a mixture of 1 part concentrated die lubricant and
100 parts water. The concentrated die lubricant is 64% petroleum hydrocarbons,
26% oxidized polyethylene, 5% carbon and 5% silicone dioxide. The mixture is
sprayed on the die casting machine die to allow a clean release between the die and
the aluminum cast part.
Die lube is held in a large reservoir and supplied to each machine by means of
a distribution system. Repeated use causes the die lube to break down, reducing its
effectiveness as a release agent. Breakdown is both thermal and biological.
Other die casting materials which become a part of the die lube waste are water
soluble coolants (40% organic) die lube additives (14% organic, 10% inorganic),
phosphate ester hydraulic oils, and pigment grease (7% sulfonic acid, 1 % sulfuric
acid, 92% graphite/petroleum grease).
1

Approximately 4,000,000 pounds of die cast waste are generated per year,
which represents approximately 4 7 percent of the total waste produced at the
Waukegan facility. This waste is Toxicity Characteristic Leachate Procedure (TCLP)
hazardous for D028, D029, and D040 constituents. Disposal costs for die cast waste
amounted to $300,000 per year. The water soluble die lubricants accounted for 73
percent of the total volume (approximately 290,000 gallons), and 41 percent of the
die cast waste disposal cost ($123,000 per year). Based on the large disposal cost
and volume associated with the water soluble die lubricant waste, this stream was
targeted as an ideal candidate for waste minimization.
Ultrafiltration and evaporation were identified as potential techniques to
separate the spent soluble die lubricant material from the makeup water.
Ultrafiltration is a low pressure ( 10 to 1 50 psi) membrane process which separates
suspended solids and high molecular weight dissolved solids (such as oily emulsions)
from liquid.
Evaporation allows separation of multi-component mixtures due to differences
in vapor pressure. Lower boiling point components (including water) can be separated
from high boiling point compounds such as die lubricants. Both ultrafiltration and
evaporation can produce waste volume reductions exceeding 90 percent for many
dilute wastewaters while producing a reusable water phase.
In order to assess the effectiveness of these processes, OMC conducted a pilot
scale feasibility study under the Reduction and Recycling Techniques (RRT) matching
fund program offered by the Hazardous Waste Research and Information Center
(HWRIC). A pilot vacuum evaporation unit was supplied by the HWRIC, and OMC
obtained a pilot ultrafiltration unit from Koch-Abcor through its agent, Arbortech, Inc.
These pilot units were installed and operated by Triad over a six-week period from late
October to December 1992. Data obtained from the pilot study was used to
determine process feasibility along with capital and operating costs of similar full scale
equipment.
2

2.0 MATERIALS AND METHODS
2.1 Ultrafiltration Equipment
A Koch Membrane System Model 4F-4VA was installed in the OMC Waukegan
Die Casting Facility. The Model UF-4VA includes four 5-foot Abcor tubular
membranes, each with 1.1 square feet of membrane area. Based on bench scale
screening studies, HFP-276 hollow core membranes were selected due to their history
of producing good quality permeate from oily wastes at a high flux rate. The Model
UF-4VA also includes a 50-gallon process/cleaning tank, centrifugal recirculation
pump, permeate flowmeter, pressure gauges, high temperature and low pressure shut
off switches, control panel, pipe, valves, and interconnecting wiring. A schematic of
the UF system is shown in Figure 1.
Waste in the process tank is pumped through the ultrafilter at a high rate. A
small amount of flow is forced through the membranes due to the pressure gradient.
The filtered flow is referred to as the permeate. The bulk of the circulated liquid
(along with the rejected material) flows back to the process tank as concentrate. The
process tank was set up with a float switch which opened a feed valve to allow fresh
feed (spent water soluble die lubricant) into the tank as the liquid level dropped due
to the loss of permeate. A 500-gallon permeate storage tank was obtained to allow
continuous collection of permeate during the week.
The system was set for an operating pressure of 30 to 32 psig across the
membranes, with an outlet pressure of 10 to 11 psig. The membranes were cleaned
weekly (usually on Monday), utilizing the manufacturer's recommended cleaning
procedure. A 0. 1 percent alkaline soap solution was made up with warm water in the
process tank after removal of the concentrated process waste. The cleaning solution
was circulated for three to four hours, with the permeate directed into the process
tank. After cleaning, the ultrafilter was rinsed with cold tap water and drained. The
waste concentrate was then pumped back into the process tank for further treatment.
2.2 Single Effect Mechanical Vapor Recompression Evaporator
A LICON Model C-5 single effect mechanical vapor recompression evaporator
was installed adjacent to the ultrafilter. This evaporator utilizes electric heat to boil
wastewater at a reduced temperature and pressure. The vapor passes through a mist
eliminator and is cooled in the condenser. A vacuum is maintained by a venturi
3
eductor which also draws the vapor through the mist eliminator. Cooling water is
used on the cold side of the condenser, and is discharged after absorbing the latent
heat of the vapor.
Heat to the evaporator is generated by three electric heaters. Water is used as
the heat transfer medium, and is heated to 160° to 180°F and pumped through the
Bayonet Augmented Tube (BAT) at a flow rate of 10 to 15 gpm, and then returned
to the heating elements.
Cooling water (plant water) flows through the overhead condenser BAT heat
exchanger. A 3/8-inch branch provides cooling water to the distillate cooler. Cooling
water flow is controlled by setting a throttling valve in reference to flow indicator.
Make-up water is controlled by separate valves and referencing a second flow
indicator.
The distillate is recycled by a high pressure pump which operates the jet
eductor at a pressure of 35 to 40 psig. The eductor exhausts any non-condensable
gases along with condensate to the distillate tank. When the distillate level reaches
the top float switch in the distillate tank, a solenoid valve opens and allows high
quality distillate to flow to a 55-gallon holding tank. When the tank is pumped down,
a lower float switch is tripped, closing the solenoid valve. Should the distillate quality
be poor (as indicated by a high conductivity alarm), the distillate is directed to the feed
holding tank for re-processing until the high conductivity condition is cleared. A high
conductivity set point of 100 micromhos was selected.
The concentrate is recycled by a CPVC centrifugal pump which extracts
concentrate from the separator and evaporator shells. The mixture of the recycled
concentrate and the concentrate tank feed is vacuum transported back to the
evaporator shell at a rate of 0.3 to 0.6 gpm, or about three times the evaporation
rate. This high recirculation rate assures complete wetting of the tubes for good heat
transfer. The recycle flow rate is controlled by a throttling valve. The difference in
temperature between the vapor and the concentrate recycle indicates the boiling point
elevation (BPE).
2.3 Atmospheric Evaporator Bench Study
A two-gallon sample of soluble die lubricant waste was shipped to Samsco, Inc.
(a manufacturer of boiling-type evaporators) for their Evaporative Boil Assessment.
This technology is called an atmospheric evaporative concentrator. Water is
4

evaporated from the system by distillation at 21 2 degrees F. The waste sample is
concentrated by evaporation at the boiling point under atmospheric conditions. The
boiling sample is observed for tendencies such as foaming, solids precipitation, or
scaling which would be problematic at full scale. Changes in pH are measured, and
the final boiling temperature is noted, as is the ultimate volume reduction.
The Samsco evaporator can be used with or without a vapor condenser,
depending on the requirements regarding volatile organic emissions or the desire to
capture the water vapor for reuse. Because this study focused on the reuse of
recovered water, this technology was evaluated with the vapor condenser option.
5
3.0 RESULTS AND DISCUSSION
3.1 Raw Waste Characteristics
The raw soluble die lube waste was analyzed following each fill of the pilot
system feed holding tank, located in the die lube make-up area (See Table 2 and
Figure 5). The waste die lube had a fairly high organic content, as reflected in the
total organic carbon (TOC) content of 1970 mg/I (average). The chemical oxygen
demand (COD) was also quite high (3390 mg/I) due to the oxygen demand of the die
lube organic compounds. The total solids (TS) concentration was measured at 2000
mg/I, which is slightly higher than the TOC concentration. This would indicate that
a substantial portion of the solids in the waste die lube are organic in nature. The
total dissolved portion of the solids (TDS) averaged 1025 mg/I. All parameters except
TDS showed large variations during this study.
The oil and grease (I. R. Method) ranged from 80 mg/I to 3000 mg/I (average
of 870 mg/I). A strong sulfide odor was noticeable in the raw wastewater which may
be an indication of biological reduction of sulfates in the dilution water. A sulfide
concentration of 5 to 21 mg/I was measured (Table 2). Sulfides may also be
produced from the sulfonates and sulfates in the pigmented grease compounds.
3.2 Ultrafiltration Test Results
The pilot ultrafilter test results from October 30 through December 3 are
summarized in Table 2. The test results represent 25 days of operation, with a total
run time of approximately 360 hours. During this test period, the process tank
contents were supplemented with raw waste as the tank level dropped, and the
concentrated waste was never discarded. A total waste volume of 3,110 gallons was
processed which is equivalent to a 62: 1 concentration factor in a 50-gallon process
tank.
Figure 2 shows the variation in hydraulic flux rate through the 4.4 ft2 module.
The average flux rate was nearly 50 gpd/ft2 at ambient temperature. No significant
loss in flux was noted during the study provided adequate cleaning and maintenance
were provided. While the flux rate did drop to 30 gpd/ft2 at times, the alkaline
detergent cleaning procedure was effective at restoring the membrane permeability
by the removal of the fouling material. At the end of the study the membrane tubes
were removed and visually inspected. The membrane surfaces were quite clean and
7
there was no evidence of fouling or scaling. It is interesting to note that the initial bench scale membrane evaluation produced a flux rate of nearly 40 gpd/ff at ambient
temperature and a pressure of 18 psig. The measured flux rate tended to increase throughout the study.
The permeate quality is plotted versus days of operation in Figures 3 to 6. The
permeate was free of suspended solids, but was somewhat colored and had a sulfide odor. The sulfide concentration of the permeate was slightly lower than the raw
waste, and ranged from 2 to 4 mg/I. Figure 3 shows that oil and grease (I.R. Method) was quite low in the permeate, but fairly high COD and TOC residuals were present
as evidenced by Figures 4 and 6. Since ultrafiltration is not effective for low
molecular weight dissolved compounds, these organics (along with dissolved
inorganics) will pass through the membrane. The membrane will generally reject all chemical compounds in the molecular weigh range of 50,000 or higher. For example,
sulfide (molecular weight 38), generally passes through the membrane whereas oil and
grease are rejected.
The composition of the ultrafiltration concentrate is provided in Table 2
(UFCONC). As would be expected, there is an increase in COD and oil and grease in the concentrate as the study progressed. The TOC appeared to remain fairly
constant, but this may have been due to analytical difficulties caused by the presence of high levels of tar-like greases. In general, COD or oil and grease are better
parameters for monitoring the quality of the concentrate. It would appear that an oil and grease concentration of 2 to 3 percent is readily achievable in the process tank.
A final batch concentration step could be performed to further reduce the final disposal volume and to increase the organic content for enhanced fuel value as a
waste oil source.
3.3 Pilot Evaporator Results
The pilot evaporator test results are summarized in Table 2. The test results represent approximately 20 days of operation, with a total run time of 156 hours.
During this test period, the feed tank was automatically filled with raw waste as
condensate was produced, and the concentrated feed was never discarded. A total
waste volume of 275 gallons was processed, which is equivalent to a 40: 1 concentration factor in a 7-gallon feed tank.
An overall processing rate of 1.8 gal/hr was achieved during the study. The
processing rate appeared to be fairly uniform during the course of the study, with no
8
decline noted as would occur should there be fouling of the heat transfer media
{bayonet augmented tubes). The waste boiled without excessive foaming, and
general operation was trouble-free, though the overhead condenser temperature had
to be maintained above 118° to 120°F or the boiling wastes would rise up the vapor
tube and cause a high-level alarm shut-down.
The distillate quality is plotted versus days of operation in Figures 3 to 6. The
distillate was slightly gray in color, with negligible odor, though the sulfide
concentration was equivalent to that in the permeate. Sulfides, light fraction oils and
phenols will codistill with the water vapor.
While the distillate generally had lower levels of COD, TOC, and TDS than the
permeate, the oil and grease concentration often exceeded that of the permeate
{Figure 3). This may be explained by the loss of volatile material which is recovered
in the distillate. While the TDS of the distillate was generally quite low, the organic
carbon content {TOC) actually exceeded the TDS. This apparent anomaly can be
explained by the loss of volatile organics during the 104°C TDS drying step, thereby
yielding a misleadingly low TDS value. Based on the COD and TOC, the distillate
quality is good, but still contains a significant organic content. The evaporator
concentrate composition is shown in Table 2 {EVCONC).
In general, the evaporator concentrate has a greater TOC, COD, and oil and
grease content than the ultrafilter concentrate, due to the better separation of
contaminants in the evaporator. The COD:TOC ratio is more consistent
{approximately 2: 1) than in the ultrafilter concentrate. The heating of the concentrate
may have produced a waste more conducive to TOC analysis. Oil and grease
sampling was somewhat difficult due to the poor mixing conditions in the feed tank,
but a waste concentration of at least 3 percent oil and grease is achievable.
At the end of the study, the evaporator heating elements were removed and
inspected. The three heating tubes were severely fouled with a 1 /8-inch thick layer
of hard material, with an overlying layer of brown, tar-like paste which completely
occluded the space between the tubes in some areas. The foulant was very difficult
to remove by physical means such as scraping. No attempt was made to solvent
clean the tubes.
9

3.4 Bench Scale Atmospheric Evaporator Test Results
The bench scale atmospheric evaporator tests conducted by Samsco were
successful. A volume reduction of almost 99 percent was achieved (final volume of
13 ml with 1000 ml original sample size). Foaming was not problematic, and the pH
increased slightly from 6. 7 to 7. 6 during the test so that no alkaline pH adjustment
was necessary. A final boiling point elevation (BPE) of 5°(F) was noted. This 5° (F)
BPE was also noted in the pilot evaporator tests.
The final concentrate had a viscosity that appeared similar to water. The only
negative characteristic was the increase in chloride concentration from 98 ppm to
9800 ppm. Due to the chloride content, titanium is recommended as the materials
of construction. These construction materials increased the capital cost of equipment
significantly.
3.5 Capital and Operating Costs
The capital and operating costs for the three options (ultrafiltration, mechanical
vapor recompression evaporation, or atmospheric evaporation) are shown in Tables
3 to 5 and Figure 8. The design basis for options is as follows:
Treated Volume = 290,000 gal/yr
Daily Volume = 1,500 gal
Weekly Volume = 7,500 gal
Operating Days = 5 days/wk, 24 hr/day
Percent Downtime Allowance = 20%
Cooling Water Temperature (Max.) = 78°F Max Rise = 70°F
Natural Gas Cost = $ 2. 7 /million BTU
Cooling Water Cost = $4/1,000 gal
Hauling Cost of Concentrate = $0.5/gal
Operator Compensation and Benefits = $35,000/yr
While a single-stage vacuum evaporator from Licon was tested, a multi-stage
vapor recompression unit is costed to reduce operating costs and to eliminate the cost
of cooling water. A Samsco atmospheric evaporator with vapor recovery was costed.
It should be noted that two condensers for the Model 600, add $46,000 to the capital
cost and add about $1 7,400/year to the operating cost.
10
Finally, all three options assume that the tanks used in OMC's batch treatment
system could be reused in each option. The ultrafiltration unit had the lowest capital
and operating cost profile. Capital costs for the vapor recompression (VR) unit and
the atmospheric evaporator (AE) were approximately the same although the VR unit
O&M costs reflect the lower energy input required for the VR system.
11

4.0 CONCLUSIONS AND RECOMMENDATIONS
4.1 Product Reuse
Samples of the permeate and condensate were collected during the field trials
and provided to OMC for evaluation in water soluble die lubricant {die lube) makeup
tests. OMC personnel noted a slight discoloration and odor from the reuse water in
both the permeate and the distillate. However, all die casting operations utilizing
either the permeate or the concentrate proceeded normally and the die cast parts were
acceptable in appearance. It was noted that the die lube made from permeate caused
a dull, silver-like cast to the part.
As a result of this evaluation, OMC determined that both the permeate and
concentrate from the ultrafiltration process and the vapor recompression process
would be acceptable for reuse within the facility. It is apparent from the sulfide odor
that biological activity would be a problem for both permeate and condensate storage
and reuse. For this reason, it is recommended that these materials be stored in
aerated tanks until they would be made available for reuse.
4.2 System Comparison
Both the vapor recompression and ultrafiltration systems produced acceptable,
quality effluent which could be reused within the facility. The quality of effluent
produced by the vapor recompression system was superior in terms of COD, TDS, and
TOC pollutants. However, the permeate from the ultrafiltration system was superior
in terms of lower total oil and grease concentrations.
Attempts to analyze the performance of the UF and VR technologies using a
mass balance approach were not successful. Using the average raw feed {RAW-AV)
and permeate {PEAM-AV) or distillate {DISTILL-AV) values reported in Table 2 and the
UFCONC-11 or EVCONC-11 data, it should have been possible to calculate a mass
balance. Concentrate samples from the UF and VR systems taken on
December 3, 1992 {day 25), should represent the net accumulation of chemicals
during the study. A mass balance was calculated for oil and grease, TDS, TS, COD
and conductivity. The mass in the concentrate plus the mass in the distillate or
permeate rarely accounted for more than half the mass in the raw waste.
13

The differences may be attributable to the difficulty with obtaining
representative samples of the UF or VR concentrate. Since the raw waste and
permeate or concentrate were more homogeneous, average concentrations from these
waste streams were used to approximate how the wastes are partitioned.
Figures 9 and 10 are schematic depictions of UF and VR mass balance
analyses. The average raw, permeate and distillate analytical results were used to
calculate pounds of oil and grease, organic carbon, and dissolved solids generated by
each technology. Concentrate volumes were previously reported as concentration
factors recorded during the study. The concentration factor for UF is 62: 1. The
concentration factor for VR is 40: 1 . The pounds of waste reported for the
concentrate were calculated by subtracting the permeate from the raw waste.
Figures 9 and 10 illustrate the relative partitioning efficiency of these
technologies. A waste volume of 1000 gallons was selected for comparison
purposes. Although the concentration factors are significantly different, both UF and
VR are very efficient in concentrating the waste (16 gallons/I000 gallons for UF, 25
gallons/1000 gallons for VR). Both technologies were effective in removing oils and
grease from the water (99.2% for UF versus 98.4% for VR). The membrane
technology partitioned 17% of the organic carbon and 84% of the dissolved solids to
the permeate phase. Distillation partitioned 9. 7% of the organic carbon and only
2. 7% of the dissolved solids to the distillate. The lower partitioning efficiencies for
ultrafiltration are a reflection of the membranes' inability to reject low molecular
weight chemicals.
No mass balance analysis was attempted for the atmospheric evaporator
because the data represents a single, two-gallon sample trial run. That limited
sampling event was not considered adequate to allow a detailed partitioning
evaluation.
The ultrafiltration system membranes were unaffected by contaminants in the
water soluble die lube wastewater. They maintained a consistently high flux rate over
the period of the study and responded well to cleaning procedures. The vapor
recompression system developed a tar-like coating around the heating tubes. This
coating was difficult to remove and would represent an operation and maintenance
problem during long-term operation.
The ultrafiltration system had the lowest capital installed cost at $146,500.
Based on operation and maintenance estimates, it also had the lowest total O&M
14

costs of $32,725 per year. The ultrafiltration system would demonstrate a payback
period of 1.19 years and an annual savings after payback of $90,275.
The vapor recompression evaporator had an estimated capital cost of $182,500
with an annual operating and maintenance cost of $45,100 per year. A major portion
of this O&M cost was due to the estimated time required to clean fouling from the
tubes. The system payback would be approximately 1 .48 years with an annual
savings after payback of $77,900.
The atmospheric evaporating system was evaluated on a single-point basis, and
therefore, was not subjected to the same level of investigation as the ultrafiltration
and vapor recompression technologies. The estimated capital cost for the
atmospheric evaporator system was $185,200. The primary expense associated with
this system would be the use of titanium coils to prevent fouling and the additional
cost of the condenser coils to recover water vapor. This system was estimated to be
the most costly to operate and maintain at an annual cost of $66,800 per year. The
payback period of approximately the same as for the vapor recompression system at
1.51 years with an annual savings after payback of $56,200.
This study and the conclusions drawn from the data are site specific and should
not be interpreted as an endorsement or rejection of any of the technologies
evaluated. Similar testing should be conducted on-site prior to determining the
applicability of these systems to other facilities.
15

TABLES
Week No.1
Week No. 2
Week No. 3
Week No. 4
Week No. 5
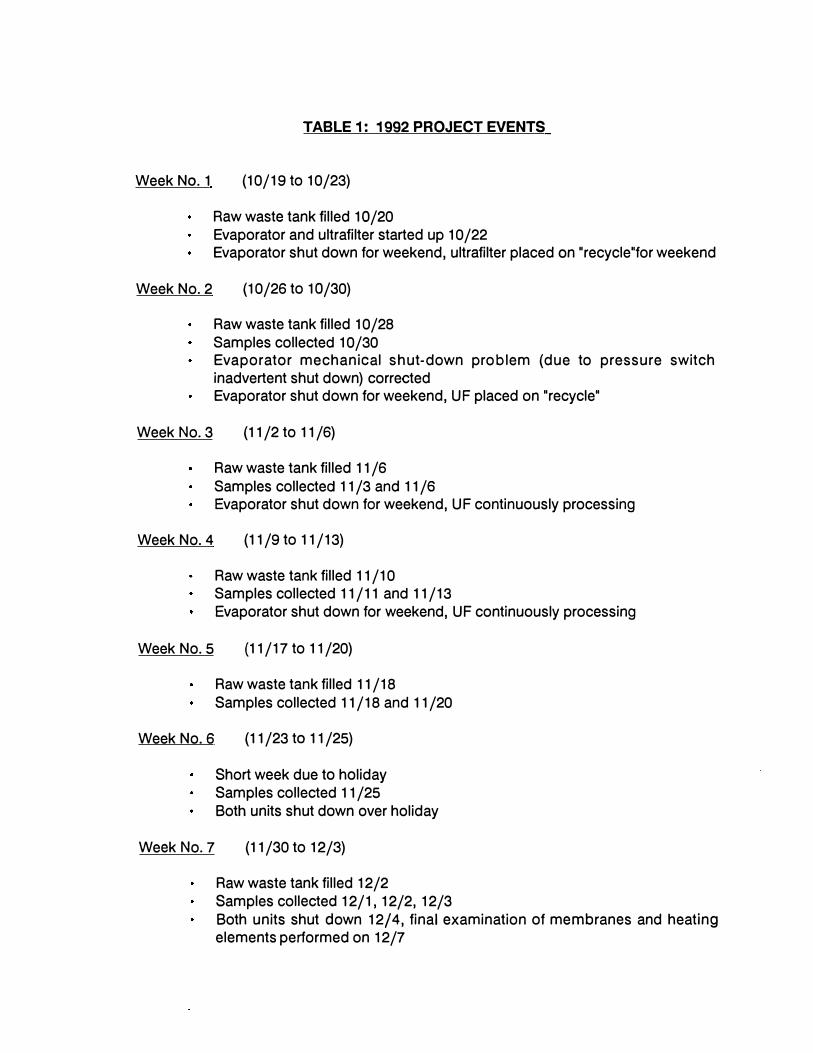
TABLE 1: 1992 PROJECT EVENTS
(10/19 to 10/23)
Raw waste tank filled 10/20 Evaporator and ultrafilter started up 10/22 Evaporator shut down for weekend, ultrafilter placed on "recycle"for weekend
(10/26 to 10/30)
Raw waste tank filled 10/28 Samples collected 10/30 Evaporator mechanical shut-down problem (due to pressure switch inadvertent shut down) corrected Evaporator shut down for weekend, UF placed on "recycle"
(11 /2 to 11 /6)
Raw waste tank filled 11 /6 Samples collected 11 /3 and 11 /6 Evaporator shut down for weekend, UF continuously processing
(11/9to 11/13)
Raw waste tank filled 11 /1 0 Samples collected 11 / 11 and 11 / 13 Evaporator shut down for weekend, UF continuously processing
{11/17to 11/20)
Raw waste tank filled 11 / 18 Samples collected 11 /18 and 11 /20
Week No. 6 (11 /23 to 11 /25)
Short week due to holiday Samples collected 11 /25
Week No. 7
Both units shut down over holiday
(11 /30 to 12/3)
Raw waste tank filled 12/2 Samples collected 12/1, 12/2, 12/3 Both units shut down 12/4, final examination of membranes and heating elements performed on 12/7

Sample ID
Raw-1 UFCONC-1 EVCONC-1 PERM-1 DISTILL-1
PERM-2
RAW-3 UFCONC-3 EVCONC-3 PERM-3 DISTILL-3
UFCONC-4 EVCONC-4 PERM-4 DISTILL-4
RAW-5 UFCONC-5 EVCONC-5 PERM-5 DISTILL-5
RAW-6 UFCONC-6 EVCONC-6 PERM-6 DISTILL-6
RAW-7 UFCONC-7 EVCONC-7 PERM-7 DISTILL-7
RAW-8 UFCONC-8 EVCONC-8 PERM-8 DISTILL-a
RAW-9 UFCONC-9 EVCONC-9 PERM-9 DISTILL-9
Date(1992)
10-3010-3010-3010-3010-30
11-3
11-611-611-611-611-6
11-1111-1111-1111-11
11-1311-1311-1311-1311-13
11-1811-1811-1811-1811-18
11-2011-2011-2011-2011-20
11-2511-2511-2511-2511-25
12-0112-0112-0112-0112-01
TABLE 2: ANALYTICAL RESULTS
O&G TS TOC COD Day _{Qp_ffi). _{Qp_ffi). _{Qp_ffi). um.ml
6 140 1,800 320 1,600 6 3,100 11,000 360 5,600 6 4,100 5,100 760 7,900 6 39 180 810 6 94 86 270
8 2
11 1,700 1,700 280 2,500 11 5,000 89,000 280 50,000 11 130 8,200 1,200 4,600 11 1.2 170 1,400 11 9.2 55 260
14 18,000 14 220 14 0.88 14 2.2
16 120 1,500 260 4,402 16 1,200 85,000 360 16,000 16 2,400 12,000 1,500 14,000 16 <0.5 130 550 16 4.3 49 91
18 400 3,500 860 6,400 18 6,700 79,000 570 38,000 18 9,900 47,000 1,600 9,700 18 1.2 140 680 18 2.8 55 230
20 80 1,500 830 1,300 20 1,500 25,000 3,300 21,000 20 11,000 23,000 3,900 26,000 20 0.91 310 650 20 4.0
21 360 1,900 4,300 3,000 21 3,200 58,000 3,000 15,000 21 6,600 25,000 15,000 29,000 21 2.0 1,200 430 21 4.4 82 430
23 240 1,800 4,000 3,300 23 7,000 20,000 2,600 20,000 23 6,800 20,000 18,000 38,000 23 1.7 1,700 670 23 1.6 1,100 600
TDS s COND
um.ml .{QQ!nl umho
1,100 18 1,000 2,200 1,200 3,800 260
980 1.6 700 <4 .81 80
1,000 21 1,200 32,000 5,600·
6,800 1,000 1,000 4.7 1,000
20 3.5 160
1,100 5.2 1,200 7,300 1,100 8,000 6,300
890 3.8 5,100 28 3.1 140
1,100 1,100 11,000 1,200
7,800 6,300 940 1,200
24 120
1,200 1,000 5,400 1,100 9,200 7,600
780 1,100
980 1,100 8,900 920 9,900 9,300
810 1,200 16 150
930 1,200 8,000 1,000 7,900 8,700
730 1,200 100 290

Sample ID
RAW-10 UFCONC-10 EVCONC-10 PERM-10 DISTILL-10
RAW-11 UFCONC-11 EVCONC-11 PERM-11 DISTILL-11
Date(1992)
12-0212-0212-0212-0212-02
12-03·12-0312-0312-0312-03
AVERAGE CONCENTRATIONS
RAW-AV PERM-AV DISTILL-AV
TABLE 2: ANALYTICAL RESULTS
O&G TS TOC COD Day __{QQ!!U. __{QQ!!U. JQQml .{QQm}_
24 1,800 2,700 3,300 6,100 24 3,300 60,000 23,000 62,000 24 8,200 27,000 16,000 34,000 24 14 1,200 610 24 7.5 560 370
25 3,000 1,600 3,600 3,100 25 23,000 74,000 2,300 17,000 25 34,000 49,000 17,000 30,000 25 16 1,300 270 25 15 540 320
871 2,000 1,542 3,522 7.7 633 674
14.5 355 403
TDS s COND
.{QQm}_ .{QQm}_ umho
880 1,200 4,900 1,200
10,000 8,400 820 1,200
<4.0 150
940 1,200 2,900 1,200
10,000 8,100 910 1,200
28 150
1,026 15 873 3.4 28 2.5

TABLE 3: UF CAPITAL AND OPERATING COST SUMMARY
Capital Costs
Design Flux = 35 gpd/tt2
Area = Normal 42 tt2
Select Unit = UF-70
Cost (No Process Tank} =
Assume: Installation = Mechanical = Electrical = Design Eng. = Constr. Mngt. = Contingency (10%} =
TOTAL
$36,000
$24,500 34,000 15,900 16,000 10,100 10,000
$146,500
Annual Operation and Maintenance Costs
Membrane Replacement, Chemicals, Electricity Operators (4 hours/day) Waste Disposal Costs (29,000 gpy)
TOTALO&M
System Payback
Payback Period ($146,500 + $123,000/yr) = Annual Savings After Payback =
$725/year 17,500/year 14,500/year
$32,725/year
1.19 years $90,275/year

TABLE 4: MECHANICAL RECOMPRESSION EVAPORATOR CAPITAL AND OPERATION COST SUMMARY
Capital Costs
Licon Model C-75 =
Assume: Installation = Mechanical = Design Eng. = Constr. Mngt. = Contingency (10%} =
TOTAL
$125,000 (1800 gpd)
$10,000 8,200
15,000 10,000 14,000
$182,500
Annual Operating and Maintenance Costs
Steam, Cooling Water, Electricity Operators (6 hours/day) Waste Disposal (29,000 gpy)
TOTAL
System Payback
Payback Period ($182,500 + $123,000/yr) = Annual Savings After Payback =
$4,350/year 26,250/year 14,500/year
$45, 100/year
1.48 years $77,900 /year

TABLE 5: ATMOSPHERIC EVAPORATOR CAPITAL
OPERATING AND COST SUMMARY
Capital Costs
Capital Costs $126,500 for (2) Model 600
Assume: Installation = Design Eng. = Constr. Mngt. = Contingency (10%) =
TOTAL
$18,200 11,000 12,500 17,000
$185,200
Annual Operating and Maintenance Costs
Energy, Cooling Water Operators (4 hours/day) Waste Disposal {29,000 gpy)
TOTAL
System Payback
Payback Period {$185,200 + $123,000/yr) = Annual Savings After Payback =
$34,800/year 17,500/year 14.500 /year
$66,800 /year
1.51 years $56,200/year

FIGURES

CONCENTRATE
RAW
WASTEWATER
PROCESS
TANK
UF
MEMBRANES_..
UFCONC
SAMPLE
RECIRCULATING
PUMP
PERM
SAMPLE
PERMEATE
PERMEATE
TANK
FIGURE 1: ULTRAFILTRATION SCHEMATIC

FIGURE 2: ULTRAFILTER FLUX VERSUS DAYS OF OPERATION
160
140
120
.:i= .
0-100 en
0.
0) 80-
Q)
a: 60X ::J
LL
40
20
0 -+-==�==F==�==-'--'r--"---"--'-''-"--'r-'-'-'-"'--"---"--r=--"--'--'--r-'--"-'----'-'--r'--"-'-"--'-'-"-"T-"-"-=�==�=�________,
1 3 5 7 9 11 13 15 1 7 19 21 23 25
Days of Operation

FIGURE 3: PERMEATE/DISTILLATE OIL AND GREASE VERSUS DAYS OF OPERATION
100.00 i1 111 · ... ········ ... ,, <• ., ., , •. , .•... ,.,, , • • , ,,, ,,,,.,,.,.,.,
I 80.00
Q)- 60.00
Cl)
ctS
(!J
C 40.00 ctS -
·-
20.00
0.00
6
Legend
-o- Permeate
8 10 12 14 16 18 20 22 24 26
Days of Operation

FIGURE 4: PERMEATE/DISTILLATE COD VERSUS DAYS OF OPERATION
1,600
1,400
1,200
1,000 --
- 8000
600
400
200
Legend
-o- Permeate
o F'' :1
6 8 10 12 14 16 18 20 22 24 26
Days of Operation

FIGURE 5: PERMEATE/DISTILLATE TDS VERSUS DAYS OF OPERATION
-
1,200 I> L••························· .. ··••<•>H••••>••·························· >• >I I
1,000
800
600
400
200
Legend
-a- Permeate
+ Distillate
O., HH ·•········•······· /i ! !< j<S � I I
6 8 1 0 12 14 16 18 20 22 24 26
Days of Operation

FIGURE 6: PERMEATE/DISTILLATE TOC VERSUS DAYS OF OPERATION
2,000
1,500
.. 1,000
0
500
0
6
Legend
-a- Permeate
+ Distillate
8 10 12 14 16 18 20 22 24 26
Days of Operation

FIGURE 7: RAW FEED WATER QUALITY VERSUS DAYS OF OPERATION
7 I 1::m ' Y I>tn:Y,l Legend :;::: ::: ::: """""""'"""""
. . . . . . . . . . .
. . . . . . . . . . .
. . . . . . . . . . .
. . . . . . . . .
-
en
"C 6 C CtS en
:::, 0
..c: 5
--
E4 ,._:
Q)
Q)
E3 CtS '-a:s
a..
_2 CtS u
E Q)
..c: 1 ()
0
6
-o- Oil & Grease
+Toe
*coo
•TDS
8 10 12 14 16 18 20 22 24 26
Days of Operation

FIGURE 8: A COMPARISON OF CAPITAL AND OPERATING COSTS
$200
en $150
<U
0 0
....
0
Cl)
"O C
: $100 :::, 0 .c 1-
(J)
� 0 0
$50
IIJ Capital Costs liJ O&M Costs
$0-1L.��������--'--'--'--L..---_...;.-'-'-__..L.-�----'-"------'--'-'-"'-'
Ultrafiltration Vapor Recompression Evaporation
TREATMENT SYSTEMS

RAW WASTE
1,000 GALLONS
7.3 POUNDS OF OIL AND GREASE
30 POUNDS OF ORGANIC CARBON
8.6 POUNDS OF DISSOLVED SOLIDS
C3 �
C3 �
tj
PERMEATE
984 GALLONS
0.06 POUNDS OF OIL AND
GREASE
5.2 POUNDS OF ORGANIC
CARBON
7.2 POUNDS OF DISSOLVED
SOLIDS
CONCENTRATE
16 GALLONS
7.2 POUNDS OF OIL AND GREASE
24.8 POUNDS OF ORGANIC CARBON
1.4 POUNDS OF DISSOLVED SOLIDS
FIGURE 9: ULTRAFILTRATION MASS BALANCE

RAW WASTE
1,000 GALLONS
7.3 POUNDS OF OIL AND GREASE
30 POUNDS OF ORGANIC CARBON
8.6 POUNDS OF DISSOLVED SOLIDS
C3 �
�
C3 �
tj
DISTILLATE
975 GALLONS
0.12 POUNDS OF OIL AND
GREASE
2.9 POUNDS OF ORGANIC
CARBON
0.23 POUNDS OF
DISSOLVED SOLIDS
CONCENTRATE
25 GALLONS
7.2 POUNDS OF OIL AND GREASE
27.1 POUNDS OF ORGANIC CARBON
8.4 POUNDS OF DISSOLVED SOLIDS
FIGURE 10: VAPOR RECOMPRESSION MASS
BALANCE


