30
1 WORLD OVERVIEW OF CONSERVATION APPROACHES AND TECHNOLOGIES WOCAT Mapping (QM) Julie Zähringer, CDE Photo: H.P. Liniger
| Date post: | 17-Jul-2015 |
| Category: |
Environment |
| Upload: | wocat-world-overview-of-conservation-approaches-and-technologies |
| View: | 197 times |
| Download: | 7 times |

1
WORLD
OVERVIEW OF
CONSERVATION
APPROACHES AND
TECHNOLOGIES
WOCAT Mapping (QM) Julie Zähringer, CDE
Photo: H.P. Liniger

2
SLM Technologies&
SLM Approaches
KM: WOCAT tools and methods
Framework for:documentation, evaluation, dissemination
of good SLM practices &Decision support
Local / field level
(Case studies)
Local, national, global scale independent(overview)
Degradation&
Conservation Map
3
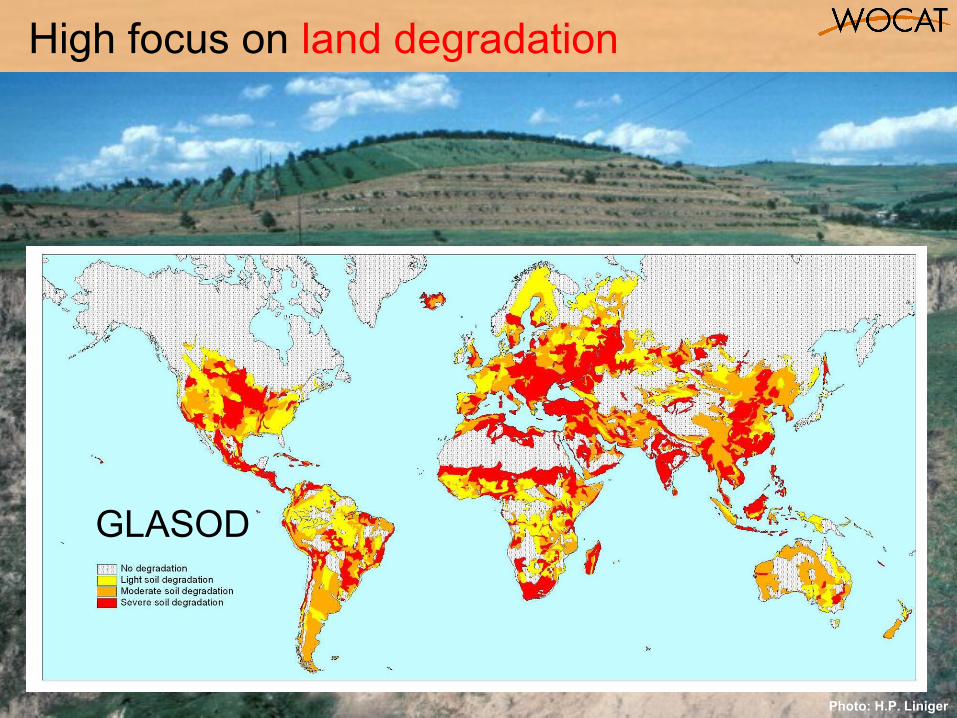
High focus on land degradation
GLASOD
Photo: H.P. Liniger

4
Why mapping?
What is the impact???
Worst degradation?
Starting degradation with strong degradation trend?
SLM applied
From local to regional / national
Graph: H.P. Liniger

5
WOCAT-LADA mapping (FAO)
Land use Land Degradation and SLM
+ Impact on Ecosystem Services & Human Well-being Break through! National Strategy, …

7
Land Use System for Mongolia
Elsentasarkhai
1. Agricultural land1.1. cropland rainfed1.2. cropland irrigated (including vegetables)1.3. abandoned cropland1.4. haymaking (natural, forage/ planted)2. Pastureland2.1 desert, 2.2. semi-desert (Gobi), 2.3. steppe, 2.4. forest steppe (Khangai), 2.5 high mountain3. Urban / sett l ing area/ infrastructure4. Road and network5. Forest5.1. natural forest5.2. plantations6. Surface Water7. Land for special use (Protected Area/
national parks, reserve pastures, military area, area for research, borderlines)
8. Wetland9. Natural mountain tops10. Mines/ Excavations
8
9
10
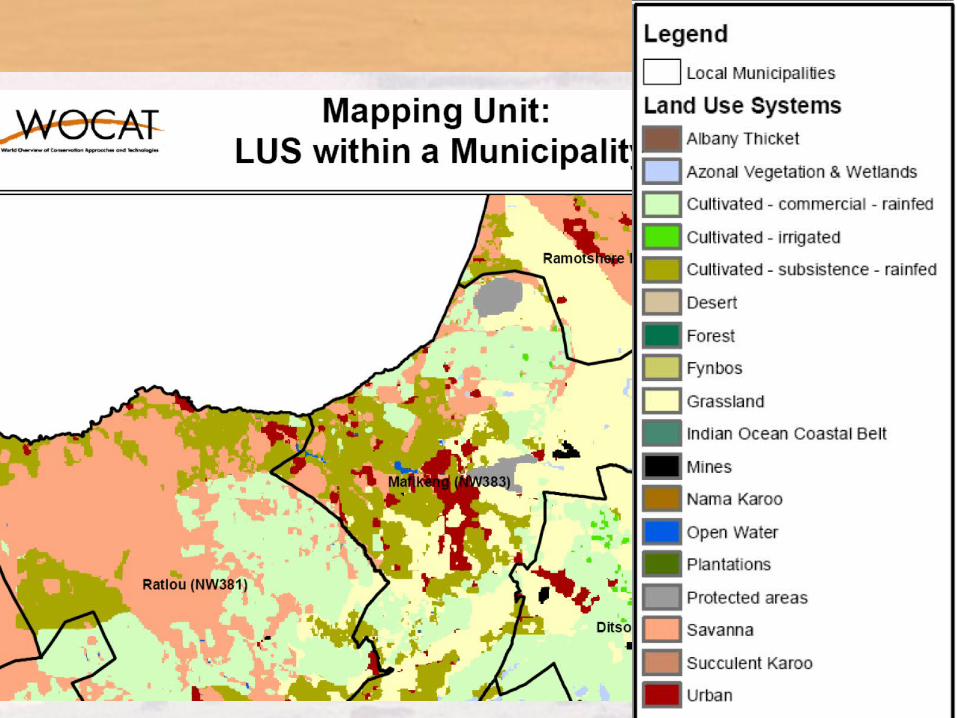
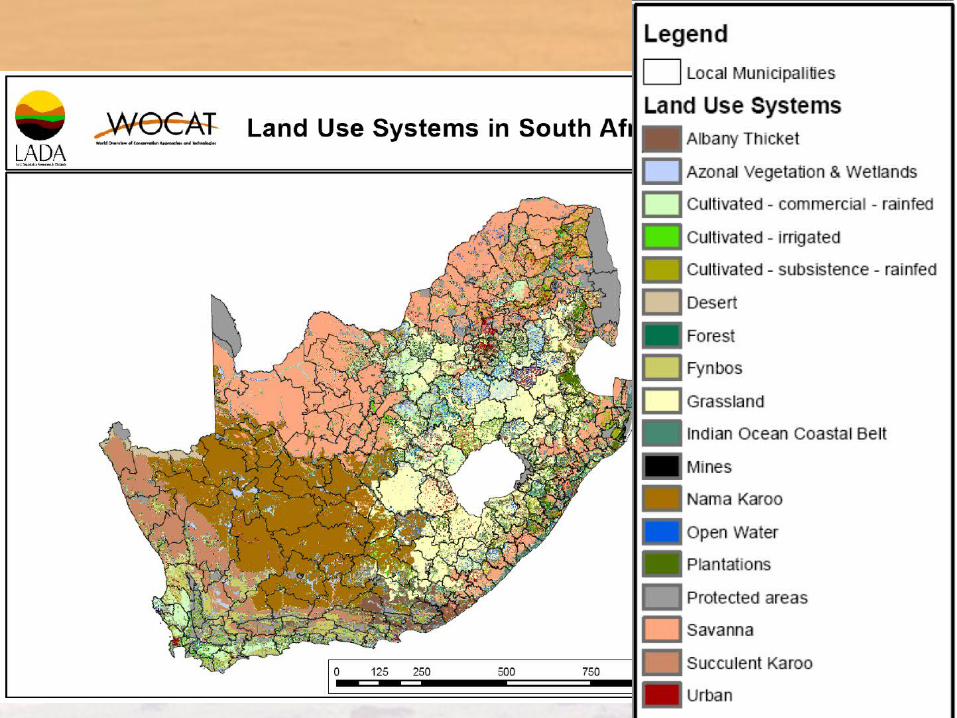
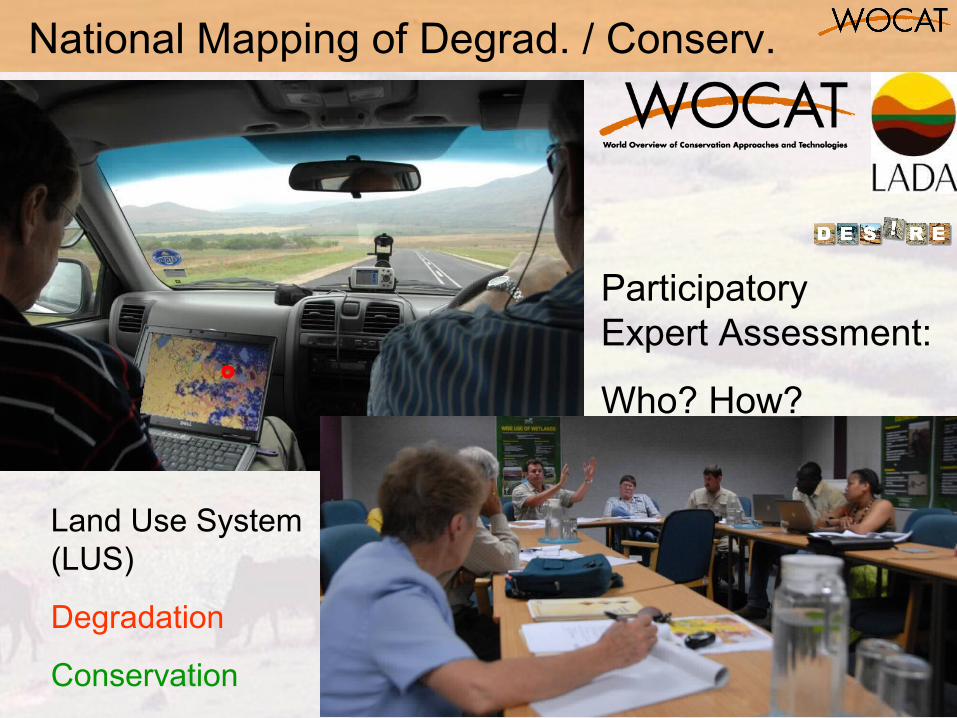
Land Use System (LUS)
Degradation
Conservation
National Mapping of Degrad. / Conserv.
Participatory Expert Assessment:
Who? How?

For each mapping unit you fill in all of the following tables
11

12
Land Use System (LUS) (FAO)
Type
Area trend
Intensity trend
Mapping Degradation and Conservation/SLM
Area trend: increase or decrease in area of this land use system over approximately the past 10 years
Intensity trend: change of intensity within the land use system during the last 10 years

13
Area trend 2 = area coverage is rapidly increasing in size; i.e. > 10% of the LUS area/10 years
Intensity trend 1 = Moderate increase

14
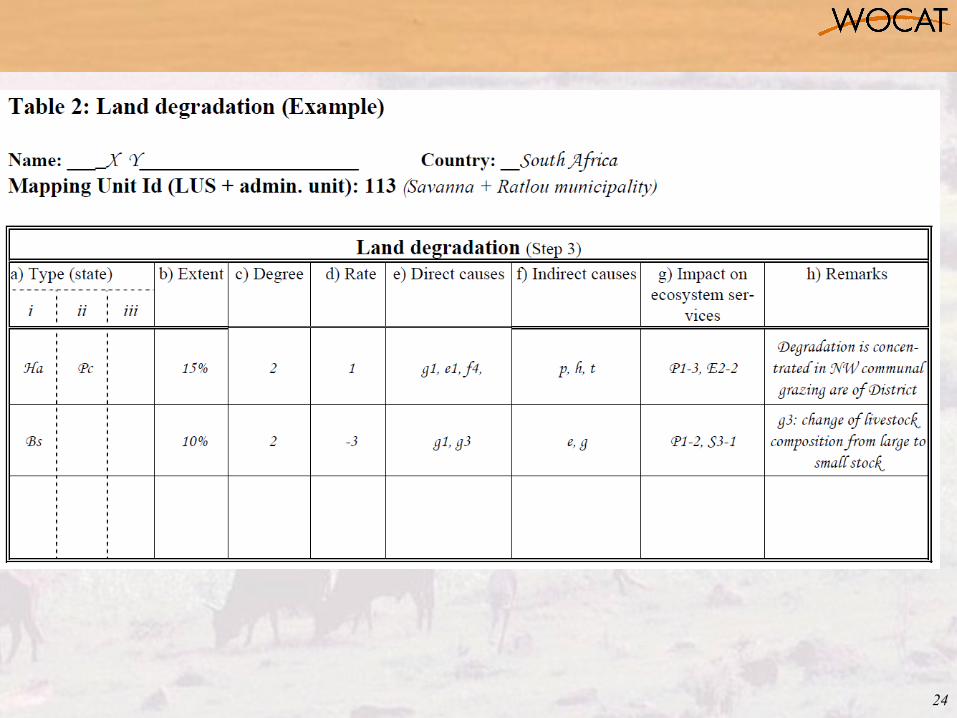
Degradation per LUS Conservation SLM per LUS
Type Name / Group / Measure
Extent (area) Extent (area)
Degree Effectiveness
Rate Effectiveness trend
Impact on ecosystem services (type and level)
Impact on ecosystem services (type and level)
Direct causes
Indirect causes Degradation addressed
Recommendation
Mapping Degradation and Conservation/SLM

15
W: Soil erosion by waterWt loss of topsoil (surface erosion)Wg gullying (gully erosion)Wm mass movementsWr riverbank erosionWc coastal erosionWo offsite degradation
E: Soil erosion by windEt loss of topsoil Ed deflation and depositionEo offsite effects
C: Chemical soil deteriorationCn fertility decline and reduced organic matter content Ca acidificationCp soil pollutionCs salinisation/alkalinisation
P: Physical soil deteriorationPc compactionPk sealing and crustingPw waterloggingPs subsidence of organic soils, settling of soilPu loss of bio-productive function due to other activities (eg construction, mining)
Land Degradation types (1) (WOCAT 2008)

16
B: Biological degradationBc reduction of vegetation cover
Bh loss of habitats
Bq quantity / biomass decline
Bf detrimental effects of fires
Bs quality and species composition / diversity decline
Bl loss of soil life
Bp Increase of pest / diseases, loss of predators
H: Water degradation Ha aridification / soil moisture problem
Hs change in quantity of surface water
Hg change in groundwater / aquifer level
Hp decline of surface water quality
Hq decline of groundwater quality
Hw reduction of the buffering capacity of wetland areas
Land Degradation types (2): (WOCAT/LADA 2008)

17
Bs (10% of LUS) Ha and Pc (15% of LUS)
Bush encroachment Aridification & compaction
Degradation “Extent” (% of LUS)

18
1 Light: there are some indications of degradation, but the process is still in an initial phase. It can be easily stopped and damage repaired with minor efforts.
2 Moderate: degradation is apparent, but its control and full rehabilitation of the land is still possible with considerable efforts.
3 Strong: evident signs of degradation. Changes in land properties are significant and very difficult to restore within reasonable time limits.
4 Extreme: degradation beyond restoration.
Degradation “Degree”

19
3: rapidly increasing degradation
2: moderately increasing degradation
1: slowly increasing degradation
0: no change in degradation
-1: slowly decreasing degradation
-2: moderately decreasing degradation
-3: rapidly decreasing degradation
Degradation “Rate”
20
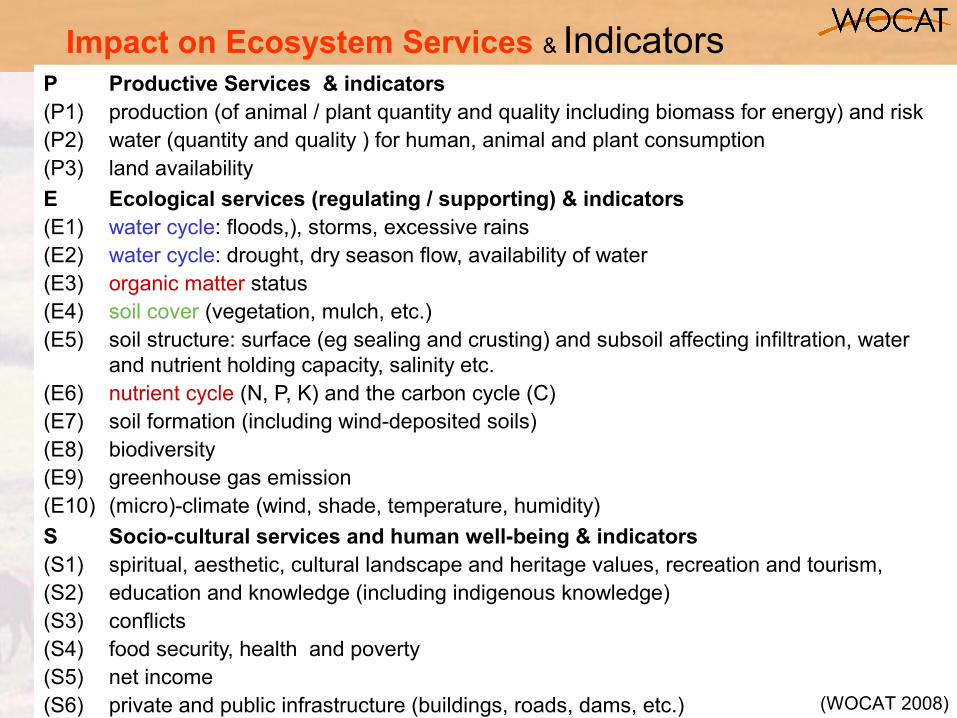
P Productive Services & indicators(P1) production (of animal / plant quantity and quality including biomass for energy) and risk(P2) water (quantity and quality ) for human, animal and plant consumption(P3) land availability
E Ecological services (regulating / supporting) & indicators(E1) water cycle: floods,), storms, excessive rains (E2) water cycle: drought, dry season flow, availability of water(E3) organic matter status(E4) soil cover (vegetation, mulch, etc.)(E5) soil structure: surface (eg sealing and crusting) and subsoil affecting infiltration, water
and nutrient holding capacity, salinity etc.(E6) nutrient cycle (N, P, K) and the carbon cycle (C)(E7) soil formation (including wind-deposited soils)(E8) biodiversity (E9) greenhouse gas emission(E10) (micro)-climate (wind, shade, temperature, humidity)
S Socio-cultural services and human well-being & indicators(S1) spiritual, aesthetic, cultural landscape and heritage values, recreation and tourism, (S2) education and knowledge (including indigenous knowledge)(S3) conflicts(S4) food security, health and poverty (S5) net income(S6) private and public infrastructure (buildings, roads, dams, etc.)
Impact on Ecosystem Services & Indicators
(WOCAT 2008)

21
-3 high negative influence: conservation contributes negatively (more than 50%) to changes in ES
-2 negative influence: conservation contributes negatively (10-50%) to changes in ES
-1 low negative influence: conservation contributes negatively (0-10-%) to changes in ES.
0 no impact, i.e. no or negligible change ecosystem service
+1 low positive influence: conservation contributes positively (0-10%) to the changes in ES
+2 positive influence: conservation contributes positively (10-50%) to the changes in ES
+3 high positive influence: conservation contributes positively (more than 50%) to changes in ES.
“Level of impact” (on Ecosystem Services)
22
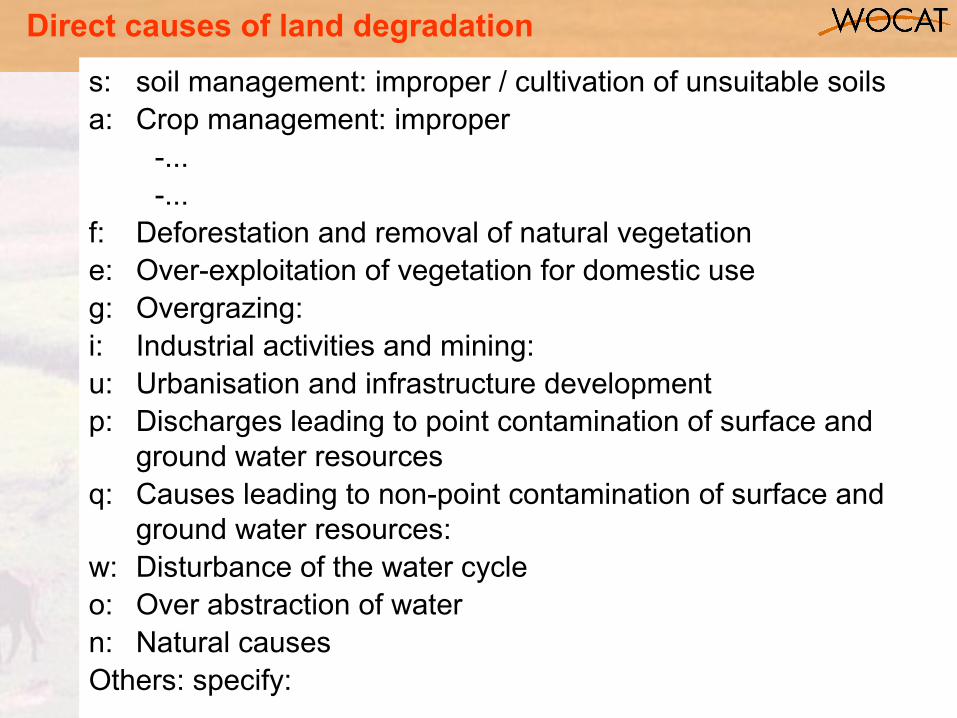
s: soil management: improper / cultivation of unsuitable soilsa: Crop management: improper
-...-...
f: Deforestation and removal of natural vegetation e: Over-exploitation of vegetation for domestic useg: Overgrazing: i: Industrial activities and mining: u: Urbanisation and infrastructure development p: Discharges leading to point contamination of surface and
ground water resourcesq: Causes leading to non-point contamination of surface and
ground water resources: w: Disturbance of the water cycle o: Over abstraction of water n: Natural causes Others: specify:
Direct causes of land degradation

23
p: Population density
t: Land tenure
h: Poverty / wealth
l: Labour availability
r: Inputs and infrastructure
e: Education, access to knowledge and support services
w: War and conflict
g: Governance / institutional
o: Others (specify)
Indirect causes of land degradation
24
25
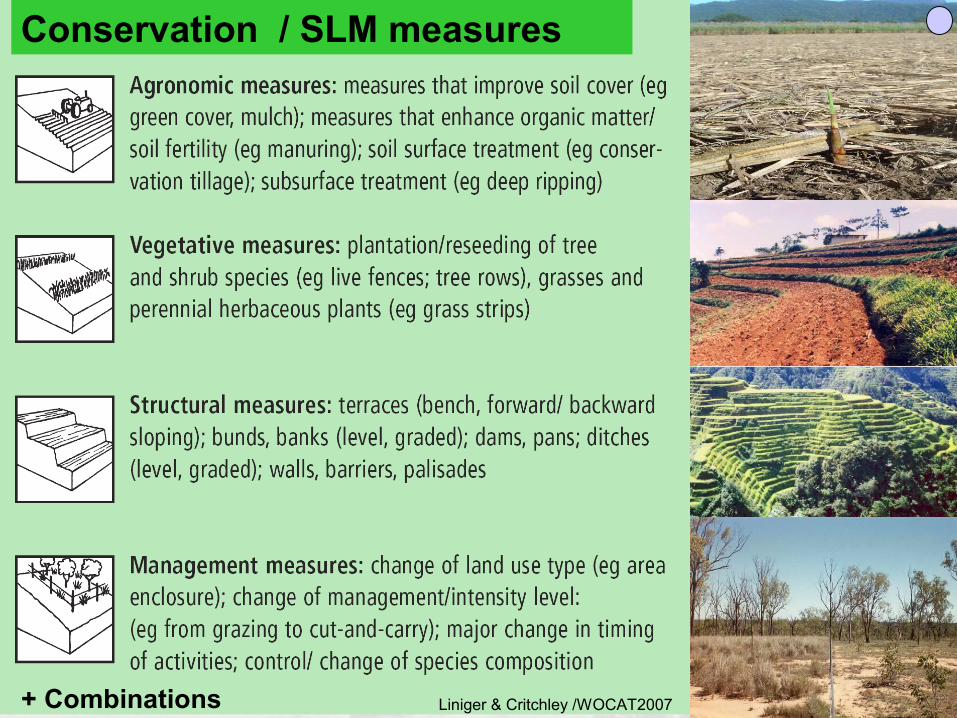
Conservation / SLM measures
Liniger & Critchley /WOCAT2007+ Combinations

26
CA: Conservation agriculture / mulching NM: Manuring / composting / nutrient management RO: Rotational system / shifting cultivation / fallow /slash and
burnVS: Vegetative strips / cover AF: Agroforestry AP: Afforestation and forest protectionRH: Gully control / rehabilitation TR: Terraces GR: Grazing land managementWH: Water harvestingSA: Groundwater / salinity regulation / water use efficiencyWQ: Water quality improvements SD: Sand dune stabilizationCB: Coastal bank protectionPR: Protection against natural hazardsSC: Storm water control, road runoffOT: Other: (specify)
Conservation Groups
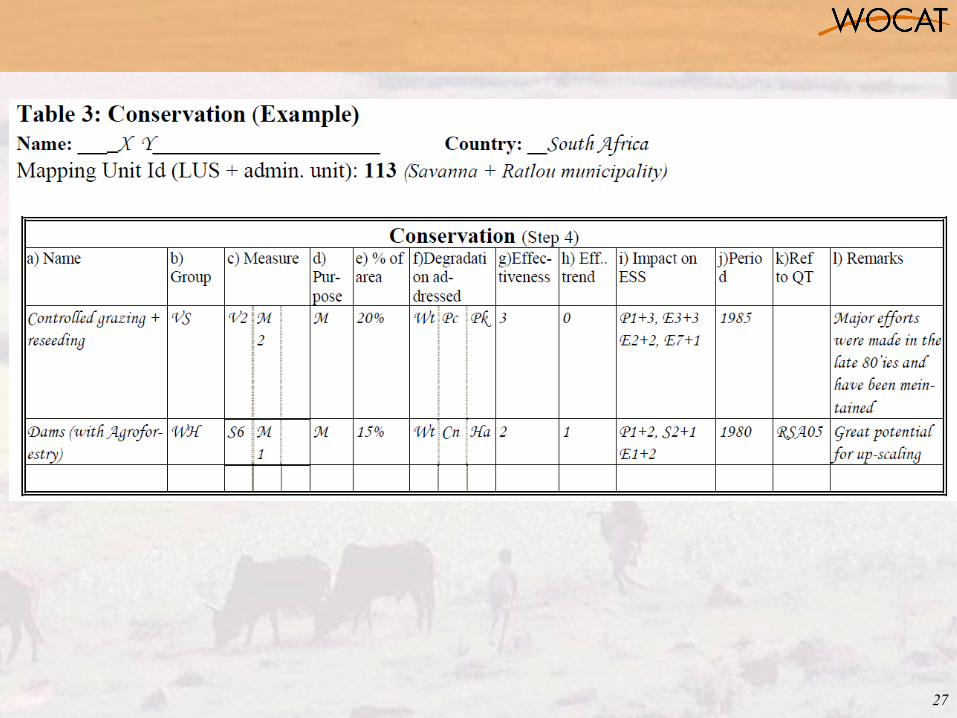
27

28
satelite images & ground truthing
Hot SpotBright Spot
Knowledge gaps: … Area cover?
Source: Gulniso, Bettina Wolfgramm, Erik Bühlmann

29
Whole range of thematic maps

30

31
Questions?


