Wolves at the Door: A Closer Look at Hedge Fund Activism Yu Ting Forester Wong Submitted in partial fulfillment of the requirements for the degree of Doctor of Philosophy under the Executive Committee of the Graduate School of Arts and Sciences COLUMBIA UNIVERSITY 2016
Transcript
Wolves at the Door: A Closer Look at Hedge Fund Activism
Table 8 – Reverse Causality (Filing Date Return) .........................................................................73
iii
ACKNOWLEDGEMENT
I am indebted to my dissertation committee—Fabrizio Ferri (chair), April Klein, Trevor Harris
and Shiva Rajgopal—for guidance, support and their dedication to my work are very much
appreciated. For helpful comments, I thank Dan Amiram, Edwige Cheynel, Jonathan Glover,
Dong Joon Han, Anne Heinrichs, Moritz Hiemann, Colleen Honigsberg, Alon Kalay, Sharon
Katz, Urooj Khan, Seil Kim, Nan Li, Xinlei Li, Suresh Nallareddy, Doron Nissim, Venkat
Peddireddy, Stephen Penman, Miguel Rivas, Ethan Rouen, Jianxin (Donny) Zhao, Amir Ziv and
other seminar participants at Columbia University and the AAA doctoral consortium. I gratefully
acknowledge financial support from Columbia University and the Deloitte Foundation.
iv
DEDICATION
I dedicate my dissertation work to my family and many friends. A special feeling of gratitude to
my loving parents, Alice and Siu Hung Wong, whose words of encouragement and push for
tenacity ring in my ears. To my wife, Shirley who has never left my side and has the patience of
a saint. Thank you for all your love, support, help, encouragement and dedication.
v
PREFACE
This dissertation is original, unpublished, independent work by the author, Yu Ting Forester
Wong.
1
1. Introduction
This paper focuses on hedge fund activism, which over the past decade has emerged as a
new type of external corporate governance mechanism, attracting the attention of policymakers
and researchers (Brav, Jiang, and Kim 2009; Briggs 2007; Gillan and Starks 2007). Specifically,
I examine ―wolf pack‖ activism, the accumulation of shares by other non-lead activists who hold
smaller stakes (i.e., below 5% of share outstanding threshold) in a target firm and support the
activist‘s campaign. This phenomenon may explain how hedge fund activists, who typically hold
a relatively small stake in target firms (about 6%; see Brav et al. 2009), have been so successful
in pressuring target firms to acquiesce to their requests.1 Briggs (2007) and Coffee and Palia
(2015) have suggested that the formation of a wolf pack before the filing of a schedule 13D, a
form that activist investors must file upon acquiring 5% or more of the target firm‘s stock,
effectively increases the percentage of voting shares directed by the activist fund and thus makes
the threat of further action, such as a proxy fight, more credible, causing the firm to accede to the
activist‘s demands.2
Commentators3 usually assume that activist hedge funds orchestrate the formation of wolf
packs. According to this line of thinking, the lead activist (13D filer) recruits other investors to
join the campaign before the 13D filing becomes public, typically leads to a positive stock
return. In effect, the activist uses the expected jump in stock price to compensate the other
investors for their support. This arrangement may be viewed as a way to circumvent securities
1 It should be noted that while some pension funds and mutual funds engage in shareholder activism, these
institutions usually engage in ―governance activism‖ and not ―performance activism‖ (see Gilson and Gordon 2013).
The amount of shareholder support required for ―governance activism‖ is likely to be less than ―performance
activism‖, hence the incentive for these institutions to engage in ―wolf pack‖ activism is also lower. 2 The literature on non-binding shareholder proposals shows that management‘s propensity to implement the proposals increases
with the percentage of votes cast in their favor (Ertimur, Ferri and Stubben 2010; Ertimur, Ferri and Oesch 2013, 2015;
Balachandran, Joos and Weber 2012). Hence, the effectiveness of the threat of a proxy fight is likely to depend on the percentage
of votes directly or indirectly controlled by the activist. 3 See for, e.g., Briggs (2007) and Coffee and Palia (2015).
2
regulations and takeover defenses, which are usually triggered by holdings thresholds. The SEC,
for example, requires activists to file a Schedule 13D within 10 days of crossing a 5% ownership
threshold. In addition, regulatory constraints such as the ―short-swing profit rule‖4 and takeover
defenses such as ―poison pills‖5 make it difficult for activists to acquire ownership over a certain
holding threshold. By inducing other investors to acquire shares in the target, the lead activist
can accumulate a larger percentage of de facto ownership before triggering these regulatory
thresholds, thereby increasing the chances of a successful campaign (Coffee and Palia 2015). I
label this as the Coordinated Effort Hypothesis. However, an alternative hypothesis is that wolf
packs arise spontaneously because investors monitor and target the same firms around the same
time. Brav, Dasgupta, and Mathews (2015), for example, analytically show that, under certain
conditions, a pack can form around an activist without any explicit coordination by the activist. I
label this as the Spontaneous Formation Hypothesis.
In this paper, I investigate wolf-pack activism by addressing three questions. First, is
there any evidence of wolf pack formation? Second, is the wolf pack formed intentionally (by the
lead activist) or does it result from independent activity by other investors? Third, does the
presence of a wolf pack improve the activist‘s ability to achieve its stated objectives? I
investigate these questions using 1,922 activist hedge funds‘ campaigns—all campaigns in the
SharkRepellent database from 1998 through 2014 in which an activist filed Schedule 13D.6
4 Section 16(b) of the Securities Exchange Act of 1934 entitles shareholders to recover short-swing profits that are based on a
purchase and sale or a sale and purchase, within six months, of the stock of a ―reporting company.‖ Once an activist acquires
more than 10% of share outstanding, he will subjected to this rule. The average holding period of the activist is usually longer
than six months (see Brav, Jiang and Kim 2009). Yet the activist may not want to lose the option to turn over the position
quickly. 5 A shareholder rights plan, commonly known as poison pill, is a tool used by board of directors to deter activists. Typically, such
a plan gives shareholders (other than the activist) rights to buy more shares at a discount if an activist buys a certain percentage or
more of the company‘s share. 6 Under Rule 13d-1(a) and (b) of the 1934 Securities Exchange Act, the US Securities Exchange Commission (SEC) requires
investors to file a Schedule 13D with the SEC if (1) the investor acquires more than 5% of any class of security of a publicly
traded company, and (2) the investor has an interest in influencing the management of the company. Once both criteria are met,
the investor has up to 10 days to file form 13D with the SEC (see Figure 1).
3
To identify the occurrence of wolf-pack activism, I first examine trading patterns on the
day when the 13D filer crosses the 5% threshold (the ―trigger date‖). This date is not publicly
observable until the 13D filing. Similar to prior studies, I document a high level of share turnover
on this date, about 325% of the normal trading volume (defined as the average trading volume
over the (−120,−60) window before the trigger date). While this could be consistent with wolf-
pack formation (e.g., Coffee and Palia 2015), Bebchuk et al. (2013) note that it may simply
indicate that the lead activist accumulates most of its holdings on the trigger date. To examine
the source of abnormal trading volume, I exploit the fact that activists must report any purchase
or sales of the target firm‘s equity for at least the 60 days before the filing date, therefore
including the trigger date, on Schedule 13D. Using this hand-collected information, I split the
share turnover on the trigger date into two separate components: trades by the 13D filer and
trades by other investors. I find that, even after removing trades by the 13D filers, the remaining
average share turnover is about 250% of normal trading volume. Hence, the bulk of trading
volume on the trigger date reflects trades by other investors, possibly an indication of the
presence of a wolf pack.
Next, I spend the bulk of this paper examining the mechanism of wolf-pack formation. As
mentioned above, there are two theories for how wolf packs are formed. The Coordinated Effort
Hypothesis assumes that the lead activist orchestrated the wolf pack in order to bypass certain
regulatory constraints. By contrast, the Spontaneous Formation Hypothesis proposes that wolf
packs arise spontaneously because investors monitor and target the same firms around the same
time. My results find evidence consistent with the Coordinated Effort Hypothesis. In particular,
my evidence indicates that the abnormally high share turnover is more likely to be mustered by
the lead activist than to occur spontaneously, and that lead activists are tipping off institutions
4
with which they have prior relationships. Using a proprietary dataset from a transaction-cost
consulting firm that includes transaction-level trading data by more than 900 institutional
investors for the period 1998–2010, I find that an institution is more likely to accumulate shares
in an activist‘s campaign if the institution has done so in an earlier period. It remains possible
that the same activist-institution pairs may be observed multiple times across different targets
simply because they employ similar investment strategies. In a separate analysis, I provide
further evidence supporting the Coordinated Effort Hypothesis. In particular I find that wolf
packs are more prominent among reputable activists, indicating that pack members are not only
aware of an upcoming campaign, but that they are also aware of the identity of the lead activists.
In addition, by showing substantial trading by other investors on the trigger date, I provide
evidence against the Spontaneous Formation Hypothesis. While other investors may
independently decide to accumulate shares in the target firm, it is not clear why so many of them
would do so on the same day—and even less clear why they would do so exactly on the day the
13D filer crosses the 5% threshold (i.e., the trigger date).7 Under the Spontaneous Formation
Hypothesis, the only explanation for this synchronicity would be that they are all responding to
the same, sudden change in market conditions (momentum trading, arrival of news, fire-sales,
etc.). Using a battery of univariate and multivariate tests, I show that the abnormal trading
volume on the trigger date cannot be fully explained by any sudden changes in market
conditions.
In the last section of my paper, I examine whether wolf packs improve the lead activist‘s
chances of success. For this analysis, I create a proxy for the presence of a wolf pack. I classify
campaigns with turnover by non-13D investors on the trigger date in the top quartile of the
7 As shown in Figure 2, although both the 13D filer and other investors start accumulating their position around 40 days before
the trigger date, there is a sharp increase in trading on the trigger date. Furthermore, this activity levels off immediately
afterwards.
5
sample distribution as campaigns with wolf packs. Next, using the descriptions provided by the
SharkRepellent database, I manually code the activist‘s stated objective (as reported in the 13D
filing) and the outcome of each campaign. After controlling for other factors that prior studies
have found to affect these outcomes, my results suggest that the existence of a wolf pack is
associated with a statistically significant 6% increase in the success rate of campaigns (the
average success rate in the sample is ~74%; a campaign is defined as successful if the activist
achieved at least part of his stated objectives). I also examine the subset of 716 campaigns in
which the lead activist requested at least one board seat and find that the presence of a wolf pack
is associated with a statistically significant 9% increase in the success rate of obtaining a board
seat (the average probability of gaining a seat is ~65%). The results are similar when using the
raw number of seats won as a proxy for campaign success. In addition, as an alternative measure
of success, I also examine stock returns and find that wolf-pack campaigns are associated with a
statistically significant 8.3% (6.9%) increase in buy and hold abnormal (raw) return calculated
over the duration of the campaign.
Lastly, I show that my results are unlikely to be driven by reverse causality—that is, it is
unlikely that the pack members are mere observers who happen to merely join campaigns that
are more likely to be successful. If such a story were true, I would expect to observe wolf packs
around ―easy targets‖ only. However, I find that wolf packs are more likely to occur in better
defended companies, as proxied by Bullet Proof Rating (a takeover defense measured by
FactSet) and the use of Poison Pill (an indicator variable which takes the value of 1 if a poison
pill was either in effect or adopted in response to the 13D filer's campaign). These findings are
also more consistent with the Coordinated Effort Hypothesis, in which the lead activist only
creates a wolf pack when he foresees the need to do so because, for example, the company is
6
better defended. Further, it does not appear that pack members merely join campaigns with
higher expected benefits; the expected benefits (as proxied by 13D announcement date returns)
for wolf pack campaigns are not any higher than non-wolf pack campaigns.
This study makes four contributions to the literature on hedge fund activism. First, it
provides empirical evidence on the existence of wolf packs and identifies when their share
accumulation occurs. Second, it documents an association between the presence of wolf packs
and an activist‘s success. In doing so, it helps explain the effectiveness of hedge fund activists in
spite of their relatively small stakes in target firms. Third, my findings shed light on the reasons
for the high share turnover on the trigger date, by showing that only around 25% of the trading
volume is driven by the activist‘s trades and around 75% by other investors. Fourth, my evidence
is inconsistent with a spontaneous formation story and more consistent with the presence of
explicit coordination, in which the lead activist likely tips off allies about an upcoming 13D
filing, in order to strengthen his negotiating position with the target firm.8 These findings may be
of interest to the SEC, which has recently expressed concern as to whether this behavior meets
the definition of a ―group‖ for the purpose of securities laws.
More broadly, my evidence also contributes to a limited body of research on investors‘
ability to coordinate. This literature has largely focused on formal coordination between
institutional investors and yields mixed findings. For example, Song and Szewczyk (2003)
investigate the impact of an effort by the Council of Institutional Investors to induce collective
action and find little evidence that coordinated shareholder activism is effective. By contrast, in a
different setting, Doidge et al. (2015) find that the Coalition of Canadian Institutional Investors
has been effective in improving corporate governance in target firms. My result appears to
8 An important caveat is that, at the moment, I cannot rule out that my findings reflect unintentional leakage of information about
the activist‘s trade on the trigger date.
7
confirm Doidge et al. (2015) and shows that institutions are able to coordinate with each other
even without any formal coordination.
My paper also contributes to the recent policy debate over the 10-day filing window for
13Ds. The Dodd-Frank Act included a provision authorizing the SEC to shorten the filing
window, but the SEC has yet to act. In a 2011 letter to the SEC, the law firm Wachtell, Lipton,
Rosen & Katz recommended cutting the 10-day period to one day, arguing that the 10-day lag
facilitates ―market manipulation and abusive tactics.‖ My findings suggest that such concerns
may be overstated. Trading around 13D filings is substantial and appears to be driven by private
information ahead of public disclosures, but most of the trading by other investors occurs on the
trigger date. Shortening the 10-day window is unlikely to ward off wolf packs.
One concurrent study examines a special case of wolf packs: Becht, Franks, Grant, and
Wagner (2015) investigate campaigns in which multiple schedule 13Ds are sequentially filed for
the same company and finds that campaigns with multiple 13D filers (a form of disclosed wolf
packs) are more successful than campaigns with a single 13D filer (78% probability of success
for multiple 13D filers vs. 46% for single 13D filers).9 My study focuses instead on undisclosed
wolf packs in campaigns with a single 13D filer. The two types of campaigns are qualitatively
different. Those with multiple, sequential 13D filings tend to last longer (747 days vs. 404 days
for campaigns with a single 13D filer) and likely capture cases where a second 13D filer joins a
struggling campaign to increase the probability of success. By contrast, my study examines the
role of undisclosed wolf packs around the first activist event, which has been the subject of
debate among commentators and policy makers but has not been examined empirically. Also,
9 Becht et al (2015) classify a campaign as successful if any of the following outcomes are achieved: board changes (replacement
of the CEO, chairman or non-executive directors), changes to payout policy (share buybacks or increased/special dividends),
restructuring (divestitures and spin-offs of noncore assets, and blocking diversifying acquisitions) and takeovers (i.e., the target
firm is acquired by a strategic buyer or private equity fund).
8
cases of multiple 13D filings are relatively infrequent (22% of the campaigns in Becht et al
(2015) and 16% in my sample). By contrast, after removing campaigns with multiple 13D
filings, more than 50%10
of the campaigns in my sample are accompanied by some form of
undisclosed wolf pack.
10 This is based on the number of campaigns with positive abnormal trading volume after removing the 13D filer‘s trade on the
trigger date.
9
2. Sample selection and descriptive statistics
I use data from SEC Schedule 13Ds and SharkRepellent.net to construct a comprehensive
sample of activist campaigns between 1998 and 2014. As shown in Table 1, I start with 3,744
unique activism events. Since I focus on trading by other investors before public disclosure of
the campaigns, I remove 304 campaigns in which the trigger date and the 13D filing date are the
same. For each remaining event, I manually download all 13D filings from SEC.gov and collect
the following information: the filing and trigger dates; the identity and Central Index Key (CIK)
of the hedge fund; the name, CIK, CUSIP, and SIC code of the target firm; and the percentage of
shares owned by the activist at the time of 13D filing. For each stock traded in the dataset, I
collect returns, share price, trading volume, and shares outstanding from CRSP and book value
of equity from Compustat. I remove 151 campaigns in which a 13D cannot be located, 201
campaigns with missing variables from CRSP/Compustat, and 528 campaigns in which the
trigger date was not reported. After excluding Real Estate Investment Trusts (REITs, SIC 6798),
blank check entities (SIC 6770), trusts (6792), American Depositary Receipts (ADRs), I am left
with 2,293 distinct campaigns. I also exclude 366 campaigns that overlap with another campaign
in my sample, in the sense that another 13D is filed (by another activist) between the 13D filing
date and end date of a previous campaign. These 366 campaigns are the type of campaigns that
Becht et al. (2015) classify as (disclosed) wolf-pack events.11
Finally, I exclude five campaigns
for which daily trades by the 13D filer are not available.
The remaining 1,922 campaigns are initial campaigns without any subsequent 13Ds and
constitute my final sample. These campaigns comprise 340 individual activists and 1,753 unique
firms, with the 20 most prominent activists representing around 50% of all campaigns.
11 Out of these 366 campaigns, 196 are subsequent campaigns, which relate to 170 initial campaigns. For the 170 initial
campaigns in which at least one 13D is filed subsequently, the average length between the initial and subsequent 13D is 501.3
days. The length of these initial campaigns is 746.7 days, significantly longer than the rest of the sample at 403.5 days.
10
The target companies in my sample are comparable to those in other studies of activism
(Brav et al. 2008; Klein and Zur 2009). As shown in Table 2 Panel A, for the target firms at the
time of the 13D filing, the average (median) market value is $933.9 ($209.4) million, the average
institutional holding is 44%, and the average number of analysts following the firms is three.
Also, at the time of the 13D filing, on average 13D filers own 8.8% of the shares outstanding,
with about 60% of this amount (5.4%) being purchased in the 60 days before filing date (Table 2
Panel B). The median activist holding at the time of 13D filing is 6.5%, with more than 85% of
the activists holding less than 10% of shares outstanding in my sample. This is consistent with
the argument that poison pills and the short-swing profit rule constrain the amount of shares that
can be accumulated by a lead activist (see Section 4.1). Most filers take advantage of the 10-day
filing delay allowed under schedule 13D, with the average delay being 7.61 days and over 50%
of the sample filing more than nine days after the trigger date. (These figures are higher than
documented previously because I remove all campaigns where the filing date and the trigger date
are the same).
11
3. How common are wolf packs? Evidence on the accumulation of shares by other investors
3.1. Abnormal turnover prior to 13D filings
Similar to Coffee and Palia (2015) and Brav et al. (2015), I refer to a ―wolf pack‖ as a
loose network of investors who accumulate shares in the target firm before the 13D filing.
As a first step in identifying the accumulation of shares by other investors, I examine
trading volume around the trigger date. In Figure 2, I plot the trading volume for the full sample
of 1,922 CRSP-SharkRepellent campaigns. The variable on the y-axis, Turnover_all
, is calculated for each campaign and is presented as a percentage of
normal trading volume. Hence, if Turnover_all=1, it means there is no abnormal turnover.12
Normal trading volume is estimated as the rolling average of trading volume between day −120
and −60. Figure 2 shows a significant spike in turnover on the trigger date: the average turnover
is around 325% of normal volume.
[Insert Figure 2]
3.2. Who trades on the trigger date?
Since the trigger date is not publicly observable until the 13D is filed, the high level of
turnover cannot be a public reaction to the activist‘s campaign. Two prior studies have also
documented significant abnormal share turnover on the trigger date before a 13D filing, but they
differ in their interpretations. Coffee and Palia (2015) see this high level of turnover as evidence
of wolf-pack formation. In contrast, Bebchuk et al. (2013) interpret it as evidence of activist
hedge funds accumulating most of their holdings on the trigger date.
12 Prior studies (see for e.g., Beaver 1986, DeFond, Hung and Trezevant 2006) used abnormal trading volume to assess the
information content of earnings announcements. In this paper, information content is less relevant, since the activist‘s campaign
is supposed to be a privately known event prior to public disclosure.
12
To distinguish between these explanations, I separate total daily volume into two
components: 1) trades by the 13D filer and 2) trades by other investors. If 13D filers solely drive
the high turnover, then, after removing their trades, the remaining trading should resemble the
target firm‘s normal volume. If, on the other hand, other investors drive at least part of the
abnormal share turnover, then I expect to see a significant level of abnormal turnover even after
removing the 13D filer‘s trades.
I identify trades by 13D filers by hand-collecting the relevant information from Schedule
13Ds, which include trading information for at least 60 days before the filing date. In the vast
majority of cases, transaction data are reported on a daily basis. When transaction data are
reported at higher-than-daily frequencies, I aggregate to the daily level. I manually collect the
following data: date of each transaction, transaction type (purchase or sell), transaction size,
transaction price, class of the transaction (common stock, options, warranty, etc.), whether the
transaction happened in an open market or a private transaction, and the entity making the trade.
Appendix A presents the trading schedule of a typical Schedule 13D filing.
Figure 3 presents the daily trading volume by other investors (total volume less trading by
13D filer). The variable on the y-axis, is the turnover driven by other
investors, presented as a percentage of normal trading volume. As before, normal trading volume
is estimated as the rolling average of trading volume between day −120 and −60. Consistent with
the existence of wolf packs, Figure 3 shows that, even after removing trades by the 13D filers,
the average trading volume on the trigger date is still about 250% of normal trading volume,
implying that only around 25% of the total trading volume on the trigger date is driven by the
13D filer‘s trades.
[Insert Figure 3]
13
Figure 4 shows how 13D filers and other investors accumulate their shares. As mentioned
earlier, the shares accumulated by 13D filers are obtained directly from the schedule 13D. Shares
accumulated by other investors are estimated as the remaining share volume after removing (1)
trades by 13D filer and (2) normal trading volume (estimated using the rolling average volume
from trading days −120 to −60 inclusive). In the 60 trading days before the trigger date, the 13D
filer (other investors) accumulate an average of about 5% (8%) of total shares outstanding in the
target firm. Consistent with wolf-pack formation, the timing of share accumulation between the
13D filer and other investors appears to be highly synchronous. Share accumulation begins
around 40 days before the trigger date, peaks on the trigger date, and then levels off.
[Insert Figure 4]
14
4. Mechanism of pack formation
Next, I examine the two potential mechanisms of wolf-pack formation. The Coordinated
Effort Hypothesis assumes that the lead activist orchestrated the wolf pack as a way to bypass
certain regulatory constraints. By contrast, the Spontaneous Formation Hypothesis proposes that
wolf packs arise spontaneously because investors monitor and target the same firms at around the
same time.
4.1 Coordinated Effort Hypothesis
Market observers often allege that lead activists muster wolf packs. Under this story, the
activist recruits several other investors to join the campaign before filing the 13D, which
typically leads to a positive stock return. The arrangement can be done either explicitly, as
alleged by media accounts (see for example, Pulliam et al. 2014 and Hoffman and Benoit 2015)
or implicitly via gossip and other forms of indirect signaling. However, it is important for the
arrangement to take place informally, to avoid forming a ―group‖ under Section 13(d)(3) of the
Securities Exchange Act of 1934.13
At first sight, it may appear that constituting a wolf pack would not be in the best interest of
the lead activist, since she bears all the costs of engagement but only reaps a small percentage of
benefits, a typical free-rider problem (e.g., Admati, Pfleiderer and Zechner 1994). However,
13 Section 13(d)(3) of the Securities Exchange Act of 1934 states that ―[w]hen two or more persons act as a … group for the
purpose of acquiring, holding, or disposing of securities of an issuer, such syndicate or group shall be deemed a ‗person‘ for the
purposes of this subsection.‖ Thus, if three investors each acquire 2% of the stock in a target company and their relationship
makes them a group, their shares must be aggregated and, under Section 13(d), the SEC will treat them singly and require that
they file a Schedule 13D within 10 days of the formation of the group. The statutory definition of ‗group‘ has only been slightly
clarified by case law. At the time of writing, there is no bright-line test determining what is and what is not group activity. Courts
have said that the issue of group activity is a question of fact. The following are factors that various courts have found may
suggest group activity: (1) communications among the alleged group members relating to the company; (2) copies of
correspondence with the corporation being sent to other alleged group members; (3) one alleged group member‘s shares being
held in the name of another group member; (4) statements by the alleged group members that they had the power to influence
management; (5) any pattern of parallel actions by shareholders over a relatively short and essentially concurrent period; (6)
alleged group members providing each other with funds and/or advice; (7) prior business interactions with alleged group
members. (For a more detailed explanation, see Howard and William 2006.)
15
there are a number of reasons why this form of informal coordination is attractive to the lead
activist.
First, the pack leader may be financially constrained and unable to acquire sufficient shares
to implement changes in the target company. Second, even if not financially constrained,
regulatory barriers such as the ―short-swing profit rule‖14
and takeover defenses such as ―poison
pill‖15
make it difficult for activists to acquire ownership over a certain holding threshold. For
example, once an activist acquires more than 10% of a target‘s shares, he is subjected to the
―short-swing profit rule‖, which may force the activist to surrender any short-swing profits to the
target company. By arranging a wolf pack, the lead activist can increase the percentage of voting
shares under its effective control without incurring these problems (Coffee and Palia 2015).
As for the pack members, learning about the impending 13D filing without being treated as
a formal 13D group member creates an opportunity for profitable trading. As mentioned earlier,
the market usually reacts positively to a 13D filing. Furthermore, being an informal member
allows the members to trade profitably without incurring the risk of future lawsuits because the
target company will usually not know of their existence (Coffee and Palia 2015).
4.2 Spontaneous Formation Hypothesis
Economic theories provide an explanation for why wolf packs might emerge, even absent
any coordination. Different investors might independently target a similar set of firms around the
same time. The most applicable model is provided by Brav et al. (2015). In their model, there are
two types of players—a large activist and many small activists—and the large activist‘s
14
Section 16(b) of the Securities Exchange Act of 1934 entitles shareholders to recover short-swing profits that are based on a
purchase and sale or a sale and purchase, within six months, of the stock of a ―reporting company.‖ The average holding period
of the activist is usually longer than six months (see Brav, Jiang and Kim 2009). Yet the activist may not want to lose the option
to turn over the position quickly. The definition of ―group‖ is the same under Section 13(d) and Section 16(b). Group activity in
both cases is governed by Section 13(d)(3) of the Exchange Act. 15
A shareholder rights plan, commonly known as poison pill, is a tool used by board of directors to deter activists. Typically,
such a plan gives shareholders (other than the activist) rights to buy more shares at a discount if an activist buys a certain
percentage or more of the company‘s share. Third Point LLC vs. Ruprecht 2014 held that the lowest statutory limit for a poison
pill is 10% of shares outstanding. If every other shareholder can buy more shares at a discount, this dilutes the activist‘s interest.
16
campaign will succeed if the number of shares owned by all activists is larger than the shares
held or controlled by management. A pack can then form around the lead activist without any
explicit communication or intentional coordination by the lead activist.
The intuition is as follows. For a given target, each activist will form an expectation on the
probability of a successful campaign (denoted as ). An activist will participate in a campaign
only if is high enough that her expected benefit exceeds her opportunity cost. When a large
activist intervenes, is increased for all small activists. Some small activists who would prefer
to not participate in the absence of the large activist will now strictly prefer to participate and
effectively form a wolf pack (see Appendix B for a summary of the model).
In this model, the entry by a large activist is synonymous with the filing of Schedule 13D.
The timing of entrance by small activists will depend on when the small activists predict that the
large activist will file a Schedule 13D (i.e., the increase in Pi) since small and large activists
often monitor the same companies and determine their targets using similar criteria. When an
event triggers a lead activist‘s engagement, smaller activists may be following the same event.
As a result, for the small activist increases, and the small activist will now want to participate
in the campaign.
4.3 Empirical analysis
In this section, I offer some evidence suggesting that that the hypothesis of a spontaneous
formation of wolf packs (without intentional coordination) is unlikely to be significant.
As mentioned above, Spontaneous Formation Hypothesis would be hard to reconcile with
the earlier evidence of substantial trading by other investors on the trigger date. In Figure 4, for
example, although both activists and other investors start accumulating shares from day −40, the
rate of accumulation increases dramatically on the trigger date and it levels off afterward. A
17
similar spike in trading on the trigger date is evident in Figures 2 and 3. While it is plausible that
other investors independently decide to accumulate shares in the same firms targeted by the 13D
filers, it seems less likely that many investors would decide to do so at the same time, and to do
it exactly on the trigger date (which is not a publicly observable event). With spontaneous
formation, the only explanation for this pattern would be that both trades by the 13D filer and
those by other investors are driven by some sudden change in market conditions. An example
would be Kyle-type traders reacting to the lead activist‘s trade or the arrival of public news.
Within the Brav et al. (2015) framework, this is equivalent to a sudden change in market
conditions on or right before the trigger date, which results in an increase in (probability of a
successful campaign) for both the large and small activists. As a result, both 13D filers and
independent investors accumulate shares in the target company simultaneously on the trigger
date. I investigate this possibility in the next section.
4.3.1 Reaction by Kyle-type traders?
On the trigger date, the 13D filer‘s trades account for 25% of the total trading volume on
average. Under the Spontaneous Formation Hypothesis, a Kyle-type small activist (see Kyle
1985) may interpret the large order flow by the 13D filer as suggesting an upcoming campaign
and thus buy shares in the target firm. To examine this possibility, I exploit the fact that not all
13D filers trade on the trigger date. This is because the mandatory 13D filing is triggered, not
only by a change in ownership (crossing the 5% threshold), but also by a change in intent, from
―passive‖ to ―active.‖ Both triggers must be satisfied before an investor must file a 13D. That is,
there is a subset of 351 campaigns with 13D filers (―13G switchers‖) who already owned more
than 5% of the target firm before the trigger date but decided to switch their investment objective
18
from passive to active on the trigger date.16
Thus, it is the change in objective that triggered the
13D filing, not a change in holdings.17
If the documented abnormal turnover was entirely or
mostly due to Kyle-type traders, there should be little or no abnormal turnover on the trigger date
for this subset of campaigns. However, as shown in Figure 5, abnormal turnover by other
investors for this subsample (the 13G switchers) is about 250% relative to normal trading
volume, similar in magnitude to the full sample (Figure 3). Hence, it does not appear that the
abnormal turnover by other investors is driven by Kyle-type traders.
[Insert Figure 5]
4.3.2 Reaction to the arrival of news?
Another type of sudden change in market conditions—the arrival of news on or right before
the trigger date—might also support the Spontaneous Formation Hypothesis. In this case, both
the 13D filer and the independent investors would accumulate shares in the target company
simultaneously on the trigger date because they have the same reaction to news related to the
target firm.
To examine this explanation, I identify a subset of 759 campaigns in which there is no
public news regarding the target firm during the 10-day period before the trigger date based on a
Factiva news search. If the documented share turnover was mostly due to public news arrival,
there should be little or no abnormal trading on the trigger date for this subset of campaigns.
However, as shown in Figure 6, abnormal turnover by other investors for this ―no news‖
subsample is about 240% relative to normal trading volume, similar in magnitude to the full
16 These investors have filed a 13G in the past. Investors without an active intent must file a 13G once they have acquired a more
than 5% holding. From the moment that these investors switch their intent, they have up to 10 days to change their filings from
13G to 13D; see Rule 13d-1(e), Exchange Act. 17
The average announcement return for this subset of campaigns is around 1.4% (3 days abnormal return centered
on the filing date).
19
sample (Figure 3). Hence, it does not appear that the arrival of news drives the abnormal
turnover by other investors.
[Insert Figure 6]
I also examine a subsample of 273 campaigns in which the four-factor abnormal stock
returns (proxy for news) are close to zero (between −0.1% and 0.1%) on both the trigger date and
one day before. Similarly, as shown in Figure 7, abnormal turnover by other investors for this
alternative ―no news‖ subsample is about 230% relative to normal trading volume, again similar
in magnitude to the full sample (Figure 3).
[Insert Figure 7]
4.3.3 Reaction to Fire-Sales?
Another type of sudden change in market condition—fire-sales by non-active
institutions—might support the Spontaneous Formation Hypothesis. Gantchev and Jotikasthir
(2015) shows that fire-sales by non-active institutional raise the probability of a firm becoming
an activist target. There are two ways in which fire-sales may trigger simultaneous reaction by
both the 13D filer and other independent activists. First, fire-sales by non-active institutional
investor may serve as a public signal indicating that the underlying firm needs an intervention.
Second, the underlying firm might have already been a pre-determined target of both the 13D
filer and the independent activists. When a non-active institution sells on the trigger date, the
additional liquidity allows the activists to hide their trades, triggering both the 13D filer and the
independent investors to trades.
To examine this explanation, similar to Gantchev and Jotikasthir (2015), I identify non-
fire-sales campaigns using three fire-sales proxies. The proxies are calculated for each stock
owned by each of the 13F institutions. First, I calculate Share_Sold as the percentage of share
20
outstanding sold. Second, I calculate Sell_Fraction_N as the number of stocks (not shares) sold
divided by the number of individual stocks bought or sold. Third, I calculate Sell_Fraction_D as
the dollar principal of all stocks sold divided by the dollar principal of all stocks bought and sold.
I identify a sub-sample of 1,175 fire-sales campaigns in which the underlying stock
owners either (1) sell more than 1% of share outstanding (Share_Sold>1%)18
, (2) sell more
number of stocks than purchase (Sell_Fraction_N>50%) or (3) sell more dollar value of shares
than purchase (Sell_Fraction_D>50%). I classify the remaining (1,922-1,175=747) 747
campaigns as non-fire-sales campaigns and examine the share turnovers for this sub-sample of
campaigns.
If the share turnovers are mostly due to fire-sales, there should be little or no abnormal
trading on the trigger date for this subset of campaigns. However, as shown in Figure 8, the
average turnover by other investors for this ―non-fire-sales‖ subsample is about 250% relative to
normal trading volume, similar in magnitude to the full sample (Figure 3). Hence, it does not
appear that fire-sales drive the abnormal turnover by other investors on the trigger date.
[Insert Figure 8]
4.3.4 Multivariate analysis of daily trading volume
Under the Spontaneous Formation Hypothesis, there are several market conditions that
may not be captured by my proxy for normal trading volume (which is only based on past
trading volume). To control for these factors, I estimate the following pooled campaign-day
regression with a total of 115,320 observations. Each observation represents a trading date within
the 60 days before the 13D filing (1,922 activist events x 60 days = 115,320 observations), and
standard errors are clustered by activist and firm:
18
The median level of Share_Sold in my sample is around 1% of shares outstanding.
21
.
(1)
The dependent variable, , measures the turnover driven by other
investors, (i.e. other than the 13D filer) scaled by normal trading volume (as in Figure 3). Hence,
if no abnormal turnover is detected, will be one. I include year-fixed effects
to control for time trends, industry-fixed effects (Fama-French 12 industries) to control for time-
invariant industry characteristics and weekday-fixed effects to control for changes in trading
across weekdays.
My main variable of interest is the Trigger_Date, an indicator variable that takes the
value of 1 if that particular date is the trigger date and 0 otherwise. This variable captures the
difference in abnormal turnover between the trigger date and every other date in the 60-day
window after controlling for other determinants of trading volume. I divide these determinants
into the following categories: 1) momentum, 2) liquidity, 3) arrival of news, and 4) other firm-
specific characteristics. As mentioned in Section 4.3.1, order flow and stock returns convey
information about the future stock price of the underlying firms and therefore may explain
trading by other investors. I include the following momentum proxies as controls: (1) Vol t−1,
calculated as percentage of shares outstanding traded on day t−1, and (2) Abn_ret t and Abn_ret
t−1, calculated as the excess return from a four-factor model on date t and date t−1.
Gantchev and Jotikasthir (2015) shows that an increase in liquidity (institutional selling)
raises the probability of a firm becoming an activist target. If such an increase simultaneously
raises the probability of a firm‘s shares being purchased by other investors, then share turnover
may be higher on the trigger date. I therefore include the following proxies to control for
liquidity: 1) Institutional Sales calculated as the percentage of share outstanding sold by
22
institutional investors on day t (see Gantchew and Jotikasthir 2015); 2) Amihud t, calculated as
ratio of stock return to trading volume on day t; and 3) Log (MV), calculated as the natural
logarithm of the firm market value at the beginning of the calendar year.
As mentioned in Section 4.3.2, the arrival of news on or right before the trigger date may
induce both the 13D filer and the independent investors to accumulate shares in the target
company simultaneously. I include the following news proxies as controls: (1) 10K, 8K, and 10Q
are indicator variables for Forms 10-K, 8-K, and 10Q that are filed on day t; (2) I/B/E/S forecast
is an indicator variable for the issuance of I/B/E/S analysts forecast on day t; (3) Management
Guidance is an indicator variable for the issuance management guidance on day t.
I also include a number of others firm characteristics that may be correlated with share
turnover: 1) Bid Ask Spread t, calculated as the absolute difference between the bid (low) and ask
(high) of the trading date t; 2) 13D Filer Holdings, calculated as the holdings by the 13D filer on
the filing date; 3) Institutional Holding, calculated as the percentage of shares outstanding held
by institutional investors in the most recent quarter (source: Thomson Reuters 13F Filings); and
4) Analyst Following, calculated as the number of analysts following the firm.
The results indicate that the abnormal turnover by other investors cannot be fully driven by
the arrival of news, changes in liquidity, momentum, and other firm-specific characteristics. As
shown in Table 3 Panel A, Column (1), even after controlling for these factors, the coefficient of
Trigger_Date is approximately 1.23, implying that on the trigger date share turnover is 123%
higher than other days in the 60-day window, on average. This means that the turnover driven by
other investors on the trigger date is around 228% of normal trading volume (sum of intercept
1.05 and coefficient on Trigger_Date of 1.23). This confirms, in a multivariate setting, the
evidence from Figure 3.
23
I further divide my sample into 13G switchers (similar to Figure 5) and non-switchers. In
Column 2, the indicator variable Trigger date & 13G switcher (non-switcher) takes the value of
1 if the filer is a 13G switcher (non-switcher) and that particular date is a trigger date and 0
otherwise. The coefficient on Trigger date & 13G switcher at 1.21 is significant and positive and
is insignificantly different from the coefficient on non-switcher (Trigger date & non switcher) at
1.28. This implies that the abnormal turnover is unlikely to be driven by Kyle-type investors
following trades by 13D filers.
Next, I divide my sample into campaigns with and without news (based on my Factiva
search) in the 10 days before the trigger date, similar to Figure 6. In Column (3) the indicator
variable Trigger date & no news takes the value of 1 if the campaign have no news and that
particular date is a trigger date and 0 otherwise. The coefficient on Trigger date & no news is
significant at 1.18, implying that, even for campaigns without any news, on the trigger date,
share turnover is 118% higher than other days in the 60-day window, on average.
Similar to Figure 7, as an alternative proxy for arrival of news, I divide my sample into
campaigns that have high absolute returns and low absolute returns (the later defined as
abnormal returns between −0.1% and 0.1%). In Column (4), the indicator variable Trigger date
& low return takes the value of 1 if the campaign has a low return and that particular date is a
trigger date and 0 otherwise. The coefficient on Trigger date & low return is significant at 1.20,
implying that, on the trigger date, share turnover is 120% higher than other days in the 60-day
window, on average.
Lastly, similar to Figure 8, I divide my sample into fire-sales and non-fire-sales campaigns.
In Column (5), the indicator variable Trigger date & non-fire-sales takes the value of 1 if the
campaign is a non-fire-sales campaign and that particular date is a trigger date and 0 otherwise.
24
The coefficient on Trigger date & non-fire-sales is significant at 1.26, implying that, on the
trigger date, share turnover is 126% higher than other days in the 60-day window, on average.
As shown in Panel B, in Column (3) and (4), the magnitude of the coefficient of the
variable of interest (respectively, Trigger date & no news and Trigger date & low returns) is
statistically lower than the coefficient on the corresponding indicators (respectively, Trigger date
& have news and Trigger date & high returns). However, the economic difference is small,
suggesting that a significant portion of the abnormal trading around the trigger date (when there
are no news) remains unexplained. This implies that the arrival of news does not explain the
observed abnormal trading volume, except in small part.
[Insert Table 3]
4.3.5 Prior relationships
The collective evidence above suggests that my findings are not consistent with
spontaneous formation and thus suggests that many wolf packs likely result from coordinated
efforts by lead activists. It is more difficult to directly test the Coordinated Effort Hypothesis
because one cannot observe private communications among investors. Nonetheless, I devise a
test that may more directly speak to this hypothesis, examining the past relationship between the
investor buying shares (the presumed pack member) and the lead activist. To identify each buyer,
I must first obtain the identity of the investor executing each trade, which is not publicly
available. To overcome this data limitation, I obtain from a consulting firm a proprietary dataset
that includes transaction-level trading data by more than 900 institutional investors (Gantchev
and Jotikasthir (2015), Green (2006), and Klein and Tao (2015) use a similar proprietary dataset.
For stocks covered by both my dataset and CRSP, my dataset accounts for roughly 10-15% of
the total CRSP trading volume.
25
The dataset spans January 1, 1998, to December 31, 2010. It includes the complete
transaction history for all of its institutional clients. There are two ways an institution can enter
the database. It can invest on behalf of a plan sponsor that subscribes, or it can subscribe directly.
Each observation corresponds to an executed trade. For each trade, the database reports the date
of the trade, the execution price of the trade, the stock traded, the number of shares traded,
whether the trade was a buy or a sell, and a unique client identity code for the institution making
the trade. The client identifier corresponds to the plan sponsor or money manager who is a client
of the consulting firm. The client identifier is a permanent numeric code, which allows me to
track a given client both in the cross-section and through time. The identity of the clients is not
provided.
Using this dataset, I create an empirical proxy for past relationship. For each activist-
institution pair, I calculate the number of times that a particular institution has participated in a
prior campaign leaded by that particular activist within the last year (denoted as Past
Relationship). I classify an institution as a participant if that institution purchased shares on the
trigger date of the previous campaign. Since estimating Past Relationship requires at least one
lag year of data I restrict my sample to 1999-2010 (my sample begins in 1998) and examine if an
institution is more likely to participate in an activist‘s campaign if the institution has done so in
the last year. Specifically, I estimate the following regression for 1,233 campaigns in which at
least one of the institutions traded on the trigger date (i.e. there are 1,922-1,233=689 campaigns
in which I was unable to locate any trades in my dataset or took place prior to 1999):
, (2)
where Buying is an indicator variable which equals to 1 if the trading institution accumulated a
positive number of shares in the target on the trigger date and zero otherwise.
26
Table 4 Column (1) estimates Eq. (2) as a probit regression and find an average marginal
effect is ~8%. This implies that one standard deviation increase in Past Relationship leads to a
8% increase in the probability of the institution buying shares of the firms targeted by the same
activist (i.e., an institution is more likely to participate in an activist‘s campaign if the institution
has done so in the past; the average probability that an institution will buy a target stock given
that they traded on the trigger date is ~40%).
Similarly, Column (2) estimates Eq. (2) as a standard OLS regression. The coefficient on
Past Relationship is positive, significant, and similar in magnitude as the probit specifications
above. This is consistent with the notion that lead activists are more likely to tip off investors
with whom they had a prior relationship. Although unlikely (given my results in section 4.3.1 to
4.3.4), it remains possible that the same activist-institution pairs are observed multiple times
across different target firms simply because these pairs employ similar investment strategies.
[Insert Table 4]
4.3.6 Reputation of the activists
Next, I examine if reputation of the lead activists have an impact on wolf pack formation.
Under the Coordinated Effort Hypothesis, wolf-pack members are more likely to participate in a
campaign if the lead activist is reputable. First, this may be because other potential pack
members perceive reputable activists to have better due-diligence, select less risky campaigns
and have better support from other shareholders. Second, reputable activists may have better
relationships with other potential wolf-pack members.
I use the number of times an activist has led a campaign as an empirical proxy for the
reputation of the activist. Reputable Activist is an indicator variable equals to 1 if the activist is 1
27
of the 20 most prominent activists in my sample and zero otherwise.19
In particular I estimate the
following regression for 1,922 campaigns:
(3)
As a proxy for the likely presence of a wolf pack, I use the indicator Wolf Pack, set equal to
1 if
on the trigger date (the dependent variable in regression 1) is in the top
quartile and 0 otherwise.
Table 4 Column (3) estimates Eq. (3) as a probit regression and finds an average marginal
effect is ~3%. This implies that a campaign led by a reputable activist has a 3% higher
probability of being associated with wolf pack formation. Similarly, Column (4) estimates Eq.
(3) as a standard OLS regression. The coefficient on Reputable Activist is positive, significant,
and similar in magnitude as the probit specifications above. This is consistent with the notion
that pack-members are not only aware of an upcoming campaign, but also the identity of the lead
activist. Although unlikely (given my results in section 4.3.1 to 4.3.5), it remains possible that
reputable activists participate in campaigns that are more predictable.
Overall, my findings suggest that spontaneous formation is unlikely to play a significant
role. A large portion of abnormal turnover documented in Figure 3 remains unexplained even
after controlling for arrival of news, momentum trading, changes in liquidity and other firm
specific factors. Rather, wolf packs appear to be intentionally created by lead activists since
investors who accumulate shares prior to the 13D filing (i.e., the public announcement) are more
likely to be those who have a prior relationship with the lead activist. Further, it appears that
investors are not only aware of an upcoming campaign, but they are also aware of the identity of
the lead activists.
19
The number of campaigns led by the 20 most prominent activists range from 21 to 195 campaigns.
28
5. Does forming a pack improve the activist campaign’s outcome?
Next, I move to my last research question—the impact of coordination among packs
members. The collective action literature has long predicted that institutional investors might
benefit from coordinating (e.g., Olson 1971; Zwiebel 1995; Corum 2015). But it remains unclear,
empirically, whether institutional investors do coordinate and whether this coordination is
effective. The literature generally focuses on the formal organization of institutional investors
aiming to implement collective action in target firms, with mixed findings. Song and Szewczyk
(2003) examine the Council of Institutional Investors‘ Focus List as an example of formal
coordination between institutional investors but find no evidence of effective coordination.20
Doidge et al. (2015), in contrast, find that formal coordination between investors in Canada
(through the Canadian Coalition for Good Governance) can improve corporate governance of
target firms.
A wolf pack may be viewed as a form of informal coordination. An effective pack should
increase the chances of a successful campaign, but it is not obvious that the coordination would
always work. For example, if members have already accumulated shares in the target company
on the trigger date and if most of the expected value from the campaign is incorporated into
stock prices at the 13D filing date (the average announcement return ranges between 3% and
10%; see Brav et al. 2008, Klein et al. 2009), there may be little incentive for the members to
hold on to shares in the target and support the leader during the campaign. But the lead activist
may overcome this problem by providing private benefits to members, conditional on campaign
outcome (this is an assumption of the Brav et al. (2015) model). These private benefits may take
various forms. For example, the pack members may receive preferred treatment if the lead
20 Relative to a sample of control firms, the authors found no evidence that targeted firms have better analyst forecasts, more
frequent mergers and stock repurchases.
29
activist is appointed to the board of the target. A successful campaign may also help the pack
members to deepen their relationship with the lead activist. Such a relationship may provide
small activists with information and connections to other activists in future campaigns.21
Hence,
the wolf-pack members may have an incentive to hold on to their shares throughout the entire
campaign and enhance the lead activist‘s bargaining power, thereby making the campaign more
likely to succeed.
5.1 Empirical analysis
In this section, I employ the following linear regression to estimate the relationship
between the existence of a wolf pack and the activist‘s level of success:
(4)
As a proxy for the likely presence of a wolf pack, I use the indicator Wolf Pack, set equal to
1 if
on the trigger date (the dependent variable in regression 1) is in the top
quartile and 0 otherwise. This indicator captures the incremental successes for the wolf-pack
campaign after controlling for other determinants of campaign outcome. I divide these
determinants into the following categories: 1) proxy advisors, 2) campaign characteristics, 3)
arrival of news, 4) liquidity, 5) momentum, and 6) other firm-specific characteristics.
Prior literature finds that proxy advisors can influence shareholder votes (e.g., Ertimur,
Ferri, and Oesch 2013). I therefore include recommendations by Institutional Shareholder
Services (ISS) and Glass Lewis & Co. (GL) as a control. The indicator variable ISS
Recommendation (Glass Lewis Recommendation) takes on the value of 1 when if ISS (GL)
makes a recommendation for the lead filer and 0 otherwise.
21 Information and connections are likely to be important. Pulliam, Chung, Benoit, and Barry (2014), for example, report that
―many high profile investors who know each other don‘t want either to get blindsided by another‘s investing—or to blindside
others.‖
30
I also include the following campaign-specific characteristics which have been shown to
affect the campaign‘s outcome (see Shivdasani 1993; Ahmed and Duellman 2007; Anderson,
Mansi and Reeb 2004): 1) Hostile Offer, Lawsuit, and Unsolicited Offer are indicator variables
that take the value of 1 if the lead activist makes a hostile offer, files a lawsuit, or makes an
unsolicited offer respectively and 0 otherwise; 2) Classified Board is an indicator variable that
takes on the value of 1 if the target firm has a classified board; 3) Poison Pill is an indicator
variable that takes on the value of 1 if a poison pill was either in effect or adopted in response to
the 13D filer‘s campaign and 0 otherwise.
My main variable of interest, Wolf Pack, is based on the turnover on the trigger date. Part
of this turnover may be driven by changes in market conditions which are unrelated to wolf-pack
formation but is somehow correlated with campaign outcomes. Therefore, I include the same
control variables from Eq. (1) to control for correlated omitted variable biases. As discussed in
Section 4.3.4, these variables relate to the arrival of news, changes in liquidity, momentum, and
other firm-specific characteristics.
To measure the outcome of the activist campaign, I rely on the description of the
campaign‘s objective and outcome provided in the ―Comment‖ section of the SharkRepellent
database. I manually classify each campaign into one of the following six categories: success,
partial success, settled, withdrawn, failed, ongoing, and not enough information. Examples of
each are provided in Appendix C. After removing campaigns coded as ongoing and not enough
information, my final subsample consists of 1,484 campaigns.
In Table 5, Columns (1) and (2), the dependent variable is , which is set to 1 if
the campaign is coded as a success, partial success, settled, or withdrawn and 0 if the campaign
is coded as failed. Column (1) estimates Eq. (4) as a probit regression and shows that the average
31
marginal effect of the variable Wolf Pack is positive and significant at 6.2%. In untabulated tests,
I re-run the same regression after removing campaigns that are coded as settled or withdrawn,
with similar results. As a robustness test, I also estimate Eq. (4) using a standard OLS regression,
which allows me to cluster standard errors by activists and firm.22
Consistent with the prior
results, Column (2) shows that the probability of achieving at least part of the activist‘s objective
is about 7.3% higher for campaigns accompanied by wolf packs (the average success rate in the
sample is ~74%.).
As shown in Table 2 Panel F, the most frequently sought after objective by the hedge fund
activists is board representation. Thus I also examine whether the activists were granted board
seats (a more objective approach to identifying campaign outcome). Using the description
provided by SharkRepellent, I identify a subset of 716 campaigns in which the activist requested
at least one board seat.
In Columns (3) and (4), the dependent variable is , which is set to 1 if the
activists gain at least one board seat and 0 otherwise. The key independent variable is the
indicator variable , defined above. Column (3), estimated as a probit regression,
shows that the average marginal effect of Wolf Pack is positive and significant at 8.7%. As a
robustness test, I re-estimated Eq. (4) as a standard OLS regression and cluster standard errors by
activist and firm. Consistent with prior results, in Column (4) the probability of winning a board
seat is about 8.9% higher for a campaign accompanied by a wolf pack (the average probability of
gaining a seat is ~65 %.).
I also examine whether wolf packs are associated with winning more seats. I do so by
replacing the dependent variable with , which is the number of seats gained by the
22 Since each activist and firm may appear more than once in my regression, the error within each activist/firm group may be
correlated, leading to biased standard errors. Re-estimating Eq. (4) using standard OLS allows me to address this issue by
clustering standard errors two ways (by firms and activists).
32
lead activist (as reported in SharkRepellent). The coefficient on Wolf Pack is positive and
significant; indicating that campaigns accompanied by a wolf pack gain an average 0.22 seats
more (the average number of seats won by an activist is 1.45.).
[Insert Table 5]
5.2 Alternative measures of success
One of the ultimate objectives for hedge fund activists is to earn a positive return on their
stock holdings. Therefore as an alternative measure of success, I examine the long window buy
and hold stock abnormal return (BHAR) for the duration of the campaign. I use the 13D filing
date as the first day of the activism campaign and the end date reported by SharkRepellent as the
last day of the campaign.23
Table 6 presents the difference in BHAR between wolf pack and non-wolf pack campaigns.
The average BHAR for a wolf-pack campaign is 8.3% higher than a non-wolf-pack campaign, as
indicated by the positive and statistically significant coefficient on Wolf Pack in Column (1). In
addition, I also examine whether buy and hold excess (raw return less market return) and raw
return is higher for wolf-pack campaigns. Similarly, as indicated in Columns (2) and (3), the
excess return is 5.5% and raw return is 6.9% higher for wolf-pack campaigns. It does not appear
that such differences in returns are anticipated by the market at the time of campaign
announcement; in the next section (reverse causality) I examine the announcement date return in
Table 8 and find no significant difference between wolf pack and non-wolf pack campaigns.
[Insert Table 6]
23 The end date as reported by SharkRepellent is the date that signals the end of a campaign. For campaigns that are associated
with a proxy fight, this date is usually the date that the proxy fight went to a vote or ended if it did not go the distance. For non-
proxy fight campaigns, this is the most logical date that signals the end of the campaign. For example, if the activist requested the
company to seek a buyer, the end date would be the date that the company agreed to be acquired. For campaigns that are missing
end date in SharkRepellent, I use the filing date of the last schedule 13D/A as the end date of the campaign. The SEC requires
13D filers to report any material changes in holdings (1% or more) under the schedule 13D/A, the last schedule 13D/A is usually
filed because the activist is unwinding his/her position.
33
To summarize, my findings suggest that campaigns accompanied by wolf packs are more
likely to be successful. My evidence is also consistent with the idea that given the right
conditions, institutional investors can effectively coordinate with each other even in the absence
of any formal agreement. Note that the tests above are a joint test of the validity of my empirical
proxy and the effect of wolf packs on the outcome of the campaign. Under the assumption that
wolf packs necessarily improve the rate of success of the campaign (because of the higher
percentage of votes de facto controlled by the activist), then the documented positive association
may be viewed as an indirect validation of my empirical proxy for wolf packs.
5.3 Reverse Causality
A positive association between the presences of wolf pack and campaign outcome does not
necessarily imply that institutional investors are coordinating effectively (i.e. members are
supporting the lead activists); instead the pack members merely join campaigns that are more
likely to be successful and do not support the lead activist during the campaign because of
coordinated efforts. If such a story was true, I would expect to observe wolf packs formation
around ―easy targets‖ (targets that are less well-defended for example) only. It should also be
noted that reverse causality is more consistent under the Spontaneous Formation Hypothesis,
since wolf-pack formation is a result of rational anticipation by members, and the lead activists
cannot choose to create or deter a wolf pack.
In contrast, the effective coordination story is more consistent with the Coordinated Effort
Hypothesis, and I expect to observe wolf packs formation around ―more difficult targets‖ only.
This is because it is costly for a lead activist to recruit other members: first, other members will
start accumulating shares together with the lead activist, pushing prices upwards and making it
more costly for the lead activist to achieve his target stake; second, by arranging a wolf pack the
34
lead activist may incur additional litigation risk (although it remains unclear whether such
arrangement breaches any securities regulations). Therefore, a lead activist will only recruit other
members for ―more difficult targets.‖ Furthermore, if pack members are only ―free riding‖ and
do not generate any benefit for the lead activist, in equilibrium I do not expect to observe any
wolf-pack formation.
I employ the following linear regression to estimate the relationship between the existence
of a wolf pack and the level of defense employed by the underlying target:
(5)
I use the Bullet Proof Rating from FactSet as an empirical proxy for a company‘s relative
defense against activism campaigns. The rating is a proprietary index which takes into account
significant components that impact takeover defenses. It includes only proactive defenses
undertaken by the target.24
The rating scale is from 0 to 10, with a 10 representing the most
formidable defenses. The regression results for regression 4 are presented in table 7. Inconsistent
with reverse causality, the coefficients on Bullet Proof Rating (Columns 1 and 2) are positive and
significant at the 10% level, suggesting that lead activists are more likely to employ the wolf-
pack tactics in better defended companies.
As mentioned previously in section 4.1, one of the major benefits of the wolf-pack
arrangement is that it allows the lead activist to ―control‖ a higher level of share outstanding
without triggering the ―poison pills‖. Therefore, I replaced Bullet Proof Rating and used Poison
Pill as an alternative proxy for a company‘s relative defense against activism campaigns. Again,
inconsistent with reverse causality, the coefficients on Poison Pill (Columns 3 and 4) are positive
and significant, suggesting that lead activists are more likely to employ the wolf-pack tactic in
24 The rating does not take into consideration ownership and voting rights, the takeover laws which govern the state in which a
company is incorporated, nor whether a company has opted out of coverage of applicable state takeover laws.
35
companies that are more likely to adopt a poison pill. In Columns (5) and (6), I separated Poison
Pill into two separate components, targets that responded to the campaign by adopting a pill (Pill
in Response to Campaign) and targets that already had a pill in place (Pill in Force Prior to
Campaign). Interestingly, only the coefficient on Pill in Response to Campaign is statistically
significant, suggesting that lead activists can anticipate future pill adoption by management.
[Insert Table 7]
Instead of selecting ―easy targets‖, pack members may select campaigns that have high
expected benefits. Therefore, I use the announcement date return as an ex-ante measure for the
campaign‘s expected payoff and examine such reverse causality. In table 8, I replaced Bullet
Proof Rating in Eq. (5) with varies short window announcement date return. If my results are
driven by reverse causality, I expect to observe wolf-pack formation around campaigns with a
high level of expected payoffs. However, consistently none of the coefficients on the returns
measures were statistically significant at conventional levels. This further confirms that my
results are unlikely to be driven by reverse causality.
[Insert Table 8]
36
6. Conclusion
I find evidence consistent with the existence of wolf packs by documenting share
accumulation by other investors before public disclosure of 13D filings. These accumulations
tend to concentrate on the trigger date. Further analyses suggest that it is unlikely that they are
solely driven by investors spontaneously responding to changes in market conditions. Instead,
those who accumulate shares before a 13D filing are more likely to be investors who have a
relationship with the lead activist, which is consistent with coordination by a pack leader. I also
show that this sort of trading is positively associated with future campaign success in terms of
whether the activist achieves his stated objectives.
Researchers‘ understanding of wolf packs could be further strengthened by examining the
economic determinants of pack formation. Future researchers might, for example, consider the
role of information asymmetry in pack formation. On one hand, timely and reliable information
about a target would allow pack members to efficiently decide whether to join the campaign. On
the other, the benefit of effective monitors, such as hedge fund activists, is most important in
settings characterized by high information asymmetry (as articulated by Bushman et al. 2004).
Furthermore, concentrated ownership allows a wolf pack to more effectively influence
management and secure private benefits from other non-equity stakeholders. To the extent that
timely and reliable disclosures constrain the ability of block holders to secure private benefits,
one would expect a positive relationship between wolf-pack formation and information
asymmetry.
It is beyond the reach of this paper to investigate whether hedge funds are breaching the
group disclosure requirement of schedule 13D. But the evidence here does suggest that wolf
packs are a frequently used tactic. Whether this behavior should be encouraged might be a topic
37
for policymakers to consider. If wolf packs are encouraged, is their value sufficient to overcome
the potentially unfair advantage given to hedge fund activists? Conversely, would discouraging
wolf packs undermine the monitoring role that activists serve? These are important policy
questions that future researchers can consider.
38
References
Admati, A. R., P. Pfleiderer, and J. Zechner. 1994. Large Shareholder Activism, Risk Sharing,
and Financial Market Equilibrium. Journal of Political Economy 102 (6):1097-1130.
Ahmed, A. S., and S. Duellman. 2007. Accounting conservatism and board of director
characteristics: An empirical analysis. Journal of Accounting and Economics 43 (2–3):411-
437.
Amihud, Y. 2002. Illiquidity and stock returns: cross-section and time-series effects. Journal of
Financial Markets 5 (1):31-56.
Anderson, R. C., S. A. Mansi, and D. M. Reeb. 2004. Board characteristics, accounting report
integrity, and the cost of debt. Journal of Accounting and Economics 37 (3):315-342.
Armstrong, C., S. Huang, and D. Taylor. 2015a. The Effect of Institutional Ownership on
Corporate Transparency. Working Paper.
Armstrong, C. S., J. L. Blouin, A. D. Jagolinzer, and D. F. Larcker. 2015b. Corporate
governance, incentives, and tax avoidance. Journal of Accounting and Economics 60 (1):1-
17.
Armstrong, C. S., J. E. Core, and W. R. Guay. 2014. Do independent directors cause
improvements in firm transparency? Journal of Financial Economics 113 (3):383-403.
Armstrong, C. S., I. D. Gow, and D. F. Larcker. 2013. The Efficacy of Shareholder Voting:
Evidence from Equity Compensation Plans. Journal of Accounting Research 51 (5):909-
950.
Armstrong, C. S., W. R. Guay, and J. P. Weber. 2010. The role of information and financial
reporting in corporate governance and debt contracting. Journal of Accounting and
Economics 50 (2–3):179-234.
Armstrong, C. S., C. D. Ittner, and D. F. Larcker. 2012. Corporate governance, compensation
consultants, and CEO pay levels. Review of Accounting Studies 17 (2):322-351.
Balachandran, S. V., P. Joos, and J. Weber. 2012. Do Voting Rights Matter? Evidence From the
Adoption of Equity-Based Compensation Plans*. Contemporary Accounting Research 29
(4):1204-1236.
Beaver, W. H. 1968. The Information Content of Annual Earnings Announcements. Journal of
Accounting Research 6:67-92.
Bebchuk, L., A. Brav, and J. Wei. 2015. The Long-Term Effects of Hedge Fund Activism.
Columbia Law Review 115 (5):1085-1155.
Bebchuk, L., and R. Jackson. 2012. The Law and Economics of Blockholder Disclosure.
Harvard Business Law Review 2 (1):39-60.
Bebchuk, L. A., A. Brav, R. J. Jackson, Jr., and W. Jiang. 2013. Pre-Disclosure Accumulations
by Activist Investors: Evidence and Policy. Journal of Corporation Law 39 (1):1-34.
Becht, M., J. Franks, J. Grant, and H. Wagner. 2015. The Returns to Hedge Fund Activism: An
International Study. Working Paper.
39
Berger, P. G., and E. Ofek. 1996. Bustup Takeovers of Value-Destroying Diversified Firms. The
Journal of Finance 51 (4):1175-1200.
Berger, P. G., E. Ofek, and D. L. Yermack. 1997. Managerial Entrenchment and Capital
Structure Decisions. The Journal of Finance 52 (4):1411-1438.
Boyson, N., L. Ma, and R. Mooradian. 2015. What Causes Performance Persistence in Hedge
Fund Activism? Working Paper.
Brav, A., A. Dasgupta, and R. Mathews. 2015a. Wolf Pack Activism. Working Paper.
Brav, A., W. Jiang, and H. Kim. 2009. Hedge Fund Activism: A Review. Foundations and
Trends in Finance 4 (3):185-246.
———. 2015b. Hedge Fund Activism. Annual Review of Financial Economics 7 (1).
———. 2015c. The Real Effects of Hedge Fund Activism: Productivity, Asset Allocation, and
Labor Outcomes. Working Paper.
Brav, A., W. Jiang, F. Partnoy, and R. Thomas. 2008. Hedge Fund Activism, Corporate
Governance, and Firm Performance. The Journal of Finance 63 (4):1729-1775.
Briggs, T. W. 2007. Corporate Governance and the New Hedge Fund Activism: An Empirical
Analysis. Journal of Corporation Law 32 (4):681-723,725-738.
Brown, S., W. Goetzmann, B. Liang, and C. Schwarz. 2008. Mandatory Disclosure and
Operational Risk: Evidence from Hedge Fund Registration. The Journal of Finance 63
(6):2785-2815.
Bushee, B. J. 1998. The Influence of Institutional Investors on Myopic R&D Investment
Behavior. The Accounting Review 73 (3):305-333.
Bushman, R., Q. Chen, E. Engel, and A. Smith. 2004. Financial accounting information,
organizational complexity and corporate governance systems. Journal of Accounting and
Economics 37 (2):167-201.
Cao, C., Y. Chen, B. Liang, and A. W. Lo. 2013. Can hedge funds time market liquidity?
Journal of Financial Economics 109 (2):493-516.
Cassar, G., and J. Gerakos. 2010. Determinants of Hedge Fund Internal Controls and Fees. The
Accounting Review 85 (6):1887-1919.
———. 2011. Hedge Funds: Pricing Controls and the Smoothing of Self-reported Returns. The
Review of Financial Studies 24 (5):1698-1734.
Celarier, M. 2013. Now, it gets ugly: Ackman to sic SEC on Soros ‗trade‘. New York Post,
August 1, 2013.
Chen, X., Q. Cheng, A. K. Lo, and X. Wang. 2015a. CEO Contractual Protection and Managerial
Short-Termism. The Accounting Review 90 (5):1871-1906.
Chen, X., Q. Cheng, and X. Wang. 2015b. Does increased board independence reduce earnings
management? Evidence from recent regulatory reforms. Review of Accounting Studies 20
(2):899-933.
Cheng, C. S. A., H. H. Huang, and Y. Li. 2015. Hedge Fund Intervention and Accounting
Conservatism. Contemporary Accounting Research 32 (1):392-421.
40
Cheng, C. S. A., H. H. Huang, Y. Li, and J. Stanfield. 2012. The Effect of Hedge Fund Activism
on Corporate Tax Avoidance. The Accounting Review 87 (5):1493-1526.
Clifford, C. P. 2008. Value creation or destruction? Hedge funds as shareholder activists. Journal
of Corporate Finance 14 (4):323-336.
Coffee, J., and D. Palia. 2015. The Wolf at the Door: The Impact of Hedge Fund Activism on
Corporate Governance. Working Paper.
Cohen, D. A., A. Dey, and T. z. Lys. 2013. Corporate Governance Reform and Executive
Incentives: Implications for Investments and Risk Taking. Contemporary Accounting
Research 30 (4):1296-1332.
Collin-Dufresne, P., and V. Fos. 2015. Do Prices Reveal the Presence of Informed Trading? The
Journal of Finance 70 (4):1555-1582.
Collins, D. W., and S. P. Kothari. 1989. An analysis of intertemporal and cross-sectional
determinants of earnings response coefficients. Journal of Accounting and Economics 11
(2):143-181.
Core, J. E., W. Guay, and D. F. Larcker. 2008. The power of the pen and executive
compensation. Journal of Financial Economics 88 (1):1-25.
Core, J. E., W. R. Guay, and R. E. Verrecchia. 2003. Price versus Non-Price Performance
Measures in Optimal CEO Compensation Contracts. The Accounting Review 78 (4):957-
981.
Corum, A. L., Doron. 2015. Corporate Control Activism. Working Paper.
Coughlan, A. T., and R. M. Schmidt. 1985. Executive compensation, management turnover, and
firm performance: An empirical investigation. Journal of Accounting and Economics 7 (1–
3):43-66.
Cuñat, V., M. Gine, and M. Guadalupe. 2013. Corporate Governance and Value: Evidence from
―Close Calls‖ On Shareholder Governance Proposals. Journal of Applied Corporate
Finance 25 (1):44-54.
DeFond, M., M. Hung, and R. Trezevant. 2007. Investor protection and the information content
of annual earnings announcements: International evidence. Journal of Accounting and
Economics 43 (1):37-67.
Dhaliwal, D., M. Erickson, and S. Heitzman. 2009. Taxes and the backdating of stock option
exercise dates. Journal of Accounting and Economics 47 (1–2):27-49.
Dichev, I. D., and G. Yu. 2011. Higher risk, lower returns: What hedge fund investors really
earn. Journal of Financial Economics 100 (2):248-263.
Doidge, C. D., Alexander; Mahmudi, Hamed; Virani, Aazam. 2015. Can Institutional Investors
Improve Corporate Governance Through Collective Action? Working Paper.
Erickson, M., S.-W. Wang, and X. F. Zhang. 2012. The change in information uncertainty and
acquirer wealth losses. Review of Accounting Studies 17 (4):913-943.
Ertimur, Y., F. Ferri, and D. Oesch. 2013. Shareholder Votes and Proxy Advisors: Evidence
from Say on Pay. Journal of Accounting Research 51 (5):951-996.
41
———. 2015. Does the director election system matter? Evidence from majority voting. Review
of Accounting Studies 20 (1):1-41.
Ertimur, Y., F. Ferri, and S. R. Stubben. 2010. Board of directors' responsiveness to
shareholders: Evidence from shareholder proposals. Journal of Corporate Finance 16
(1):53-72.
Ertimur, Y., E. Sletten, and J. Sunder. 2014. Large shareholders and disclosure strategies:
Evidence from IPO lockup expirations. Journal of Accounting and Economics 58 (1):79-
95.
Feng, M., W. Ge, S. Luo, and T. Shevlin. 2011. Why do CFOs become involved in material
accounting manipulations? Journal of Accounting and Economics 51 (1–2):21-36.
Ferri, F., and T. Sandino. 2009. The Impact of Shareholder Activism on Financial Reporting and
Compensation: The Case of Employee Stock Options Expensing. The Accounting Review
84 (2):433-466.
Fischer, P. E., J. D. Gramlich, B. P. Miller, and H. D. White. 2009. Investor perceptions of board
performance: Evidence from uncontested director elections. Journal of Accounting and
Economics 48 (2–3):172-189.
Gantchev, N., and C. Jotikasthir. 2015. Hedge Fund Activists: Do They Take Cues from
Institutional Exit? Working Paper.
Gillan, S. L., and L. T. Starks. 2007. The Evolution of Shareholder Activism in the United
States*. Journal of Applied Corporate Finance 19 (1):55-73.
Godnick, H. G., William. 2006. Beware the Counterattack Against Activist Investors: The Group
Trap, edited by S. R. Z. LLP.
Gormley, T. A., D. A. Matsa, and T. Milbourn. 2013. CEO compensation and corporate risk:
Evidence from a natural experiment. Journal of Accounting and Economics 56 (2–3,
Supplement 1):79-101.
Gow, I. S., Sa-Pyung; Srinivasan, Suraj. 2014. Consequences to Directors of Shareholder
Activism. Working Paper.
Green, T. C. 2006. The Value of Client Access to Analyst Recommendations. Journal of
Financial and Quantitative Analysis 41 (01):1-24.
Hamm, S. J. W., M. J. Jung, and C. Wang. 2015. Making Sense of One Dollar CEO Salaries.
Contemporary Accounting Research 32 (3):941-972.
Healy, P. M. 1985. The effect of bonus schemes on accounting decisions. Journal of Accounting
and Economics 7 (1–3):85-107.
Healy, P. M., S.-H. Kang, and K. G. Palepu. 1987. The effect of accounting procedure changes
on CEOs' cash salary and bonus compensation. Journal of Accounting and Economics 9
(1):7-34.
Ho, J. L. Y., L.-C. Lee, and A. Wu. 2009. How Changes in Compensation Plans Affect
Employee Performance, Recruitment, and Retention: An Empirical Study of a Car
Dealership*. Contemporary Accounting Research 26 (1):167-199.
42
Hodge, F. D., S. Rajgopal, and T. Shevlin. 2009. Do Managers Value Stock Options and
Restricted Stock Consistent with Economic Theory?*. Contemporary Accounting Research
26 (3):899-932.
Hoffman, L., and D. Benoit. 2015. SEC Probes Activist Funds Over Whether They Secretly
Acted in Concert. The Wall Street Journal, June 4, 2015.
Jagolinzer, A. D., D. F. Larcker, and D. J. Taylor. 2011. Corporate Governance and the
Information Content of Insider Trades. Journal of Accounting Research 49 (5):1249-1274.
Klein, A. 2002. Audit committee, board of director characteristics, and earnings management.
Journal of Accounting and Economics 33 (3):375-400.
Klein, A., and E. Zur. 2009. Entrepreneurial Shareholder Activism: Hedge Funds and Other
Private Investors. The Journal of Finance 64 (1):187-229.
———. 2011. The Impact of Hedge Fund Activism on the Target Firm's Existing Bondholders.
The Review of Financial Studies 24 (5):1735-1771.
Klein, A. L., Tao. 2015. Acquiring and Trading on Complex Information: How Hedge Funds
Use the Freedom of Information Act. Working Paper.
Kyle, A. S. 1985. Continuous Auctions and Insider Trading. Econometrica 53 (6):1315-1335.
Laux, V. 2008. Board Independence and CEO Turnover. Journal of Accounting Research 46
(1):137-171.
Leuz, C., K. V. Lins, and F. E. Warnock. 2010. Do Foreigners Invest Less in Poorly Governed
Firms? Review of Financial Studies 23 (3):3245-3285.
Lewellen, W., C. Loderer, and A. Rosenfeld. 1985. Merger decisions and executive stock
ownership in acquiring firms. Journal of Accounting and Economics 7 (1):209-231.
Li, F., M. Minnis, V. Nagar, and M. Rajan. 2014. Knowledge, compensation, and firm value: An
empirical analysis of firm communication. Journal of Accounting and Economics 58
(1):96-116.
Lo, K. 2003. Economic consequences of regulated changes in disclosure: the case of executive
compensation. Journal of Accounting and Economics 35 (3):285-314.
Maffett, M. 2012. Financial reporting opacity and informed trading by international institutional
investors. Journal of Accounting and Economics 54 (2–3):201-220.
Millman, G. 2015. The Morning Risk Report: How Activist Wolf Packs Work. The Wall Street
Journal, Feb 19, 2015.
Murphy, K. J. 1985. Corporate performance and managerial remuneration: An empirical
analysis. Journal of Accounting and Economics 7 (1–3):11-42.
Olson, M. 1971. The logic of collective action: public goods and the theory of groups.
Cambridge, MA: Harvard University Press.
Palepu, K. G. 1986. Predicting takeover targets: A methodological and empirical analysis.
Journal of Accounting and Economics 8 (1):3-35.
Penner, C. 2005. When To Switch A 13G filing to a 13D filing, edited by S. R. Z. LLP.
43
Pulliam, S., J. Chung, D. Benoit, and R. Barry. 2014. Activist Investors Often Leak Their Plans
to a Favored Few: Strategically Placed Tips Help Build Alliances for Campaigns at Target
Companies. The Wall Street Journal, March 26, 2014.
Rajgopal, S., D. Taylor, and M. Venkatachalam. 2012. Frictions in the CEO Labor Market: The
Role of Talent Agents in CEO Compensation*. Contemporary Accounting Research 29
(1):119-151.
Russell, J. 2012. How Skilled are Hedge Funds? Evidence from Their Daily Trades. Working
Paper.
Sanjeev Bhojraj, and Partha Sengupta. 2003. Effect of Corporate Governance on Bond Ratings
and Yields: The Role of Institutional Investors and Outside Directors. The Journal of
Business 76 (3):455-475.
Securities Exchange Act of 1943.
Shivdasani, A. 1993. Board composition, ownership structure, and hostile takeovers. Journal of
Accounting and Economics 16 (1–3):167-198.
Siconolfi, M., and S. Pulliam. 2014. SEC Is Urged to Shorten Window for Investor Tip-Offs. The
Wall Street Journal, March 27, 2014.
Song, W.-L., and S. H. Szewczyk. 2003. Does Coordinated Institutional Investor Activism
Reverse the Fortunes of Underperforming Firms? The Journal of Financial and
Quantitative Analysis 38 (2):317-336.
Sunder, J., S. V. Sunder, and W. Wan. 2014. Debtholder Responses to Shareholder Activism:
Evidence from Hedge Fund Interventions. Review of Financial Studies 27 (11):3318-3342.
Tan, L., and W. Wan. 2015. Shareholder Activism and CEO Quality. Working Paper.
Zwiebel, J. 1995. Block Investment and Partial Benefits of Corporate Control. The Review of
Economic Studies 62 (2):161-185.
44
Appendix A: Typical Schedule 13D Trading Schedule
45
Appendix B: Summary of Brav et al. (2015)
In the coordination games developed by Brav, Dasgupta, and Mathews (2015), there are
two types of players: a large activist investor, synonymous with the 13D filers studied in my
tests, and small activist investors, who are under no obligation to disclose in my setting (if their
holdings remain below 5%) and therefore remain invisible. There exists a firm in which a certain
percentage of shares are owned by entrenched shareholders. The remaining percentage of shares
is owned by other passive investors who are willing to sell their shares at fair value and will
update their value as new information emerges. All investors receive a noisy signal about the
degree of entrenchment in the firm. The players face two decisions: 1) whether to acquire shares
in the target and, if they do, 2) whether to engage the target. The outcome depends on whether
the total shares owned by the engaging activist are sufficient to overcome the entrenchment.
The game can be divided into four periods. During the first, the small activists decide
whether to buy shares from the passive investors (without knowing the lead activist‘s plans). In
the second period, the lead activist will decide whether to acquire shares in the target, and his
action is publicly observable. This is synonymous with the activist filing a schedule 13D. In the
third period, the small activists who did not acquire shares in the first period can acquire shares
again, now knowing the large activist‘s position. Finally, in the fourth period, all the activists,
large and small, will decide simultaneously whether to engage the target. If they do, each will
face a private engagement cost. If the engagement succeeds, each activist will earn a private
benefit. Since the passive investors are rational, they will price their stock accordingly, and the
only gains for the activists will be the private benefit less their engagement and opportunity
costs. For the lead activist, these private benefits may include positive publicity, which may lead
to more fund inflows from other investors. For the small activists, these private benefits may take
46
the form of preferred treatment from the lead activist, who joins the target‘s board, as well as
other soft information and connections to other activist investors.
Imagine a scenario in which a large activist does not participate, and there exists a small
activist who is indifferent between acquiring a share and not doing so (his opportunity cost is
exactly the same as his expected benefit from acquiring a share.). By monotonicity, only activists
with opportunity costs below this threshold activist will acquire shares. However, imagine now
that the large activist does participate. The existence of a large activist would increase the
expected probability of successful engagement, and thus the threshold activist is no longer
indifferent between acquiring shares or not: he strictly prefers to acquire. In fact, some small
activists who strictly prefer not to participate, absent the large activist, will now strictly prefer to
participate. The implication is that the presence of a large activist—or even the anticipation of
that presence—spurs entry by the small activist, increasing the wolf-pack ownership level.
During the first period, the small activists and other passive investors are uncertain about
the large activist‘s plans. Although the small activists can only acquire shares once, if they do not
acquire shares during this period, they will still be able to do so at a later stage. Each small
activist faces an exogenously determined opportunity cost of acquiring a share in the firm. Under
this set of assumptions, it is clear that, if these small activists can somehow predict entrance by
the lead activists (better than other passive investors), they will prefer to acquire shares in this
period, rather than later, when the large activist‘s participation is publicly disclosed (since there
is a trading profit to be gained).
There are two situations in which the small activists will trade ahead of a large activist‘s
entrance. The first is when the lead activists leak information about their plans to the small
activists (intentional coordination). The second, given the same piece of news, is when the small
47
activists can better predict future entrance (spontaneous formation) by lead activist than other
passive investors (who will sell shares to the small activists).
48
Appendix C: Examples from SharkRepellent database
Total Board Payout Restructuring Takeover
1922 716 462 482 443
37% 24% 25% 23%
Classifications Comments
Successful Example 1: Campaign to maximize shareholder value included letter to
management proposing that company engage in a share repurchase program.
Shortly after campaign initiation, board announced cost reduction measures and a
500,000 share repurchase program.
Example 2: Dissident campaign included notice that it may speak to management
regarding Board representation and business plans. Dissident group later suggested
1 dissident representative to replace Board member who resigned, and this
representative was elected.
Example 3: Dissident conducted discussions with Co. regarding operational &
structural changes, including a spin-off. Co. announced plans to spin-off its
Financial Services business and later expanded its Board to appoint 5 Dissident
recommended individuals.
Partly
successful
Example 1: Dissident won 3 of 4 seats up for election to 13 person Board, ISP
never launched tender offer after company refused to exempt the tender offer from
company's "poison pill" and Delaware freeze out provision.
Example 2: Annual meeting proxy fight to replace 4 of 10 directors settled for 3
seats on 11-seat board. Previously, Starboard had started a written consent
solicitation, and Co. adopted pill with 15% trigger after Starboard accumulated
14.8% stake.
Example 3: Roumell has nominated 2 candidates to 6-seat board for 2014 annual
meeting. Co. agreed to add 1 nominee (Previously, Roumell urged Co. to
repurchase shares. After 3rd party made unsolicited offer, Roumell urged for sale
process.).
Settled Example 1: Proxy fight to elect 2 dissident nominees settled. As part of settlement
agreement, the company agreed to repurchase 111,000 common shares from the
dissident for $20.25 per share (a premium of 11.75% over the preceding 30 day
average market price).
Example 2: Proxy fight settled. As part of settlement agreement, Board size
increased from 10 to 13, and 3 dissidents elected to Board.
Example 3: Longview, 9% holder, urged PETM to review strategic alternatives
and explore sale of the Co. Co. reviewed strategic alternatives and then agreed to
be acquired by a private group led by BC Partners.
Example 4: Maguire, 5.3% holder, requested one board seat and urged Co. to
replace CEO, implement cost restructuring plan, and review strategic alternatives,
including a sale. Parties entered into settlement agreement providing for mutually
49
agreeable director.
Withdrawn Example 1: Proxy fight for three seats on eight-seat board was voluntarily
withdrawn after Progress announced plan to divest assets and buy back shares, as
Starboard had requested.
Example 2: Proxy fight for 2 seats on the 7 person board at the 2009 annual
meeting was withdrawn; dissident decided not to nominate its candidates at the
annual meeting.
Example 3: Dissident campaign urged company to seek a sale of its subsidiary
banks otherwise threatened to seek board representation. Dissident withdrew
campaign after the company announced it agreed to be acquired by First Financial
Corporation.
Fail Example 1: Lenox's one director nominee was defeated at the 2010 annual
meeting. Although its proposal requesting board declassification received more
votes cast for its approval than against it, the proposal was defeated after counting
abstentions as votes against.
Example 2: Campaign urged Board to enhance shareholder value and specifically
liquidate company's investment in Ready Mix, Inc. Despite dissident's opposition,
management nominees were elected at annual meeting and the shareholder
proposal defeated.
Example 3: Dissident 2-person slate not elected, as no nominee received required
majority of votes present at meeting; incumbent directors thus continued to serve.


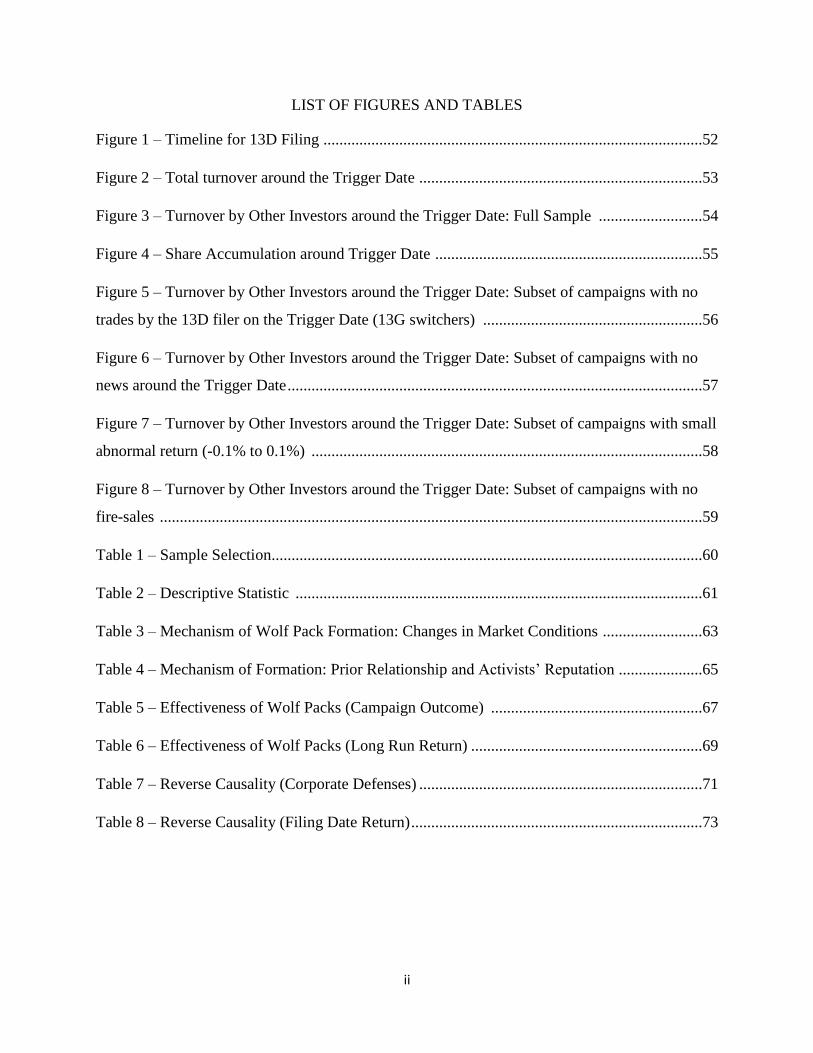


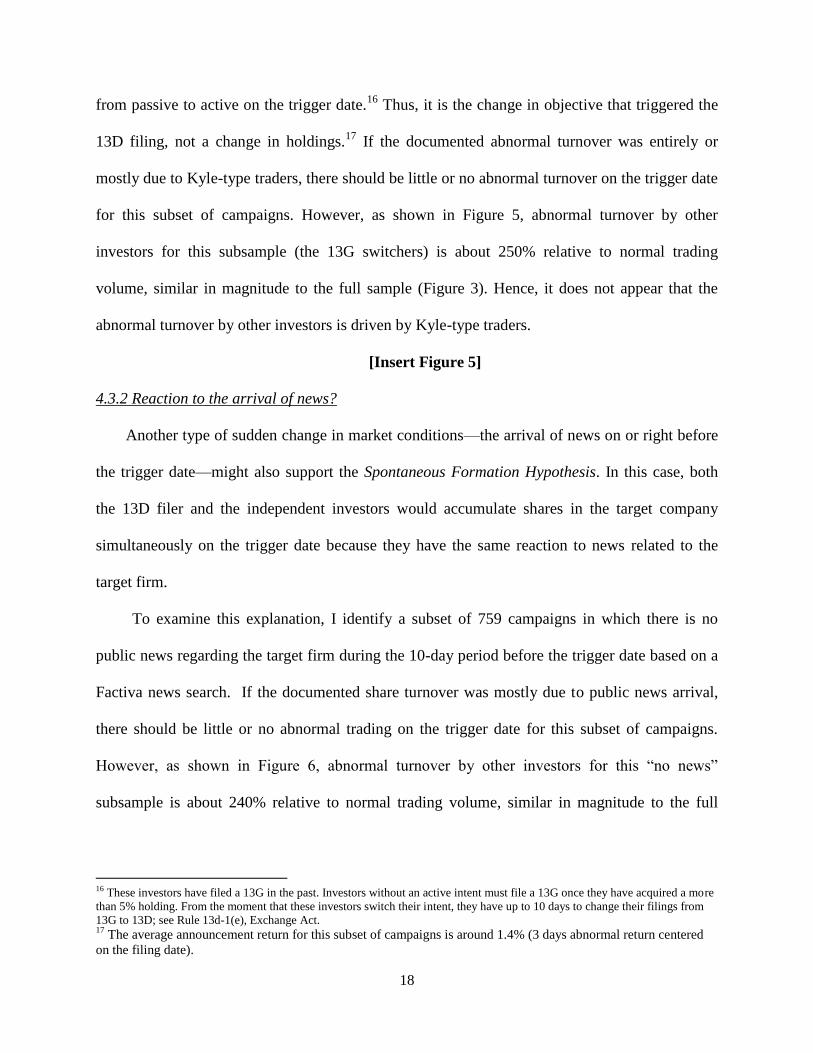
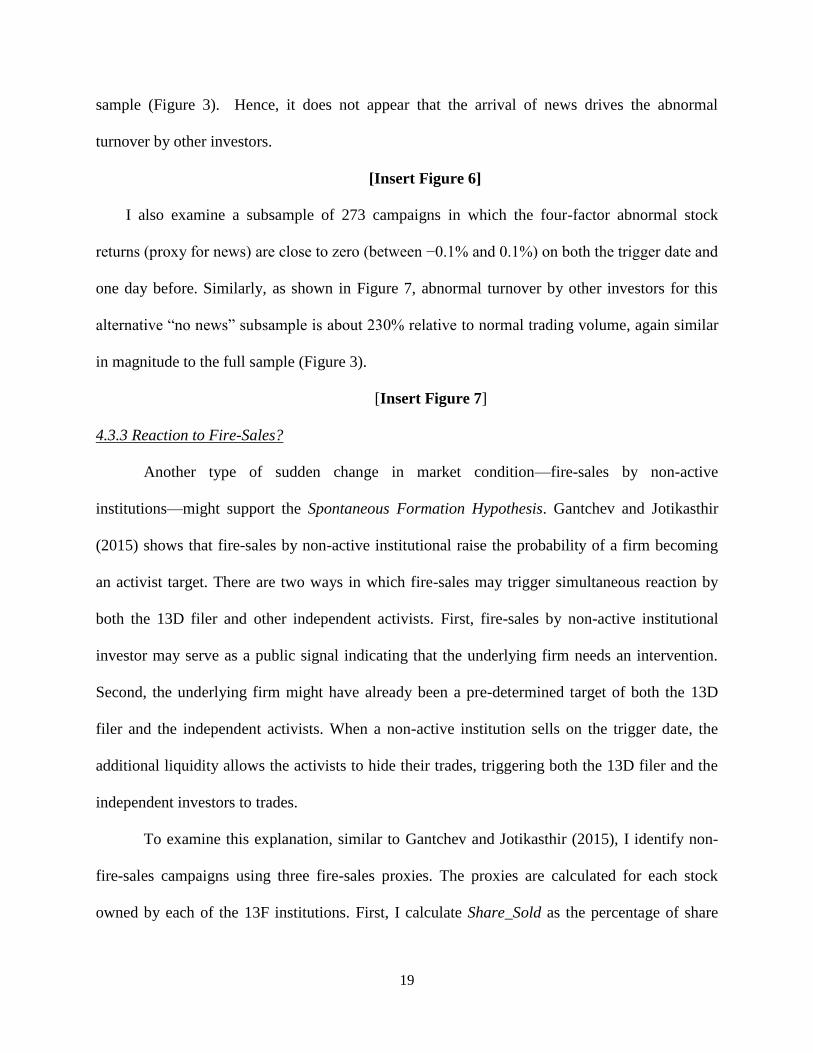
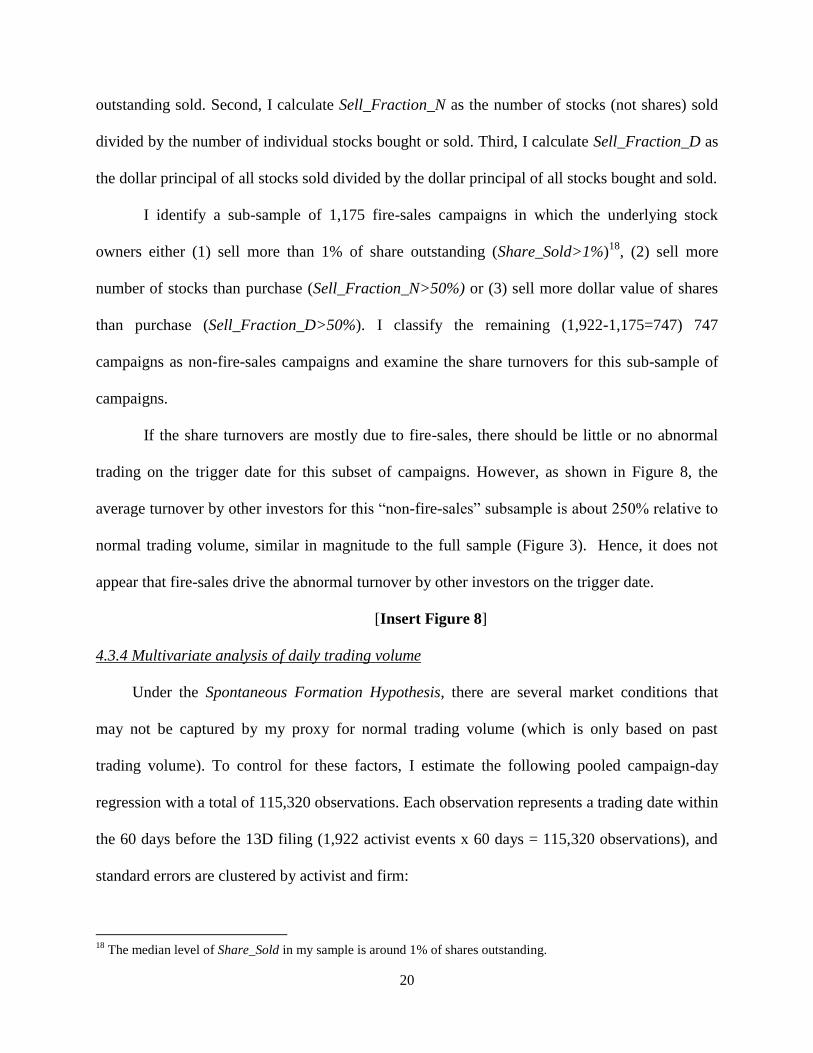


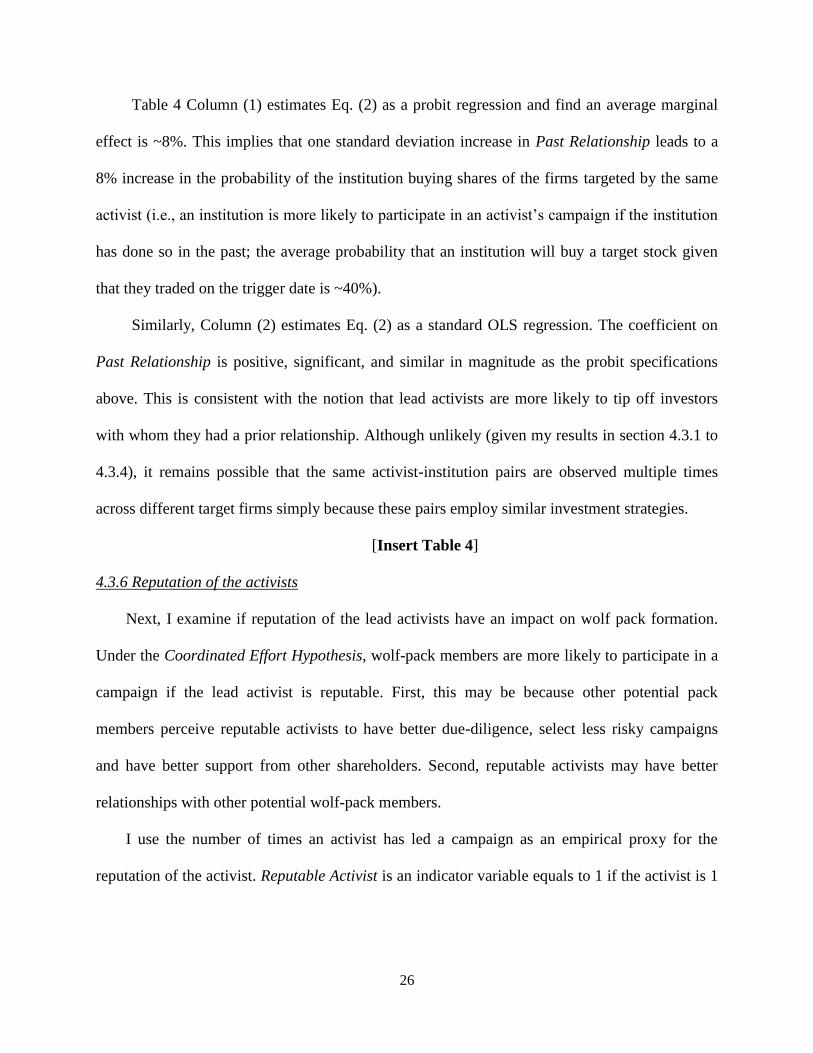
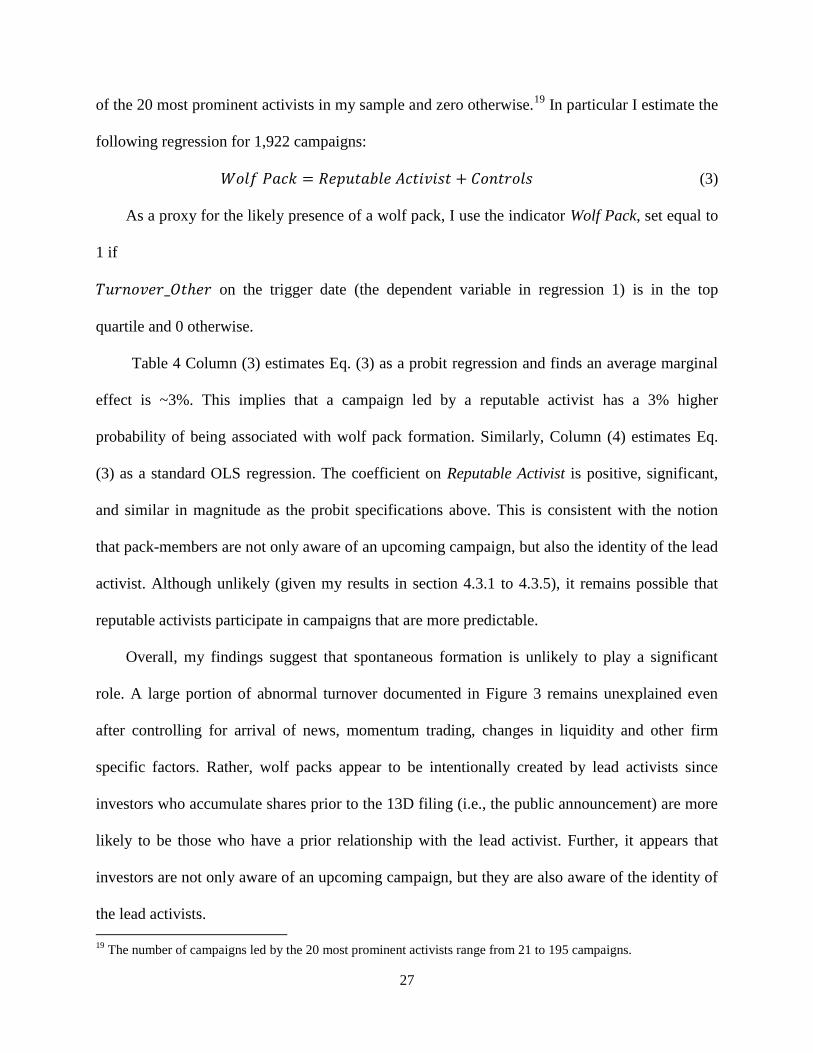


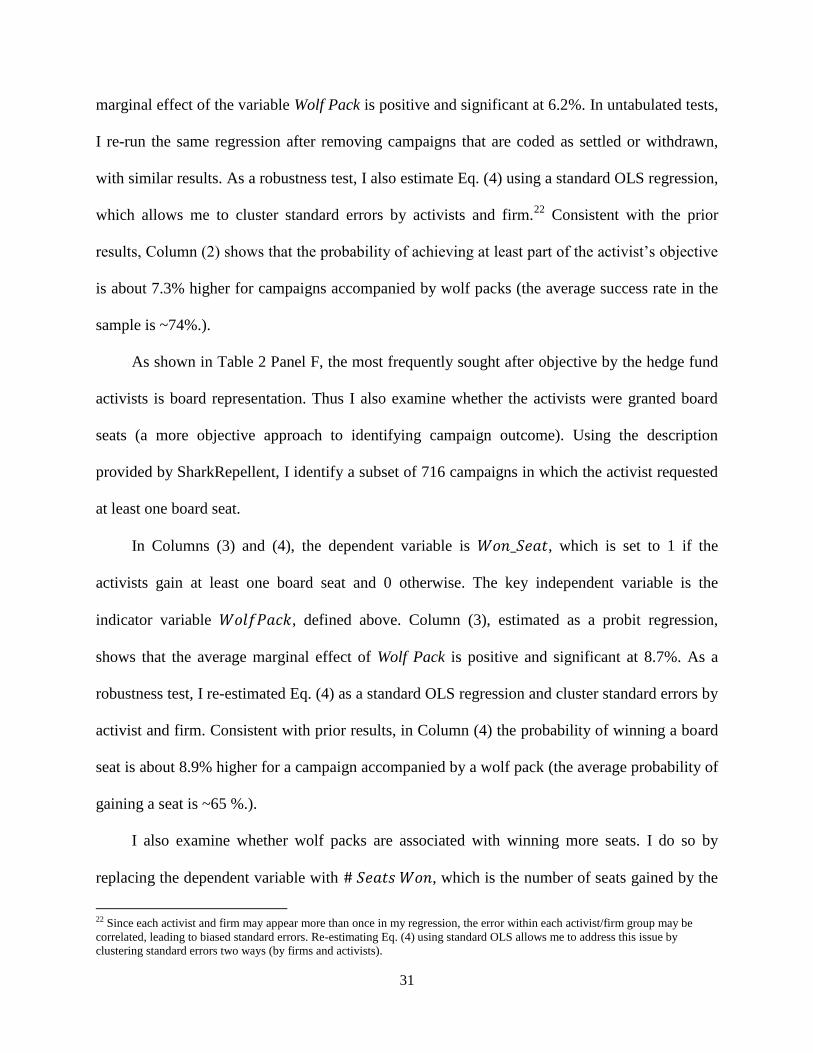
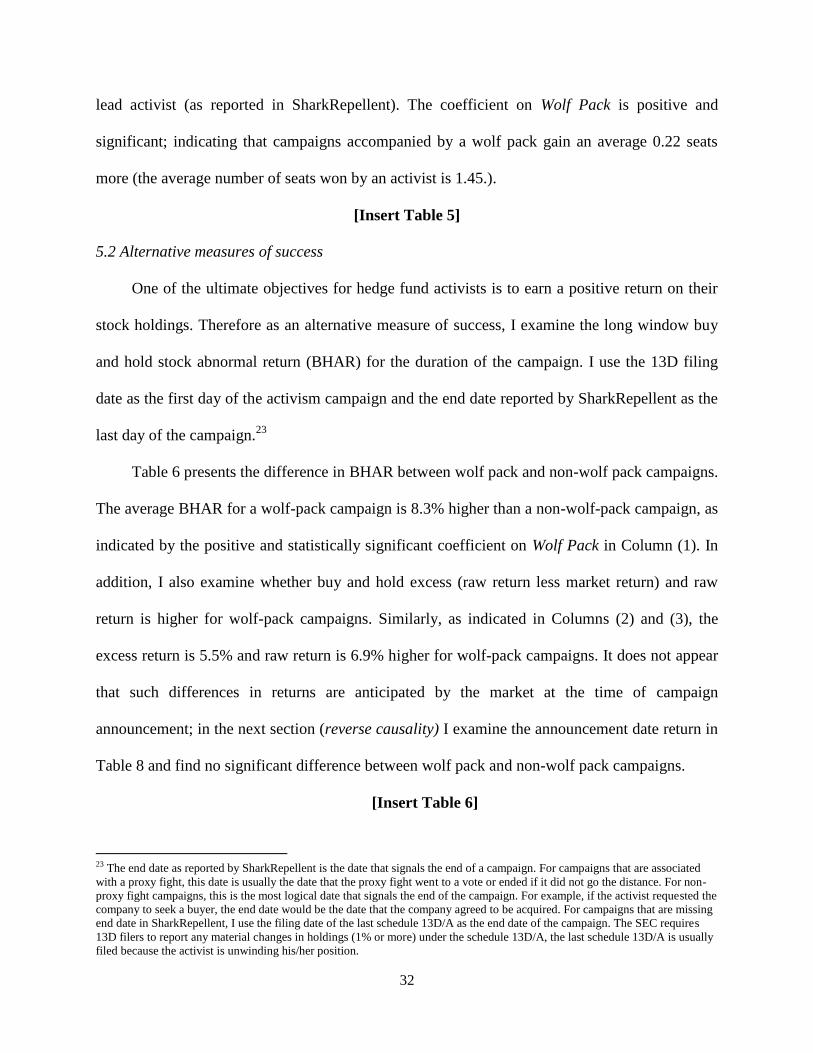


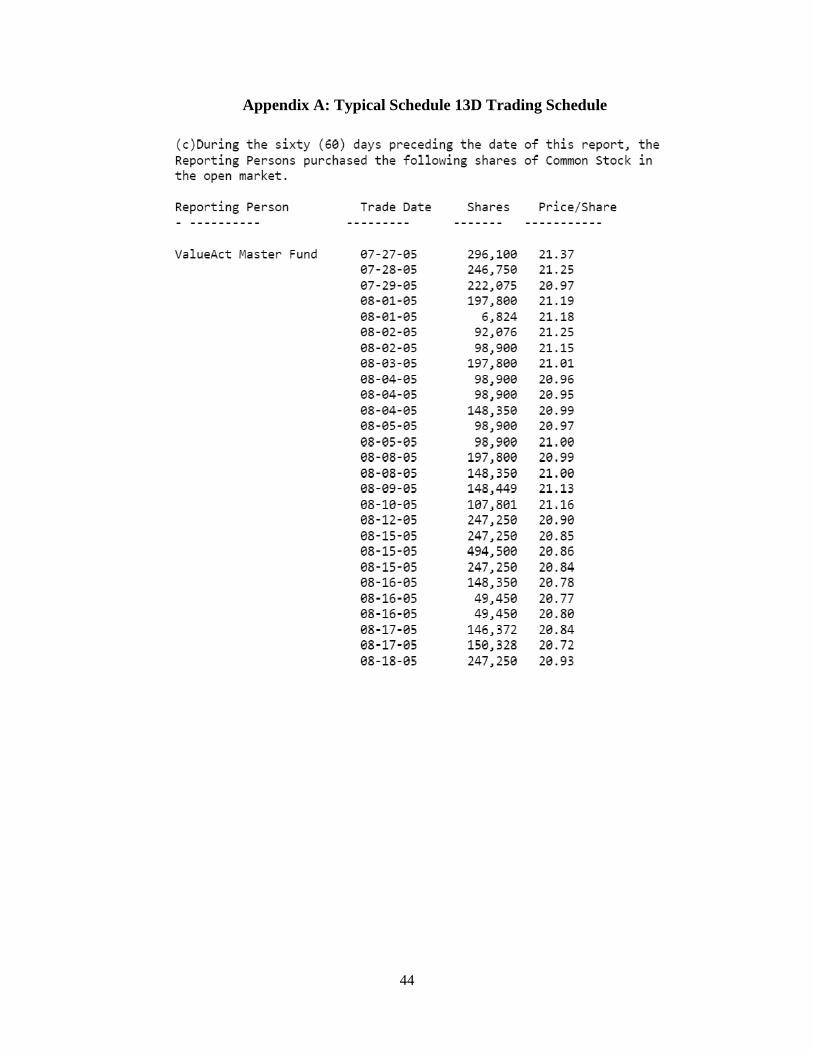


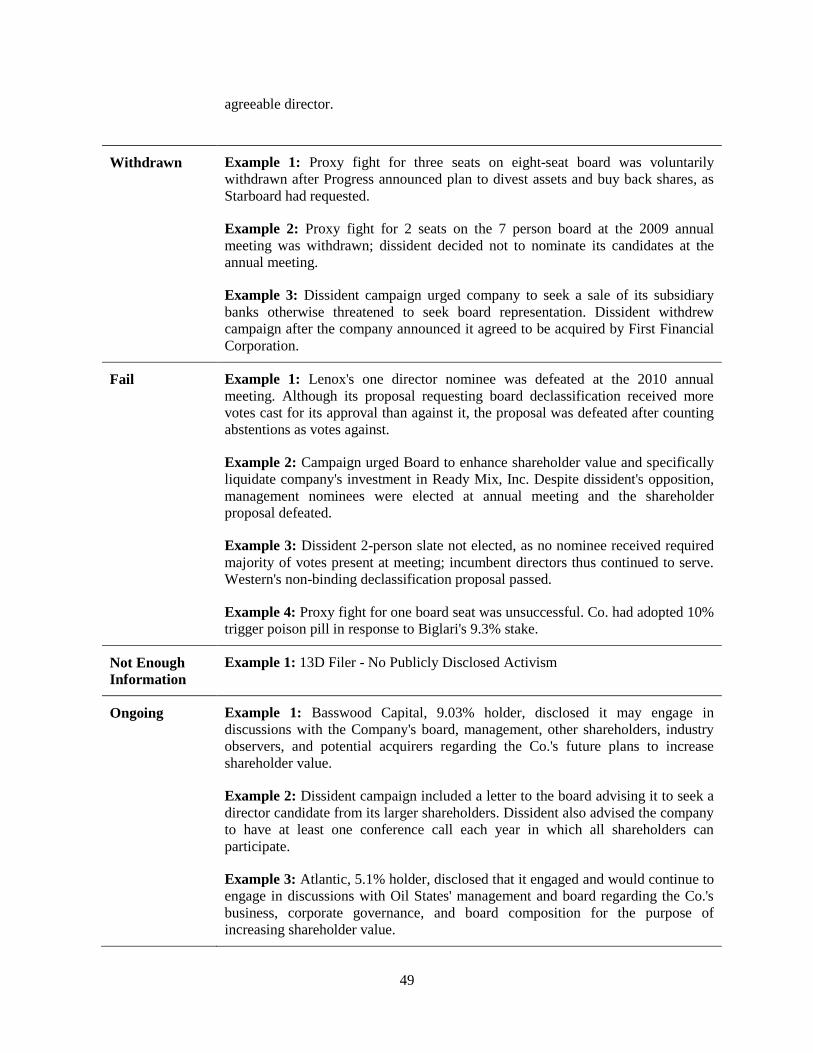
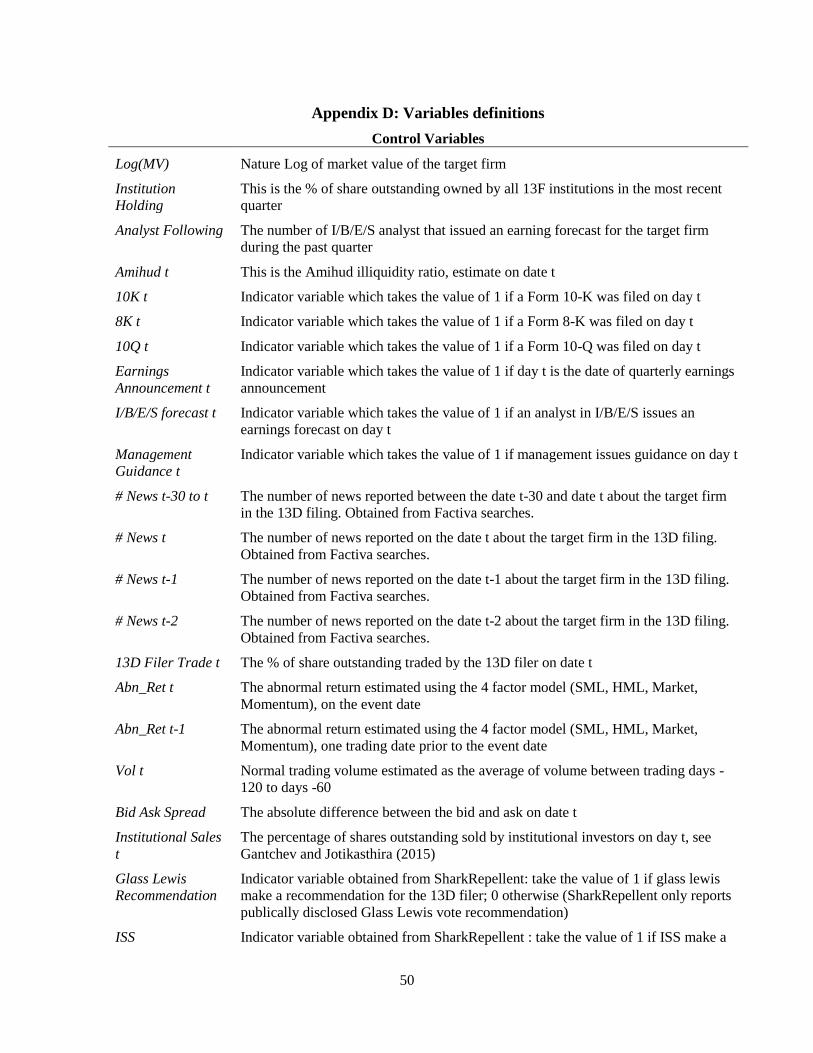


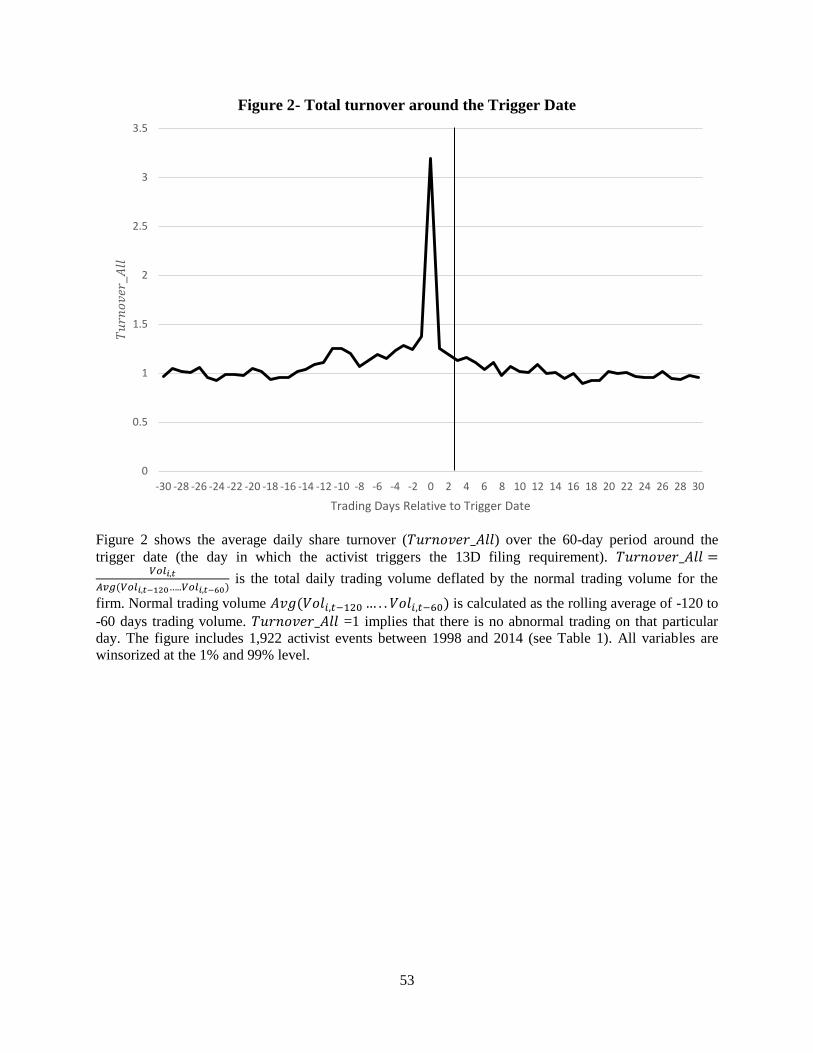
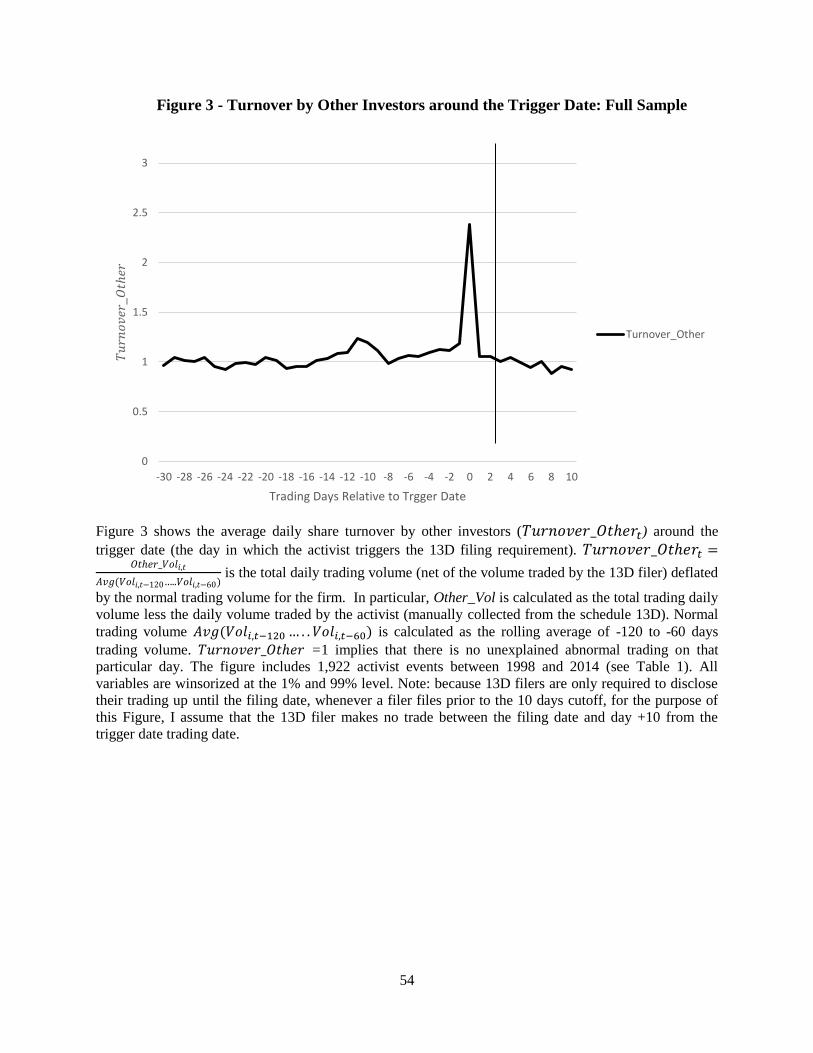


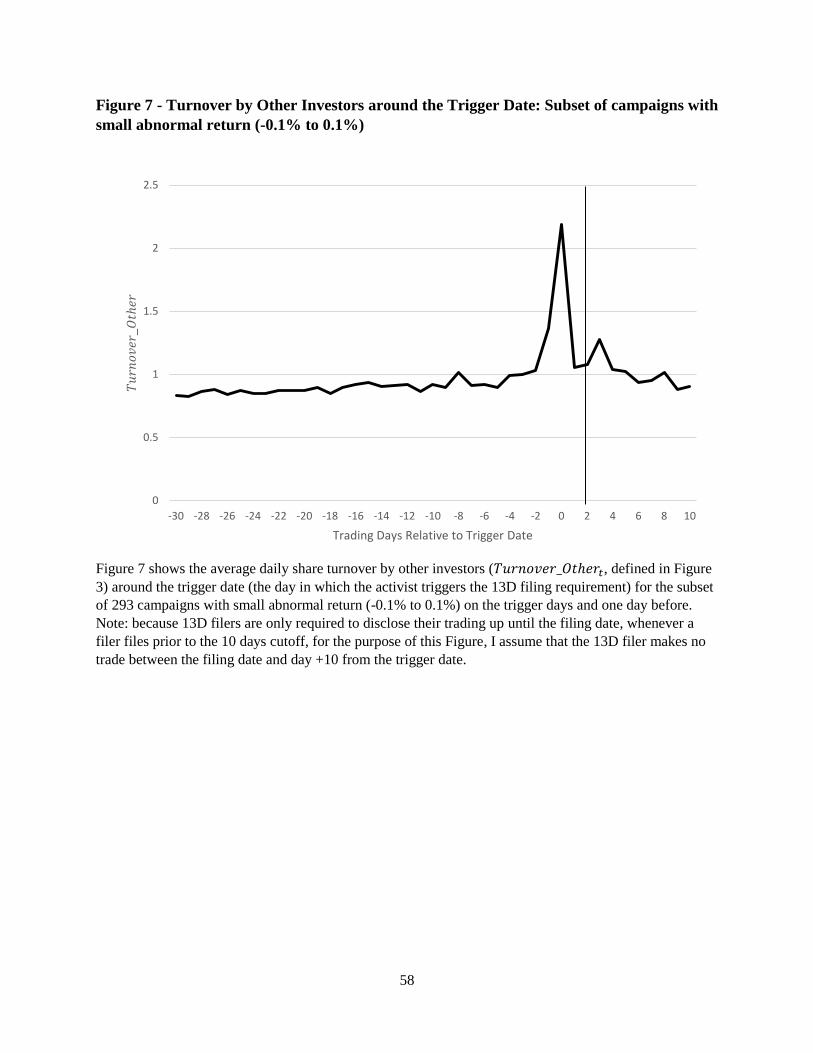
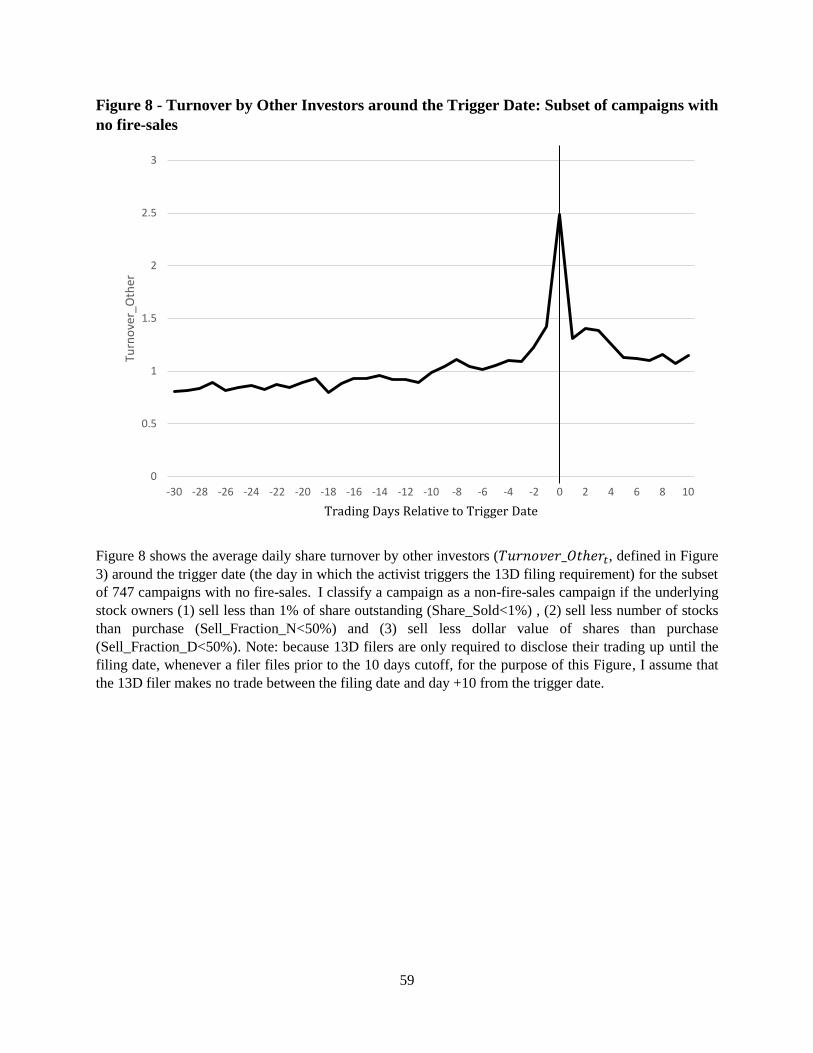
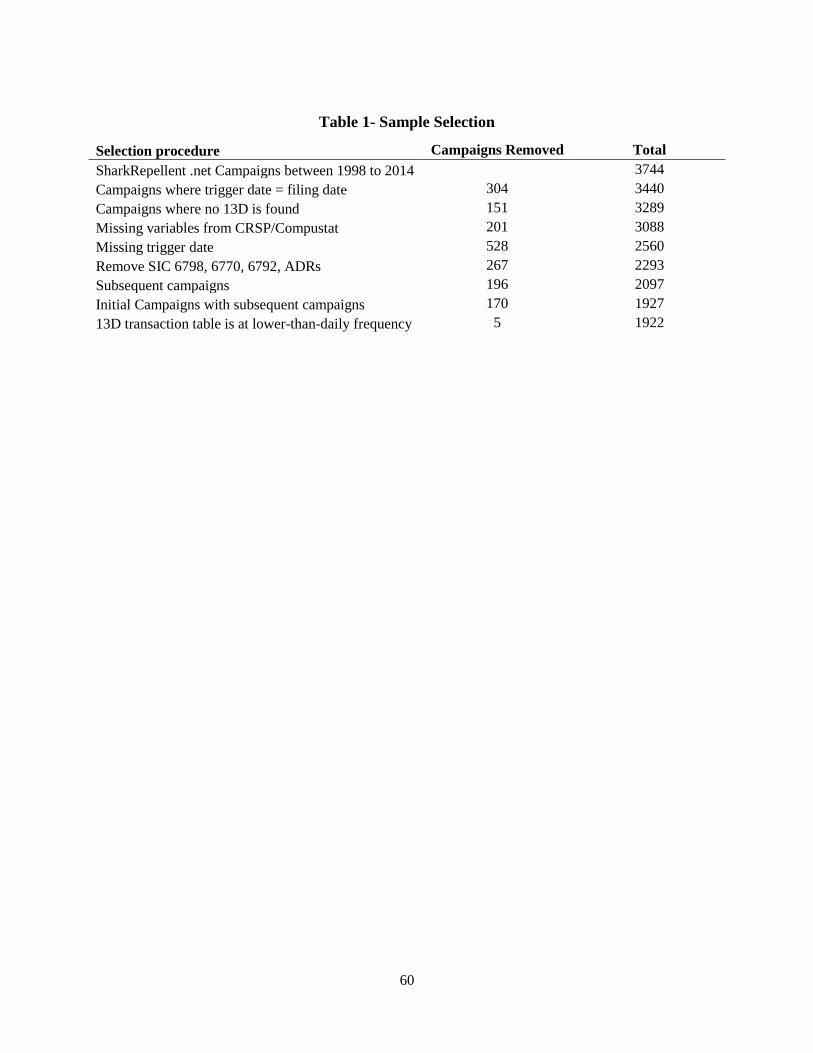
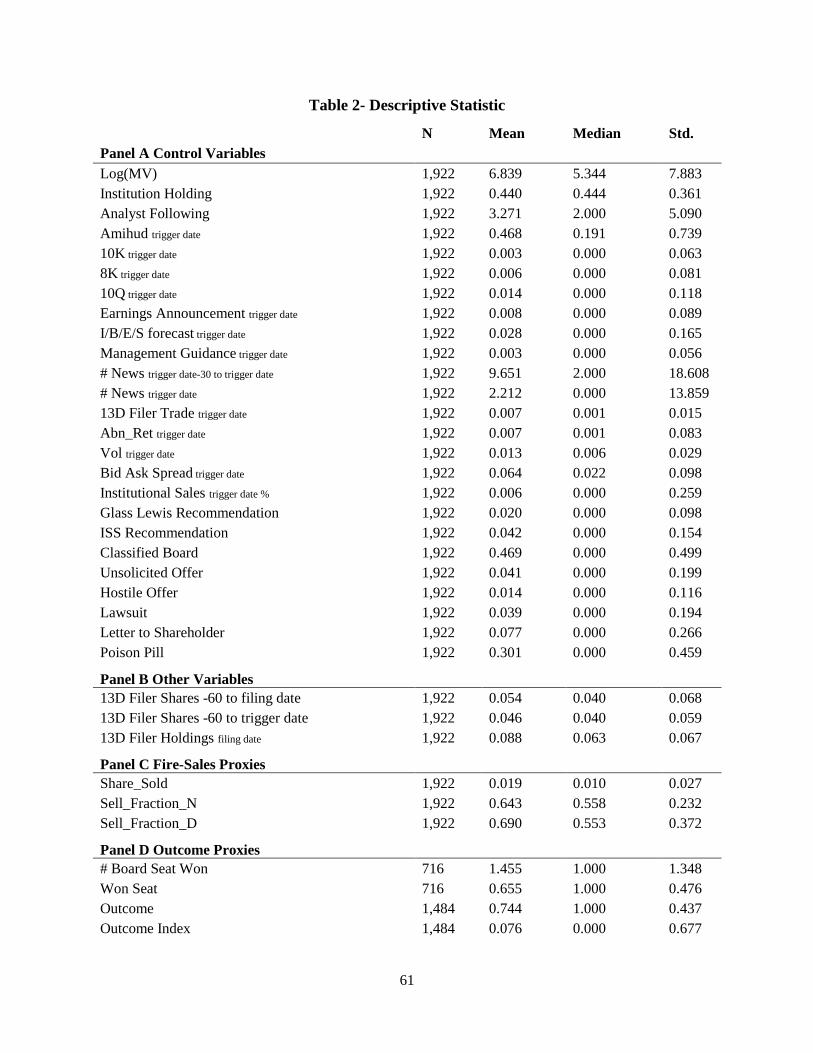

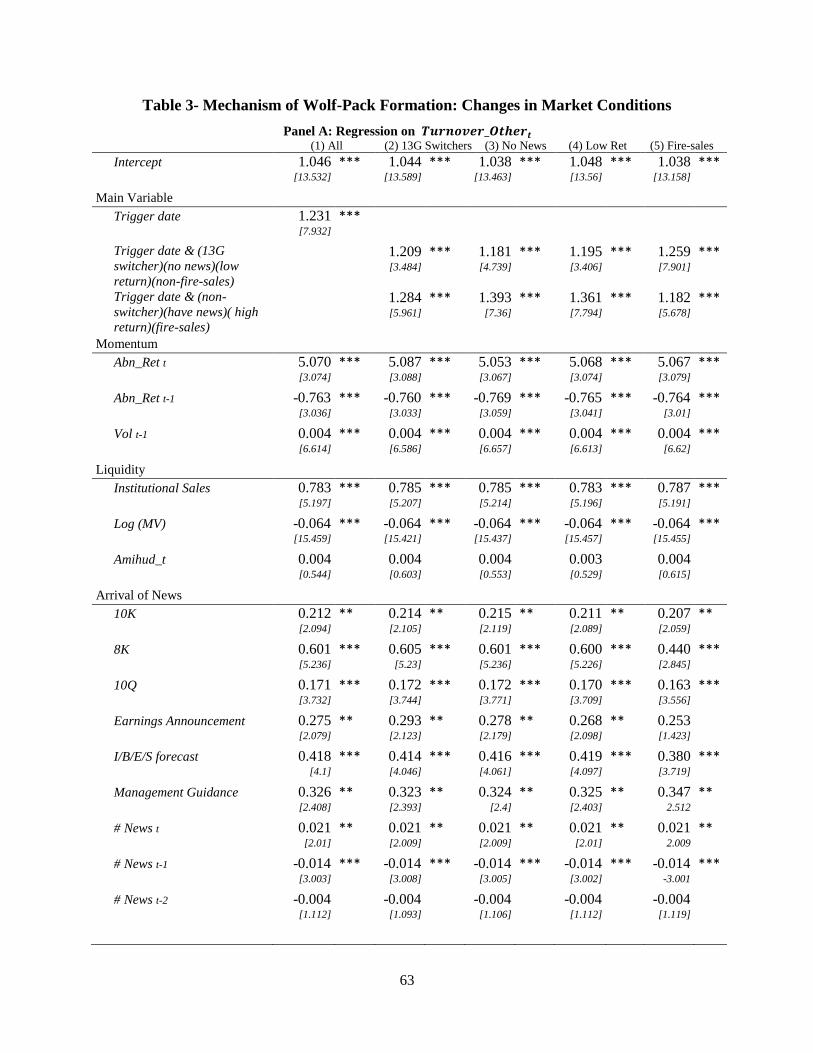


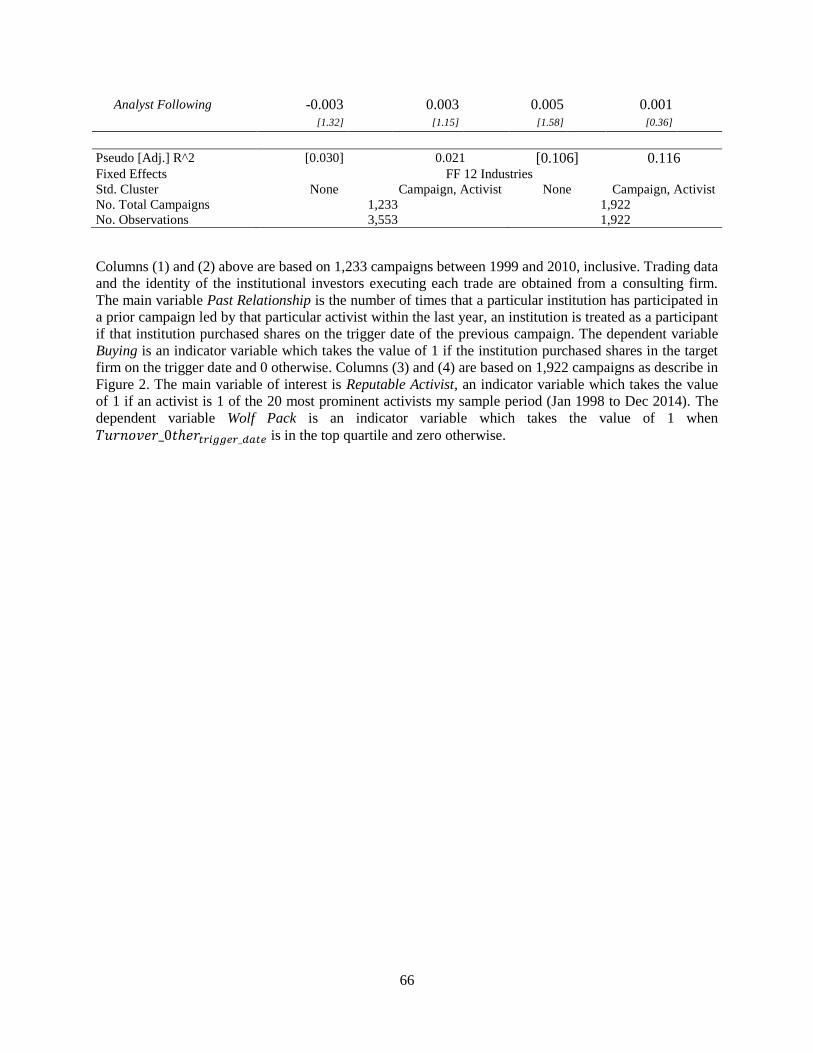
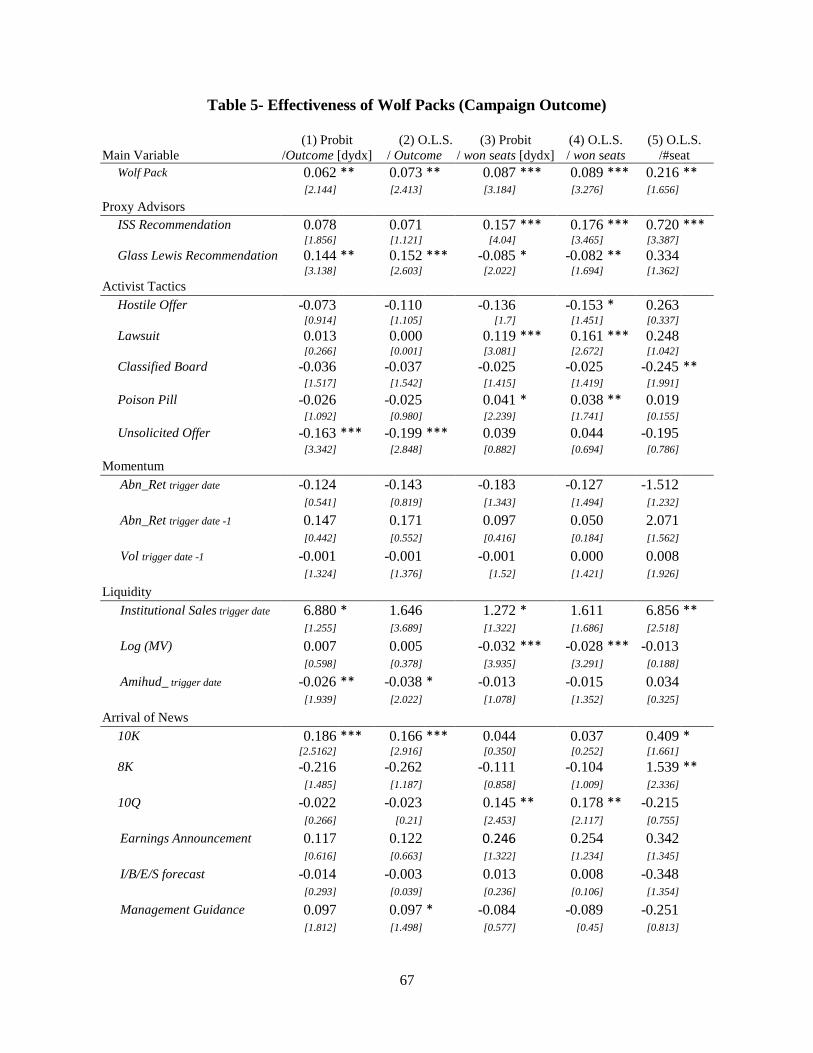

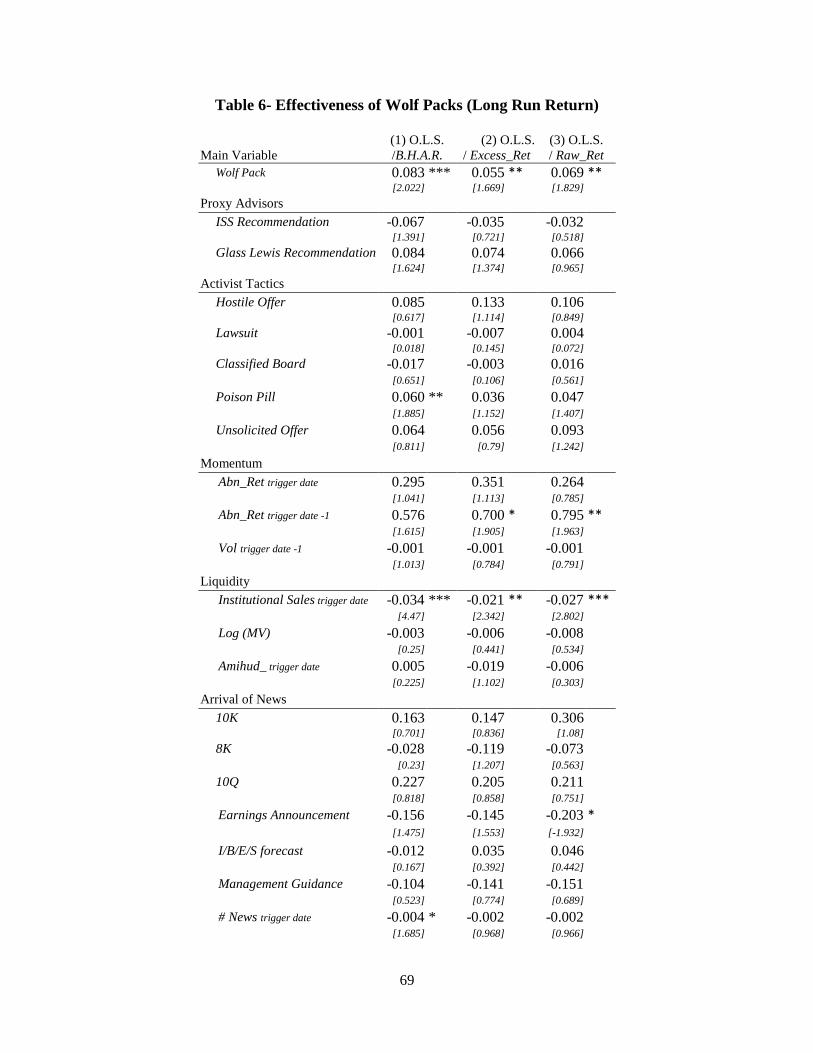
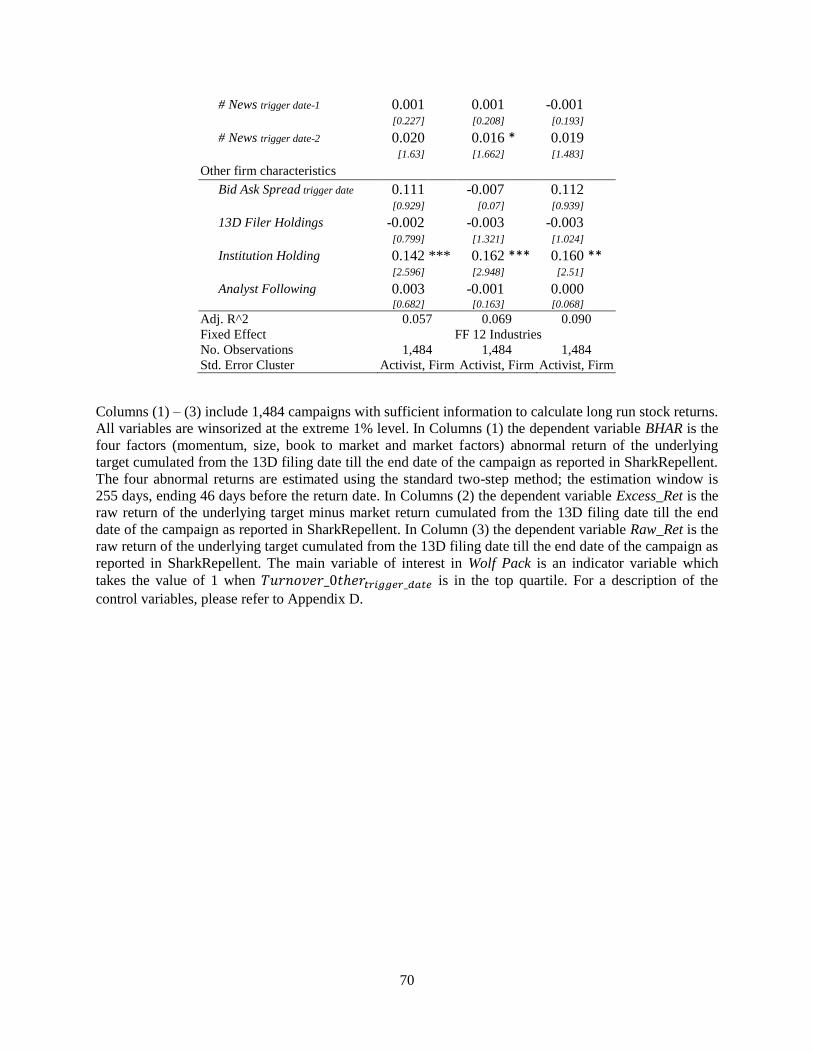


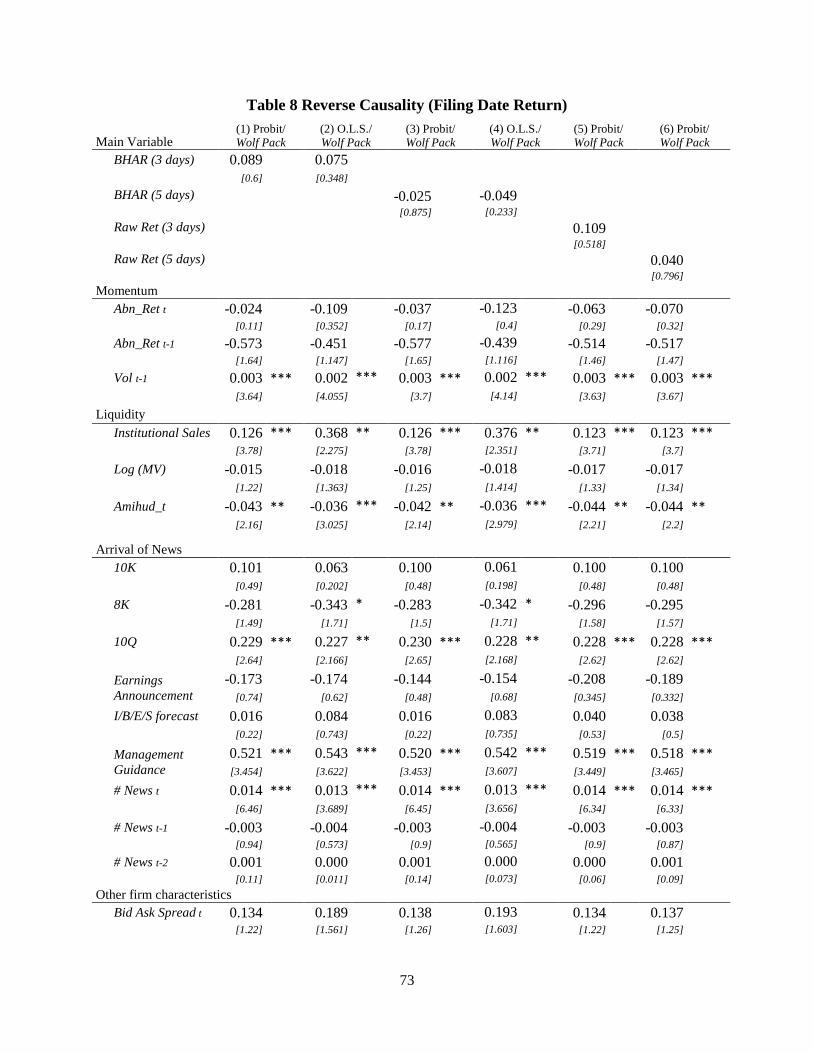


![THE TENSION BETWEEN HEDGE FUND ACTIVISM AND CORPORATE … · 2018. 4. 12. · 2016] HEDGE FUND ACTIVISM AND CORPORATE LAW developing their own statutory and case law.6 Therefore,](https://static.documents.pub/doc/80x56/6047ae787673463ca9070291/the-tension-between-hedge-fund-activism-and-corporate-2018-4-12-2016-hedge.jpg)


