76
A Women’s Sports Foundation Research Report September 2009 Women in the 2000, 2004 and 2008 Olympic and Paralympic Games An Analysis of Participation, Leadership and Media Opportunities
A Women’s Sports Foundation Research Report
September 2009
Women in the 2000, 2004 and 2008 Olympic and Paralympic Games
An Analysis of Participation, Leadership and Media Opportunities
Authorship and AcknowledgmentsTThis report was authored by Maureen Smith, Ph.D.,
California State University, Sacramento, and Alison M.
Wrynn, Ph.D., California State University, Long Beach. The
report was reviewed by Donna A. Lopiano, Ph.D.; Don Sabo,
Ph.D.; Marjorie A. Snyder, Ph.D.; Linda Mastandrea; Terri
Lakowski; Carly Adams, Ph.D., University of Lethbridge;
Ellen Carlton, Ph.D., Sonoma State University; Kerrie Kauer,
Ph.D., California State University, Long Beach; Cheryl
Cooky, Ph.D., California State University, Fullerton; Matthew
Llewellyn, Pennsylvania State University; and Jennifer Piatt,
Ph.D., California State University, Sacramento.
The initial data collection was assisted by graduate
students at California State University, Sacramento:
Brandon Babcock, Kristi Jouett, Fred Kelley, Louis Lopez,
Lindsey McEuen, Rusty Price, K.V. Vigil and Kelli White as
well as graduate students from California State University,
Long Beach.
All data that was obtained from the Internet was accurate
as of April 2009. Every attempt was made to obtain the
most accurate and up-to-date data for this report.
Special thanks to Deana Monahan for her editorial and
graphic design expertise.
Published September 2009, by the Women’s Sports Foundation®
Eisenhower Park, 1899 Hempstead Turnpike, Suite 400 East Meadow, NY 11554 [email protected] www.WomensSportsFoundation.org © 2009, Women’s Sports Foundation, All Rights Reserved
This report may be downloaded from www.WomensSportsFoundation.org. This report may be reproduced and distributed only in its entirety. Any material taken from this report and published or transmitted in any form, electronic or mechanical, must be properly attributed to Women in the 2000, 2004 and 2008 Olympic and Paralympic Games: An Analysis of Participation, Leadership and Media Opportunities, published by the Women’s Sports Foundation.
Preferred citation: Smith, M. and Wrynn, A. (2009). Women in the 2000, 2004 and 2008 Olympic and Paralympic Games: An Analysis of Participation, Leadership and Media Opportunities. East Meadow, NY: Women’s Sports Foundation.
September 2009
Women in the 2000, 2004 and 2008 Olympic and Paralympic Games
An Analysis of Participation, Leadership and Media Opportunities

Women in the 2000, 2004 and 2008 Olympic and Paralympic Games An Analysis of Participation, Leadership and Media Opportunities
Executive Summary 2International 4
United States 4
Major Findings 5Major International Findings 5
Major United States Findings 6
Introduction 7Historical Background of Women’s Participation 7
IOC World Conferences on Women and Sport 7
International Findings 9Comparison of Olympic and Paralympic Games Female and Male Sports and Medal Events 9
Comparison of 2000, 2004 and 2008 Olympic and Paralympic Games Female and Male Athlete Participation 12
The 2000, 2004 and 2008 Paralympic Games 23
Women in International Sport Governance Structure Leadership Positions 27
United States Findings 30United States Olympic Committee and U.S. National Sport Governing Body Obligations 30
Comparison of 2000, 2004 and 2008 Olympic and Paralympic United States Female and Male Athlete Participation 31
Women in United States Sport Governance Structure Leadership Positions 39
Media Analysis 2008 Olympic Games 41Introduction 41
Method 41
Results 41
Discussion 42
Paralympic Media Coverage 43
Policy Recommendations 45International Olympic and Paralympic 45
United States Olympic and Paralympic 45
Appendix A 47Report Card Data Analysis 47
Appendix B. 2008 Olympic Games Program (with dates of initial appearance on program) 49Appendix C. 2008 Paralympic Program (with dates of initial appearance on program and overview of classifications for each sport and event) 55References 65
Web sites 69
A Women’s Sports Foundation Research Report2 A Women’s Sports Foundation Research Report2
Executive SummaryAt first glance, the summer Olympic Games appear
to be a setting where female athletes have nearly
reached parity with men. In the 2004 Games in
Athens and 2008 Games in Beijing, women competed
in nearly 45% of all events. However, as one looks
deeper into the number of participants, events and
leadership opportunities provided to women, it is
evident that women have only recently been given
increased opportunities in events and as participants
in summer Olympic sporting events. There is
much work still to be done on both participation
and leadership fronts. The percentage of female
participants did not breach 20% until the 1976 Games.
In 2008, although women competed in an equal
number of sports, they participated in 137 events,
compared to 175 events for men. As a result, while
more than 10,000 athletes participated in the 2008
Games, and women’s participation increased over
previous Games, female athletes were still receiving
more than 1,000 fewer participation opportunities
than their male counterparts.
Even more troubling is the fact that women have
far more limited participation opportunities than
men have in the Paralympic Games. Only 37.1%
of the 2004 Paralympians were female. At the
2008 Games in Beijing, the participation of female
athletes had dropped to 34.5%. And women have
few opportunities to serve in leadership capacities
within national and international sports structures.
The International Olympic Committee (IOC) has
established a 20% threshold goal for the inclusion
of women in National Olympic Committees (NOCs),
National Governing Bodies (NGBs) and International
Federations (IFs). Currently only 16 of the 107
members of the IOC are women (14.9%). Only one
member of the 15-member IOC Executive Committee
is female.
Certain countries have not incorporated more females
on their Olympic teams. The Olympic Solidarity
Program is available to assist with funding for nations
facing financial difficulties, but some countries claim
cultural and religious sanctions preclude the inclusion
of women on their Olympic teams. However, some
countries with religious constraints are able to send
women to the Games. For example, Egypt sent 16
women to the 2004 Games; more than 16% of its total
team members. While Egypt has been cited as being
different from other Islamic countries in its secular
interpretation of Islam (Walseth & Fasting, 2003),
other predominantly Muslim nations have also made
noticeable improvements, most notably Senegal,
with female athletes accounting for 60% of its 2004
delegation. Despite some of these increases, the
lowest number of Muslim women competed in the
2004 Olympic Games (Taheri, 2004; also see “Islamic
women making history,” 2004; Moore, 2004. For an
update on female Olympic hopefuls in Iran, see “Iran:
Female athletes fear constraint,” 2008). And women
could also be included in sport leadership positions
where there should be fewer cultural and religious
restrictions against women’s participation.
The IOC has, over the past decade, made noteworthy
attempts to support the inclusion of greater numbers
of women in the international sporting scene. It has
created the Women and Sport Commission and held
its 4th IOC World Conference on Women and Sport in
2008. However, the rhetoric has only gained minimal
response from the National Olympic Committees,
the International Federations and the International
Paralympic Committee—most of which still struggle
to meet the IOC’s request that women be represented
at a minimal 20% standard in leadership positions.
With so few women serving in leadership positions,
it is difficult to maintain organizational focus on the
need to support women as athletes and leaders,
from the grassroots, developmental levels all the way
to the upper echelons of competitive Olympic and
Paralympic sport.
In the United States, a similar situation exists. The
good news is that women made up nearly 48% of the
athletes who participated on the 2004 U.S. Olympic
team and slightly exceeded that percentage in Beijing.
Women, however, are underrepresented in leadership
positions on the NGBs; currently eight of these 58
3Women in the 2000, 2004 and 2008 Olympic and Paralympic Games: An Analysis of Participation, Leadership and Media Opportunities 3
are women (13.8%). Only one NGB has an all-female
leadership team (U.S. Field Hockey Association), while
20 of them have all-male leadership teams (64.5%).
The USOC exceeds the IOC recommended 20%
threshold, but less than one-third of the USOC Board
of Directors is female (27.2%). The “Executive Team”
consists of 12 members, four of whom are women
(33.3%), including acting CEO Stephanie Streeter. The
“Management Team” is made up of 41 individuals, 20
women (48.8%) and 21 men (51.2%). The opportunity
to be an Olympian or Paralympian brings with it
numerous rewards. It gives the athlete the chance to
secure prize money and lucrative endorsement deals.
More importantly, perhaps, is the fact that it gives
unprecedented visibility to outstanding, elite female
athletes. The millions of young girls and women who
watch the summer Games every four years see stellar
role models who inspire sports participation. There are
also abundant returns that come to women who serve
in a leadership capacity in sport. And, although these
women work behind the scenes, they are an integral
part of the team, actively advocating for women as
athletes. Thus this report will examine the recent past
and current status of women in the summer Olympic
and Paralympic Games as athletic participants and the
place of women in the International and U.S. Olympic
and Paralympic sport hierarchy.
The 2008 Olympic and Paralympic Games, held in
Beijing, were overshadowed by an increased focus
on human rights issues in China. We view the issue
of equitable participation for women as athletes
and sports leaders as a basic issue of human rights.
The United Nations report entitled “Women, gender
equality and sport,” produced in collaboration
with WomenSports International, underscores this
need. Sport is a valuable source of empowerment
for girls and women, and by limiting their access
to highly competitive sporting opportunities—
and leadership roles—like those provided by
international sporting competitions such as the
Olympic Games, we are restricting their basic human
rights. (The report is available at www.sportsbiz.bz/
womensportinternational/initiatives/documents/
Women_2000_Report.pdf)
This report analyzes the representation and
participation of women in the international and U.S.
Olympic organizations. In addition it examines the
types and extent of opportunities that are provided
for women in administrative and leadership roles
within these structures and the chances women have
to compete in the Games themselves. This report also
assesses the extent that the IOC, IPC and USOC are
fulfilling their stated missions with respect to fairness
and gender equity and whether or not legal statutes
are being upheld.
Women were first included in the 1900 Olympic
Games in Paris. In those Games there were 19
female participants, or 1.9% of the total number of
competitors. Over the years, the number of women
has crept up to 40.7% (4,306 women) in the 2004
Games (Women in the Olympic Movement, 2007).
The percentage of events that are held for women
(or are mixed gender events) rose to 44.9% in the
2004 Games. Forty-four females competed in the
inaugural 1960 Paralympic Games in archery, athletics,
swimming, table tennis and wheelchair fencing.
While progress has been made the Olympic Games
are an enormous undertaking where progress and
inequalities co-exist. In 2008, the IOC projected
45% for women, but it appears that this increase in
percentage was the result of a modest participation
increase for women and a decrease in the
participation of male athletes. The participation gap
between female and male athletes has closed over
the last two Olympiads primarily by cutting the men’s
field. This is also true of the gap between female and
male Paralympians. Several adjustments were made
in the 2008 Paralympic program, which offers fewer
classifications for male athletes, while increasing the
number of classifications for female athletes.
A Women’s Sports Foundation Research Report4 A Women’s Sports Foundation Research Report4
This report includes an analysis of:
International• Participation rates of female and male athletes at
the summer Olympic Games and Paralympic Games
from 1896 through 2008 with a focus on the 2000,
2004 and 2008 Games.
• The types and extent of women’s leadership
opportunities for leadership roles in the
organizational structures of the International
Olympic Committee, National Olympic Committees,
the International Paralympic Committee and
International Sports Federations.
United States• Participation rates of female and male athletes
in the 2000, 2004 and 2008 Olympic and
Paralympic Games.
• The types and extent of women’s leadership
opportunities within leadership roles in the
organizational structures of the United States
Olympic Committee and the U.S. National Sport
Governing Bodies for summer sports.
In order to provide a more systematic analysis of
the data on participation opportunities for women
in International and U.S. Olympic and Paralympic
settings, a “Report Card” system was created. Grades
are included in the text and a complete explanation of
the grading system can be found in Appendix A.
5Women in the 2000, 2004 and 2008 Olympic and Paralympic Games: An Analysis of Participation, Leadership and Media Opportunities
Major FindingsMajor International Findings• The International Olympic Committee still has not reached its own recommended
20% minimal threshold for the inclusion of women in administrative structures
(2008 representation=15%).
• The inclusion of women on a number of IOC Commissions is close to zero.
Thirteen of the 31 commissions have one or no female members (41.9%), with
four commissions having no female representation (13%).
• The Governing Board of the International Paralympic Committee is still below
the 20% threshold (2009 representation=6.7%). However, 38 of the 109 members
of the Committees and Councils of the IPC are female (34.8%). This exceeds the
20% mark—although is still below 50%.
• Twenty of the 28 IFs (71.4%) are below the 20% threshold. Currently there
are only two female presidents of IFs out of 28 International Olympic
Sports Federations.
• There were 201 National Olympic Committees in 2004, of which seven have
consistently not included female athletes in their delegations: British Virgin
Islands, Brunei Darussalam, Oman, Qatar, Saudi Arabia, United Arab Emirates and
Yemen; while there were 13 National Olympic Committees with delegations of at
least 50% female athletes. Four years later, these numbers improved, with 204
NOCs participating in the 2008 Games. Although eight NOCs failed to include a
female athlete in their delegations—including Kuwait, Qatar and Saudi Arabia—it
marked the first time in the summer Olympic Games that four countries included
a female athlete in their delegations; these four NOCs were British Virgin Islands,
Oman, United Arab Emirates and Yemen.
• Actual participation opportunities for female athletes in the Olympic Games still
lag behind those for male athletes. Despite the same number of sport offerings,
there is a significant discrepancy between the number of events for each gender,
with 127 for women, 165 for men and 10 mixed events at the 2008 Games
in Beijing.
• In 2004, of 135 National Paralympic Committees, 31 did not include women
in their delegations and only five NPCs sent delegations with at least 50%
female athletes.
• Sport (18 of 20) and event (208 of 468 in 2008) participation opportunities
for female Paralympians are alarmingly low, as are their participation rates. In
2004, female athletes accounted for only 30.6% of all participating athletes. Two
sports (football five-a-side and football seven-a-side) are male-only sports. Some
sports are especially inequitable, notably athletics, which in 2004 accounted
for 1,064 participating athletes (27.9% of all Paralympians), of which only 28%
A Women’s Sports Foundation Research Report6
were females. Other inequities include wheelchair rugby, which is considered a
mixed sport, but which included only one female out of 88 participants (1.1%)
at the 2004 Paralympic Games. Similarly, in the mixed sport of sailing, only
three females (4.9%) competed with 61 male athletes. One explanation for the
imbalance among female and male Paralympians could be the disproportionate
number of males with spinal injuries (80%) compared with females (20%);
however, it should be noted that the Paralympic Games include sports and
events that are inclusive of all disabilities, including blindness/visual impairment,
amputees, cerebral palsy and les autres, which do not have the same disparity in
rates of occurrences among females and males.
Major United States Findings• The USOC Board of Directors is 27.2% female, exceeding the 20% IOC
recommended threshold for female members, but is still well below 50%.
• The “Executive Team” of the USOC consists of 12 members, four of whom are
women (33.3%), including acting CEO Stephanie Streeter. The “Management
Team” is made up of 41 individuals, 20 women (48.7%) and 21 men (51.2%).
• There are a total of 58 individuals with leadership roles in U.S. NGBs. Currently
eight of these 58 are women (13.8%). Only one NGB has an all-female leadership
team (U.S. Field Hockey Association), while 20 of them have all-male leadership
teams (64.5%).
• The U.S. Olympic team is coming closer to achieving gender equity in its
participation rate, with close to 48% female athletes in the 2004 delegation and
2008 delegation.
• Gender equity within the U.S. Olympic team is subject to the success of teams
qualifying for the Games. For example, in 2004, the men’s football team did not
qualify for Olympic competition, but the women’s football did qualify, which
helped maintain equity between the two genders. This balance could easily
be lost if both teams qualified (as was the case for the 2008 Games), as there
are still more opportunities for male athletes in individual sports and events,
accounting for the overall imbalance.
7Women in the 2000, 2004 and 2008 Olympic and Paralympic Games: An Analysis of Participation, Leadership and Media Opportunities 7
IntroductionThe IOC states that the growth of women’s
participation in the Olympic Movement is one
of its major goals. Indeed, the stated goal is: “to
encourage and support the promotion of women in
sport at all levels and in all structures, with a view to
implementing the principle of equality of men and
women” (Rule 2, paragraph 7 Olympic Charter, in force
as of Sept. 1, 2004.) Through the Ted Stevens Olympic
and Amateur Sports Act (1978) the USOC is prohibited
from discriminating on the basis of race, color, religion,
age, sex, disability or national origin with regard
to participation and leadership opportunities and
is mandated to work to expand opportunities for
women, women and men of color, and women and
men with disabilities.
Historical Background of Women’s ParticipationThe International Olympic Committee was established
by Pierre de Coubertin and a group of 13 men in 1894.
One of the reasons de Coubertin started the IOC and
the Games was to create a festival where young men
could display their athletic prowess. De Coubertin
was strongly influenced in his decision to restrict the
competitors to men by traditions derived from the
ancient Olympic Games. The first Modern Olympic
Games were held in Athens in 1896 and included no
women competitors, coaches or officials. Women
were included for the first time in the 1900 Games at
Paris, in the sports of golf and tennis (Findling & Pelle,
1996). Great Britain’s Charlotte Cooper was crowned
the first female Olympic champion in the sport of
tennis. As the Games grew in the first third of the 20th
century, women were slowly added to the program,
performing admirably in swimming, diving and
fencing. Stereotypical beliefs about women’s limited
physical capabilities, as well as cultural acceptance
of competitive sport as a display of upper- and
middle-class masculinity, resulted in restrictions on
women’s involvement.
In 1928, when athletics (track and field) events were
added for women for the first time, exaggerated
media reports of the collapse of women competitors
at the finish line of the 800m race led to policies that
prohibited women from running distances greater
than 200 meters in the Olympic Games until 1960,
and the women’s marathon was not contested until
1984. During the first half of the 20th century, women
physical educators in the United States reacted to
the over-commercialization of men’s sports and
concerns for the health of women by campaigning
against elite-level sports competition for women. In
the 1932 Games, this U.S. female physical educator
group worked behind the scenes to attempt to
remove the women’s athletics events (Cahn, 1995).
Many of these women recommended an International
Play Day in lieu of women’s Olympic competition.
Fortunately their suggestions went unheeded, and
Mildred “Babe” Didriksen’s feats are now legendary.
While the 1936 Berlin Games saw the greatest number
of women ever included at that time (328), the actual
percentage of women competitors stood at only 8%,
down slightly from the previous two summer Games
(Wallechinsky, 2004).
The postwar Games saw the entrance of Soviet
Bloc nations into the Games, and women from the
Soviet Union began their domination of gymnastics
and some athletics events. Women were given more
opportunities in the 1960s and 1970s as longer
distances were added in athletics and swimming
and team sports were expanded in volleyball and
basketball. Throughout the 1980s the Olympic
program grew as additional events were added for
women and men. However, as recently as the Seoul
Games in 1988, women comprised only 23% of the
more than 7,000 participants.
IOC World Conferences on Women and SportIn 1996, at the Centennial of the Olympic Games, the
IOC held its first IOC World Conference on Women
and Sport. Prior to this date there had been little
discussion about expanding the role of women in
the Olympic Movement outside of their competitive
roles. Although there were some female members of
the IOC as early as 1981—Pirjo Haggman of Finland

A Women’s Sports Foundation Research Report8 A Women’s Sports Foundation Research Report8
and Venezuela’s Flor Isava-Fonseca were the first
women appointed to the IOC—it was not until the
1996 Conference that the need to bring additional
women into all aspects of the Olympic Movement was
presented as an important goal. The initial request
was that all IFs and NOCs “take into consideration”
gender equity. It was also recommended that a
working group on Women and Sport, comprised of
at least 10% women, be created to study the issue
and that this working group be given Commission
status. Continued research was encouraged
as was the goal of creating equal participation
opportunities for female and male competitors. It
was also recommended that the practice of gender
verification for female athletes be stopped (IOC World
Conference on Women and Sport, 1996).
At the Second IOC World Conference on Women
and Sport held in Paris in 2000, the Final Resolutions
indicated that some interest had been turned to the
issue of women and sport, but that quite a bit still
needed to be accomplished. It was recommended
that the IOC urge groups to meet the 10% criteria for
including women in leadership roles and to increase
the percentage to 20% by 2005. It was also suggested
that all groups come up with a plan of action for
how they planned to implement gender equity up
through 2020 (IOC World Conference on Women and
Sport, 2000).
In 2004 the Third IOC World Conference on Women
and Sport was held. At this meeting it was announced
that the Women in Sport Working Group would
finally—nearly a decade after its inception—be given
status as a Commission of the IOC. In addition, IOC
President Jacques Rogge stated that the IOC should
have as a goal equal participation of female and
male athletes in the Games (III World Conference on
Women and Sport, 2004).
The Fourth IOC Conference on Women and Sport,
held in Jordan, produced a final report entitled the
“Dead Sea Plan of Action.” Within this plan, several
of the key issues noted here in this report were
addressed. One compelling recommendation within
the action plan was the importance of promoting
the issue of women and sport whenever possible.
The opportunity to promote change during the
Games in Beijing—as well as during the election and
selection of leaders to National Olympic Committees,
International Federations and other groups—the 2009
Olympic Congress and the Youth Olympic Games
were highlighted as potential opportunities to move
toward gender equity. It was recommended that
the leadership of the IOC make an effort to strongly
enforce the IOC policy on gender equity (4th IOC
World Conference on Women and Sport, 2008).
There is an ongoing thrust at all of the IOC World
Conferences on Women and Sport to encourage
people to think about the concerns of women in
sport in the larger global setting of women’s issues,
particularly by calling attention to work done by
other groups. Of special note is the work of the
United Nations. The recently released report from the
United Nations entitled “Women, gender equality and
sport,” produced in collaboration with WomenSports
International, underscores this need. Following up
on the International Working Group on Women
and Sport’s (an independent, non-IOC-affiliated
organization) Brighton Declaration, Windhoek Call
for Action and the Montreal Communique, this
comprehensive report detailed the need for girls and
women worldwide to have access to sport and the
critical role sport plays in the health and well-being of
girls and women throughout the globe. As a number
of comprehensive reports have noted, sport is a
valuable source of empowerment for girls and women,
and by limiting their access to highly competitive
sporting opportunities—and leadership roles—like
those provided by international sporting competitions
such as the Olympic and Paralympic Games, we are
restricting their basic human rights (Oglesby, 2008;
Tucker Center for Research on Girls and Women in
Sport, 2007; United Nations Department of Economic
and Social Affairs, 2008).
9Women in the 2000, 2004 and 2008 Olympic and Paralympic Games: An Analysis of Participation, Leadership and Media Opportunities 9
International FindingsComparison of Olympic and Paralympic Games Female and Male Sports and Medal Events
Summary of Findings: Sports and Medal Events in the 2000, 2004 and 2008 Olympic Games
2008 B+• Women and men competed in close to the same
number of sports (women, 26 sports; men, 27
sports). Women did not compete in the sports of
boxing and baseball, while men did not compete
in the sport of softball and the disciplines of
synchronized swimming and rhythmic gymnastics.
However, the total number of male athletes
competing in boxing and baseball totalled 472,
while softball, synchronized swimming and rhythmic
gymnastics accounted for 303. (see Graph 1 on
following page).
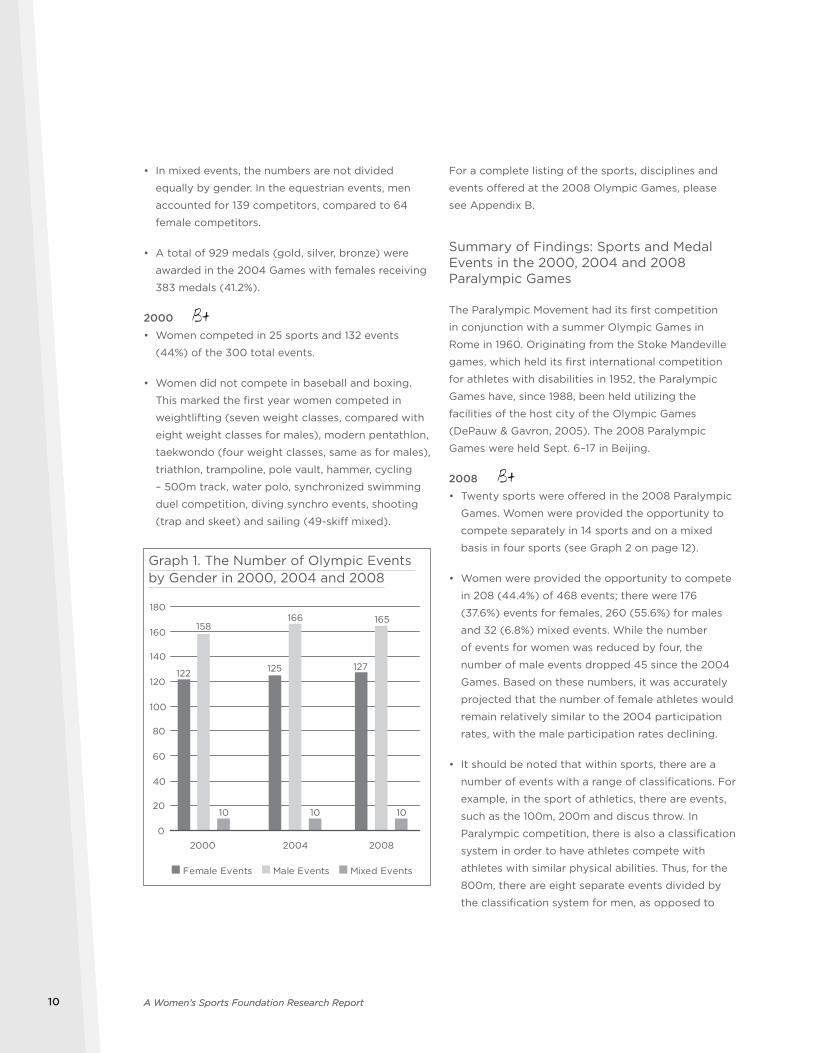
• Although they competed in almost the same
number of sports, women competed in 127 events
(42%), while men competed in 165 events (54.6%).
Additionally, there were 10 mixed events, putting
women in a total of 137 (45.4%) and men in 175
(57.9%) of the 302 events. Women did not compete
in the following events: 50km race walk; fours
(rowing); fours (rowing – lightweight events); K-2
1,000m, K-4 1,000m, C-1 500m, C-1 1,000m, C-2
500m, C-2 1,000m (canoe-kayak: flatwater); C-1
canoe single, C-2 canoe double (canoe-kayak:
slalom); keirin, team sprint, team pursuit, madison
(cycling: track); Greco-Roman wrestling; 50m
rifle prone (shooting: rifle), 25m rapid fire pistol
(shooting: pistol) and double trap (shooting:
shot gun).
• In most team sports, there are an equal number of
teams for each gender, such as basketball, handball
and hockey (each has 12 teams per gender);
however, other team sports do not have an equal
number of teams, such as football (16 teams for
men, 12 for women) and water polo (12 teams for
men, eight for women). Similarly, in weightlifting
there are eight weight classes for men and seven for
women, and in freestyle wrestling there are seven
weight classes for men and four for women.
• A total of 958 medals (gold, silver and bronze) were
awarded in the 2008, with females receiving 396
medals (41.3%).1
2004 B+• Women competed in 135 (44.8%) of all 301 events;
there were 125 (41.5%) for women, 166 (55.1%) for
men and 10 (3.3%) mixed events. Women did not
compete in boxing and baseball, while men did not
compete in synchronized swimming and softball.
However, the number of male athletes competing in
boxing and baseball totaled 472, while synchronized
swimming and softball accounted for 219.
• This was the first year women competed in
wrestling (freestyle, four weight classes, compared
to seven weight classes for males, who also
competed in seven weight classes in Greco-
Roman wrestling, which is not offered to women).
Modified events were water polo, with two teams
added (12 men’s teams, eight women’s teams), and
football, with two teams added (16 men’s teams, 10
women’s teams).
• In addition to the number of events offered for
women, the number of slots allotted for each
gender differs sport by sport. For example, in
cycling/road events, 50 males competed in 2004,
compared to 30 females. Similarly, in canoe/slalom,
65 males competed, compared to 19 females.
In tennis, despite there being the same number
of events for each gender, 88 men competed,
compared with 83 women. In weightlifting,
despite there being relatively similar number
of weight classes (eight for men and seven for
women), 164 men competed, compared to 85
female weightlifters.
1 This does not take into account the number of medals awarded to females in mixed events, which accounted for 3.3% of the total medals.
A Women’s Sports Foundation Research Report10 A Women’s Sports Foundation Research Report10
• In mixed events, the numbers are not divided
equally by gender. In the equestrian events, men
accounted for 139 competitors, compared to 64
female competitors.
• A total of 929 medals (gold, silver, bronze) were
awarded in the 2004 Games with females receiving
383 medals (41.2%).
2000 B+• Women competed in 25 sports and 132 events
(44%) of the 300 total events.
• Women did not compete in baseball and boxing.
This marked the first year women competed in
weightlifting (seven weight classes, compared with
eight weight classes for males), modern pentathlon,
taekwondo (four weight classes, same as for males),
triathlon, trampoline, pole vault, hammer, cycling
– 500m track, water polo, synchronized swimming
duel competition, diving synchro events, shooting
(trap and skeet) and sailing (49-skiff mixed).
Graph 1. The Number of Olympic Events by Gender in 2000, 2004 and 2008
For a complete listing of the sports, disciplines and
events offered at the 2008 Olympic Games, please
see Appendix B.
Summary of Findings: Sports and Medal Events in the 2000, 2004 and 2008 Paralympic Games
The Paralympic Movement had its first competition
in conjunction with a summer Olympic Games in
Rome in 1960. Originating from the Stoke Mandeville
games, which held its first international competition
for athletes with disabilities in 1952, the Paralympic
Games have, since 1988, been held utilizing the
facilities of the host city of the Olympic Games
(DePauw & Gavron, 2005). The 2008 Paralympic
Games were held Sept. 6–17 in Beijing.
2008 B+• Twenty sports were offered in the 2008 Paralympic
Games. Women were provided the opportunity to
compete separately in 14 sports and on a mixed
basis in four sports (see Graph 2 on page 12).
• Women were provided the opportunity to compete
in 208 (44.4%) of 468 events; there were 176
(37.6%) events for females, 260 (55.6%) for males
and 32 (6.8%) mixed events. While the number
of events for women was reduced by four, the
number of male events dropped 45 since the 2004
Games. Based on these numbers, it was accurately
projected that the number of female athletes would
remain relatively similar to the 2004 participation
rates, with the male participation rates declining.
• It should be noted that within sports, there are a
number of events with a range of classifications. For
example, in the sport of athletics, there are events,
such as the 100m, 200m and discus throw. In
Paralympic competition, there is also a classification
system in order to have athletes compete with
athletes with similar physical abilities. Thus, for the
800m, there are eight separate events divided by
the classification system for men, as opposed to
0
20
40
60
80
100
120
140
160
180
2000 2004 2008
Female Events Male Events Mixed Events
122
158
10 10 10
125 127
166 165
11Women in the 2000, 2004 and 2008 Olympic and Paralympic Games: An Analysis of Participation, Leadership and Media Opportunities 11
three classifications for women in the 800m. For the
purposes of this report, these classification divisions
are being considered as separate events. The
justification for this categorization is that medals
are awarded in each separate event/classification.
For example, in almost every athletics and
swimming event, there are multiple classifications,
with each classification being awarded a gold,
silver and bronze medal. If men are competing in a
significantly higher number of events, they are also
being awarded more medals.
• Besides the different number of classifications
offered to female and male Paralympians, there are
also more events offered for males regardless of the
classification. In athletics, only male Paralympians
have the opportunity to compete in the high jump,
pentathlon, triple jump, club throw, 10,000m,
4x100m relay and 4x400m relay.
• Women did not compete in two sports: football
5-a-side and football 7-a-side. This provided 155
additional opportunities for male athletes.
• In wheelchair rugby, which is considered a mixed
sport, three of 88 (3.4%) participants were female.
Rosters are limited to 11 spots, but allow a 12th spot
if it is filled by a female. Three countries brought
teams of 12, with one of the 12 athletes being a
female: Canada, China and Great Britain.
• In sailing, which is considered a mixed sport, 13 of
80 (16.2%) participants were female, an increase
from the 2004 Games (4.7%).
• Only the sport of equestrian had more than 50%
female participation, with 50 of 73 (68.5%) athletes
being female.
• Only three other sports had more than 40% female
participation: rowing (48%), volleyball (47%) and
wheelchair basketball (45%).
2004 B-• Women had the opportunity to compete in 207
(40.4%) of 512 events; there were 180 (35.2%)
events for women, 305 (59.6%) for men and 27
(5.2%) mixed events.
• Women did not compete in two sports: football
5-a-side and football 7-a-side. This provided 153
additional opportunities for male athletes.
• In wheelchair rugby, which is considered a mixed
sport, one of 88 participants was female.
• In sailing, which is considered a mixed sport, three
of 64 participants were female.
• Mixed sport opportunities generally result in a
majority of male athletes.
2000 B• Women had the opportunity to compete in 242
(43.4%) of all 562 events; there were 199 (35.4%)
events for women, 320 (56.9%) for men and 43
(7.6%) mixed events.
• Women did not compete in basketball ID (95 men),
football 7-a-side (88 men), judo (83 men), volleyball
(233 men) and wheelchair rugby (93 men),
providing men with 592 unmatched opportunities,
which accounted for 15% of the total participants.
A Women’s Sports Foundation Research Report12 A Women’s Sports Foundation Research Report12
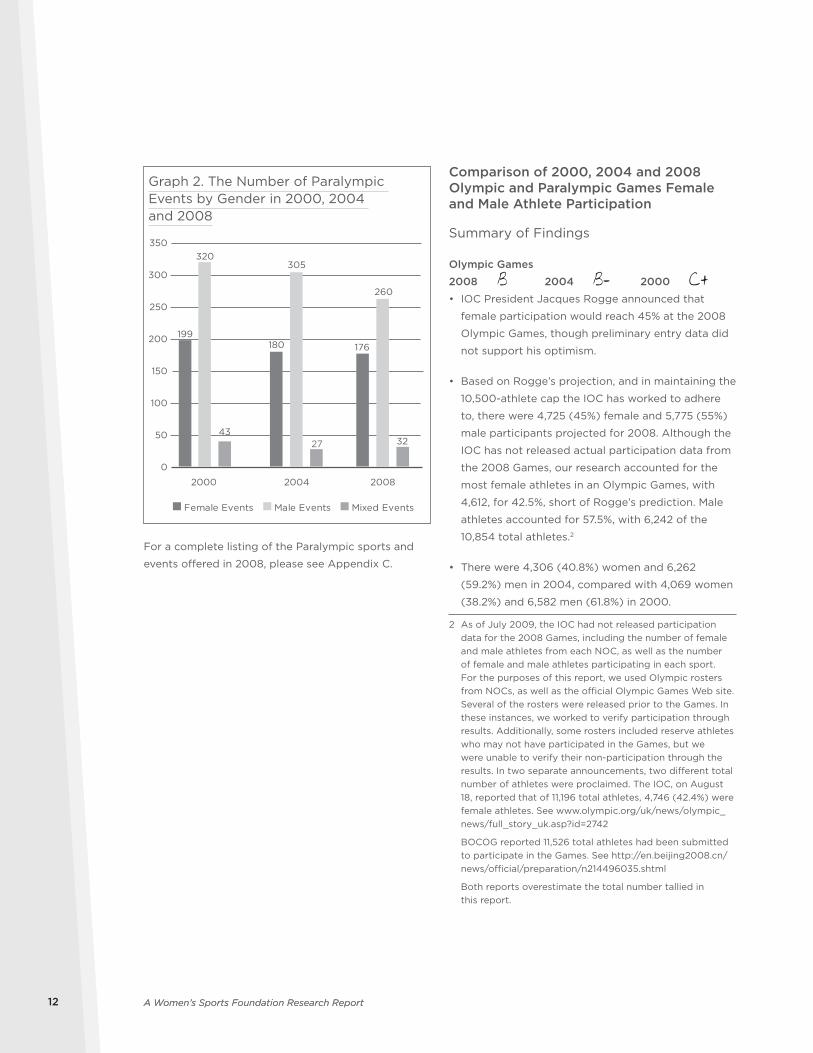
Graph 2. The Number of Paralympic Events by Gender in 2000, 2004 and 2008
For a complete listing of the Paralympic sports and
events offered in 2008, please see Appendix C.
Comparison of 2000, 2004 and 2008 Olympic and Paralympic Games Female and Male Athlete Participation
Summary of Findings
Olympic Games
2008 B 2004 B- 2000 C+
• IOC President Jacques Rogge announced that
female participation would reach 45% at the 2008
Olympic Games, though preliminary entry data did
not support his optimism.
• Based on Rogge’s projection, and in maintaining the
10,500-athlete cap the IOC has worked to adhere
to, there were 4,725 (45%) female and 5,775 (55%)
male participants projected for 2008. Although the
IOC has not released actual participation data from
the 2008 Games, our research accounted for the
most female athletes in an Olympic Games, with
4,612, for 42.5%, short of Rogge’s prediction. Male
athletes accounted for 57.5%, with 6,242 of the
10,854 total athletes.2
• There were 4,306 (40.8%) women and 6,262
(59.2%) men in 2004, compared with 4,069 women
(38.2%) and 6,582 men (61.8%) in 2000.
2 As of July 2009, the IOC had not released participation data for the 2008 Games, including the number of female and male athletes from each NOC, as well as the number of female and male athletes participating in each sport. For the purposes of this report, we used Olympic rosters from NOCs, as well as the official Olympic Games Web site. Several of the rosters were released prior to the Games. In these instances, we worked to verify participation through results. Additionally, some rosters included reserve athletes who may not have participated in the Games, but we were unable to verify their non-participation through the results. In two separate announcements, two different total number of athletes were proclaimed. The IOC, on August 18, reported that of 11,196 total athletes, 4,746 (42.4%) were female athletes. See www.olympic.org/uk/news/olympic_news/full_story_uk.asp?id=2742
BOCOG reported 11,526 total athletes had been submitted to participate in the Games. See http://en.beijing2008.cn/news/official/preparation/n214496035.shtml
Both reports overestimate the total number tallied in this report.
0
50
100
150
200
250
300
350
2000 2004 2008
Female Events Male Events Mixed Events
199
320
4327 32
180 176
305
260
13Women in the 2000, 2004 and 2008 Olympic and Paralympic Games: An Analysis of Participation, Leadership and Media Opportunities 13
• In 2008, 204 NOCs sent delegations (201 in 2004
and 200 in 2000) with eight NOCs having no
female participants. Nine delegations did not send
any female participants in 2004 and 2000. One
delegation did not have a male participant in 2008,
two delegations had no male participants in 2004,
and no delegations were without males in 2000.
Paralympic Games
2008 C- 2004 F 2000 F • Participation rates for female athletes improved in
2008, with 1,383 (34.5%) women and 2,628 (65.5%)
men. Such changes to the program between 2004
and 2008 included an increase in the number of
events/classifications for female athletes (although
the overall total number of events for women
dropped by four), while a number of events/
classifications for male athletes were eliminated or
combined with another classification. Fifteen fewer
male Paralympians competed in the 2008 Games,
while an additional 218 female athletes competed as
compared to the 2004 Games.
• There were 1,165 (30.6%) women and 2,643 (69.4%)
men in the 2004 Paralympic Games, compared with
990 women (25.5%) and 2,891 men (74.5%) in 2000.
• In 2004, 135 NPCs attended; 31 delegations did not
send any female participants, and six delegations
did not send any male participants, compared to 122
NPCs with 39 delegations sending no females and
four delegations sending no males in 2000.
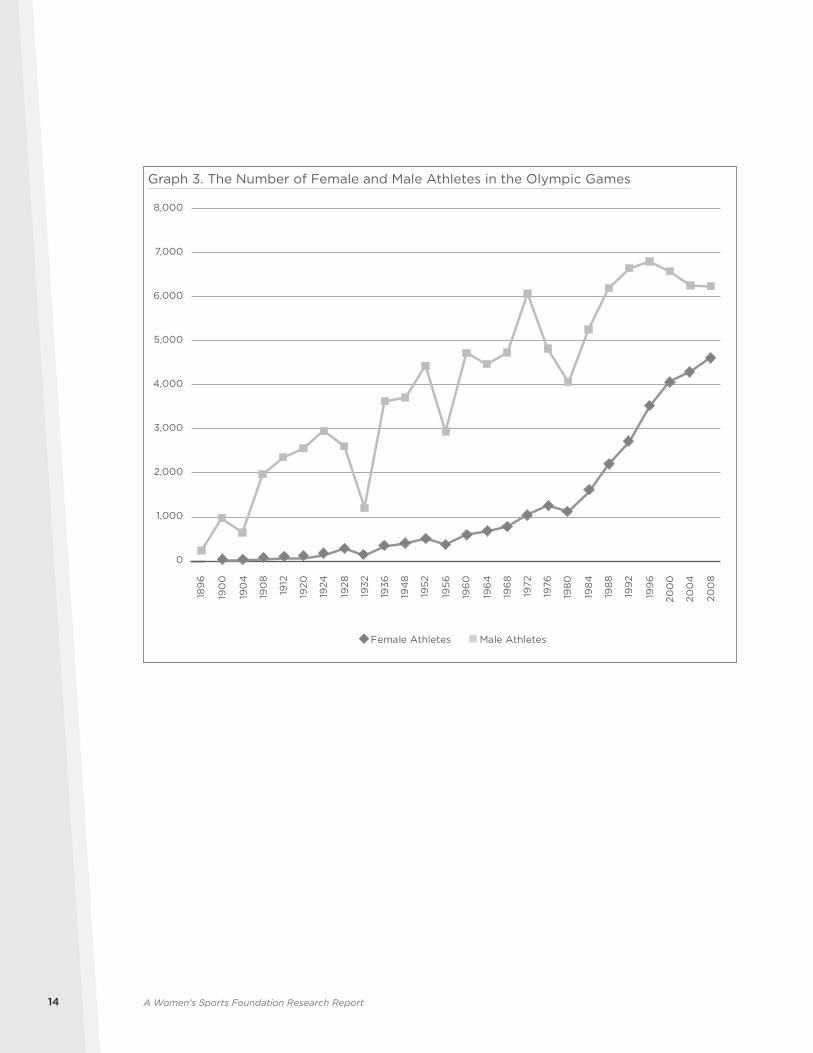
The 2000, 2004 and 2008 Olympic Games
The number of female and male Olympic Games
participants has steadily increased over the last
century (see Graphs 3, 4 and 5 on following pages).
While male numbers have declined slightly over the
past four Olympiads, female participation numbers
have continued to rise. If these trends continue, we
should expect to see gender equity in participation
rates by the 2020 Olympic Games, still over a decade
away and reliant on efforts by the IOC to increase
opportunities for female participation. Increased
opportunities, however, seem unlikely. The IOC has
maintained a position of working to cap the total
number of participants, thus limiting the number of
female sports and events to be added in the coming
years. By establishing this position, then, the IOC has
chosen to reduce male participation rates in order
to reach equity rather than expand opportunities for
women. However, even when the IOC has eliminated
certain sports, it has replaced them with new
disciplines offered to both females and males, such
as BMX (a discipline within the sport of cycling) and
trampoline (a discipline within gymnastics), which
does not result in any overall shift toward equity.
A Women’s Sports Foundation Research Report14
Graph 3. The Number of Female and Male Athletes in the Olympic Games
Female Athletes Male Athletes
0
1,000
2,000
3,000
4,000
5,000
6,000
7,000
8,000
200
4
200
8
200
0
199
6
199
2
198
8
198
4
198
0
1976
1972
196
8
196
4
196
0
1956
1952
194
8
1936
1932
1928
1924
1920
1912
190
8
190
4
190
0
189
6
15Women in the 2000, 2004 and 2008 Olympic and Paralympic Games: An Analysis of Participation, Leadership and Media Opportunities
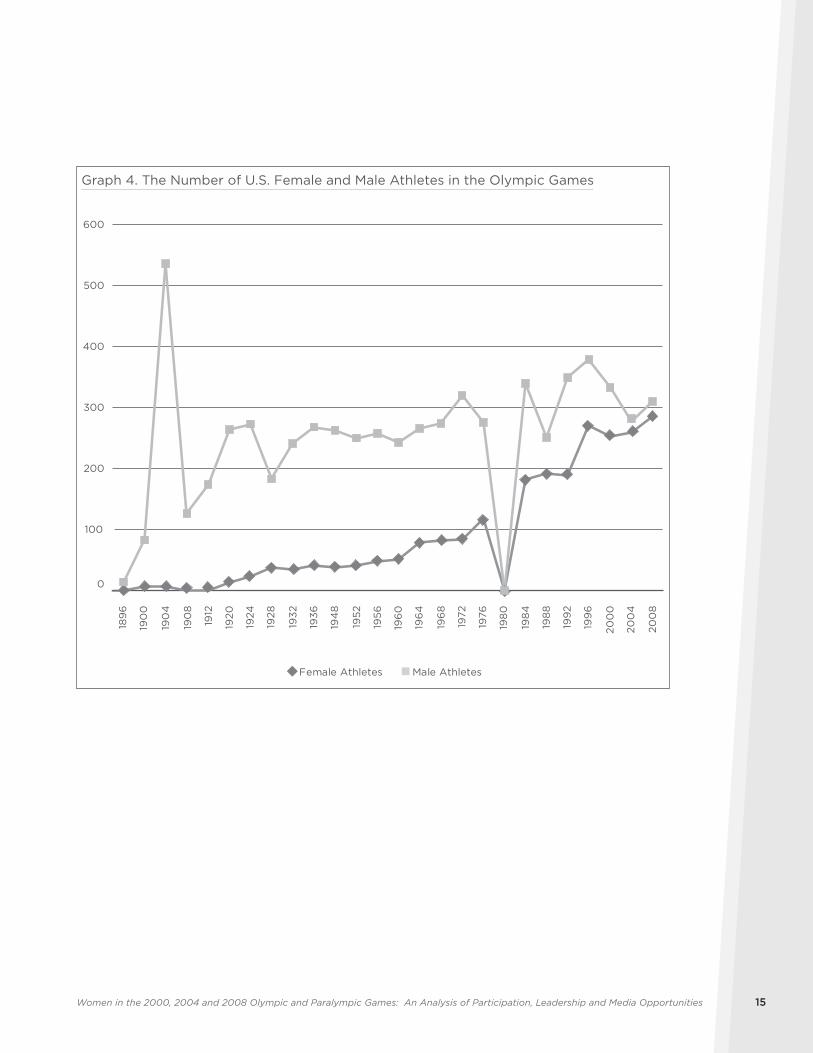
Graph 4. The Number of U.S. Female and Male Athletes in the Olympic Games
Female Athletes Male Athletes
0
100
200
300
400
500
600
200
4
200
8
200
0
199
6
199
2
198
8
198
4
198
0
1976
1972
196
8
196
4
196
0
1956
1952
194
8
1936
1932
1928
1924
1920
1912
190
8
190
4
190
0
189
6
A Women’s Sports Foundation Research Report16 A Women’s Sports Foundation Research Report16
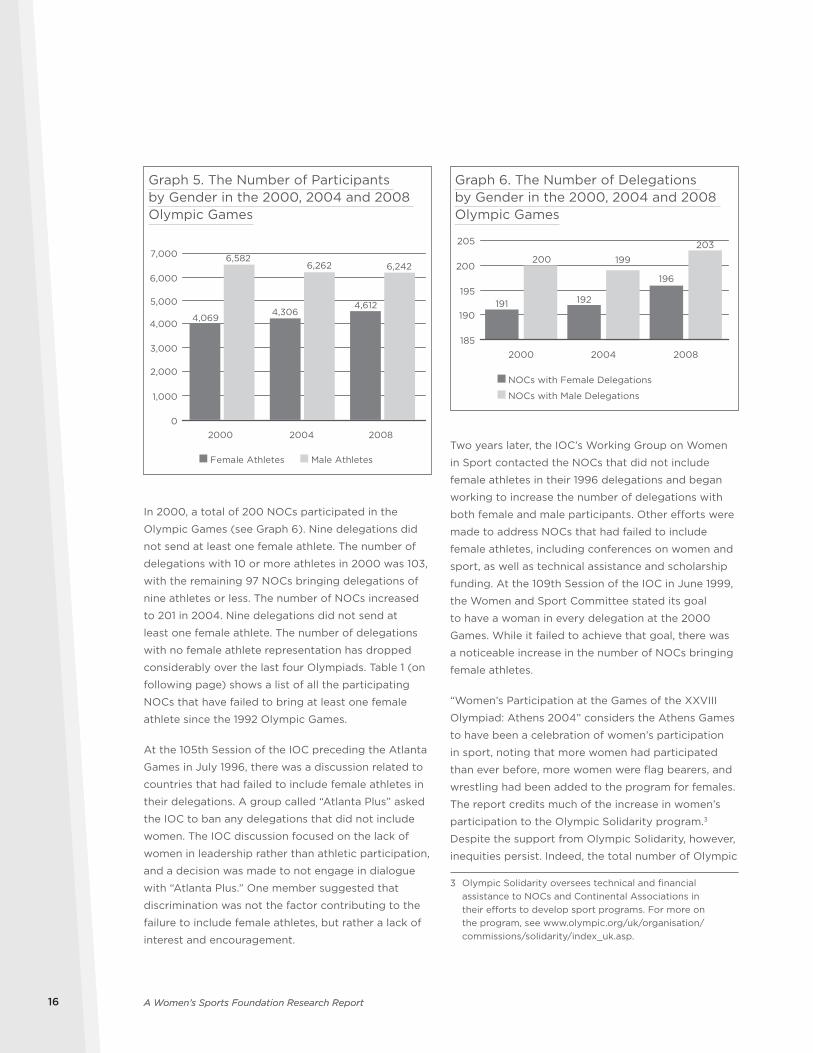
Graph 5. The Number of Participants by Gender in the 2000, 2004 and 2008 Olympic Games
In 2000, a total of 200 NOCs participated in the
Olympic Games (see Graph 6). Nine delegations did
not send at least one female athlete. The number of
delegations with 10 or more athletes in 2000 was 103,
with the remaining 97 NOCs bringing delegations of
nine athletes or less. The number of NOCs increased
to 201 in 2004. Nine delegations did not send at
least one female athlete. The number of delegations
with no female athlete representation has dropped
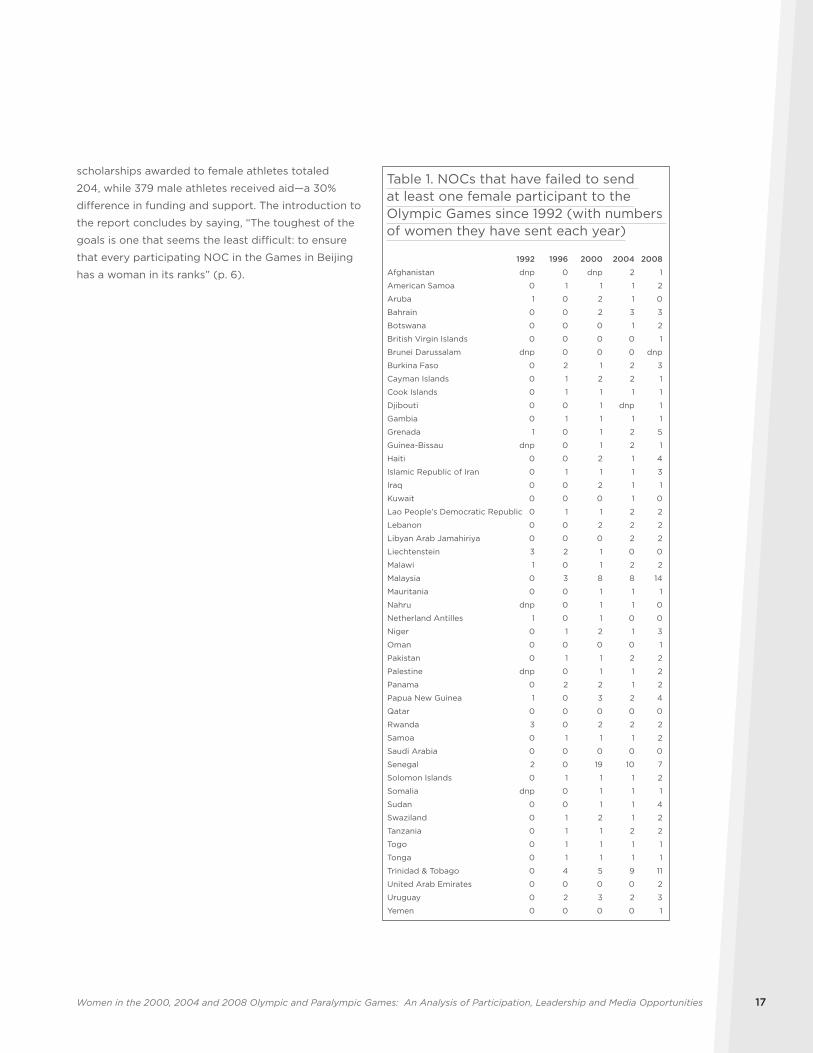
considerably over the last four Olympiads. Table 1 (on
following page) shows a list of all the participating
NOCs that have failed to bring at least one female
athlete since the 1992 Olympic Games.
At the 105th Session of the IOC preceding the Atlanta
Games in July 1996, there was a discussion related to
countries that had failed to include female athletes in
their delegations. A group called “Atlanta Plus” asked
the IOC to ban any delegations that did not include
women. The IOC discussion focused on the lack of
women in leadership rather than athletic participation,
and a decision was made to not engage in dialogue
with “Atlanta Plus.” One member suggested that
discrimination was not the factor contributing to the
failure to include female athletes, but rather a lack of
interest and encouragement.
Graph 6. The Number of Delegations by Gender in the 2000, 2004 and 2008 Olympic Games
Two years later, the IOC’s Working Group on Women
in Sport contacted the NOCs that did not include
female athletes in their 1996 delegations and began
working to increase the number of delegations with
both female and male participants. Other efforts were
made to address NOCs that had failed to include
female athletes, including conferences on women and
sport, as well as technical assistance and scholarship
funding. At the 109th Session of the IOC in June 1999,
the Women and Sport Committee stated its goal
to have a woman in every delegation at the 2000
Games. While it failed to achieve that goal, there was
a noticeable increase in the number of NOCs bringing
female athletes.
“Women’s Participation at the Games of the XXVIII
Olympiad: Athens 2004” considers the Athens Games
to have been a celebration of women’s participation
in sport, noting that more women had participated
than ever before, more women were flag bearers, and
wrestling had been added to the program for females.
The report credits much of the increase in women’s
participation to the Olympic Solidarity program.3
Despite the support from Olympic Solidarity, however,
inequities persist. Indeed, the total number of Olympic
3 Olympic Solidarity oversees technical and financial assistance to NOCs and Continental Associations in their efforts to develop sport programs. For more on the program, see www.olympic.org/uk/organisation/commissions/solidarity/index_uk.asp.
0
1,000
2,000
3,000
4,000
5,000
6,000
7,000
2000 2004 2008
Female Athletes Male Athletes
4,069
6,582
4,306
6,262
4,612
6,242
2000
191
200
2008
196
203
2004
192
199
185
190
195
200
205
NOCs with Female Delegations
NOCs with Male Delegations
17Women in the 2000, 2004 and 2008 Olympic and Paralympic Games: An Analysis of Participation, Leadership and Media Opportunities 17
scholarships awarded to female athletes totaled
204, while 379 male athletes received aid—a 30%
difference in funding and support. The introduction to
the report concludes by saying, “The toughest of the
goals is one that seems the least difficult: to ensure
that every participating NOC in the Games in Beijing
has a woman in its ranks” (p. 6).
Table 1. NOCs that have failed to send at least one female participant to the Olympic Games since 1992 (with numbers of women they have sent each year)
1992 1996 2000 2004 2008
Afghanistan dnp 0 dnp 2 1
American Samoa 0 1 1 1 2
Aruba 1 0 2 1 0
Bahrain 0 0 2 3 3
Botswana 0 0 0 1 2
British Virgin Islands 0 0 0 0 1
Brunei Darussalam dnp 0 0 0 dnp
Burkina Faso 0 2 1 2 3
Cayman Islands 0 1 2 2 1
Cook Islands 0 1 1 1 1
Djibouti 0 0 1 dnp 1
Gambia 0 1 1 1 1
Grenada 1 0 1 2 5
Guinea-Bissau dnp 0 1 2 1
Haiti 0 0 2 1 4
Islamic Republic of Iran 0 1 1 1 3
Iraq 0 0 2 1 1
Kuwait 0 0 0 1 0
Lao People’s Democratic Republic 0 1 1 2 2
Lebanon 0 0 2 2 2
Libyan Arab Jamahiriya 0 0 0 2 2
Liechtenstein 3 2 1 0 0
Malawi 1 0 1 2 2
Malaysia 0 3 8 8 14
Mauritania 0 0 1 1 1
Nahru dnp 0 1 1 0
Netherland Antilles 1 0 1 0 0
Niger 0 1 2 1 3
Oman 0 0 0 0 1
Pakistan 0 1 1 2 2
Palestine dnp 0 1 1 2
Panama 0 2 2 1 2
Papua New Guinea 1 0 3 2 4
Qatar 0 0 0 0 0
Rwanda 3 0 2 2 2
Samoa 0 1 1 1 2
Saudi Arabia 0 0 0 0 0
Senegal 2 0 19 10 7
Solomon Islands 0 1 1 1 2
Somalia dnp 0 1 1 1
Sudan 0 0 1 1 4
Swaziland 0 1 2 1 2
Tanzania 0 1 1 2 2
Togo 0 1 1 1 1
Tonga 0 1 1 1 1
Trinidad & Tobago 0 4 5 9 11
United Arab Emirates 0 0 0 0 2
Uruguay 0 2 3 2 3
Yemen 0 0 0 0 1
A Women’s Sports Foundation Research Report18 A Women’s Sports Foundation Research Report18
As a result of global pressure with encouragement
coming from the IOC as well, several NOCs that
brought no female athletes in their delegations
between 1992 and 2000 did bring one and sometimes
two female athletes in 2004. The notable exceptions
were Malaysia, Senegal, and Trinidad and Tobago. The
remaining 35 NOCs that included only one or two
female athletes—as well as Bahrain, which brought
three females—in their 2004 delegations were
examined in this report to determine which sport
the female athlete competed in to better recognize
the strategies used by NOCs to improve their female
participation numbers.
In examining the countries that have recently
made efforts to send at least one female athlete in
their delegations, there is a noticeable trend: the
overwhelming majority of the female athletes in
these delegations are competing in athletics and
swimming. Of 51 female athletes, 33 competed
in athletics, with an additional 12 competing in
swimming. The remaining athletes competed in
shooting, weightlifting, judo and wrestling. The IOC
offers a wild card program (part of the Olympic
Solidarity scholarship program) to encourage the
participation of a greater number of NOCs, providing
opportunities in athletics and swimming to these
developing NOCs without requiring the athletes to
qualify for the events by meeting a time or distance
standard. In assessing the female athletes and their
performances in the 2004 Games, the majority appear
to have been admitted to the Games through the wild
card program as their performances did not meet the
qualifying standard.
It is evident that one strategy used by NOCs that
have historically not included female athletes in their
delegations is through the wild card program. It is
hoped that through such participation, the numbers
will continue to rise, although there has been criticism
of the wild card program for allowing athletes who
are not Olympic caliber to compete for the sake of
increasing the numbers of participating NOCs.
For the first time, female athletes representing British
Virgin Islands, Oman, United Arab Emirates and
Yemen participated in the 2008 Games. It should be
noted that these NOC delegations are generally small,
usually not exceeding 10 athletes. British Virgin Islands
brought two athletes, including one female, who
competed in track and field. Oman had a delegation
of five athletes, including one female athlete who
competed in track and field. United Arab Emirates
brought a delegation of eight athletes, including two
women, one who competed as an equestrian and
the other in taekwondo. Yemen’s delegation of five
athletes included one female who competed in track
and field.
Of the eight NOCs that did not include a female
athlete in their delegation, Qatar and Saudi Arabia
are the only two countries that have failed to include
a female athlete in each Olympic Games. Brunei
Darussalam, which has failed to bring a female athlete
in their delegation at each Olympic Games, did not
participate in the 2008 Games. Again, the NOCs
who routinely fail to bring a female athlete in their
delegations, or send one or two athletes, are generally
smaller delegations usually not exceeding total 10
delegates. One exception was Qatar, with a delegation
of 22 male athletes.

19Women in the 2000, 2004 and 2008 Olympic and Paralympic Games: An Analysis of Participation, Leadership and Media Opportunities 19
Table 2. The 2008 Olympic Games: Top 10 Delegations by Number of Women4
Rank Country Number of Women
1. China 304
2. United States 286
3. Russian Federation 222
4. Australia 202
5. Germany 187
6. Japan 165
T7. Canada 143
T7. Great Britain 143
9. Italy 129
T10. France 126
T10. Brazil 126
There were four additional delegations with more than
100 women: Korea, Poland, Spain and Ukraine.
In 2008, 106 delegations were comprised of 10 or
more athletes, while the remaining 98 NOCs had nine
or fewer total participating athletes.
Table 3. The 2008 Olympic Games: Top 10 Delegations for Women Relative to Their Male Delegations (of delegations comprised of 10 or more total athletes)
Rank Country % of Women # of Women
1. Mali 82.4 14
2. DPR Korea 66.1 39
3. Norway 64.7 55
4. El Salvador 63.6 7
5. Romania 60.4 61
6. Sweden 57.6 72
7. Finland 57.9 22
8. Jamaica 56.9 29
9 Kazakhstan 54.7 70
10. Thailand 53.2 25
4 The 2008 data was compiled using a variety of available Internet sources, including NOCs, the official Olympic Games Web site and results. In the case of conflicting numbers, we attempted to verify participation using results. The numbers cited in Tables 2-4 are, to our knowledge, the most accurate data, in the absence of official participation numbers from the IOC, which has yet to issue such a report. As a result, we concede that there may be minimal errors.
There were four other countries with at least 50%
female delegation: Hong Kong, China; Japan;
Mongolia; and Senegal.
Table 4. The 2008 Olympic Games: 10 Worst Delegations for Women Relative to Their Male Delegations (of delegations comprised of 10 or more total athletes)
Rank Country % of Women # of Women
T1. Qatar 0 0
T1. Saudi Arabia 0 0
3. Iran 5.4 3
4. Rep. of Moldova 7.7 1
5. Armenia 8 2
6. Honduras 8.3 2
7. Cote de Ivorie 8.7 2
8. Pakistan 9.5 2
9. Montenegro 10.5 2
10. Tajikstan 14.3 2
In addition to eight countries (3.9%) with no female
participation, 36 delegations (17.6%) had only one
woman. Of these 36, only one NOC had 10 or more
total athletes in its delegation.
In 2004, 104 delegations were comprised of 10
or more athletes (see Table 6 for top 10), while
the remaining 97 NOCs had nine or fewer total
participating athletes. Senegal should be commended
for its successful efforts to increase female athlete
participation. In 1992, Senegal brought two female
athletes and in 1996 were one of 29 NOCs to bring no
female athletes. In 2004, Senegal’s delegation was
62.5% female, ranking the African nation fourth among
delegations with 10 or more athletes. China, Japan
and Canada were the only three NOCs among the top
10 of total number of female athletes and above 50%
female participation (see Table 3).

A Women’s Sports Foundation Research Report20 A Women’s Sports Foundation Research Report20
Table 5. The 2004 Olympic Games: Top 10 Delegations by Number of Women
Rank Country Number of Women
1. United States 259
2. China 248
3. Greece 211
4. Russia 204
5. Australia 202
6. Germany 191
7. Japan 167
8. Spain 139
9. Italy 135
10. Canada 132
Table 6. The 2004 Olympic Games: Top 10 Delegations for Women Relative to Their Male Delegations (of delegations comprised of 10 or more total athletes)
Rank Country % of Women # of Women
1. Nigeria 65.7 46
2. China 64.6 248
3. Democratic People’s
Republic of Korea
63.9 23
T4. Senegal 62.5 10
T4. Singapore 62.5 10
6. Hong-Kong 56.2 18
7. Japan 54.5 167
8. Romania 53.7 58
9. Angola 53.3 16
10. Jamaica 53.2 25
In addition to nine countries (4.4%) with no female
participation, 48 delegations (23.8%) had only one
woman. Of these 48, only four (8.3%) had 10 or more
in their delegation: Botswana, one female of 11 total;
Iraq, one of 29; Islamic Republic of Iran, one of 37;
and Kuwait, one of 11. The remaining 44 delegations
(91.7%) were less than 10 athletes (see Table 7).
See Tables 8, 9 and 10 for comparison to the 2000
Olympic Games.
Table 7. The 2004 Olympic Games: 10 Worst Delegations for Women Relative to Their Male Delegations (of delegations comprised of 10 or more total athletes)
Rank Country % of Women # of Women
T1. Saudi Arabia 0 0
T1. Qatar 0 0
3. Islamic Republic of Iran 2.7 1
4. Iraq 4.1 1
5. Pakistan 7.6 2
6. Serbia and Montenegro 8.1 7
T7. Botswana 9 1
T7. Kuwait 9 1
T7. Paraguay 9 2
10. Mali 9.5 2
Table 8. The 2000 Olympic Games: Top 10 Delegations by Number of Women
Rank Country Number of Women
1. Australia 276
2. United States 253
3. Russia 194
4. Germany 181
5. China 180
6. Canada 144
7. Great Britain 129
8. France 125
9. Italy 115
10. Japan 110
There were two other countries with delegations of
more than 100 females: Korea (106) and Spain (105).
21Women in the 2000, 2004 and 2008 Olympic and Paralympic Games: An Analysis of Participation, Leadership and Media Opportunities 21
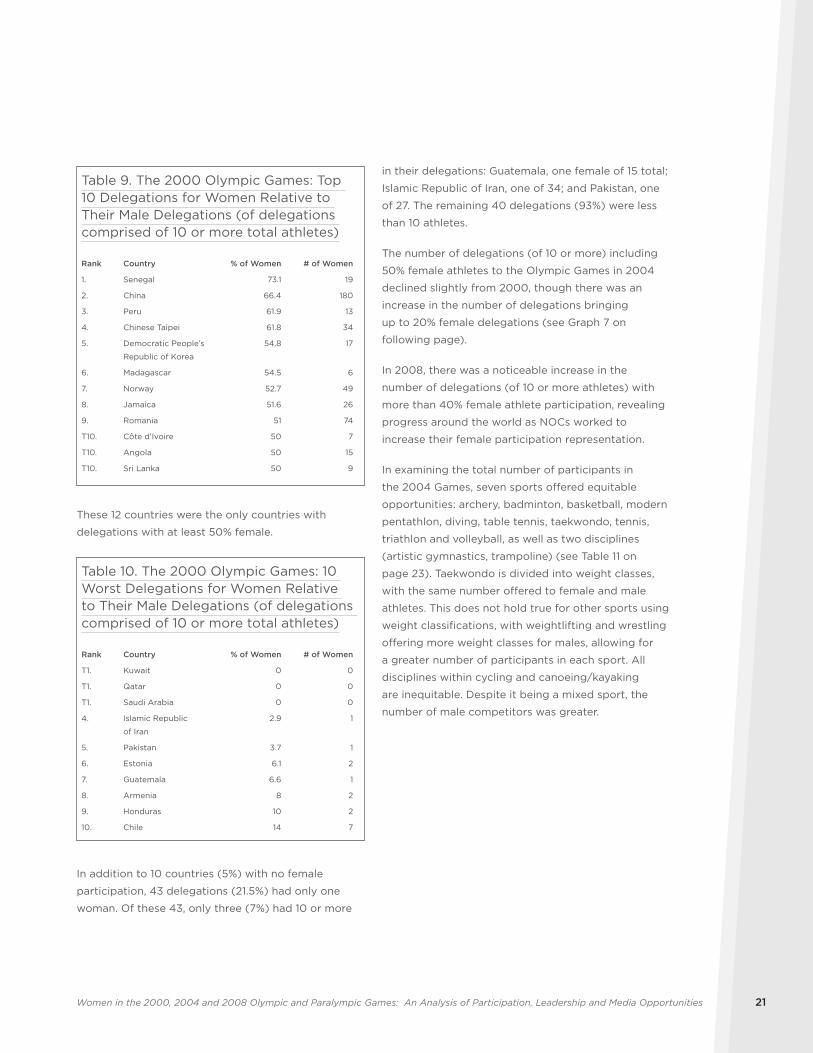
Table 9. The 2000 Olympic Games: Top 10 Delegations for Women Relative to Their Male Delegations (of delegations comprised of 10 or more total athletes)
Rank Country % of Women # of Women
1. Senegal 73.1 19
2. China 66.4 180
3. Peru 61.9 13
4. Chinese Taipei 61.8 34
5. Democratic People’s
Republic of Korea
54.8 17
6. Madagascar 54.5 6
7. Norway 52.7 49
8. Jamaica 51.6 26
9. Romania 51 74
T10. Côte d’Ivoire 50 7
T10. Angola 50 15
T10. Sri Lanka 50 9
These 12 countries were the only countries with
delegations with at least 50% female.
Table 10. The 2000 Olympic Games: 10 Worst Delegations for Women Relative to Their Male Delegations (of delegations comprised of 10 or more total athletes)
Rank Country % of Women # of Women
T1. Kuwait 0 0
T1. Qatar 0 0
T1. Saudi Arabia 0 0
4. Islamic Republic
of Iran
2.9 1
5. Pakistan 3.7 1
6. Estonia 6.1 2
7. Guatemala 6.6 1
8. Armenia 8 2
9. Honduras 10 2
10. Chile 14 7
In addition to 10 countries (5%) with no female
participation, 43 delegations (21.5%) had only one
woman. Of these 43, only three (7%) had 10 or more
in their delegations: Guatemala, one female of 15 total;
Islamic Republic of Iran, one of 34; and Pakistan, one
of 27. The remaining 40 delegations (93%) were less
than 10 athletes.
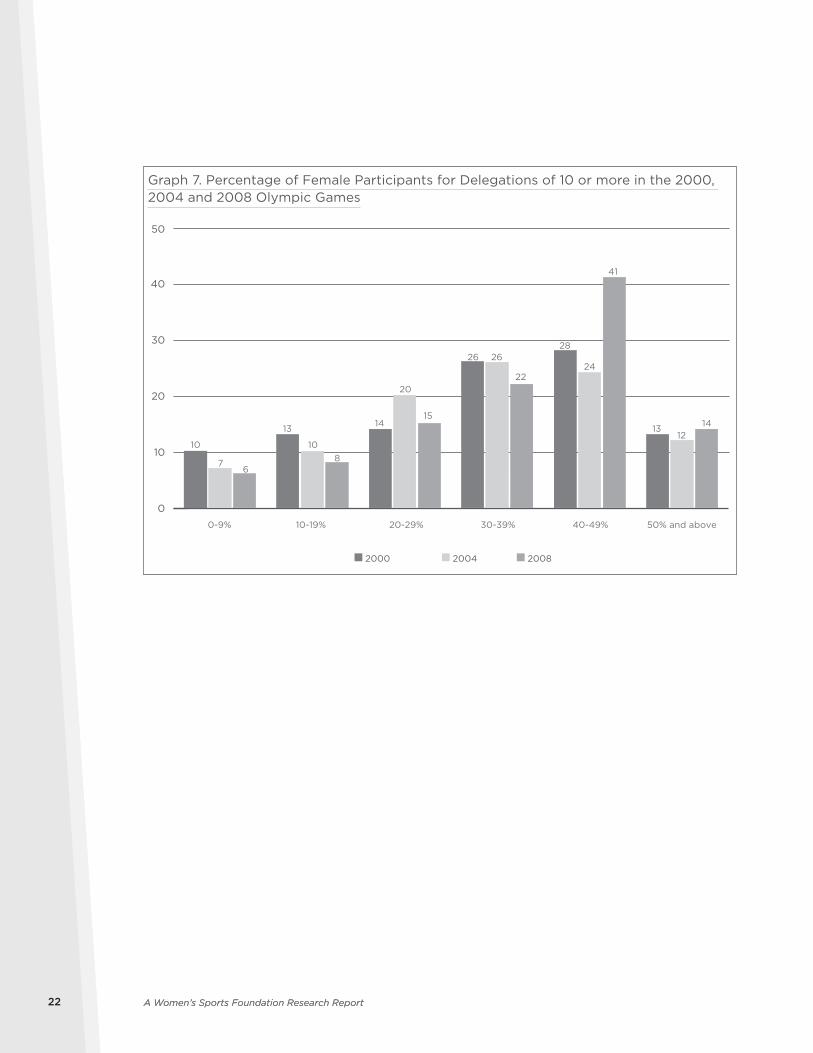
The number of delegations (of 10 or more) including
50% female athletes to the Olympic Games in 2004
declined slightly from 2000, though there was an
increase in the number of delegations bringing
up to 20% female delegations (see Graph 7 on
following page).
In 2008, there was a noticeable increase in the
number of delegations (of 10 or more athletes) with
more than 40% female athlete participation, revealing
progress around the world as NOCs worked to
increase their female participation representation.
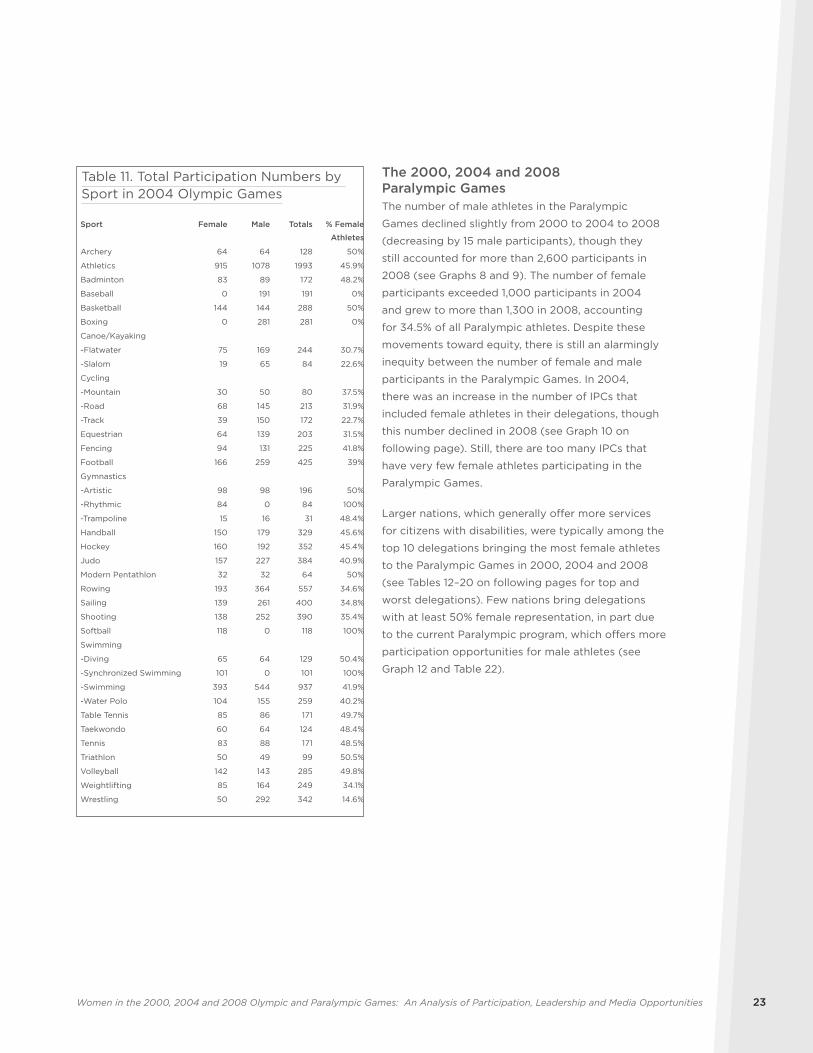
In examining the total number of participants in
the 2004 Games, seven sports offered equitable
opportunities: archery, badminton, basketball, modern
pentathlon, diving, table tennis, taekwondo, tennis,
triathlon and volleyball, as well as two disciplines
(artistic gymnastics, trampoline) (see Table 11 on
page 23). Taekwondo is divided into weight classes,
with the same number offered to female and male
athletes. This does not hold true for other sports using
weight classifications, with weightlifting and wrestling
offering more weight classes for males, allowing for
a greater number of participants in each sport. All
disciplines within cycling and canoeing/kayaking
are inequitable. Despite it being a mixed sport, the
number of male competitors was greater.
A Women’s Sports Foundation Research Report22 A Women’s Sports Foundation Research Report22
Graph 7. Percentage of Female Participants for Delegations of 10 or more in the 2000, 2004 and 2008 Olympic Games
0
10
20
30
40
50
0-9% 10-19% 20-29% 30-39% 40-49% 50% and above
10 10
76
8
1313 14 14
20
15
26 26
22
28
24
41
12
2000 2004 2008
23Women in the 2000, 2004 and 2008 Olympic and Paralympic Games: An Analysis of Participation, Leadership and Media Opportunities 23
Table 11. Total Participation Numbers by Sport in 2004 Olympic Games
Sport Female Male Totals % Female
Athletes
Archery 64 64 128 50%
Athletics 915 1078 1993 45.9%
Badminton 83 89 172 48.2%
Baseball 0 191 191 0%
Basketball 144 144 288 50%
Boxing 0 281 281 0%
Canoe/Kayaking
-Flatwater 75 169 244 30.7%
-Slalom 19 65 84 22.6%
Cycling
-Mountain 30 50 80 37.5%
-Road 68 145 213 31.9%
-Track 39 150 172 22.7%
Equestrian 64 139 203 31.5%
Fencing 94 131 225 41.8%
Football 166 259 425 39%
Gymnastics
-Artistic 98 98 196 50%
-Rhythmic 84 0 84 100%
-Trampoline 15 16 31 48.4%
Handball 150 179 329 45.6%
Hockey 160 192 352 45.4%
Judo 157 227 384 40.9%
Modern Pentathlon 32 32 64 50%
Rowing 193 364 557 34.6%
Sailing 139 261 400 34.8%
Shooting 138 252 390 35.4%
Softball 118 0 118 100%
Swimming
-Diving 65 64 129 50.4%
-Synchronized Swimming 101 0 101 100%
-Swimming 393 544 937 41.9%
-Water Polo 104 155 259 40.2%
Table Tennis 85 86 171 49.7%
Taekwondo 60 64 124 48.4%
Tennis 83 88 171 48.5%
Triathlon 50 49 99 50.5%
Volleyball 142 143 285 49.8%
Weightlifting 85 164 249 34.1%
Wrestling 50 292 342 14.6%
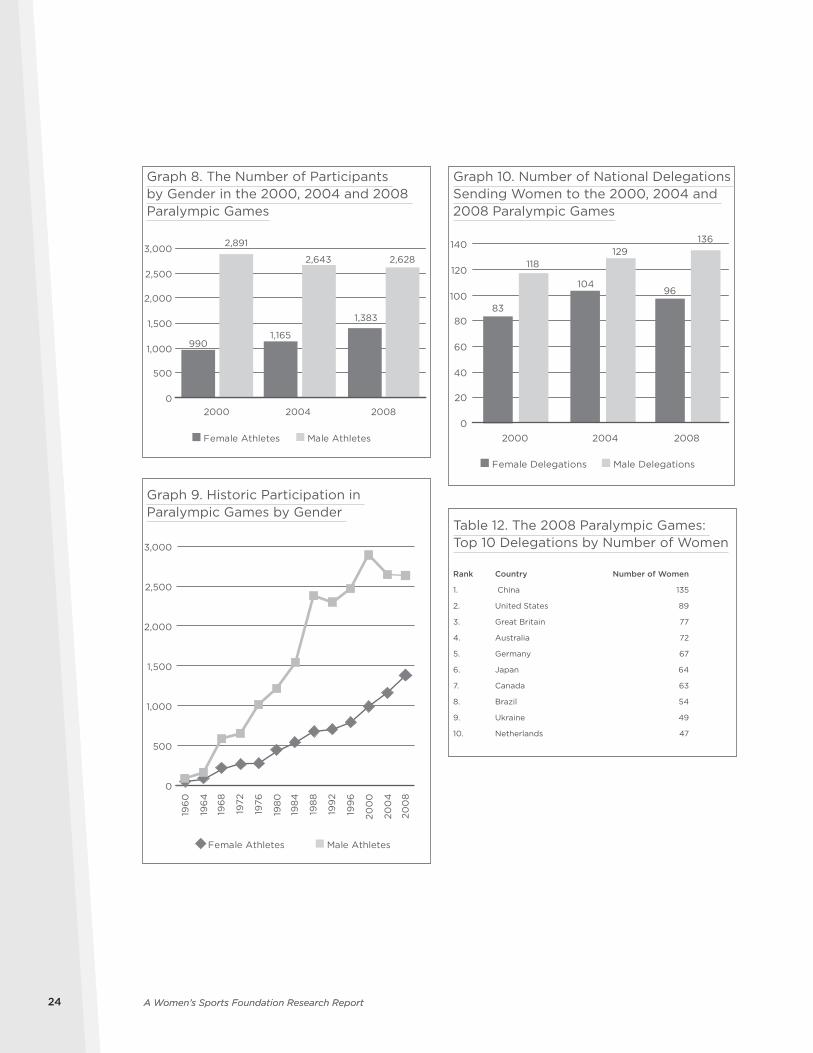
The 2000, 2004 and 2008 Paralympic GamesThe number of male athletes in the Paralympic
Games declined slightly from 2000 to 2004 to 2008
(decreasing by 15 male participants), though they
still accounted for more than 2,600 participants in
2008 (see Graphs 8 and 9). The number of female
participants exceeded 1,000 participants in 2004
and grew to more than 1,300 in 2008, accounting
for 34.5% of all Paralympic athletes. Despite these
movements toward equity, there is still an alarmingly
inequity between the number of female and male
participants in the Paralympic Games. In 2004,
there was an increase in the number of IPCs that
included female athletes in their delegations, though
this number declined in 2008 (see Graph 10 on
following page). Still, there are too many IPCs that
have very few female athletes participating in the
Paralympic Games.
Larger nations, which generally offer more services
for citizens with disabilities, were typically among the
top 10 delegations bringing the most female athletes
to the Paralympic Games in 2000, 2004 and 2008
(see Tables 12–20 on following pages for top and
worst delegations). Few nations bring delegations
with at least 50% female representation, in part due
to the current Paralympic program, which offers more
participation opportunities for male athletes (see
Graph 12 and Table 22).
A Women’s Sports Foundation Research Report24 A Women’s Sports Foundation Research Report24
Graph 10. Number of National Delegations Sending Women to the 2000, 2004 and 2008 Paralympic Games
Table 12. The 2008 Paralympic Games: Top 10 Delegations by Number of Women
Rank Country Number of Women
1. China 135
2. United States 89
3. Great Britain 77
4. Australia 72
5. Germany 67
6. Japan 64
7. Canada 63
8. Brazil 54
9. Ukraine 49
10. Netherlands 47
Graph 8. The Number of Participants by Gender in the 2000, 2004 and 2008 Paralympic Games
Graph 9. Historic Participation in Paralympic Games by Gender
0
500
1,000
1,500
2,000
2,500
3,000
Female Athletes Male Athletes
990
2,891
2000
1,165
2,643
2004
1,383
2,628
2008
2008
104
0
20
40
60
80
100
120
140
2000 2004
Female Delegations Male Delegations
83
118
96
129136
Female Athletes Male Athletes
200
4
200
8
200
0
199
6
199
2
198
8
198
4
198
0
1976
1972
196
8
196
4
196
0
0
500
1,000
1,500
2,000
2,500
3,000
25Women in the 2000, 2004 and 2008 Olympic and Paralympic Games: An Analysis of Participation, Leadership and Media Opportunities 25
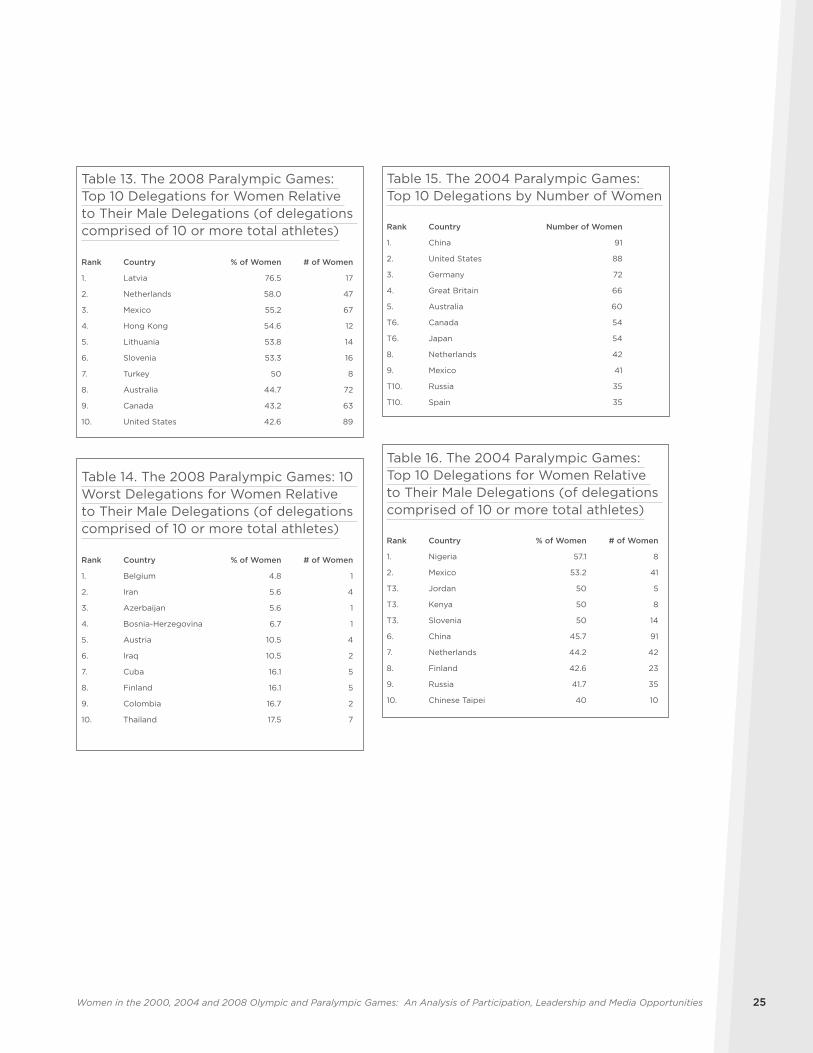
Table 13. The 2008 Paralympic Games: Top 10 Delegations for Women Relative to Their Male Delegations (of delegations comprised of 10 or more total athletes)
Rank Country % of Women # of Women
1. Latvia 76.5 17
2. Netherlands 58.0 47
3. Mexico 55.2 67
4. Hong Kong 54.6 12
5. Lithuania 53.8 14
6. Slovenia 53.3 16
7. Turkey 50 8
8. Australia 44.7 72
9. Canada 43.2 63
10. United States 42.6 89
Table 14. The 2008 Paralympic Games: 10 Worst Delegations for Women Relative to Their Male Delegations (of delegations comprised of 10 or more total athletes)
Rank Country % of Women # of Women
1. Belgium 4.8 1
2. Iran 5.6 4
3. Azerbaijan 5.6 1
4. Bosnia-Herzegovina 6.7 1
5. Austria 10.5 4
6. Iraq 10.5 2
7. Cuba 16.1 5
8. Finland 16.1 5
9. Colombia 16.7 2
10. Thailand 17.5 7
Table 15. The 2004 Paralympic Games: Top 10 Delegations by Number of Women
Rank Country Number of Women
1. China 91
2. United States 88
3. Germany 72
4. Great Britain 66
5. Australia 60
T6. Canada 54
T6. Japan 54
8. Netherlands 42
9. Mexico 41
T10. Russia 35
T10. Spain 35
Table 16. The 2004 Paralympic Games: Top 10 Delegations for Women Relative to Their Male Delegations (of delegations comprised of 10 or more total athletes)
Rank Country % of Women # of Women
1. Nigeria 57.1 8
2. Mexico 53.2 41
T3. Jordan 50 5
T3. Kenya 50 8
T3. Slovenia 50 14
6. China 45.7 91
7. Netherlands 44.2 42
8. Finland 42.6 23
9. Russia 41.7 35
10. Chinese Taipei 40 10
A Women’s Sports Foundation Research Report26 A Women’s Sports Foundation Research Report26
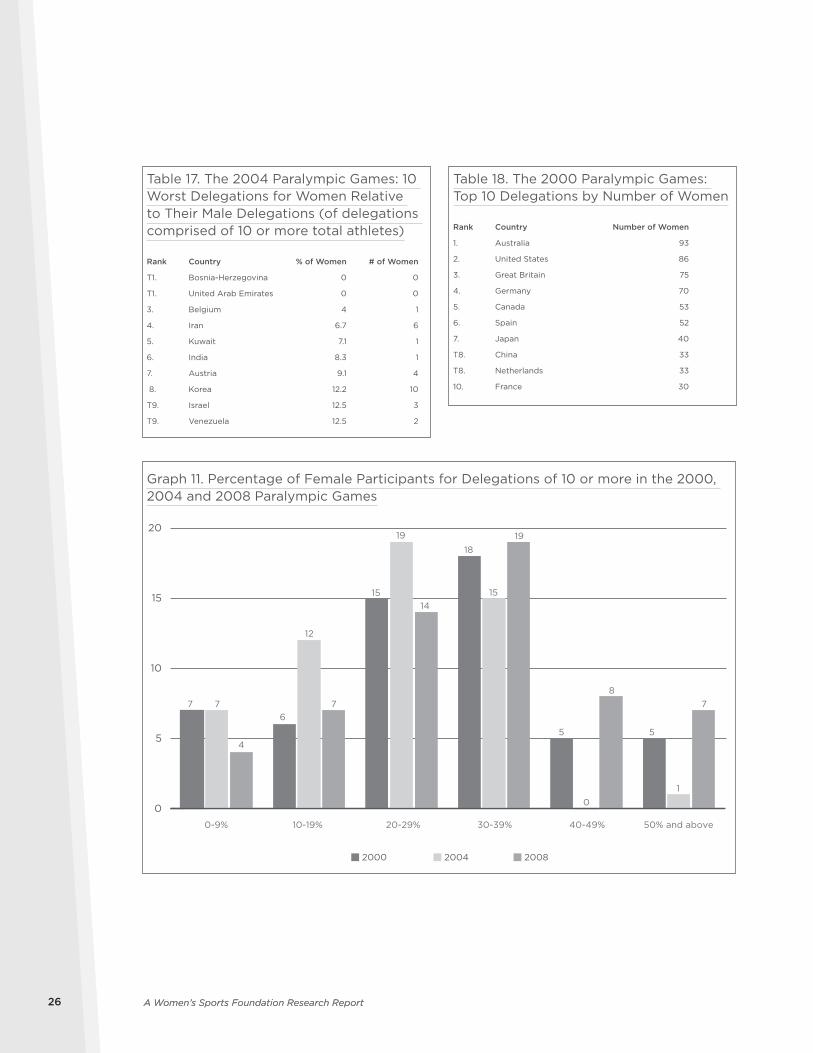
Table 17. The 2004 Paralympic Games: 10 Worst Delegations for Women Relative to Their Male Delegations (of delegations comprised of 10 or more total athletes)
Rank Country % of Women # of Women
T1. Bosnia-Herzegovina 0 0
T1. United Arab Emirates 0 0
3. Belgium 4 1
4. Iran 6.7 6
5. Kuwait 7.1 1
6. India 8.3 1
7. Austria 9.1 4
8. Korea 12.2 10
T9. Israel 12.5 3
T9. Venezuela 12.5 2
Table 18. The 2000 Paralympic Games: Top 10 Delegations by Number of Women
Rank Country Number of Women
1. Australia 93
2. United States 86
3. Great Britain 75
4. Germany 70
5. Canada 53
6. Spain 52
7. Japan 40
T8. China 33
T8. Netherlands 33
10. France 30
Graph 11. Percentage of Female Participants for Delegations of 10 or more in the 2000, 2004 and 2008 Paralympic Games
0
5
10
15
20
0-9% 10-19% 20-29% 30-39% 40-49% 50% and above
7
12
7
4
7
5
6
15
7
19
14
18
15
19
5
0
8
1
2000 2004 2008
27Women in the 2000, 2004 and 2008 Olympic and Paralympic Games: An Analysis of Participation, Leadership and Media Opportunities 27
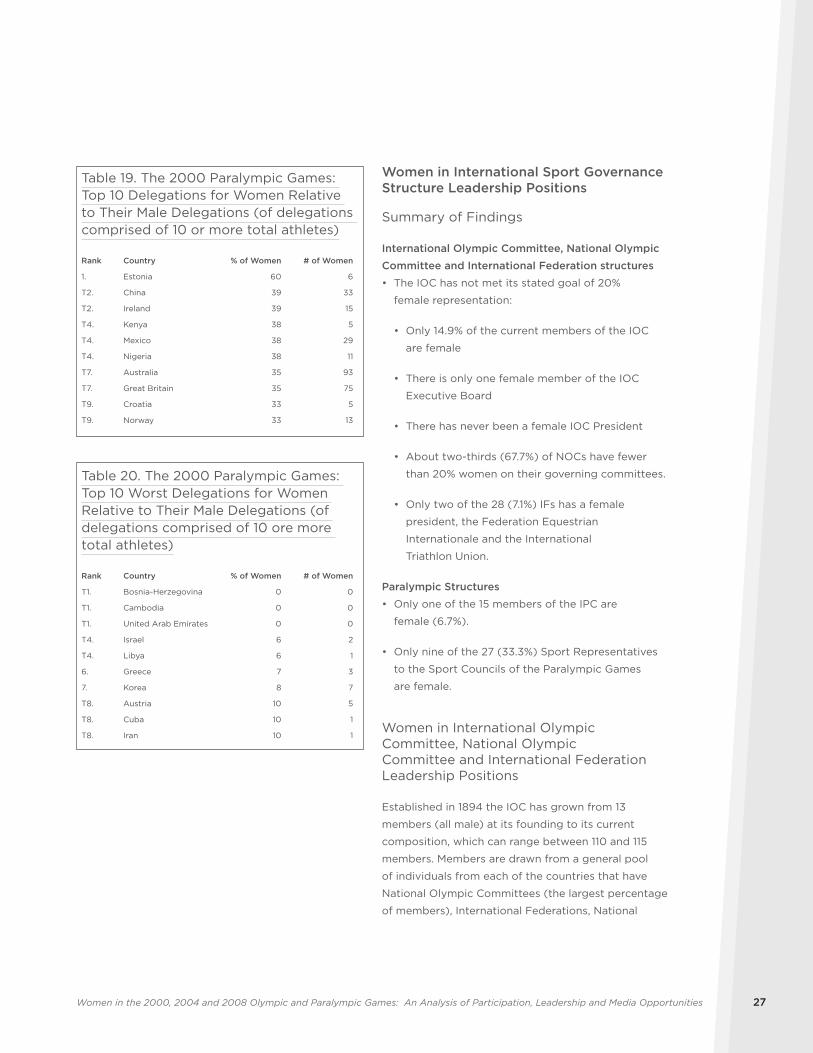
Table 19. The 2000 Paralympic Games: Top 10 Delegations for Women Relative to Their Male Delegations (of delegations comprised of 10 or more total athletes)
Rank Country % of Women # of Women
1. Estonia 60 6
T2. China 39 33
T2. Ireland 39 15
T4. Kenya 38 5
T4. Mexico 38 29
T4. Nigeria 38 11
T7. Australia 35 93
T7. Great Britain 35 75
T9. Croatia 33 5
T9. Norway 33 13
Table 20. The 2000 Paralympic Games: Top 10 Worst Delegations for Women Relative to Their Male Delegations (of delegations comprised of 10 ore more total athletes)
Rank Country % of Women # of Women
T1. Bosnia-Herzegovina 0 0
T1. Cambodia 0 0
T1. United Arab Emirates 0 0
T4. Israel 6 2
T4. Libya 6 1
6. Greece 7 3
7. Korea 8 7
T8. Austria 10 5
T8. Cuba 10 1
T8. Iran 10 1
Women in International Sport Governance Structure Leadership Positions
Summary of Findings
International Olympic Committee, National Olympic
Committee and International Federation structures
• The IOC has not met its stated goal of 20%
female representation:
• Only 14.9% of the current members of the IOC
are female
• There is only one female member of the IOC
Executive Board
• There has never been a female IOC President
• About two-thirds (67.7%) of NOCs have fewer
than 20% women on their governing committees.
• Only two of the 28 (7.1%) IFs has a female
president, the Federation Equestrian
Internationale and the International
Triathlon Union.
Paralympic Structures
• Only one of the 15 members of the IPC are
female (6.7%).
• Only nine of the 27 (33.3%) Sport Representatives
to the Sport Councils of the Paralympic Games
are female.
Women in International Olympic Committee, National Olympic Committee and International Federation Leadership Positions
Established in 1894 the IOC has grown from 13
members (all male) at its founding to its current
composition, which can range between 110 and 115
members. Members are drawn from a general pool
of individuals from each of the countries that have
National Olympic Committees (the largest percentage
of members), International Federations, National

A Women’s Sports Foundation Research Report28 A Women’s Sports Foundation Research Report28
Olympic Committees and active athletes. The IOC
is responsible for all phases of the summer and
winter Games and the maintenance of the Olympic
Movement. Historically women have slowly been
included as members of the IOC. Pirjo Haggman
and Flor Isava-Fonseca were added as members in
1981, and Fonseca was the first woman elected to
the Executive Board in 1990. The first female vice
president was Anita DeFrantz elected in 1997. Gunilla
Lindberg of Sweden was the second woman to be
elected to the vice presidency in 2004.
As of April 2, 2009, there were 107 members of the
IOC. There were an additional 23 honorary members
and one honor member. Sixteen of the 107 members
are women (14.9%). Of the 23 honorary members,
three are women. The lone honor member is male. In
addition, all eight of the IOC presidents have been
male. IOC members are currently required to be re-
elected every eight years. The process brings forth
approximately two dozen members who have been
screened by the Executive Committee, and they are
voted on as a bloc.
The Executive Board of the IOC is presently composed
of the president, four vice presidents and 10 members.
Currently there is only one woman on the Executive
Board: Nawal El Moutawakel of Morocco. There has
never been more than one female member of the
Executive Board at any given time.
IOC Commissions
Today the IOC has become a complex organization
with a multitude of subcommittees and commissions
(Barney, et al, 2002). These are groups that run the
major operations of the IOC. These commissions are
made up of IOC members as well as representatives
from upcoming Games and outside experts. There are
31 IOC Commissions (excluding the Executive Board).
Sixty-five of the 382 positions on commissions are
filled by women (17%) Four of the 31 commissions
meet or exceed the IOC’s stated goal of 20% female
representation. Two of these four are more than 50%
female—the Women and Sport Commission (58%) and
the Athlete’s Commission (56%). Only two of the 31
Commissions are chaired by women; the Women and
Sport Commission (Anita De Frantz) and the 2016 Site
Evaluation Committee (Nawal El Moutawakel).
However, there are some commissions that have
minimal female representation. Thirteen of the
31 commissions have one or no female members
(41.9%), with four commissions having no female
representation (12.9%). A number of the commissions
with very limited, or no, female representation, are
commissions that are potentially the most significant
at this point in Olympic history. For example, there
is little argument that the following six commissions
are important as the Olympic Movement enters the
21st century: TV Rights and New Media, International
Relations, 2009 Olympic Congress Coordination,
Radio and Television, Marketing, and Finance. Of the
71 members of these commissions, only three are
women (4.2%)—and no women are chairs of these
commissions. In fact IOC President Jacques Rogge is
chair of two of these.
Each IOC commission has a staff person who serves
as the “Director.” There is only one female currently
serving as the director of any IOC commission. The
Director General of the IOC is also male.
In an IOC report released in 2007, based on data
provided for the year end 2005, there were 192
National Olympic Committees. These are the groups
that are recognized by the IOC to organize Olympic
teams in their respective countries. Sixty-two of
these 192 (32.3%) have achieved the 20% threshold
of female participation on their executive committees
as established by the IOC; 148 (77.1%) have met the
10% standard, while 182 (94.8%) have at least one
woman involved at the leadership level. This means
that 10 NOCs (5.2%) include no women at all in their
leadership ranks (Women in the Olympic Movement,
2007). There are a total of 24 female presidents
and secretary generals of NOCs (4th IOC World
Conference on Women and Sport, 2008).
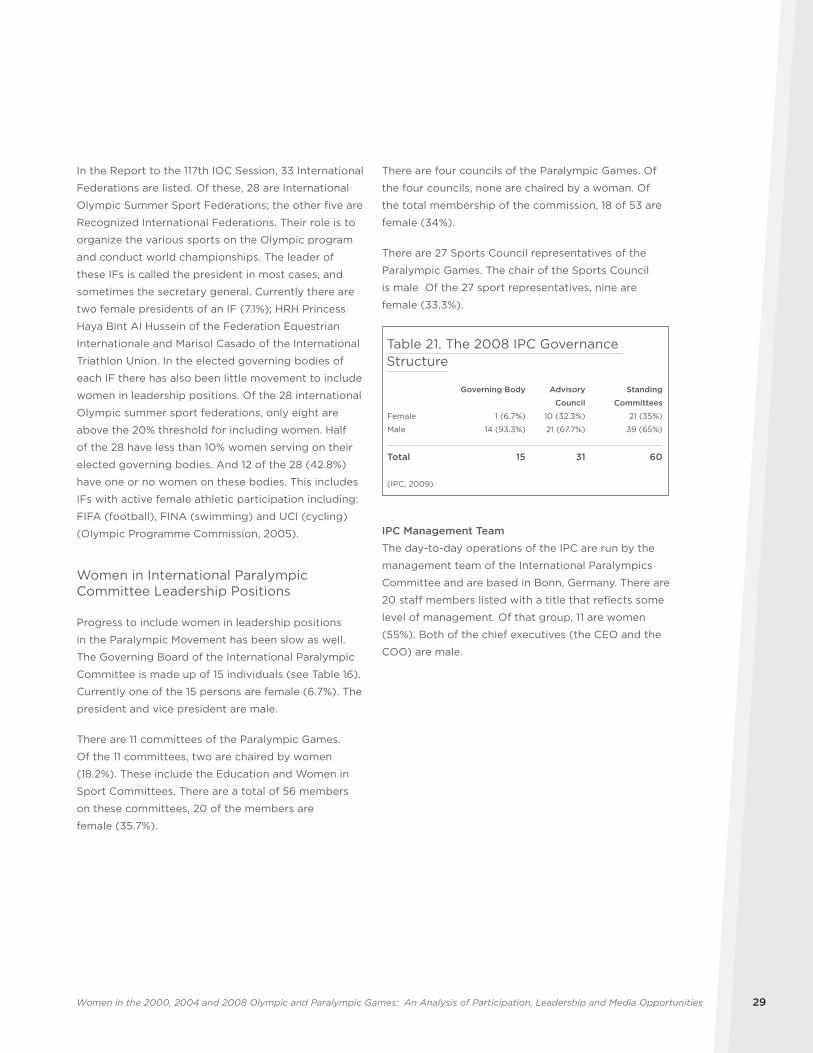
29Women in the 2000, 2004 and 2008 Olympic and Paralympic Games: An Analysis of Participation, Leadership and Media Opportunities 29
In the Report to the 117th IOC Session, 33 International
Federations are listed. Of these, 28 are International
Olympic Summer Sport Federations; the other five are
Recognized International Federations. Their role is to
organize the various sports on the Olympic program
and conduct world championships. The leader of
these IFs is called the president in most cases, and
sometimes the secretary general. Currently there are
two female presidents of an IF (7.1%); HRH Princess
Haya Bint Al Hussein of the Federation Equestrian
Internationale and Marisol Casado of the International
Triathlon Union. In the elected governing bodies of
each IF there has also been little movement to include
women in leadership positions. Of the 28 international
Olympic summer sport federations, only eight are
above the 20% threshold for including women. Half
of the 28 have less than 10% women serving on their
elected governing bodies. And 12 of the 28 (42.8%)
have one or no women on these bodies. This includes
IFs with active female athletic participation including:
FIFA (football), FINA (swimming) and UCI (cycling)
(Olympic Programme Commission, 2005).
Women in International Paralympic Committee Leadership Positions
Progress to include women in leadership positions
in the Paralympic Movement has been slow as well.
The Governing Board of the International Paralympic
Committee is made up of 15 individuals (see Table 16).
Currently one of the 15 persons are female (6.7%). The
president and vice president are male.
There are 11 committees of the Paralympic Games.
Of the 11 committees, two are chaired by women
(18.2%). These include the Education and Women in
Sport Committees. There are a total of 56 members
on these committees, 20 of the members are
female (35.7%).
There are four councils of the Paralympic Games. Of
the four councils, none are chaired by a woman. Of
the total membership of the commission, 18 of 53 are
female (34%).
There are 27 Sports Council representatives of the
Paralympic Games. The chair of the Sports Council
is male Of the 27 sport representatives, nine are
female (33.3%).
Table 21. The 2008 IPC Governance Structure
Governing Body Advisory Standing
Council Committees
Female 1 (6.7%) 10 (32.3%) 21 (35%)
Male 14 (93.3%) 21 (67.7%) 39 (65%)
Total 15 31 60
(IPC, 2009)
IPC Management Team
The day-to-day operations of the IPC are run by the
management team of the International Paralympics
Committee and are based in Bonn, Germany. There are
20 staff members listed with a title that reflects some
level of management. Of that group, 11 are women
(55%). Both of the chief executives (the CEO and the
COO) are male.
A Women’s Sports Foundation Research Report30 A Women’s Sports Foundation Research Report30
United States FindingsUnited States Olympic Committee and U.S. National Sport Governing Body Obligations
Summary of Findings
Currently the USOC is not fully meeting all of its
obligations under the Ted Stevens Olympic and
Amateur and Sports Act. Participation numbers for
women in the Olympic Games has grown to near
equity. However, participation opportunities for female
athletes are much lower than 50% in the Paralympic
Games. Additionally, the chance to serve in leadership
roles is very limited for women in the USOC, USPC,
the NGBs and their various committees. Leadership
opportunities, by and large, have met the 20%
standard set by the IOC; however, they remain well
below 50%.
The Ted Stevens Olympic and Amateur Sports Act (ASA)
“The Amateur Sports Act of 1978 (now the ‘Ted
Stevens Olympic and Amateur Sports Act, 36 U.S.C.
§ 220501, et seq.,’ hereinafter referred to as the
‘Amateur Sports Act’ or ‘ASA’) established the current
governance structure for amateur and Olympic sports
in the United States. The U.S. Olympic Committee
was charged with governing amateur and Olympic
sports. The USOC, in turn, was given the authority to
recognize one National Governing Body to govern
each sport. Each NGB was in turn given the authority
to make rules, choose teams for international
competitions, certify officials, conduct national
championships, and other similar responsibilities.
NGBs were charged with developing their respective
sports from the grassroots level through Olympic level
and are prohibited from discriminating on the basis
of race, color, religion, age, sex or national origin with
regard to participation and leadership opportunities.
Thus, besides providing coverage to elite-level
amateur athletes, the law applies to many amateur
sports organizations, leagues and tournaments played
in cities and towns across the United States. Any
competition sanctioned by an NGB is covered by
this law.
The ASA specifically mandates that the USOC and
the NGBs take measures to address discrimination—
gender, race and disability. Specifically:
1. The USOC must encourage women’s sports and
increased participation of individuals with disabilities
and minorities. Sections 220503 (12) and 220504 (13)
and (14) note that the USOC’s purposes include to
encourage and provide assistance to amateur athletic
activities for women, individuals with disabilities,
and minorities.
2. NGBs must provide equal opportunity. Section
220522 (a) (8) mandates that an amateur sports
organization cannot be recognized as an NGB unless
it ‘provides an equal opportunity to amateur athletes,
coaches, trainers, managers, administrators and
officials to participate in amateur athletic competition,
without discrimination on the basis of race, color,
religion, age, sex or national origin, and with fair
notice and opportunity for a hearing to any amateur
athlete, coach, trainer, manager, administrator or
official before declaring the individual ineligible
to participate.’
3. NGBs must have minorities and women on
their boards. Section 220522 (a) (9) follows the
previous provision, declaring that an amateur sports
organization cannot be recognized as an NGB
unless it ‘is governed by a board of directors or
other governing board whose members are selected
without regard to race, color, religion, national origin
or sex, except that, in sports where there are separate
female and male programs, it provides for reasonable
representation of both males and females on such
board of directors or other governing board.’
4. NGBs must provide equitable support for women
and individuals with disabilities. Sec. 220524(6) states
that a national governing body is under a duty to
‘provide equitable support and encouragement for

31Women in the 2000, 2004 and 2008 Olympic and Paralympic Games: An Analysis of Participation, Leadership and Media Opportunities 31
participation by women where separate programs for
male and female athletes are conducted on a national
basis.’ Section 22054 (7) has a similar requirement for
athletes with disabilities.
5. USOC must report participation data. The USOC
must conduct a quadrennial data collection to gather
baseline participation data and to report on the
participation of women, disabled individuals and
racial minorities. Section 220511 of the ASA requires
as follows:
(a) Submission to the President and Congress—
The USOC shall, on or before the first day of June
2001, and every fourth year thereafter, transmit
simultaneously to the President and to each House of
Congress a detailed report of its operations for the
preceding four years, including:
(1) a complete statement of its receipts and
expenditures;
(2) a comprehensive description of the activities and
accomplishments of the corporation during such four-
year period;
(3) data concerning the participation of women,
disabled individuals, and racial and ethnic minorities
in the amateur athletic activities and administration of
the corporation and national governing bodies; and
(4) a description of the steps taken to encourage
the participation of women, disabled individuals, and
racial minorities in amateur athletic activities.
(b) Availability to the Public—The Corporation shall
make copies of the report available to interested
persons at a reasonable cost.
It should be noted that §§ 220511(a)(1) and (2) are
not new requirements. Since the inception of the Act
in 1978, the USOC has been required to produce an
annual report including a financial statement and
summary of activities and accomplishments. Items
(3) and (4) of this section were new expectations
adopted in 1999 that were to take effect with the 2001
Report to Congress.”5
The USOC Data Report
The USOC is required to provide data of its progress
on gender, race and disability in participation and
leadership settings. The 2000 and 2004 data has
been released in a limited manner.
Comparison of 2000, 2004 and 2008 Olympic and Paralympic United States Female and Male Athlete Participation
Summary of Findings:
Olympic Games 2008 A 2004 B 2000 B- • There were 286 (48%) women and 310 (52%) men
in 2008.
• There were 255 women (47.8%) and 279 men
(52.2%) in 2004, compared with 253 women
(43.2%) and 333 men (56.8%) in 2000.
• Despite bringing one of the largest female
delegations, the U.S. participation numbers
fall short of 50%, a target met by several other
participating NOCs.
Paralympic Games 2008 B 2004 D 2000 D+• In 2008, 89 (43%) female athletes and 118 (57%)
male athletes from the United States competed in
the Paralympic Games.
• There were 88 women (37.1%) and 149 men (62.9%)
in 2004, compared with 86 women (32.2%) and 181
men (67.8%) in 2000.
5 The background on The Ted Stevens Olympic and Amateur Sports Act taken directly from: Zurn, L.; Lopiano, D.; and Snyder, M. (2006), p. 19-20.

A Women’s Sports Foundation Research Report32 A Women’s Sports Foundation Research Report32
• Despite bringing one of the largest female
delegations, the U.S. participation numbers
fell far below 50%, a target met by only five
participating NPCs.
The 2000, 2004 and 2008 Olympic Games United States Participation
Female and male participation rates for U.S. athletes
in 2008 continued to close toward equity, with male
athletes enjoying a slight edge (see Graph 12).
Graph 12. U.S. Female and Male Representation in the 2000, 2004 and 2008 Olympic Games
Grade for U.S. Olympic Team, 2008: 48% = 2 points
below equity = A
The 2008 U.S. Olympic team was comprised of
286 female athletes (48%) and 310 male athletes
(52%) for a total of 596. The 2004 Olympic team
had 255 females (47.8%) and 279 males (52.2%)
for a total of 534 American athletes. Several sports
and disciplines remain equitable: basketball, beach
and indoor volleyball, artistic gymnastics, modern
pentathlon, taekwondo and triathlon. Female athletes
enjoyed increased participation in the following
sports: athletics, badminton, canoe/kayaking, cycling,
equestrian, fencing, rowing, diving, table tennis, tennis,
weightlifting and wrestling. Some of these increases
in participation come with the addition of only two
females. For instance, in the sport of badminton, in
2004 no females were on the team. In 2008 there
were two females on the five-person team, accounting
for 40% of the roster. One significant increase comes
in the sport of weightlifting. Women outnumbered
men four-to-two on the 2008 roster, in a sport that
only began including women at the 2000 Games (see
Tables 22 and 23).
Female athletes competed at a lower percentage than
2004 in the following sports and disciplines: archery,
football, trampoline, judo, shooting and swimming.
However, it must be noted that the decrease in
percentage of female footballers is a result of the
men’s team qualifying; so in 2004 females accounted
for 100% of U.S. football athletes, while at the 2008
Games, females accounted for 50% of the American
football athletes. This is the same for trampoline.
It was proposed in 2005 that baseball and softball be
eliminated from the Olympic program, and neither
sport will be included in the London 2012 program
(Michaelis, 2009; Zinser, 2009). None of the five new
sports proposed (rugby, golf, squash, karate and roller
sports) earned enough votes to replace baseball and
softball. The elimination of the two sports marks the
first time since 1936 that the Olympic Games have
cut a sport (polo). In August 2009, eight sports
(baseball, softball, squash, roller sports, rugby, golf,
0
50
100
150
200
250
300
350
2000 2004
Female Athletes Male Athletes
253
333
255279
2008
286310

33Women in the 2000, 2004 and 2008 Olympic and Paralympic Games: An Analysis of Participation, Leadership and Media Opportunities 33
Olympic competition. Factors that contributed to
the near-equal participation of female and male
American athletes include the women’s field hockey
team qualifying for the first time since 1996, adding
16 unmatched roster spots (the men’s team did not
qualify). Similarly, the men’s football team qualified
after not competing in the 2004 Games, adding 18
male athletes to match with the 18 female football
athletes. Boxing and Greco-Roman wrestling still
account for unmatched opportunities for female
athletes (as does synchronized swimming for male
athletes; the nine females in that sport match the
nine male athletes in boxing, leaving Greco-Roman
wrestling, the only male opportunity not matched by a
female opportunity).
The U.S. Olympic team continues to send a
competitive team that includes a significant
percentage of female athletes and should be
commended for continuing the support of female
and male athletes. Though the American team did
not boast the highest number or highest percentage
of female athletes at the 2008 Games, it did rank
second in numbers, and its 48% female participation
continues to climb closer to equity.
women’s boxing and karate) were candidates for
admission into the Olympic program. Only women’s
boxing was approved, with rugby and golf earning
a recommendation from the IOC Executive Board. A
total of 36 female boxers in three weight classes will
compete in the 2012 Games. Men’s boxing will have
competition in 10 weight classes, cutting one weight
class from their program (Clarey, 2009).
The elimination of the baseball roster of 24 male
athletes and the softball roster of 15 athletes, with
the addition of 36 female boxers, and reduction of
12 male boxers, will boost female participation by a
percentage point. This is hardly the means to increase
female participation; by cutting more men’s spots than
women’s. Moreover, new sports and disciplines should
offer equitable opportunities. At this year’s upcoming
Games, BMX will be introduced in the sport of cycling,
yet the number of male and female competitors, at
least for the U.S. team, are not equal (one female,
three males).
It should be noted that the percentage of female
and male athletes on the U.S. roster is always
contingent on the success of teams to qualify for

A Women’s Sports Foundation Research Report34 A Women’s Sports Foundation Research Report34
Table 22. U.S. Olympic Team Totals, 2008
Sport Female Male Totals % of Female Athletes % change from 2004
Archery 2 3 5 40% -10%
Athletics 63 63 126 50% +2.5%
Badminton 2 3 5 40% +40%
Baseball 0 24 24 0% N/A
Basketball 12 12 24 50% No change
Beach Volleyball 4 4 8 50% No change
Boxing 0 9 9 0% N/A
Canoe/Kayaking
-Flatwater 1 1 2 50% +13.6%
-Slalom 1 4 5 20% +3%
Cycling
-Mountain 2 2 4 50% +16.7%
-Road 3 5 8 37.5% No change
-Track 2 6 8 25% +3.6%
-BMX 1 3 4 25% New sport
Equestrian 8 4 12 66.7% +20.8%
Fencing 7 5 12 58.3% +22.6%
Football 18 18 36 50% -50%
Gymnastics
-Artistic 6 6 12 50% No change
-Rhythmic 0 0 0 -100%
-Trampoline 1 1 2 50% -50%
Handball 0 0 0 N/A
Hockey 16 0 16 100% 100%
Judo 3 7 10 30% -11.7%
Modern Pentathlon 2 2 4 50% No change
Rowing 19 26 45 42.2% +2.7%
Sailing 7 11 18 38.9% No change
Shooting 8 14 22 36.4% -6.4%
Softball 15 0 15 100% N/A
Swimming
-Diving 7 5 12 58.3% +12.8%
-Synchronized Swimming 9 0 9 100% N/A
-Swimming 22 22 44 50% -1.2%
-Water Polo 13 13 26 50% No change
Table Tennis 3 1 4 75% +17.9%
Taekwondo 2 2 4 50% No change
Tennis 4 5 9 44.4% +4.4%
Triathlon 3 3 6 50% No change
Volleyball 12 12 24 50% No change
Weightlifting 4 2 6 66.7% +27%
Wrestling 4 12 16 25% +1.5%
Totals 286 310 596 48% +.25%
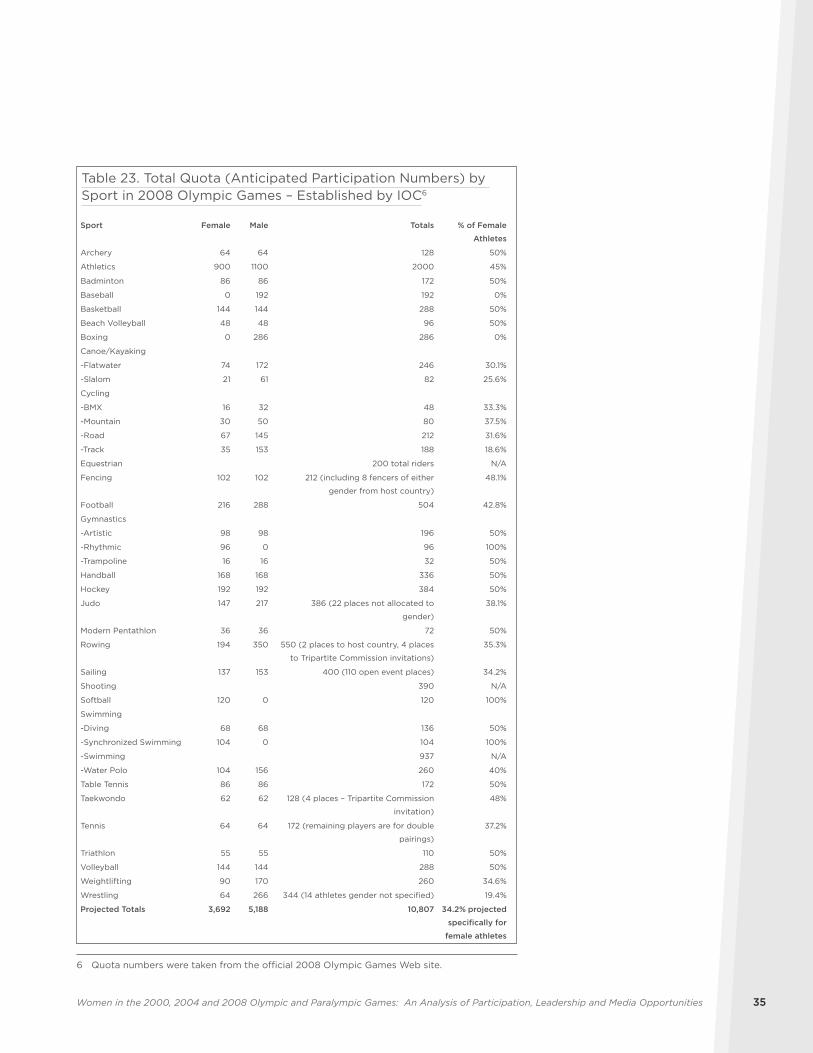
35Women in the 2000, 2004 and 2008 Olympic and Paralympic Games: An Analysis of Participation, Leadership and Media Opportunities 35
Table 23. Total Quota (Anticipated Participation Numbers) by Sport in 2008 Olympic Games – Established by IOC6
Sport Female Male Totals % of Female
Athletes
Archery 64 64 128 50%
Athletics 900 1100 2000 45%
Badminton 86 86 172 50%
Baseball 0 192 192 0%
Basketball 144 144 288 50%
Beach Volleyball 48 48 96 50%
Boxing 0 286 286 0%
Canoe/Kayaking
-Flatwater 74 172 246 30.1%
-Slalom 21 61 82 25.6%
Cycling
-BMX 16 32 48 33.3%
-Mountain 30 50 80 37.5%
-Road 67 145 212 31.6%
-Track 35 153 188 18.6%
Equestrian 200 total riders N/A
Fencing 102 102 212 (including 8 fencers of either
gender from host country)
48.1%
Football 216 288 504 42.8%
Gymnastics
-Artistic 98 98 196 50%
-Rhythmic 96 0 96 100%
-Trampoline 16 16 32 50%
Handball 168 168 336 50%
Hockey 192 192 384 50%
Judo 147 217 386 (22 places not allocated to
gender)
38.1%
Modern Pentathlon 36 36 72 50%
Rowing 194 350 550 (2 places to host country, 4 places
to Tripartite Commission invitations)
35.3%
Sailing 137 153 400 (110 open event places) 34.2%
Shooting 390 N/A
Softball 120 0 120 100%
Swimming
-Diving 68 68 136 50%
-Synchronized Swimming 104 0 104 100%
-Swimming 937 N/A
-Water Polo 104 156 260 40%
Table Tennis 86 86 172 50%
Taekwondo 62 62 128 (4 places – Tripartite Commission
invitation)
48%
Tennis 64 64 172 (remaining players are for double
pairings)
37.2%
Triathlon 55 55 110 50%
Volleyball 144 144 288 50%
Weightlifting 90 170 260 34.6%
Wrestling 64 266 344 (14 athletes gender not specified) 19.4%
Projected Totals 3,692 5,188 10,807 34.2% projected
specifically for
female athletes
6 Quota numbers were taken from the official 2008 Olympic Games Web site.

A Women’s Sports Foundation Research Report36 A Women’s Sports Foundation Research Report36
The 2000, 2004 and 2008 Paralympic Games, United States Participation
Despite the increase of female participants in the
Paralympic Games in 2004 (see Graph 13), inequities
persisted in a number of sports (see Table 25 on
following page). An equal number of American
female and male Paralympians participated in three
sports: goalball, volleyball and wheelchair basketball.
In only two sports, equestrian and swimming, did
females enjoy a greater participation than their male
counterparts. Less than 25% females participated for
the United States in archery, athletics, boccia, cycling,
judo, sailing, shooting and wheelchair rugby.
Graph 13. Female and Male Athletes Represented on the U.S. Paralympic Team in 2000, 2004 and 2008
Table 24. U.S. Olympic Representation by Sport in 2004
Sport Female Male Totals % Female
Athletes
Archery 3 3 6 50%
Athletics 57 62 119 47.9%
Badminton 0 2 2 0%
Basketball 12 12 24 50%
Boxing 0 9 9 0%
Canoe/Kayaking 5 12 17 29.4%
Cycling 6 12 18 33.3%
Diving 5 6 11 45.5%
Equestrian 6 7 13 46.2%
Fencing 5 9 14 35.7%
Football 18 0 18 100%
Gymnastics 8 6 14 57.1%
Judo 5 7 12 41.7%
Modern Pentathlon 2 2 4 50%
Rowing 18 27 45 40%
Sailing 7 11 18 38.9%
Shooting 9 12 21 42.8%
Softball 15 0 15 100%
Swimming 22 21 43 51.2%
Synchronized
Swimming
9 0 9 100%
Table Tennis 4 3 7 57.1%
Taekwondo 1 1 2 50%
Tennis 4 6 10 40%
Triathlon 3 3 6 50%
Volleyball 16 16 32 50%
Water Polo 13 13 26 50%
Weightlifting 2 3 5 40%
Wrestling 4 13 17 23.5%
Totals 259 278 537 48.2%
0
50
100
150
200
2000 2004
Female Athletes Male Athletes
86
181
88
149
2008
89120

37Women in the 2000, 2004 and 2008 Olympic and Paralympic Games: An Analysis of Participation, Leadership and Media Opportunities 37
Table 25. U.S. Paralympic Representation by Sport in 2004
Sport Female Male Totals % Female
Athletes
Archery 1 4 5 20%
Athletics 10 32 42 23.8%
Boccia 0 3 3 0%
Cycling 4 14 18 22.2%
Equestrian 3 1 4 75%
Football 7-a-side 0 12 12 0%
Goalball 6 6 12 50%
Judo 1 5 6 16.7%
Powerlifting 1 2 3 33.3%
Sailing 0 4 4 0%
Shooting 0 1 1 0%
Swimming 29 16 45 64.4%
Table Tennis 1 2 3 33.3%
Volleyball 12 12 24 50%
Wheelchair
Basketball
12 12 24 50%
Wheelchair Fencing 3 5 8 37.5%
Wheelchair Rugby 1 11 12 8.3%
Wheelchair Tennis 4 7 11 36.4%
Totals 88 149 237 37.1%
Grade for U.S. Paralympic Team 2008: 43% = 7 points
below equity = BThe 2008 U.S. Paralympic Team was comprised of
89 female athletes (42.6%) and 120 male athletes
(57.4%) for a total of 209 American Paralympians.
Compared with the 2004 roster, there was actually
only one additional female and 31 fewer male
athletes, accounting for the almost 6% increase
in female participation for the 2008 Paralympic
Games. Notable shifts in participation occurred in
athletics, in which female athletes enjoyed a nearly
17% increase in their participation (both as a result of
more women competing and less men competing).
Cycling increased female participation by 28% by
adding two additional females (unfortunately this
increase also occurred because there were eight
fewer male competitors). Shooting increased women’s
participation by having one female qualify for the
Games. In 2008, a women’s volleyball team competed,
but a men’s team did not (accounting for the 100%
participation of females). In the new sport of rowing,
female and male participation was equal; this is to
be commended and should serve as a model for new
sports in the Paralympic Games. Drops in percentage
of participation for female Paralympians were noted in
swimming, with 11 fewer female swimmers competing
in the Paralympic Games. Wheelchair fencing also
experienced a loss in participation with two fewer
female athletes on the roster (see Table 26).
Overall, the U.S. Paralympic team’s gender
participation has improved with regard to female
participation, with 42.6% of the roster being women.
However, this increase in percentage was more a
result of fewer male participants rather than an effort
to increase the actual number of female athletes,
with only two additional females on the 2008 roster
compared to the 2004 totals.
Table 26. U.S. Paralympic Team Totals, 2008
Sport Female Male Totals % Female
Athletes
Archery 1 7 8 12.5%
Athletics 17 26 43 39.5%
Boccia 0 1 1 0%
Cycling 6 7 13 46.2%
Equestrian 4 1 5 80%
Football 7-a-side 0 0 0
Goalball 6 6 12 50%
Judo 1 4 5 20%
Powerlifting 1 1 2 50%
Rowing 5 4 9 55.6%
Sailing 1 5 6 16.7%
Shooting 1 1 2 50%
Swimming 18 23 41 43.9%
Table Tennis 1 3 4 25%
Volleyball 12 0 12 100%
Wheelchair
Basketball
12 12 24 50%
Wheelchair Fencing 1 4 5 20%
Wheelchair Rugby 0 11 11 0%
Wheelchair Tennis 2 7 9 22.2%
Totals 89 120 209 42.6%
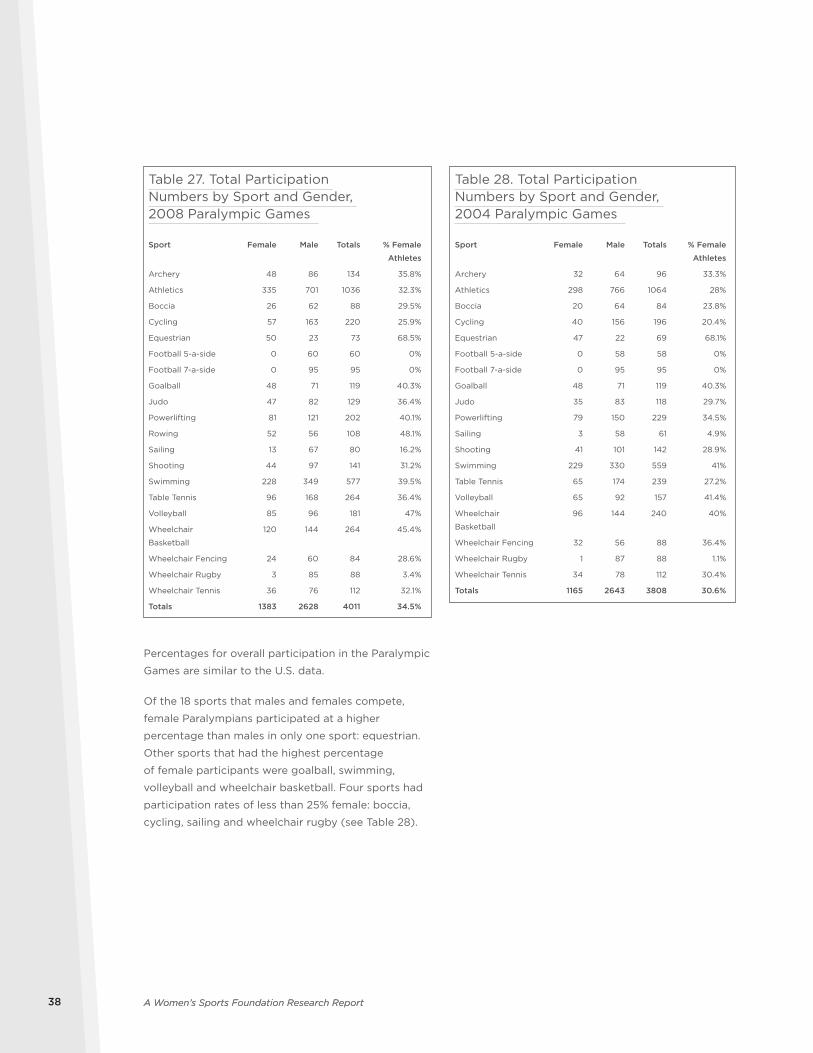
A Women’s Sports Foundation Research Report38 A Women’s Sports Foundation Research Report38
Table 27. Total Participation Numbers by Sport and Gender, 2008 Paralympic Games
Sport Female Male Totals % Female
Athletes
Archery 48 86 134 35.8%
Athletics 335 701 1036 32.3%
Boccia 26 62 88 29.5%
Cycling 57 163 220 25.9%
Equestrian 50 23 73 68.5%
Football 5-a-side 0 60 60 0%
Football 7-a-side 0 95 95 0%
Goalball 48 71 119 40.3%
Judo 47 82 129 36.4%
Powerlifting 81 121 202 40.1%
Rowing 52 56 108 48.1%
Sailing 13 67 80 16.2%
Shooting 44 97 141 31.2%
Swimming 228 349 577 39.5%
Table Tennis 96 168 264 36.4%
Volleyball 85 96 181 47%
Wheelchair
Basketball
120 144 264 45.4%
Wheelchair Fencing 24 60 84 28.6%
Wheelchair Rugby 3 85 88 3.4%
Wheelchair Tennis 36 76 112 32.1%
Totals 1383 2628 4011 34.5%
Percentages for overall participation in the Paralympic
Games are similar to the U.S. data.
Of the 18 sports that males and females compete,
female Paralympians participated at a higher
percentage than males in only one sport: equestrian.
Other sports that had the highest percentage
of female participants were goalball, swimming,
volleyball and wheelchair basketball. Four sports had
participation rates of less than 25% female: boccia,
cycling, sailing and wheelchair rugby (see Table 28).
Table 28. Total Participation Numbers by Sport and Gender, 2004 Paralympic Games
Sport Female Male Totals % Female
Athletes
Archery 32 64 96 33.3%
Athletics 298 766 1064 28%
Boccia 20 64 84 23.8%
Cycling 40 156 196 20.4%
Equestrian 47 22 69 68.1%
Football 5-a-side 0 58 58 0%
Football 7-a-side 0 95 95 0%
Goalball 48 71 119 40.3%
Judo 35 83 118 29.7%
Powerlifting 79 150 229 34.5%
Sailing 3 58 61 4.9%
Shooting 41 101 142 28.9%
Swimming 229 330 559 41%
Table Tennis 65 174 239 27.2%
Volleyball 65 92 157 41.4%
Wheelchair
Basketball
96 144 240 40%
Wheelchair Fencing 32 56 88 36.4%
Wheelchair Rugby 1 87 88 1.1%
Wheelchair Tennis 34 78 112 30.4%
Totals 1165 2643 3808 30.6%
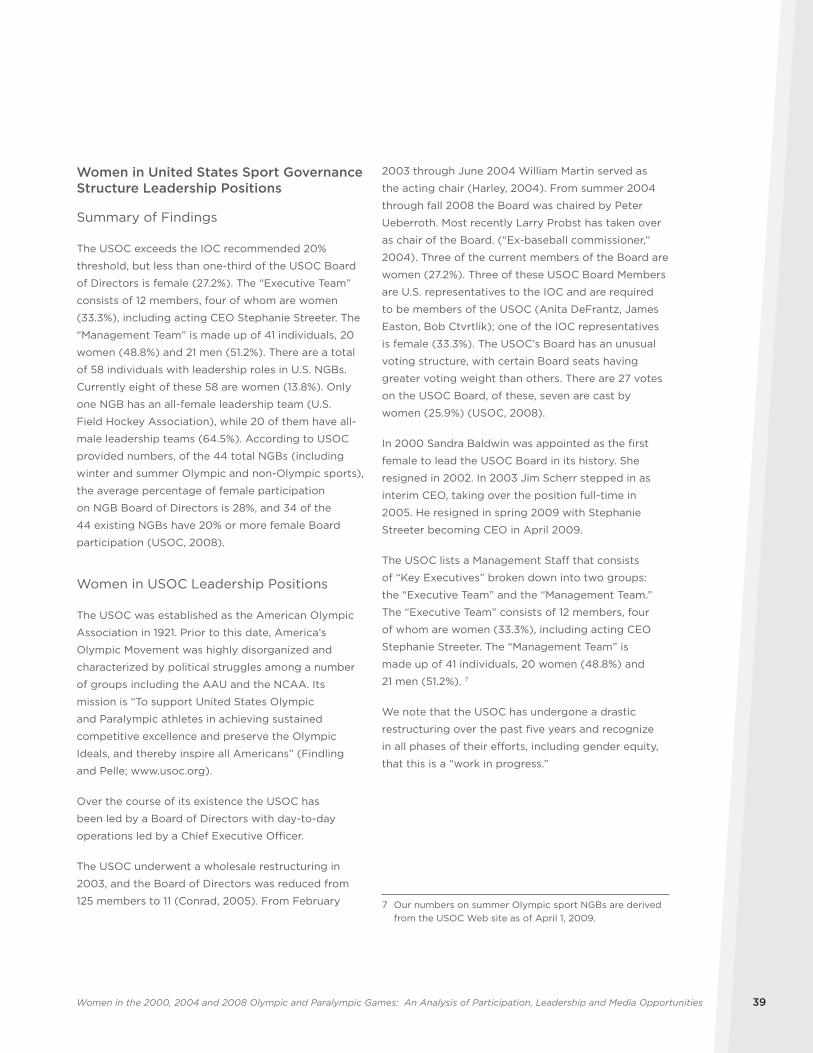
39Women in the 2000, 2004 and 2008 Olympic and Paralympic Games: An Analysis of Participation, Leadership and Media Opportunities 39
Women in United States Sport Governance Structure Leadership Positions
Summary of Findings
The USOC exceeds the IOC recommended 20%
threshold, but less than one-third of the USOC Board
of Directors is female (27.2%). The “Executive Team”
consists of 12 members, four of whom are women
(33.3%), including acting CEO Stephanie Streeter. The
“Management Team” is made up of 41 individuals, 20
women (48.8%) and 21 men (51.2%). There are a total
of 58 individuals with leadership roles in U.S. NGBs.
Currently eight of these 58 are women (13.8%). Only
one NGB has an all-female leadership team (U.S.
Field Hockey Association), while 20 of them have all-
male leadership teams (64.5%). According to USOC
provided numbers, of the 44 total NGBs (including
winter and summer Olympic and non-Olympic sports),
the average percentage of female participation
on NGB Board of Directors is 28%, and 34 of the
44 existing NGBs have 20% or more female Board
participation (USOC, 2008).
Women in USOC Leadership Positions
The USOC was established as the American Olympic
Association in 1921. Prior to this date, America’s
Olympic Movement was highly disorganized and
characterized by political struggles among a number
of groups including the AAU and the NCAA. Its
mission is “To support United States Olympic
and Paralympic athletes in achieving sustained
competitive excellence and preserve the Olympic
Ideals, and thereby inspire all Americans” (Findling
and Pelle; www.usoc.org).
Over the course of its existence the USOC has
been led by a Board of Directors with day-to-day
operations led by a Chief Executive Officer.
The USOC underwent a wholesale restructuring in
2003, and the Board of Directors was reduced from
125 members to 11 (Conrad, 2005). From February
2003 through June 2004 William Martin served as
the acting chair (Harley, 2004). From summer 2004
through fall 2008 the Board was chaired by Peter
Ueberroth. Most recently Larry Probst has taken over
as chair of the Board. (“Ex-baseball commissioner,”
2004). Three of the current members of the Board are
women (27.2%). Three of these USOC Board Members
are U.S. representatives to the IOC and are required
to be members of the USOC (Anita DeFrantz, James
Easton, Bob Ctvrtlik); one of the IOC representatives
is female (33.3%). The USOC’s Board has an unusual
voting structure, with certain Board seats having
greater voting weight than others. There are 27 votes
on the USOC Board, of these, seven are cast by
women (25.9%) (USOC, 2008).
In 2000 Sandra Baldwin was appointed as the first
female to lead the USOC Board in its history. She
resigned in 2002. In 2003 Jim Scherr stepped in as
interim CEO, taking over the position full-time in
2005. He resigned in spring 2009 with Stephanie
Streeter becoming CEO in April 2009.
The USOC lists a Management Staff that consists
of “Key Executives” broken down into two groups:
the “Executive Team” and the “Management Team.”
The “Executive Team” consists of 12 members, four
of whom are women (33.3%), including acting CEO
Stephanie Streeter. The “Management Team” is
made up of 41 individuals, 20 women (48.8%) and
21 men (51.2%). 7
We note that the USOC has undergone a drastic
restructuring over the past five years and recognize
in all phases of their efforts, including gender equity,
that this is a “work in progress.”
7 Our numbers on summer Olympic sport NGBs are derived from the USOC Web site as of April 1, 2009.

A Women’s Sports Foundation Research Report40 A Women’s Sports Foundation Research Report40
Women in NGB Leadership Positions
Every IF has a parallel NGB in each country. There
are 31 total summer sport NGBs in the United States.
(There is a discrepancy in the number of IFs vs. NGBs
in the United States because some IFs are an umbrella
organization for more than one sport that the United
States separates out into multiple NGBs. For example
the Federation Internationale de Natation Amateur
(FINA) oversees swimming, diving and synchronized
swimming at the international level. In the United
States there are three separate NGBs, one for each
sport). The U.S. NGBs are typically headed by two
people, a president and an executive director (some
groups use different titles for these people, like CEO
or chairman or manager). Four of the NGBs currently
have open positions for President or CEO. Thus there
are a total of 58 individuals with leadership roles in
U.S. NGBs. Currently eight of these 58 are women
(13.8%). Only one NGB has an all-female leadership
team (U.S. Field Hockey Association), while 20 of
them have all-male leadership teams (64.5%).
Women in U.S. Paralympic Committee Leadership Positions
There is no distinct Board of Directors for the USPC;
it is a division of the USOC. There are two members
(both male) who are listed as USOC ”Key Executives,”
the Chief of U.S. Paralympics and the Managing
Director of U.S. Paralympics. As of 2008 the total U.S.
Paralympics staff numbered 20 individuals. Again, the
top two administrative positions are held by males.
Eleven of the 20 total staff positions are held by
women (55%) (USOC, 2008).
41Women in the 2000, 2004 and 2008 Olympic and Paralympic Games: An Analysis of Participation, Leadership and Media Opportunities 41
primetime hours. The next day the broadcast was
viewed, and the gender of the athletic performers
or the announcers was coded. Time was kept on
“DVR” time, thus there were slight overlaps between
commercials and competition broadcasts. In essence
the numbers have a 2-3% margin of error.
Three newspapers were analyzed: USA Today, the
New York Times and the Los Angeles Times. For each
newspaper, articles in the sports section only were
analyzed for size (total inches).
Four sports/news Web sites were analyzed:
ESPN.com, foxsports.com, Xinhua.com and
NBCOlympics.com. The fluid nature of the Internet
makes it extremely difficult to get exact numbers,
thus, only general trends will be cited for Web sites.
Each site was viewed within the same time frame on
each day. The number of articles on the main page,
as well as the Olympic specific page, was counted
for gender.
ResultsNBC Primetime Coverage
Out of approximately 65 hours of primetime
competition coverage (the Opening and Closing
Ceremonies were excluded from analysis) female
athletes received approximately 21½ hours while male
competitors received approximately 24½ hours of
coverage. Female announcers (the person/people
in the main studio, not field announcers) received
approximately ½ hour of total air time and male
announcers received 2½ hours. During the first week
of the Games women and men received virtually
identical coverage of slightly more than 12 hours
each. During the second week of the Games, however,
women’s coverage decreased to 9½ hours while
men’s coverage remained stable at approximately 12½
hours. Female announcers received approximately
20 minutes of studio air time during the first
week of the Games and approximately 10 minutes
during the second week. Male announcers received
approximately 1 hour and 20 minutes of studio air time
during the first week of the Games and approximately
1 hour and 10 minutes during the second week.
Media Analysis 2008 Olympic GamesIntroductionTotal U.S. viewership numbers for the 2008 Olympic
Games were the highest in history with 211 million
viewers over the course of 16 days on all of the
networks of NBC Universal. The average viewership on
the NBC primetime coverage was 27.7 million (Around
the Rings, 2008; NBC Universal Media Village, 2008).
For this study an analysis was conducted of NBC’s
primetime Olympic coverage, three daily newspapers
and four Web sites devoted to sports or the Olympic
Games. For NBC TV, this included only the time that
was scheduled for the “prime” hours beginning at
7 p.m. or 8 p.m. each evening and ending at either
11 p.m. or 12 a.m. When the broadcast ran over its
scheduled time, data was not included. This analysis
also does not include any of the daytime or overnight
coverage on NBC nor does it examine the coverage
on a variety of the other NBC “family” of networks
(Universal, USA, Telemundo, MSNBC, CNBC, Oxygen)
(“NBC Universal Presents,” 2008). This is a somewhat
limited picture of the entirety of the television
coverage. The 2004 Games’ NBC primetime coverage
only comprised 6% of the overall 1,200 hours of
coverage. For the 2002 Winter Games in Torino, the
primetime coverage on NBC was 16% of the 418 hours
telecast (Billings, 2007, 2008).
MethodPrevious analyses of this type have been conducted
using VCR time counters and stop watches; usually
using several coders with checks for inter-rater
reliability (Billings, 2008; Tuggle, Huffman, &
Rosengard, 2002). This typically results in at least a
two- to three-year lag from the time the Games are
concluded to when the research based on the Games
is published. In addition many studies have analyzed
the verbal content of the coverage as well (Higgs,
Weiller, & Martin, 2003; Billings & Angelini, 2007).
In order to produce a more rapid analysis, while still
providing the most accurate data possible, each
evening’s broadcast was taped utilizing a DVR system.
The DVR was set to record only during the scheduled
A Women’s Sports Foundation Research Report42 A Women’s Sports Foundation Research Report42
FoxSports.com
Approximately 50% of the stories on the
FoxSports.com main page and main Olympic page
were about male athletes. Thirty-five percent were
about female athletes, while the remainder was about
both males and females together. Data was collected
each morning.
Xinhuanet.com
Xinhuanet.com was the host wire services designated
by IOC and was published in English. Each evening
stories were counted. Stories about male athletes
accounted for approximately 42-45% of the coverage
as did stories about female athletes. Stories about
male and female athletes together made up the rest of
the coverage (approximately 13% of the coverage).
DiscussionIt should come as no surprise that NBC primetime
coverage for the Games focused on diving, swimming,
track and field and gymnastics. As previous studies
have shown, these are the sports that receive the most
airtime (Billings, 2007; Billings & Angelini, 2007).
Women’s beach volleyball received an inordinate
amount of coverage in the 2008 Games, in large
measure a result of the American duo of May-Treanor
and Walsh, who captured their second gold medal in
the event in as many Games. Men’s indoor volleyball
received a great deal of exposure due to the success
of the U.S. men’s team as well as the tragedy that
involved the family of the American coach.
Week 1 (eight days of competition) coverage for men
and women was virtually identical for men and women
(743 minutes for men, 740 minutes for women). This
was despite the focus on Michael Phelps and his
unprecedented quest for eight gold medals. The only
other male sports covered in any depth were: men’s
diving, men’s gymnastics and men’s beach volleyball.
Track and field received limited coverage as it was just
starting out, as did men’s indoor volleyball. The vast
majority of coverage on women’s sports in the first
week of the Games was on women’s gymnastics and
the American beach volleyball duo of May-Treanor
USA Today
In general coverage focused on individual star
accomplishments rather than team ones. Michael
Phelps dominated the coverage, even after his
competitions ended. Women’s gymnastics, with a
focus on Nastia Liukin and Shawn Johnson was also
heavily covered. Other sports were presented, but
with much less detail. U.S. basketball player Kobe
Bryant, Jamaican track star Usain Bolt and U.S. beach
volleyball duo Misty May-Treanor/Kerri Walsh also
received some solo reporting.
Los Angeles Times
The majority of the coverage was for male athletes
(50%), although females did receive extensive
coverage (approximately 35% of the coverage), with
the rest devoted to articles about both male and
female athletes.
New York Times
The majority of the coverage was for male athletes
(approximately 55%), although females did receive
extensive coverage (approximately 25% of the
coverage), with the rest devoted to articles about
both male and female athletes (almost 20% of the
written coverage).
ESPN.com
Overall male athletes received more coverage then
female athletes. Men were covered in approximately
55-60% of the articles on the main and Olympic
pages, while women received approximately 28-30%
of the coverage. The remaining coverage focused on
male and female athletes simultaneously. Data was
collected each morning.
NBCOlympics.com
The coverage on the main NBC sports page and
the NBC Olympics page presented a majority
of the articles with stories about male athletes
(approximately 55%). Women received about 30%
of the coverage with stories about male and female
athletes together receiving the remainder of the
coverage. Data was collected each morning.

43Women in the 2000, 2004 and 2008 Olympic and Paralympic Games: An Analysis of Participation, Leadership and Media Opportunities 43
New York Times
During the dates of competition, there were 12 articles
published in the New York Times. Oscar Pistorius,
a track and field athlete from South Africa, was the
subject in four of the 12 articles, covering his three
gold medal wins in the sprint events. Pistorius had
unsuccessfully challenged to compete in the Olympic
Games. Pistorius’s teammate, swimming Natalie du
Toit, was the subject of two articles for her five gold
medals (although all five wins were not covered with
separate articles). Making du Toit’s victories worthy
of coverage seemed to be her participation in the
Olympic Games weeks prior. Another athlete of note
was Esther Vergeer, who won gold in wheelchair
tennis, with her 349th consecutive win in the sport.
In addition to covering individual athletes winning
gold medals, the newspaper also published an article
on the art and science of wheelchair basketball, as
well as a feature on an American athlete, SuGui Kriss,
who had been adopted from China and was now
competing on the U.S. sitting volleyball team. Of the
12 articles, a majority of them initially focused on the
victory of the featured athlete, but then briefly noted
the victories of other athletes.
USA Today
USA Today exceeded the coverage of the New York
Times, publishing 16 total articles over the duration of
the Games, though the articles were much shorter in
length and details. USA Today exhibited some of the
same patterns, focusing on Pistorius, du Toit, Kriss
and Vergeer.
Neither paper focused exclusively on the participation
and performance of American athletes, and both
genders were represented in the minimal coverage.
NBC Television coverage
NBC, the official television channel of the 2008
Olympic Games, did not provide live coverage of the
2008 Paralympic Games. In October 2008, over a
month after the Paralympic Games had ended, NBC
aired a 90-minute summary of the Games, in stark
contrast to their televised Olympic coverage.
and Walsh; in addition women’s swimming, women’s
diving and the women’s marathon received significant
time in prime time.
Men received more coverage then women in the
second week (eight days of competition) of the
Games (746 minutes for men, 562 minutes for
women). Track and field took center stage during
the second week as the swimming competitions
ended. Early in the second week men’s and women’s
gymnastics continued to receive coverage, as did
women’s beach volleyball and men’s and women’s
diving. The men’s marathon received full coverage
(as had the women’s marathon during Week 1) and
the men’s indoor volleyball final was given extensive
coverage on the final broadcast.
The coverage of women’s sports in all three media
(Web sites, newspapers, NBC primetime television)
ranged from a low of 25% (New York Times) to a high
of 50% (Week 1 NBC primetime television). While the
overall coverage was somewhat lower for females
than for males, this is far more time than women’s
sports are usually covered in the media. As previous
studies have shown women receive between 3-12% of
the coverage on local network sports news and “ESPN
SportsCenter” (Messner, Duncan, & Cooky, 2003).
Thus the summer Games are a time of booming
coverage for women’s sports compared to the rest of
the year/three years.
Paralympic Media CoverageAmerican newspaper and television coverage of the
Paralympic Games in 2008 was dismal. In examining
two major American newspapers, New York Times and
USA Today, neither newspaper adequately covered
the Games. Additionally, there was no live television
coverage of the Paralympic Games in the United
States. While this report focuses on gender, the media
coverage of the Paralympic Games first concerned
itself with the amount of coverage, with gender being
a secondary issue of examination.

A Women’s Sports Foundation Research Report44 A Women’s Sports Foundation Research Report44
Media coverage of the Paralympic Games in the
United States remains minimal. While focusing on the
successes of some athletes, like Pistorius and du Toit,
this also exhibited a trend of comparing the athletes
to their able-bodied counterparts, who Pistorius
had wanted to compete against and who du Toit did
compete against in Beijing. Coverage of Paralympic
athletes, while highlighting their accomplishments,
also tended to indicate the source of their disability
and their struggle to overcome and compete in the
Paralympic Games. There is a noticeable absence
in the literature related to the media coverage of
athletes with disabilities. One exception is Schell
and Duncan (1999), which examined the televised
coverage of the 1996 Paralympic Games, which
totaled four hours (two and one-half hours more than
the Games 12 years later).

45Women in the 2000, 2004 and 2008 Olympic and Paralympic Games: An Analysis of Participation, Leadership and Media Opportunities 45
Policy Recommendations International Olympic and Paralympic • Leadership: The International Olympic Committee
should establish a new goal of 50% representation
of women and mandate that the governing boards
of the IOC, NOCs and IFs achieve this goal by 2012.
• Program Expansion: The IOC and IPC should
provide financial incentives to NOCs and IFs that
demonstrate measurable progress towards gender
equity in their delegations, training programs and
governance structures. The IOC should prohibit
any delegation that does not include female
competitors from participating in the Games.
• Participation: The IOC and IPC should establish as
a goal to achieve 50% female participation in the
Games by 2012. In order to do so, the IOC should
expand its limits on number of athletes participating
in the Games in order to expand opportunities
for women.
• Participation Structure: The IOC and IPC should
mandate that every sport must offer equal
opportunities for women and men in the numbers of
events, event classifications, weight classifications,
disciplines and number of teams in team
sport competitions.
• Softball: Softball should remain on the Olympic
program. At a time when women have still not
achieved equal participation in the Games, the
IOC must reject any actions that would decrease
participation opportunities for women. More
countries participate in softball than several other
sports that remain on the Olympic program, such as
pentathlon and triathlon. The IOC concerns with the
sport of baseball, specifically with regard to the lack
of proper doping controls and the absence of the
most highly skilled from the Games, do not apply to
the sport of softball which is not women’s baseball.
• Olympic Solidarity: Olympic Solidarity should award
at least 50% of its scholarships to female athletes.
• Data Collection: The IOC and IPC should mandate
that the IFs and NOCs provide their Women and
Sport Commissions with data every quadrennial
reporting the participation of women with their
delegations and within their governance and
administrative structures. These reports should
also detail the specific efforts the IFs and NOCs
are making to increase the participation of women
as athletes, administrators and members of
governance structures. The Commissions should
compile this data into a report released every
quadrennial, also including same information for
state of women within the IOC and IPC.
United States Olympic and Paralympic • Leadership: The USOC should establish a goal
for its governing board and those of its NGBs to
achieve 50% representation of women by 2012.
• Participation: The USOC should establish as a goal
to achieve 50% female participation in its athlete
delegation at the Olympic and Paralympic Games
by 2012.
• Reporting and Expansion: The USOC should
institute clear and evidence-based NGB reporting
requirements with regard to current patterns
and improvements towards the representation
of women within NGBs. These requirements
should include:
• That each NGB complete its quadrennial
reporting requirements under the Amateur Sports
Act (ASA) before receiving USOC funding or
reimbursement for expenditures.
• That each NGB have a program in place to
increase the participation of women as athletes,
administrators and members of governance
within the NGBs. Quadrennial reports on these
programs should include reliable participation
numbers on each program and evidence-based
measures of progress.

A Women’s Sports Foundation Research Report46 A Women’s Sports Foundation Research Report46
• That each NGB make the information it reports
under the ASA publicly available on its Web site.
• Encouragement to utilize the Women’s Sports
Foundation and other expert groups to assist the
USOC and its NGBs in their efforts to design and
implement diversity programs and to identify
women to be recruited for governance and
staff positions.
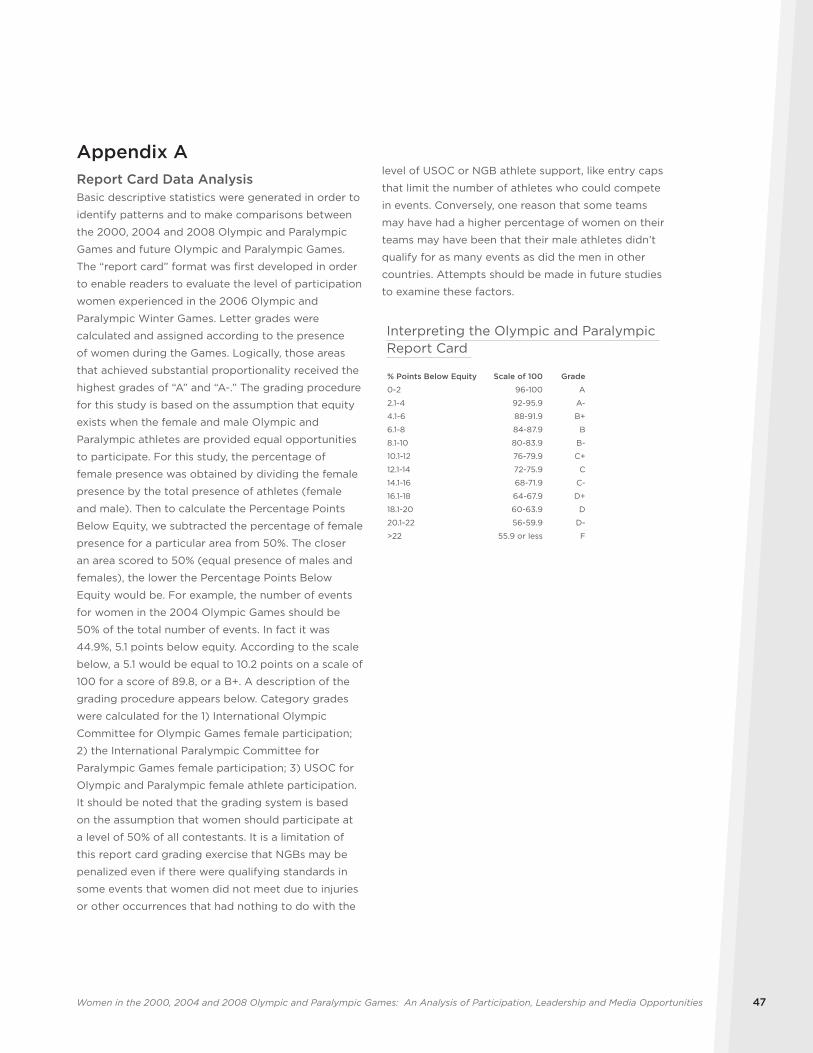
47Women in the 2000, 2004 and 2008 Olympic and Paralympic Games: An Analysis of Participation, Leadership and Media Opportunities 47
level of USOC or NGB athlete support, like entry caps
that limit the number of athletes who could compete
in events. Conversely, one reason that some teams
may have had a higher percentage of women on their
teams may have been that their male athletes didn’t
qualify for as many events as did the men in other
countries. Attempts should be made in future studies
to examine these factors.
Interpreting the Olympic and Paralympic Report Card
% Points Below Equity Scale of 100 Grade
0-2 96-100 A
2.1-4 92-95.9 A-
4.1-6 88-91.9 B+
6.1-8 84-87.9 B
8.1-10 80-83.9 B-
10.1-12 76-79.9 C+
12.1-14 72-75.9 C
14.1-16 68-71.9 C-
16.1-18 64-67.9 D+
18.1-20 60-63.9 D
20.1-22 56-59.9 D-
>22 55.9 or less F
Appendix AReport Card Data AnalysisBasic descriptive statistics were generated in order to
identify patterns and to make comparisons between
the 2000, 2004 and 2008 Olympic and Paralympic
Games and future Olympic and Paralympic Games.
The “report card” format was first developed in order
to enable readers to evaluate the level of participation
women experienced in the 2006 Olympic and
Paralympic Winter Games. Letter grades were
calculated and assigned according to the presence
of women during the Games. Logically, those areas
that achieved substantial proportionality received the
highest grades of “A” and “A-.” The grading procedure
for this study is based on the assumption that equity
exists when the female and male Olympic and
Paralympic athletes are provided equal opportunities
to participate. For this study, the percentage of
female presence was obtained by dividing the female
presence by the total presence of athletes (female
and male). Then to calculate the Percentage Points
Below Equity, we subtracted the percentage of female
presence for a particular area from 50%. The closer
an area scored to 50% (equal presence of males and
females), the lower the Percentage Points Below
Equity would be. For example, the number of events
for women in the 2004 Olympic Games should be
50% of the total number of events. In fact it was
44.9%, 5.1 points below equity. According to the scale
below, a 5.1 would be equal to 10.2 points on a scale of
100 for a score of 89.8, or a B+. A description of the
grading procedure appears below. Category grades
were calculated for the 1) International Olympic
Committee for Olympic Games female participation;
2) the International Paralympic Committee for
Paralympic Games female participation; 3) USOC for
Olympic and Paralympic female athlete participation.
It should be noted that the grading system is based
on the assumption that women should participate at
a level of 50% of all contestants. It is a limitation of
this report card grading exercise that NGBs may be
penalized even if there were qualifying standards in
some events that women did not meet due to injuries
or other occurrences that had nothing to do with the
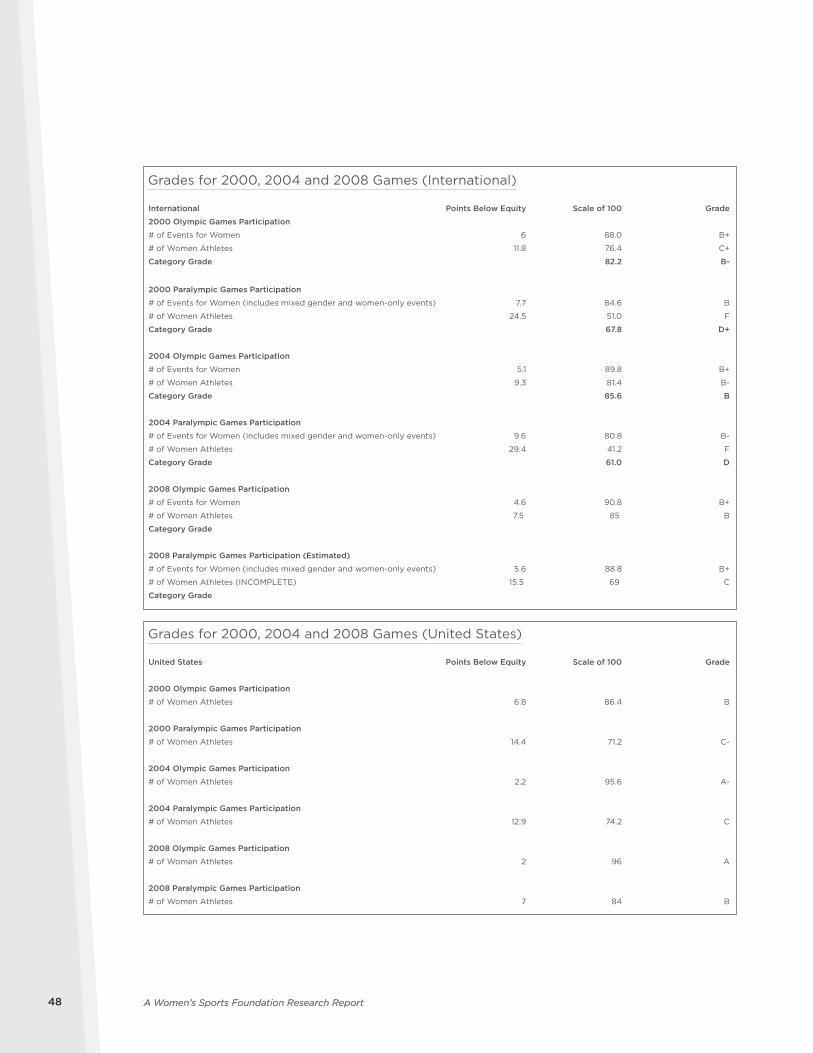
A Women’s Sports Foundation Research Report48 A Women’s Sports Foundation Research Report48
Grades for 2000, 2004 and 2008 Games (International)
International Points Below Equity Scale of 100 Grade
2000 Olympic Games Participation
# of Events for Women 6 88.0 B+
# of Women Athletes 11.8 76.4 C+
Category Grade 82.2 B-
2000 Paralympic Games Participation
# of Events for Women (includes mixed gender and women-only events) 7.7 84.6 B
# of Women Athletes 24.5 51.0 F
Category Grade 67.8 D+
2004 Olympic Games Participation
# of Events for Women 5.1 89.8 B+
# of Women Athletes 9.3 81.4 B-
Category Grade 85.6 B
2004 Paralympic Games Participation
# of Events for Women (includes mixed gender and women-only events) 9.6 80.8 B-
# of Women Athletes 29.4 41.2 F
Category Grade 61.0 D
2008 Olympic Games Participation
# of Events for Women 4.6 90.8 B+
# of Women Athletes 7.5 85 B
Category Grade
2008 Paralympic Games Participation (Estimated)
# of Events for Women (includes mixed gender and women-only events) 5.6 88.8 B+
# of Women Athletes (INCOMPLETE) 15.5 69 C
Category Grade
Grades for 2000, 2004 and 2008 Games (United States)
United States Points Below Equity Scale of 100 Grade
2000 Olympic Games Participation
# of Women Athletes 6.8 86.4 B
2000 Paralympic Games Participation
# of Women Athletes 14.4 71.2 C-
2004 Olympic Games Participation
# of Women Athletes 2.2 95.6 A-
2004 Paralympic Games Participation
# of Women Athletes 12.9 74.2 C
2008 Olympic Games Participation
# of Women Athletes 2 96 A
2008 Paralympic Games Participation
# of Women Athletes 7 84 B
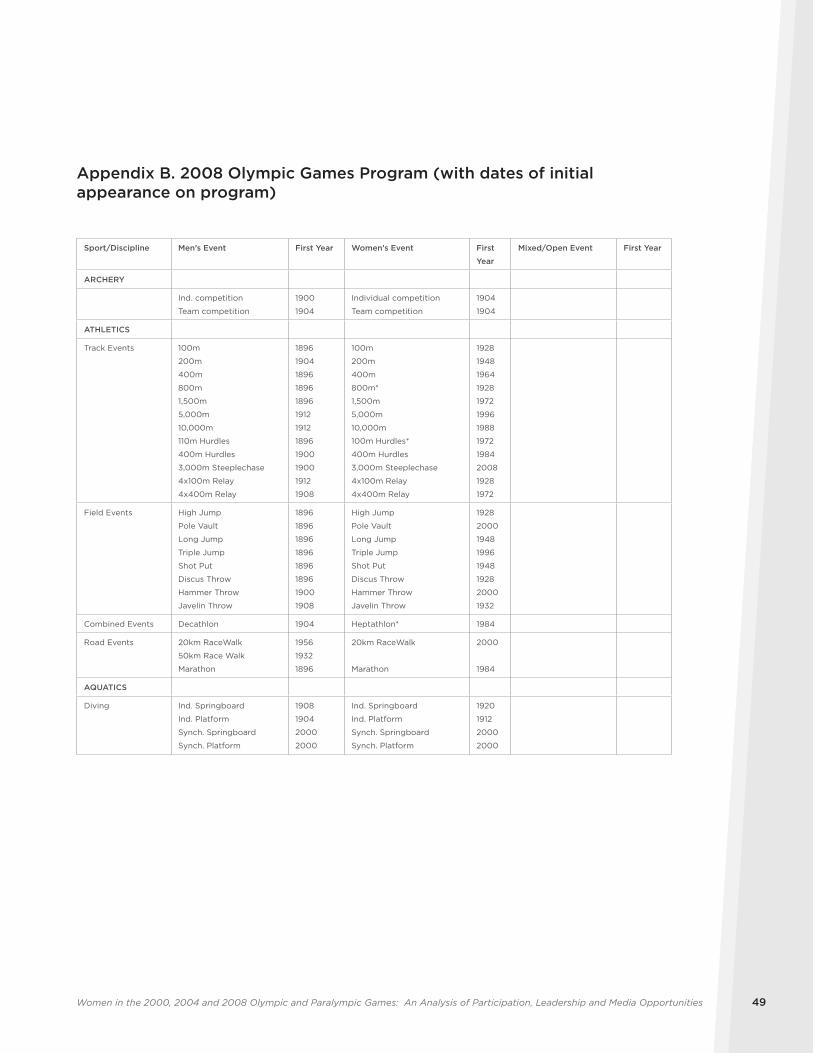
49Women in the 2000, 2004 and 2008 Olympic and Paralympic Games: An Analysis of Participation, Leadership and Media Opportunities 49
Appendix B. 2008 Olympic Games Program (with dates of initial appearance on program)
Sport/Discipline Men’s Event First Year Women’s Event First
Year
Mixed/Open Event First Year
ARCHERY
Ind. competition
Team competition
1900
1904
Individual competition
Team competition
1904
1904
ATHLETICS
Track Events 100m
200m
400m
800m
1,500m
5,000m
10,000m
110m Hurdles
400m Hurdles
3,000m Steeplechase
4x100m Relay
4x400m Relay
1896
1904
1896
1896
1896
1912
1912
1896
1900
1900
1912
1908
100m
200m
400m
800m*
1,500m
5,000m
10,000m
100m Hurdles*
400m Hurdles
3,000m Steeplechase
4x100m Relay
4x400m Relay
1928
1948
1964
1928
1972
1996
1988
1972
1984
2008
1928
1972
Field Events High Jump
Pole Vault
Long Jump
Triple Jump
Shot Put
Discus Throw
Hammer Throw
Javelin Throw
1896
1896
1896
1896
1896
1896
1900
1908
High Jump
Pole Vault
Long Jump
Triple Jump
Shot Put
Discus Throw
Hammer Throw
Javelin Throw
1928
2000
1948
1996
1948
1928
2000
1932
Combined Events Decathlon 1904 Heptathlon* 1984
Road Events 20km RaceWalk
50km Race Walk
Marathon
1956
1932
1896
20km RaceWalk
Marathon
2000
1984
AQUATICS
Diving Ind. Springboard
Ind. Platform
Synch. Springboard
Synch. Platform
1908
1904
2000
2000
Ind. Springboard
Ind. Platform
Synch. Springboard
Synch. Platform
1920
1912
2000
2000
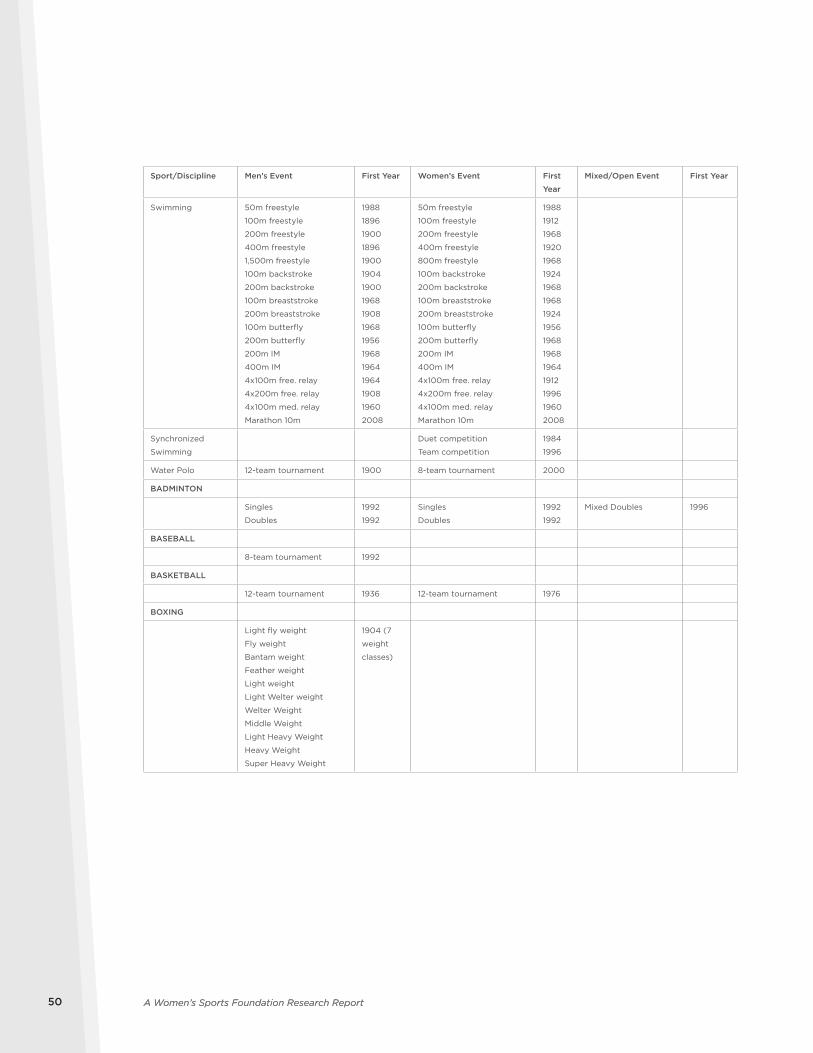
A Women’s Sports Foundation Research Report50 A Women’s Sports Foundation Research Report50
Sport/Discipline Men’s Event First Year Women’s Event First
Year
Mixed/Open Event First Year
Swimming 50m freestyle
100m freestyle
200m freestyle
400m freestyle
1,500m freestyle
100m backstroke
200m backstroke
100m breaststroke
200m breaststroke
100m butterfly
200m butterfly
200m IM
400m IM
4x100m free. relay
4x200m free. relay
4x100m med. relay
Marathon 10m
1988
1896
1900
1896
1900
1904
1900
1968
1908
1968
1956
1968
1964
1964
1908
1960
2008
50m freestyle
100m freestyle
200m freestyle
400m freestyle
800m freestyle
100m backstroke
200m backstroke
100m breaststroke
200m breaststroke
100m butterfly
200m butterfly
200m IM
400m IM
4x100m free. relay
4x200m free. relay
4x100m med. relay
Marathon 10m
1988
1912
1968
1920
1968
1924
1968
1968
1924
1956
1968
1968
1964
1912
1996
1960
2008
Synchronized
Swimming
Duet competition
Team competition
1984
1996
Water Polo 12-team tournament 1900 8-team tournament 2000
BADMINTON
Singles
Doubles
1992
1992
Singles
Doubles
1992
1992
Mixed Doubles 1996
BASEBALL
8-team tournament 1992
BASKETBALL
12-team tournament 1936 12-team tournament 1976
BOXING
Light fly weight
Fly weight
Bantam weight
Feather weight
Light weight
Light Welter weight
Welter Weight
Middle Weight
Light Heavy Weight
Heavy Weight
Super Heavy Weight
1904 (7
weight
classes)
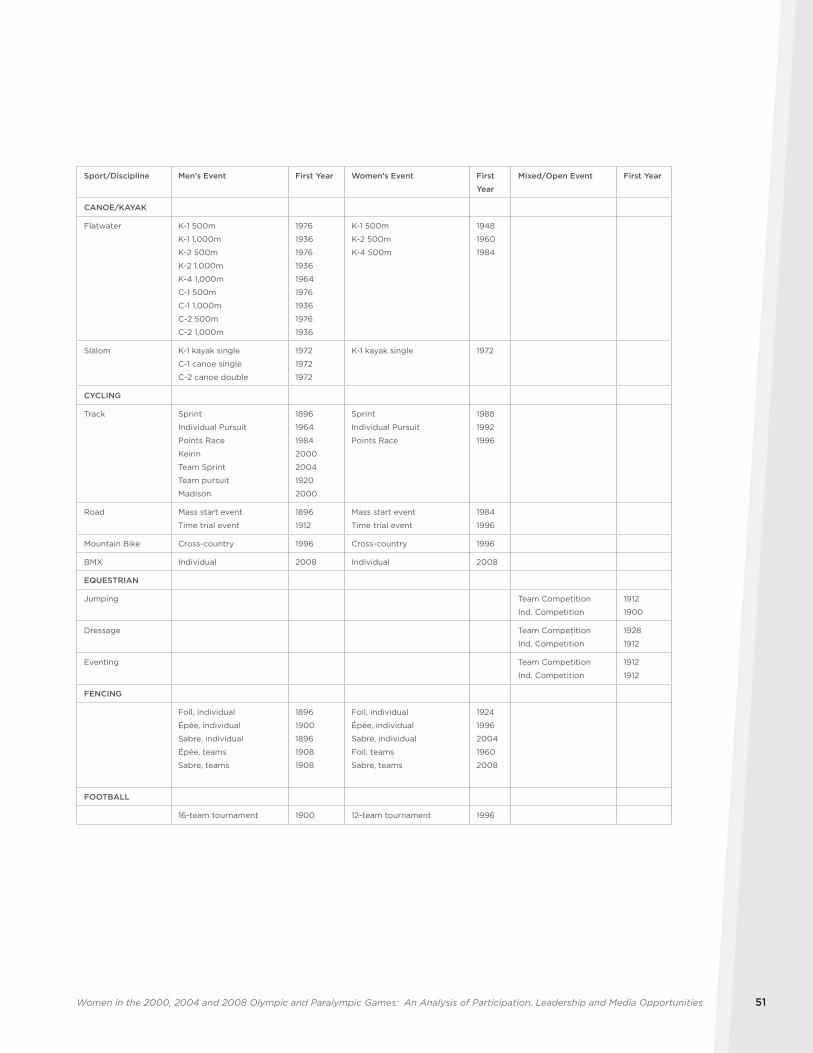
51Women in the 2000, 2004 and 2008 Olympic and Paralympic Games: An Analysis of Participation, Leadership and Media Opportunities 51
Sport/Discipline Men’s Event First Year Women’s Event First
Year
Mixed/Open Event First Year
CANOE/KAYAK
Flatwater K-1 500m
K-1 1,000m
K-2 500m
K-2 1,000m
K-4 1,000m
C-1 500m
C-1 1,000m
C-2 500m
C-2 1,000m
1976
1936
1976
1936
1964
1976
1936
1976
1936
K-1 500m
K-2 500m
K-4 500m
1948
1960
1984
Slalom K-1 kayak single
C-1 canoe single
C-2 canoe double
1972
1972
1972
K-1 kayak single 1972
CYCLING
Track Sprint
Individual Pursuit
Points Race
Keirin
Team Sprint
Team pursuit
Madison
1896
1964
1984
2000
2004
1920
2000
Sprint
Individual Pursuit
Points Race
1988
1992
1996
Road Mass start event
Time trial event
1896
1912
Mass start event
Time trial event
1984
1996
Mountain Bike Cross-country 1996 Cross-country 1996
BMX Individual 2008 Individual 2008
EQUESTRIAN
Jumping Team Competition
Ind. Competition
1912
1900
Dressage Team Competition
Ind. Competition
1928
1912
Eventing Team Competition
Ind. Competition
1912
1912
FENCING
Foil, individual
Épée, individual
Sabre, individual
Épée, teams
Sabre, teams
1896
1900
1896
1908
1908
Foil, individual
Épée, individual
Sabre, individual
Foil, teams
Sabre, teams
1924
1996
2004
1960
2008
FOOTBALL
16-team tournament 1900 12-team tournament 1996
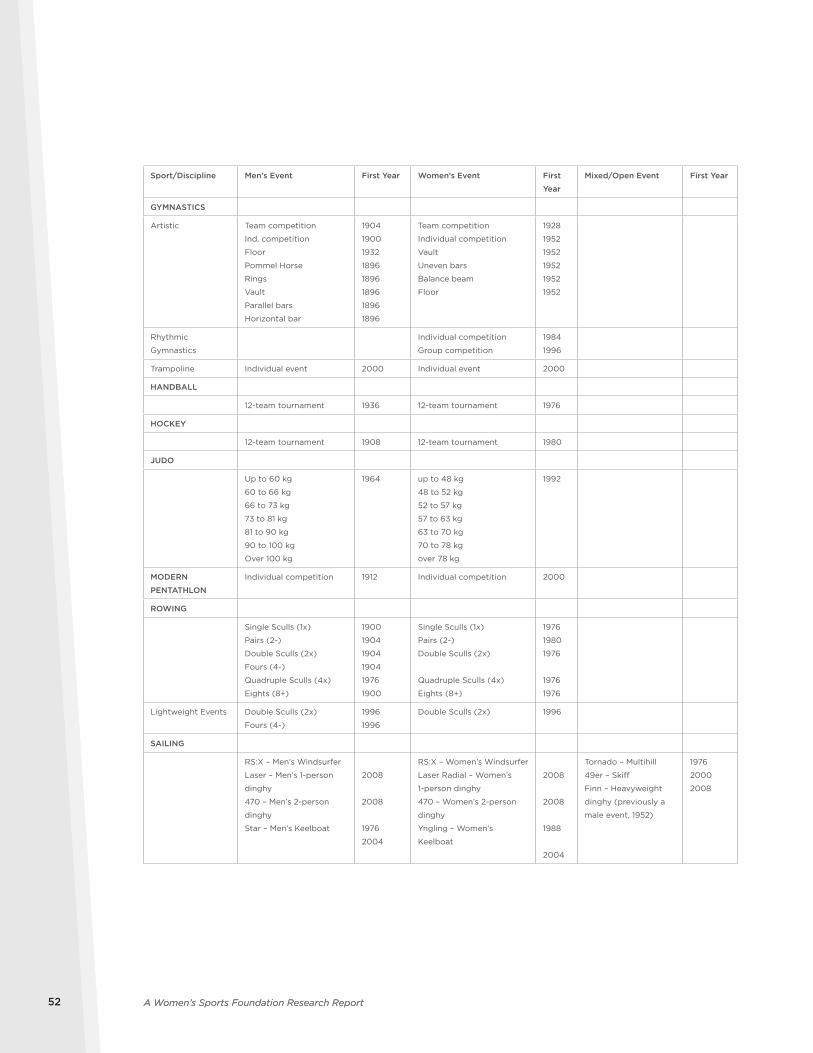
A Women’s Sports Foundation Research Report52 A Women’s Sports Foundation Research Report52
Sport/Discipline Men’s Event First Year Women’s Event First
Year
Mixed/Open Event First Year
GYMNASTICS
Artistic Team competition
Ind. competition
Floor
Pommel Horse
Rings
Vault
Parallel bars
Horizontal bar
1904
1900
1932
1896
1896
1896
1896
1896
Team competition
Individual competition
Vault
Uneven bars
Balance beam
Floor
1928
1952
1952
1952
1952
1952
Rhythmic
Gymnastics
Individual competition
Group competition
1984
1996
Trampoline Individual event 2000 Individual event 2000
HANDBALL
12-team tournament 1936 12-team tournament 1976
HOCKEY
12-team tournament 1908 12-team tournament 1980
JUDO
Up to 60 kg
60 to 66 kg
66 to 73 kg
73 to 81 kg
81 to 90 kg
90 to 100 kg
Over 100 kg
1964 up to 48 kg
48 to 52 kg
52 to 57 kg
57 to 63 kg
63 to 70 kg
70 to 78 kg
over 78 kg
1992
MODERN
PENTATHLON
Individual competition 1912 Individual competition 2000
ROWING
Single Sculls (1x)
Pairs (2-)
Double Sculls (2x)
Fours (4-)
Quadruple Sculls (4x)
Eights (8+)
1900
1904
1904
1904
1976
1900
Single Sculls (1x)
Pairs (2-)
Double Sculls (2x)
Quadruple Sculls (4x)
Eights (8+)
1976
1980
1976
1976
1976
Lightweight Events Double Sculls (2x)
Fours (4-)
1996
1996
Double Sculls (2x) 1996
SAILING
RS:X – Men’s Windsurfer
Laser – Men’s 1-person
dinghy
470 – Men’s 2-person
dinghy
Star – Men’s Keelboat
2008
2008
1976
2004
RS:X – Women’s Windsurfer
Laser Radial – Women’s
1-person dinghy
470 – Women’s 2-person
dinghy
Yngling – Women’s
Keelboat
2008
2008
1988
2004
Tornado – Multihill
49er – Skiff
Finn – Heavyweight
dinghy (previously a
male event, 1952)
1976
2000
2008
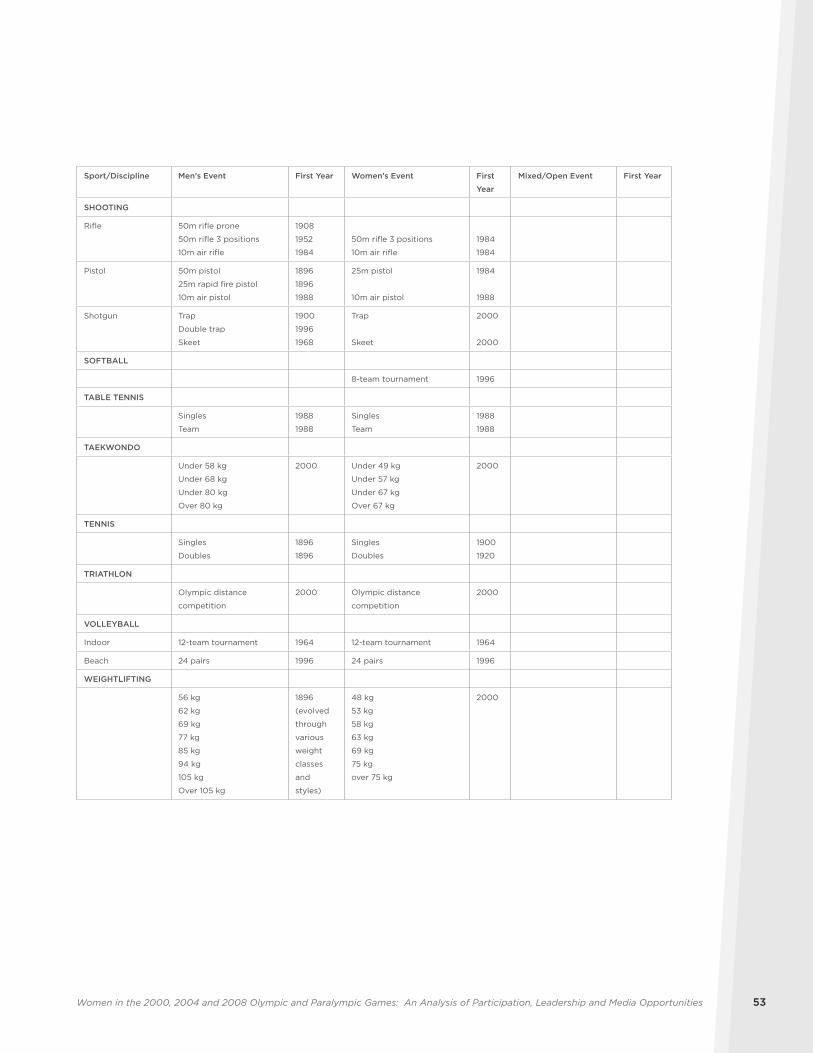
53Women in the 2000, 2004 and 2008 Olympic and Paralympic Games: An Analysis of Participation, Leadership and Media Opportunities
Sport/Discipline Men’s Event First Year Women’s Event First
Year
Mixed/Open Event First Year
SHOOTING
Rifle 50m rifle prone
50m rifle 3 positions
10m air rifle
1908
1952
1984
50m rifle 3 positions
10m air rifle
1984
1984
Pistol 50m pistol
25m rapid fire pistol
10m air pistol
1896
1896
1988
25m pistol
10m air pistol
1984
1988
Shotgun Trap
Double trap
Skeet
1900
1996
1968
Trap
Skeet
2000
2000
SOFTBALL
8-team tournament 1996
TABLE TENNIS
Singles
Team
1988
1988
Singles
Team
1988
1988
TAEKWONDO
Under 58 kg
Under 68 kg
Under 80 kg
Over 80 kg
2000 Under 49 kg
Under 57 kg
Under 67 kg
Over 67 kg
2000
TENNIS
Singles
Doubles
1896
1896
Singles
Doubles
1900
1920
TRIATHLON
Olympic distance
competition
2000 Olympic distance
competition
2000
VOLLEYBALL
Indoor 12-team tournament 1964 12-team tournament 1964
Beach 24 pairs 1996 24 pairs 1996
WEIGHTLIFTING
56 kg
62 kg
69 kg
77 kg
85 kg
94 kg
105 kg
Over 105 kg
1896
(evolved
through
various
weight
classes
and
styles)
48 kg
53 kg
58 kg
63 kg
69 kg
75 kg
over 75 kg
2000
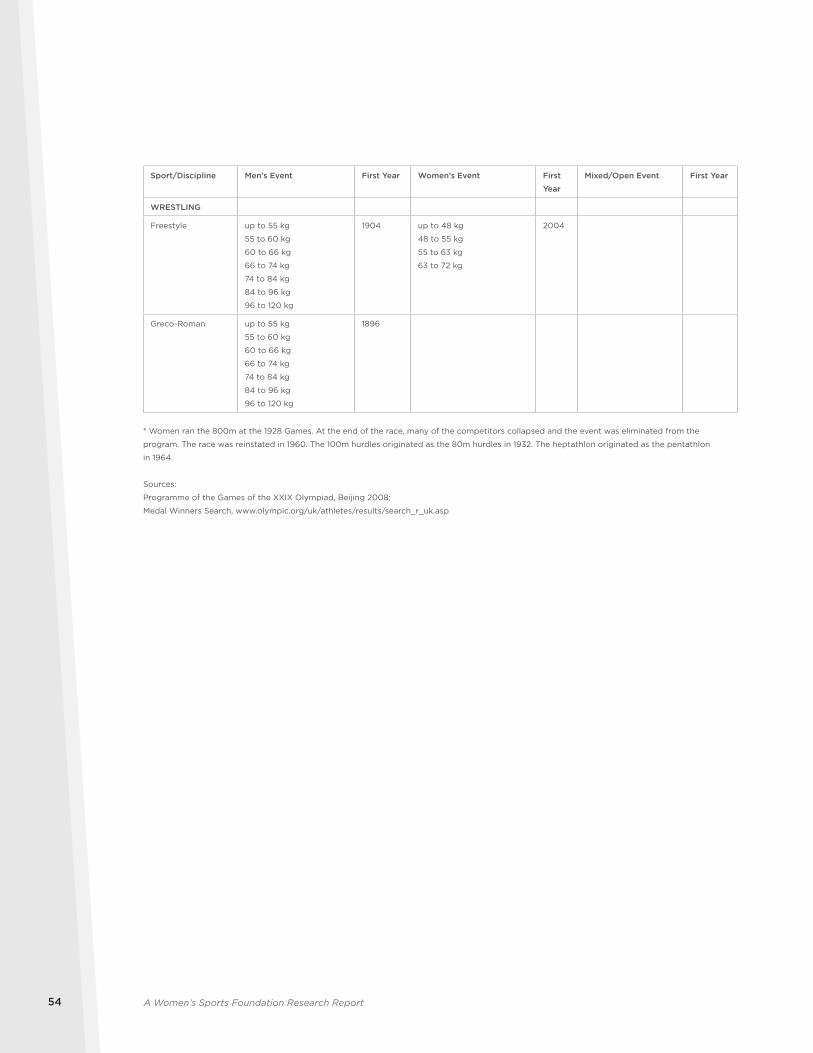
A Women’s Sports Foundation Research Report54
Sport/Discipline Men’s Event First Year Women’s Event First
Year
Mixed/Open Event First Year
WRESTLING
Freestyle up to 55 kg
55 to 60 kg
60 to 66 kg
66 to 74 kg
74 to 84 kg
84 to 96 kg
96 to 120 kg
1904 up to 48 kg
48 to 55 kg
55 to 63 kg
63 to 72 kg
2004
Greco-Roman up to 55 kg
55 to 60 kg
60 to 66 kg
66 to 74 kg
74 to 84 kg
84 to 96 kg
96 to 120 kg
1896
* Women ran the 800m at the 1928 Games. At the end of the race, many of the competitors collapsed and the event was eliminated from the
program. The race was reinstated in 1960. The 100m hurdles originated as the 80m hurdles in 1932. The heptathlon originated as the pentathlon
in 1964.
Sources:
Programme of the Games of the XXIX Olympiad, Beijing 2008;
Medal Winners Search, www.olympic.org/uk/athletes/results/search_r_uk.asp

55Women in the 2000, 2004 and 2008 Olympic and Paralympic Games: An Analysis of Participation, Leadership and Media Opportunities 55
AthleticsAthletics (59 women’s events and 100 men’s
events) – Athletics accounts for the greatest number
of participants at the Paralympic Games. Athletics
was one of the initial sports on the 1960 program and
offers events for female and male athletes. Events
included in the 1960 Games included javelin and shot
put for women and men, and the club throw for men
only. Other events were added over the years. For
example, in 1976, the 100m, 200m, 800m, 1,500m and
the long jump were added for females and males. In
1984, the women’s marathon was added. Four years
later, the 10,000m was added, but for male athletes
only. Additionally, classifications were added over the
years, which expanded event offerings for athletes
with various disabilities. Athletes compete according
to functional classifications.
Classes 11, 12, 13 refer to the different levels of
visual impairment.
Class 20 is a classification for athletes with an
intellectual disability.
Classes 32-38 classify athletes with cerebral palsy,
with classes 32-34 competing in wheelchairs and
classes 35-38 being ambulant.
Classes 40-46 classify ambulant athletes with
different levels of amputation and other disabilities.
Classes 51-58 refer to “wheelchair athletes
with different levels of spinal cord injuries
and amputations.”
For more on the classification system in Athletics,
see www.paralympic.org/release/Summer_Sports/
Athletics/About_the_sport/Classification
Appendix C. 2008 Paralympic Program (with dates of initial appearance on program and overview of classifications for each sport and event)
Archery Archery (four women’s events and five men’s
events) – Archery was one of the initial sports at the
first Paralympic Games in 1960 for women and men.
Men’s team competition began in 1964, with women’s
team competition coming in 1976.
Classifications: (divided into three different classes):
Archery Standing (ARST): Athletes in this class
have no disabilities in their arms, but their legs have
some “degree of loss of loss of muscle strength, co-
ordination and/or joint mobility.” The athletes in this
class are able to compete standing or sitting in a chair
with their feet on the ground.
Archery Wheelchair 1 (ARW1): Athletes in this class
have a disability in their arms and legs, with “limited
range of movement, strength and control of their
arms and poor or non-existing control of the trunk.”
These athletes compete in a wheelchair.
Archery Wheelchair 2 (ARW2): Athletes in this class
“have paraplegia and limited mobility in the lower
limbs.” These athletes compete in a wheelchair.
For more, see www.paralympic.org/release/Summer_
Sports/Archery/About_the_sport/Classification
Women’s Events Men’s Events
Individual Compound Open Individual Compound Open
Individual Recurve Standing Individual Compound W1
Individual Recurve W1/W2 Individual Recurve Standing
Individual Recurve W1/W2
Team competition Team competition

A Women’s Sports Foundation Research Report56 A Women’s Sports Foundation Research Report56
Women’s Events Men’s Events
Marathon T54 Marathon T12
Marathon T46
Marathon T52
Marathon T54
4x100m Relay T53/54 4x100m Relay T11-13
4x100m Relay T35-38
4x100m Relay T42-46
4x100m Relay T53/54
4x400m Relay T53/54
Club Throw F32/51
Discus Throw F13 Discus Throw F11/12
Discus Throw F32-34/51-53 Discus Throw F32/51
Discus Throw F35/36 Discus Throw F33/34/52
Discus Throw F37/38 Discus Throw F35/36
Discus Throw F40 Discus Throw F37/38
Discus Throw F42-46 Discus Throw F42
Discus Throw F54-56 Discus Throw F44
Discus Throw F57/58 Discus Throw F53/54
Discus Throw F55/56
Discus Throw F57/58
High Jump F46
Javelin Throw F33/34/52/53 Javelin Throw F11/12
Javelin Throw F35-38 Javelin Throw F33/34/52
Javelin Throw F42-46 Javelin Throw F35/36
Javelin Throw F54-56 Javelin Throw F37/38
Javelin Throw F57/58 Javelin Throw F42/44
Javelin Throw F53/54
Javelin Throw F55/56
Javelin Throw F57/58
Long Jump F12 Long Jump F11
Long Jump F13 Long Jump F12
Long Jump F42 Long Jump F37/38
Long Jump F42/44
Long Jump F46
Pentathlon P12
Pentathlon P44
Shot Put F13 Shot Put F11/12
Shot Put F32-34/52/53 Shot Put F32
Shot Put F35/36 Shot Put F33/34/52
Shot Put F37/38 Shot Put F35/36
Shot Put F40 Shot Put F37/38
Shot Put 42-46 Shot Put F40
Shot Put F54-56 Shot Put F42
Shot Put F57/58 Shot Put F44
Shot Put F53/54
Shot Put F55/56
Shot Put F57/58
Women’s Events Men’s Events
100m T11 100m T11
100m T12 100m T12
100m T13 100m T13
100m T36 100m T35
100m T37 100m T36
100m T38 100m T37
100m T42 100m T38
100m T44 100m T42
100m T46 100m T44
100m T52 100m T46
100m T53 100m T52
100m T54 100m T53
100m T54
200m T11 200m T11
200m T12 200m T12
200m T13 200m T13
200m T36 200m T36
200m T37 200m T37
200m T38 200m T38
200m T44 200m T44
200m T46 200m T46
200m T52 200m T52
200m T53 200m T53
200m T54 200m T54
400m T12 400m T11
400m T13 400m T12
400m T53 400m T13
400m T54 400m T36
400m T38
400m T44
400m T46
400m T52
400m T53
400m T54
800m T13 800m T12
800m T53 800m T13
800m T54 800m T36
800m T37
800m T46
800m T52
800m T53
800m T54
1,500m T13 1,500m T11
1,500m T54 1,500m T13
1,500m T46
1,500m T54
5,000m T54 5,000m T11
5,000m T13
5,000m T46
5,000m T54
10,000m T12
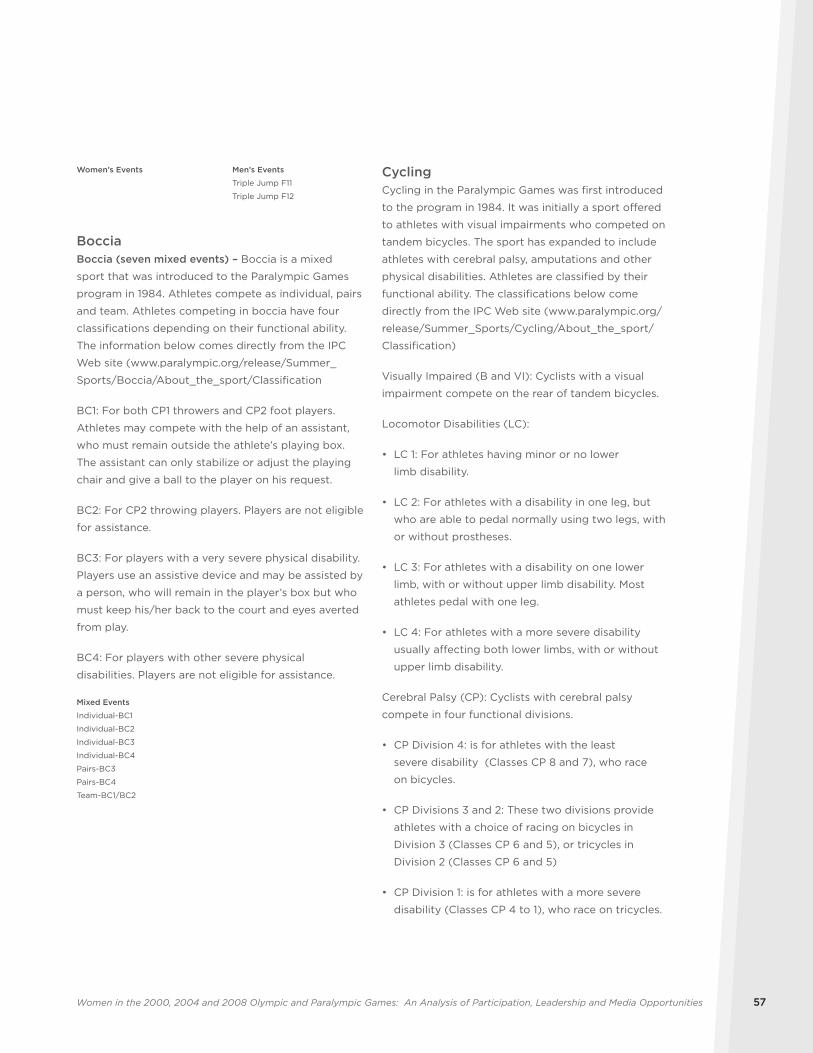
57Women in the 2000, 2004 and 2008 Olympic and Paralympic Games: An Analysis of Participation, Leadership and Media Opportunities 57
CyclingCycling in the Paralympic Games was first introduced
to the program in 1984. It was initially a sport offered
to athletes with visual impairments who competed on
tandem bicycles. The sport has expanded to include
athletes with cerebral palsy, amputations and other
physical disabilities. Athletes are classified by their
functional ability. The classifications below come
directly from the IPC Web site (www.paralympic.org/
release/Summer_Sports/Cycling/About_the_sport/
Classification)
Visually Impaired (B and VI): Cyclists with a visual
impairment compete on the rear of tandem bicycles.
Locomotor Disabilities (LC):
• LC 1: For athletes having minor or no lower
limb disability.
• LC 2: For athletes with a disability in one leg, but
who are able to pedal normally using two legs, with
or without prostheses.
• LC 3: For athletes with a disability on one lower
limb, with or without upper limb disability. Most
athletes pedal with one leg.
• LC 4: For athletes with a more severe disability
usually affecting both lower limbs, with or without
upper limb disability.
Cerebral Palsy (CP): Cyclists with cerebral palsy
compete in four functional divisions.
• CP Division 4: is for athletes with the least
severe disability (Classes CP 8 and 7), who race
on bicycles.
• CP Divisions 3 and 2: These two divisions provide
athletes with a choice of racing on bicycles in
Division 3 (Classes CP 6 and 5), or tricycles in
Division 2 (Classes CP 6 and 5)
• CP Division 1: is for athletes with a more severe
disability (Classes CP 4 to 1), who race on tricycles.
Women’s Events Men’s Events
Triple Jump F11
Triple Jump F12
Boccia Boccia (seven mixed events) – Boccia is a mixed
sport that was introduced to the Paralympic Games
program in 1984. Athletes compete as individual, pairs
and team. Athletes competing in boccia have four
classifications depending on their functional ability.
The information below comes directly from the IPC
Web site (www.paralympic.org/release/Summer_
Sports/Boccia/About_the_sport/Classification
BC1: For both CP1 throwers and CP2 foot players.
Athletes may compete with the help of an assistant,
who must remain outside the athlete’s playing box.
The assistant can only stabilize or adjust the playing
chair and give a ball to the player on his request.
BC2: For CP2 throwing players. Players are not eligible
for assistance.
BC3: For players with a very severe physical disability.
Players use an assistive device and may be assisted by
a person, who will remain in the player’s box but who
must keep his/her back to the court and eyes averted
from play.
BC4: For players with other severe physical
disabilities. Players are not eligible for assistance.
Mixed Events
Individual-BC1
Individual-BC2
Individual-BC3
Individual-BC4
Pairs-BC3
Pairs-BC4
Team-BC1/BC2
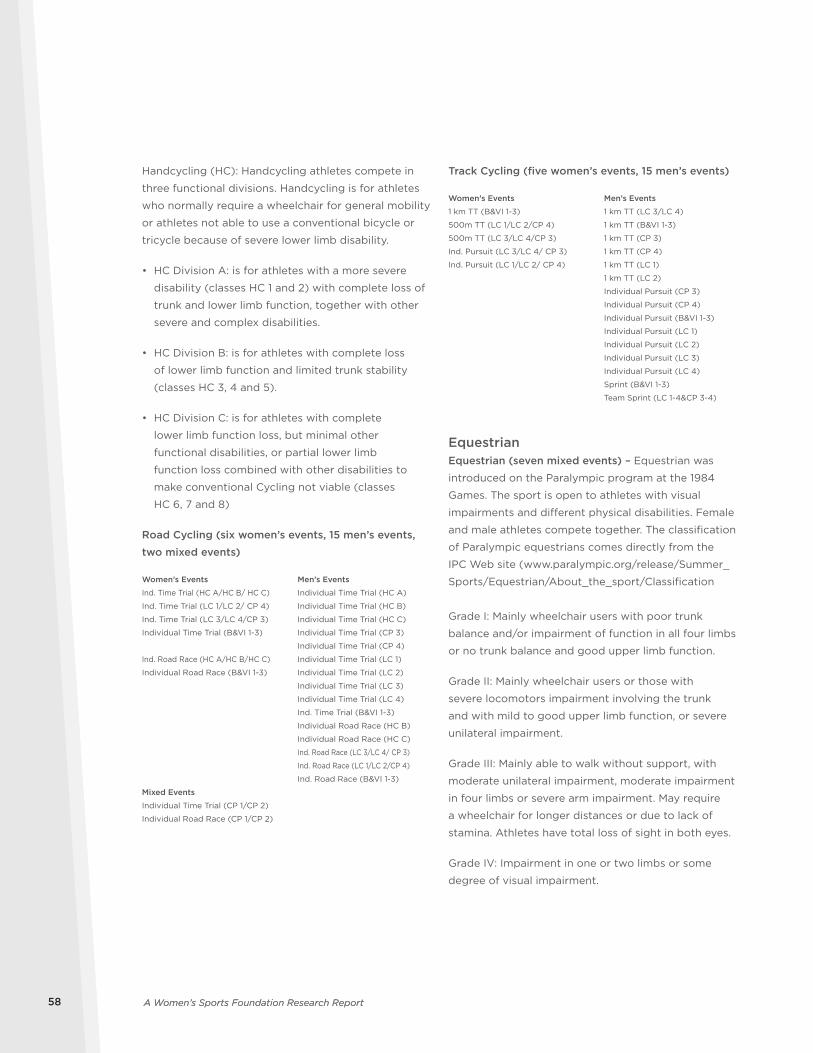
A Women’s Sports Foundation Research Report58 A Women’s Sports Foundation Research Report58
Track Cycling (five women’s events, 15 men’s events)
Women’s Events Men’s Events
1 km TT (B&VI 1-3) 1 km TT (LC 3/LC 4)
500m TT (LC 1/LC 2/CP 4) 1 km TT (B&VI 1-3)
500m TT (LC 3/LC 4/CP 3) 1 km TT (CP 3)
Ind. Pursuit (LC 3/LC 4/ CP 3) 1 km TT (CP 4)
Ind. Pursuit (LC 1/LC 2/ CP 4) 1 km TT (LC 1)
1 km TT (LC 2)
Individual Pursuit (CP 3)
Individual Pursuit (CP 4)
Individual Pursuit (B&VI 1-3)
Individual Pursuit (LC 1)
Individual Pursuit (LC 2)
Individual Pursuit (LC 3)
Individual Pursuit (LC 4)
Sprint (B&VI 1-3)
Team Sprint (LC 1-4&CP 3-4)
EquestrianEquestrian (seven mixed events) – Equestrian was
introduced on the Paralympic program at the 1984
Games. The sport is open to athletes with visual
impairments and different physical disabilities. Female
and male athletes compete together. The classification
of Paralympic equestrians comes directly from the
IPC Web site (www.paralympic.org/release/Summer_
Sports/Equestrian/About_the_sport/Classification
Grade I: Mainly wheelchair users with poor trunk
balance and/or impairment of function in all four limbs
or no trunk balance and good upper limb function.
Grade II: Mainly wheelchair users or those with
severe locomotors impairment involving the trunk
and with mild to good upper limb function, or severe
unilateral impairment.
Grade III: Mainly able to walk without support, with
moderate unilateral impairment, moderate impairment
in four limbs or severe arm impairment. May require
a wheelchair for longer distances or due to lack of
stamina. Athletes have total loss of sight in both eyes.
Grade IV: Impairment in one or two limbs or some
degree of visual impairment.
Handcycling (HC): Handcycling athletes compete in
three functional divisions. Handcycling is for athletes
who normally require a wheelchair for general mobility
or athletes not able to use a conventional bicycle or
tricycle because of severe lower limb disability.
• HC Division A: is for athletes with a more severe
disability (classes HC 1 and 2) with complete loss of
trunk and lower limb function, together with other
severe and complex disabilities.
• HC Division B: is for athletes with complete loss
of lower limb function and limited trunk stability
(classes HC 3, 4 and 5).
• HC Division C: is for athletes with complete
lower limb function loss, but minimal other
functional disabilities, or partial lower limb
function loss combined with other disabilities to
make conventional Cycling not viable (classes
HC 6, 7 and 8)
Road Cycling (six women’s events, 15 men’s events,
two mixed events)
Women’s Events Men’s Events
Ind. Time Trial (HC A/HC B/ HC C) Individual Time Trial (HC A)
Ind. Time Trial (LC 1/LC 2/ CP 4) Individual Time Trial (HC B)
Ind. Time Trial (LC 3/LC 4/CP 3) Individual Time Trial (HC C)
Individual Time Trial (B&VI 1-3) Individual Time Trial (CP 3)
Individual Time Trial (CP 4)
Ind. Road Race (HC A/HC B/HC C) Individual Time Trial (LC 1)
Individual Road Race (B&VI 1-3) Individual Time Trial (LC 2)
Individual Time Trial (LC 3)
Individual Time Trial (LC 4)
Ind. Time Trial (B&VI 1-3)
Individual Road Race (HC B)
Individual Road Race (HC C)
Ind. Road Race (LC 3/LC 4/ CP 3)
Ind. Road Race (LC 1/LC 2/CP 4)
Ind. Road Race (B&VI 1-3)
Mixed Events
Individual Time Trial (CP 1/CP 2)
Individual Road Race (CP 1/CP 2)
59Women in the 2000, 2004 and 2008 Olympic and Paralympic Games: An Analysis of Participation, Leadership and Media Opportunities 59
Football (7-A-Side)Football (7-a-side) (one men’s event) – Football
(7-a-side) made its Paralympic debut at the 1984
Games. Athletes competing in football (7-a-side) are
classified by varying degrees of cerebral palsy. There
are four classes used to categorize these athletes
and the team on the field must maintain a number
of players with varying levels of classifications. For
more on the sport, see www.paralympic.org/release/
Summer_Sports/Football_7_a_Side/About_the_sport
The four classifications below come directly from the
IPC Web site (www.paralympic.org/release/Summer_
Sports/Football_7_a_Side/About_the_sport/
Classification)
C5: This class consists of athletes who have difficulties
when walking and running, but not in standing or
when kicking the ball. Usually, a small shift in the
central equilibrium of these athletes leads to the loss
of balance.
C6: This class consists of athletes with moderate to
severe athetosis, ataxia or a combination of spasticity
and athetosis involving all four limbs. C6 athletes
usually have control and co-ordination problems of
their upper limbs, especially when running.
C7: This class consists of athletes with hemiplegia.
The athletes usually walk with a limp and the arm or
hand flexed on the affected side. The other side of the
athlete’s body usually functions well.
C8: The C8 class consists of athletes with mild
hemiplegia, diplegia or athetosis or monoplegia and
must meet the eligibility criteria. Athletes in this class
must have an obvious impairment that has impact on
the sport of football.
At least one C5 or C6 class athlete per team must play
throughout the match. If this is not possible, the team
must play with six players. Furthermore, no more than
three players from category C8 are allowed to play at
the same time.
Mixed Events
Individual Championship Test – Grade II
Individual Championship Test – Grade IV
Individual Championship Test – Grade IA, III, & IB
Individual Freestyle Test – Grade II & IV
Individual Freestyle Test – Grade IA, III, & IB
Team Test – Grade II & III
Team Test – Grade IA, IB, & IV
Football (5-A-Side)Football (5-a- side) (one men’s event) – Football
(5-a-side) is open to athletes with blindness/visual
impairment. It was included for the first time in
the 2004 Games. Athletes are classified based on
their level of visual impairment. The classifications
below come directly from the IPC Web site
(www.paralympic.org/release/Summer_Sports/
Football_5_a_Side/About_the_sport/Classification)
Athletes in the following classes participate in football
(5-a-side):
B1: From no light perception in either eye to light
perception, but inability to recognise the shape of a
hand at any distance or in any direction.
B2: From ability to recognise the shape of a hand
to a visual acuity of 2/60 and/or visual field of less
than 5 degrees.
B3: From visual acuity above 2/60 to visual acuity of
6/60 and/or visual field of more than 5 degrees and
less than 20 degrees.
(NOTE: Not eligible—visual acuity over 6/60 and/or
visual field of more than 20 degrees.)
Goalkeepers may be sighted and, in such cases,
must not have been registered with FIFA in the last
five years.
For more on the sport, see www.paralympic.org/
release/Summer_Sports/Football_5_a_Side/About_
the_sport

A Women’s Sports Foundation Research Report60 A Women’s Sports Foundation Research Report60
GoalballGoalball (one women’s event, one men’s event) –
Goalball was introduced to the Paralympic program
in 1976 and is exclusively a sport for athletes with
blindness/visual impairment (using the same
classifications used in football (5-a-side)). Women
began playing goalball at the Paralympic Games in
1984. For more on the sport, see www.paralympic.org/
release/Summer_Sports/Goalball/About_the_sport
The classifications below come directly from the IPC
Web site (www.paralympic.org/release/Summer_
Sports/Goalball/About_the_sport/Classification)
B1: Total absence of perception of the light in both
eyes or some perception of the light but with inability
to recognize the form of a hand at any distance and in
any direction.
B2: From the ability to recognize the form of a hand to
a visual acuity of 2/60 and/or a visual field of less than
5 degrees.
B3: From a visual acuity of above 2/60 to a visual
acuity of 6/60 and/or a visual field or more than 5
degrees and less than 20 degrees.
All classifications must be made by measuring the
best eye and to the highest possible correction. This
means that all athletes who use contact lenses or
correcting glasses normally must wear them during
classification, whether or not they intend to use them
during competition.
JudoJudo (six women’s events, seven men’s events) –
Judo was included for the first time on the Paralympic
program in 1976 for men and 2004 for women.
Athletes compete are separated into weight
categories and have some level of blindness/visual
impairment. The classifications used in judo are
identical to those used in football (5-a-side) and
goalball. The classifications below come directly
from the IPC Web site (www.paralympic.org/
release/Summer_Sports/Judo/About_the_sport/
Classification)
B1: Athletes have a total absence of perception of the
light in both eyes or some perception of the light but
with inability to recognize the form of a hand at any
distance and in any direction.
B2: Athletes have ability to recognize the form of a
hand to a visual acuity of 2/60 and/or a visual field of
less than five degrees.
B3: Athletes have a visual acuity of above 2/60 to a
visual acuity of 6/60 and/or a visual field or more than
five degrees and less than 20 degrees.
Women’s Events Men’s Events
-48kg -60kg
-52kg -66kg
-57kg -73kg
-63kg -81kg
-70kg -90kg
+70kg -100kg
+100kg
PowerliftingPowerlifting (10 women’s events, 10 men’s events) –
Powerlifting was first included on the Paralympic
program at the 1964 Games (as weightlifting) for men
with spinal injuries. The competition today includes
athletes with spinal injuries, but also athletes with
cerebral palsy, amputees, and les autres. Women
began competing in powerlifting at the 2000 Games.
Athletes compete divided by weight categories. For
more on the sport, see www.paralympic.org/release/
Summer_Sports/Powerlifting/About_the_sport
For more on the classification system used in
powerlifting, see www.paralympic.org/release/
Summer_Sports/Powerlifting/About_the_sport/
Classification
Women’s Events Men’s Events
40kg 48kg
44kg 52kg
48kg 56kg
52kg 60kg
56kg 67.50kg
60kg 75kg
67.50kg 82.50kg
75kg 90kg
82.50kg 100kg
+82.50kg +100kg
61Women in the 2000, 2004 and 2008 Olympic and Paralympic Games: An Analysis of Participation, Leadership and Media Opportunities 61
(INAS) criteria
Neurological impairment causing loss of ankle flexion
and extension
Amputee a) one single foot amputation
b) 3 fingers hand amputation
Cerebral palsy CP8 (Cerebral Palsy International Sport
and Recreation Association
(CP–ISRA) classes.
Mixed Events
Single Sculls- AW1x
Single Sculls-AM1x
Double Sculls-TAMix2x
Coxed Four-LTAMix4+
SailingSailing (three mixed events) – Sailing is a mixed event
at the Paralympic Games and was first on the program
in 2000. The sport is open to athletes with cerebral
palsy, blindness/visual impairment, spinal cord injuries,
amputees, and les autres. For more on the sport see
www.paralympic.org/release/Summer_Sports/Sailing/
About_the_sport For more on the classification
system used in sailing, see www.paralympic.org/
release/Summer_Sports/Sailing/About_the_sport/
Classification
Mixed Events
Single-Person Keelboat (2.4mR)
Two-Person Keelboat (SKUD18)
Three-person Keelboat (Sonar)
ShootingShooting (three women’s events, three men’s events,
six mixed events) – Shooting has been included
on the program since the 1976 Paralympic Games.
Athletes are classified into three classes: SH1, SH2 and
SH3, and in two categories, standing and wheelchair.
Females and males compete separately and in
mixed events.
RowingRowing (four mixed events) – The 2008 Games mark
the first time the sport of rowing will be offered at
the Paralympic Games. According to the IPC Web
site, the sport is for “athletes with a disability who
meet the criteria as set out in the Adaptive Rowing
classification regulations. ‘Adaptive’ implies that the
equipment is ‘adapted’ to the user to practice the
sport, rather than the sport being ‘adapted’ to the
user.” Female and male athletes compete in mixed
events. For more on the sport, see www.paralympic.
org/release/Summer_Sports/Rowing/About_
the_sport
The information below comes directly from the IPC
Web site (www.paralympic.org/release/Summer_
Sports/Rowing/About_the_sport/Classification/
Classification_Visa_Guidelines_-_FISA_-_2005.pdf)
LTA 4+ (leg, trunk and arms)
Blind 10% of vision in best eye with best correction
(from visual acuity above 2/60 up to visual acuity of
6/60 and/or a visual field of more than 5% and less
Neurological impairment equivalent to a spinal cord of
complete lesion of L4
TA 2x (trunk and arm)
Amputee bilateral above knee
Cerebral palsy CP5 (diplegic)
A 1x (arm)
Cerebral palsy CP4
Neurological impairment equivalent to a spinal cord of
complete lesion of T10
Note: hands and abdomen strapping shall be allowed.
Intellectual impairment International Sports
Federation for Person with an Intellectual Disability

A Women’s Sports Foundation Research Report62 A Women’s Sports Foundation Research Report62
SH1: Athletes competing in pistol and rifle events who
do not require a shooting stand.
SH2: Athletes competing in rifle events who “have no
ability to support the weight of the firearm with their
arms and therefore require a shooting stand.”
SH3: Athletes competing in rifle events who have
visual impairment.
For more on the classifications used in shooting,
see www.paralympic.org/release/Summer_Sports/
Shooting/About_the_sport/Classification
Women’s Events Men’s Events
R2-10m Air Rifle Standing-SH1 P1-10m Air Pistol-SH1
P2-10m Air Pistol-SH1 R1-10m Air Rifle Standing-SH1
R8-50m Sport Rifle 3x20-SH1 R7-50m Free Rifle 3x40-SH1
Mixed events
R5-10m Air Rifle Prone-SH2
P3-25m Sport Pistol- SH1
R3-10m Air Rifle Prone-SH1
R4-10m Air Rifle Standing-SH2
R6-50m Free Rifle Prone-SH1
P4-50m Free Pistol-SH1
SwimmingSwimming (59 women’s events, 81 men’s events) –
Swimming has been a part of the Paralympic Games
since their inception in 1960. Strokes and various
distances have been added over the years. For
example, in 1968, the 100m Breastroke was added
to the program and four year later, the 100m
Backstroke was added. Classifications have also been
added over the years. Female and male swimmers
compete in classifications based on their functional
ability; the higher the number of the class, the
lower the disability. There are 10 classes (S1-S10) in
freestyle, backstroke and butterfly; three classes in
the individual medley (SM1-SM10); and nine classes
(SN1-SB9) in breaststroke. Additionally, athletes with
visual impairment compete in three classes depending
on the degree of vision loss (S11, no sight to S13
legally blind). These athletes compete in a limited
number of events. For more on the classifications
used in shooting, see www.paralympic.org/release/
Summer_Sports/Swimming/About_the_sport
Women’s Events Men’s Events
50m Backstroke-S2 50m Backstroke-S1
50m Backstroke-S3 50m Backstroke-S2
50m Backstroke-S5 50m Backstroke-S3
50m Backstroke-S4
50m Backstroke-S5
100m Backstroke-S6 100m Backstroke-S6
100m Backstroke-S7 100m Backstroke-S7
100m Backstroke-S8 100m Backstroke-S8
100m Backstroke-S9 100m Backstroke-S9
100m Backstroke-S10 100m Backstroke-S10
100m Backstroke-S13 100m Backstroke-S11
100m Backstroke-S12
100m Backstroke-S13
Women’s Events Men’s Events
100m Breaststroke-SB4 50m Breaststroke-SB3
100m Breaststroke-SB5 100m Breaststroke-SB4
100m Breaststroke-SB6 100m Breaststroke-SB5
100m Breaststroke-SB7 100m Breaststroke-SB6
100m Breaststroke-SB8 100m Breaststroke-SB7
100m Breaststroke-SB9 100m Breaststroke-SB8
100m Breaststroke-SB12 100m Breaststroke-SB9
100m Breaststroke-SB11
100m Breaststroke-SB12
100m Breaststroke-SB13
50m Butterfly-S6 50m Butterfly-S5
50m Butterfly-S7 50m Butterfly-S6
50m Butterfly-S7
100m Butterfly-S8 100m Butterfly-S8
100m Butterfly-S9 100m Butterfly-S9
100m Butterfly-S10 100m Butterfly-S10
100m Butterfly-S12 100m Butterfly-S11
100m Butterfly-S13 100m Butterfly-S12
100m Butterfly-S13
50m Freestyle-S3 50m Freestyle-S2
50m Freestyle-S4 50m Freestyle-S3
50m Freestyle-S5 50m Freestyle-S4
50m Freestyle-S6 50m Freestyle-S5
50m Freestyle-S7 50m Freestyle-S6
50m Freestyle-S8 50m Freestyle-S7
50m Freestyle-S9 50m Freestyle-S8
50m Freestyle-S10 50m Freestyle-S9
50m Freestyle-S11 50m Freestyle-S10
50m Freestyle-S12 50m Freestyle-S11
50m Freestyle-S13 50m Freestyle-S12
50m Freestyle-S13
100m Freestyle-S4 100m Freestyle-S2
100m Freestyle-S5 100m Freestyle-S3
100m Freestyle-S6 100m Freestyle-S4
100m Freestyle-S7 100m Freestyle-S5
100m Freestyle-S8 100m Freestyle-S6
63Women in the 2000, 2004 and 2008 Olympic and Paralympic Games: An Analysis of Participation, Leadership and Media Opportunities 63
Women’s Events Men’s Events
Singles F1-2 Singles M1
Singles F3 Singles M2
Singles F4 Singles M3
Singles F5 Singles M4-5
Singles F6-7 Singles M6
Singles F8 Singles M7
Singles F9 Singles M8
Singles F10 Singles M9-10
Team F1-3 Team M1-2
Team F4-5 Team M3
Team F6-10 Team M4-5
Team M6-8
Team M9-10
Volleyball (Sitting)Volleyball (Sitting) (one women’s event, one men’s
event) – Men have been competing in volleyball
(sitting) in the Paralympic Games since 1980, while
women’s first volleyball competition at the Games
came in 2004. The classification system establishes
a “minimum degree of disability.” For a thorough
explanation of the classification system used in
volleyball (sitting), please see www.paralympic.org/
release/Summer_Sports/Volleyball/About_the_sport/
Classification
Wheelchair Basketball Wheelchair Basketball (one women’s event, one
men’s event) – Wheelchair basketball was one of the
initial sports offered at the first Paralympic Games
in 1960. Women have been competing in wheelchair
basketball since 1968. Athletes are assigned a point
value based on their functional ability (ranging
between 0.5 for most severely disabled to 4.5).
The team total can not exceed 14 points. For more
on the classification system used in wheelchair
basketball, see www.paralympic.org/release/Summer_
Sports/Wheelchair_Basketball/About_the_sport/
Classification
Wheelchair FencingWheelchair Fencing (four women’s events, six men’s
events) – Wheelchair fencing has been included as a
Paralympic sport for female and male athletes since
the inaugural 1960 Games. Athletes with a spinal
injury, an amputation, or cerebral palsy compete in
female, male, and mixed events. For more on the
Women’s Events Men’s Events
100m Freestyle-S9 100m Freestyle-S7
100m Freestyle-S10 100m Freestyle-S8
100m Freestyle-S11 100m Freestyle-S9
100m Freestyle-S12 100m Freestyle-S10
100m Freestyle-S13 100m Freestyle-S11
100m Freestyle-S12
100m Freestyle-S13
200m Freestyle-S5 200m Freestyle-S2
200m Freestyle-S3
200m Freestyle-S4
200m Freestyle-S5
400m Freestyle-S6 400m Freestyle-S6
400m Freestyle-S7 400m Freestyle-S7
400m Freestyle-S8 400m Freestyle-S8
400m Freestyle-S9 400m Freestyle-S9
400M Freestyle-S10 400m Freestyle-S10
400m Freestyle-S13 400m Freestyle-S11
400m Freestyle-S12
400m Freestyle-S13
150m IM-SM4 150m IM-SM4
200m IM-SM6 200m IM-SM5
200m IM-SM7 200m IM-SM6
200m IM-SM8 200m IM-SM7
200m IM-SM9 200m IM-SM8
200m IM-SM10 200m IM-SM9
200m IM-SM12 200m IM-SM10
200m IM-SM13 200m IM-SM12
200m IM-SM13
4x50m Freestyle Relay – 20pts
4x100m Freestyle Relay – 34pts
4x50m Medley Relay – 20 pts
4x100m Medley Relay – 34 pts
Table TennisTable Tennis (11 women’s events, 13 men’s events) –
Table tennis was one of the inaugural sports in the
1960 Paralympic Games. Athletes compete in 10
classifications (TT1-TT10). Classes 1-5 refer to athletes
competing in wheelchairs, Classes 6-10 refer to athlete
who compete standing. For more on classifications
used in table tennis, see www.paralympic.org/
release/Summer_Sports/Table_Tennis/About_
the_sport/Classification
A Women’s Sports Foundation Research Report64 A Women’s Sports Foundation Research Report64
Wheelchair TennisWheelchair Tennis (two women’s events, two men’s
events, two mixed events) – Wheelchair tennis was
introduced to the Paralympic Games program in 1988
with singles competition offered. Doubles competition
was offered four years later. Athletes compete in
female, male, and mixed events. According to the IPC
Web site, “The eligibility requirement for men’s and
women’s events is a permanent substantial or total
loss of function in one or both legs due to conditions
such as spinal injury, ankylosis, amputation or other
lower limb disability.” In the quad division, an athlete
must have a disability in three or more limbs. For more
on the classification system used in wheelchair tennis,
seewww.paralympic.org/release/Summer_Sports/
Wheelchair_Tennis/About_the_sport/Classification
Women’s Events Men’s Events
Singles Singles
Doubles Doubles
Mixed events
Quad Singles
Quad Doubles
Sources: Beijing 2008 Paralympic Games, Competition Schedule Day
Schedule by Sport, www.paralympic.org/release/Main_Sections_Menu/
Paralympic_Games/Beijing_2008/Competition_Schedule_V3.1_080314.
pdf; Participation and Medalist Reports, www.paralympic.org/release/
Main_Sections_Menu/Sports/Results/paralympics_search_form.html
classification system used in wheelchair fencing,
see www.paralympic.org/release/Summer_Sports/
Wheelchair_Fencing/About_the_sport/Classification
Women’s Events Men’s Events
Foil Individual Category A Foil Individual Category A
Foil Individual Category B Foil Individual Category B
Epee Individual Category A Epee Individual Category A
Epee Individual Category B Epee Individual Category B
Sabre Individual Category A
Sabre Individual Category B
Wheelchair RugbyWheelchair Rugby (one mixed event) – Wheelchair
rugby is a mixed sport that has been included on the
program since the 1996 Games. Athletes are assigned
a point value based on their functional ability (ranging
from 0.5 most severely disabled to 3.5). Team totals
can not exceed 8 points. For more on the sport,
see www.paralympic.org/release/Summer_Sports/
Wheelchair_Rugby/About_the_sport
For more on the classification system used in
wheelchair rugby, see www.paralympic.org/release/
Summer_Sports/Wheelchair_Rugby/About_the_
sport/Classification

65Women in the 2000, 2004 and 2008 Olympic and Paralympic Games: An Analysis of Participation, Leadership and Media Opportunities 65
ReferencesAround the Rings. (2008). Beijing Olympics become most-viewed event in U.S.
TV history, www.aroundtherings.com/articles/view.aspx?id=30582. Retrieved
Oct. 14, 2008.
Barney, R.K., Wenn, S.R., & Martyn, S.G. (2002). Selling the five rings: The
International Olympic Committee and the rise of Olympic commercialism. Salt Lake
City: The University of Utah Press.
Cahn, S.K. (1995). Coming on strong: Gender and sexuality in 20th century women’s
sport. Cambridge: Harvard University Press.
Billings, A. C. (2008) Clocking gender differences: Televised Olympic clock time
in the 1996-2006 Summer and Winter Olympics. Television & New Media, 9(5),
429-441.
Billings, A. C. (2007). From diving boards to pole vaults: Gendered athlete
portrayals in the ‘Big Four’ sports at the 2004 Athens Summer Olympics. Southern
Communications Journal, 72(4), 329-344.
Billings, A. C., & Angelini, J. R. (2007). Packaging the Games for viewer
consumption: Gender, ethnicity and nationality in NBC’s coverage of the 2004
Summer Olympics. Communication Quarterly, 55(1), 95-111.
Clarey, C. (2009, August 13). Women’s Boxing Added for 2012 Olympics. New
York Times. www.nytimes.com/2009/08/14/sports/14olympics.html. Retrieved
Aug. 30, 2009.
Conrad, M. (2005). The business of sports: a primer for journalists. Routledge.
DePauw, K.P., & Gavron, S.J. (2005). Disability sport, 2nd Edition. Champaign, IL:
Human Kinetics.
Ex-baseball commissioner gets USOC post. (15 June 2004). ESPN.com,
http://sports.espn.go.com/oly/news/story?id=1821769. Retrieved June 18, 2008.
Findling, J.E., & Pelle, K.D. (1996). Historical dictionary of the Modern Olympic
Movement. Westport, CT: Greenwood Press.
Harley, J (15 March 2004). USOC Acting President is recipient of prestigious trophy.
www.olympic-usa.org/11709_14345.htm. Retrieved June 18, 2008.
Henry, B., & Yeomans, P.H. (1984). An approved history of the Olympic Games.
Sherman Oaks, CA: Alfred Publishing, Co., Inc.
Higgs, C. T., Weiller, K. H., & Martin, S. B. (2003). Gender bias in the 1996 Olympic
Games: A comparative analysis. Journal of Sport and Social Issues, 27(1), 52-64.
A Women’s Sports Foundation Research Report66
International Olympic Committee. (2008). 4th IOC world conference on women
and sport: Dead Sea plan of action. http://multimedia.olympic.org/pdf/en_
report_1299.pdf. Retrieved April 2, 2008.
International Olympic Committee. (2007). Fact sheet, IOC members, February
2007. http://multimedia.olympic.org/pdf/en_report_955.pdf. Retrieved
March 2, 2008.
International Olympic Committee. (2007). Olympic fact sheet. Women in the
Olympic movement. http://multimedia.olympic.org/pdf/en_report_846.pdf.
Retrieved March 2, 2008.
International Olympic Committee. (2007). Participation par continent CNO et sexe
aux Jeux Olympiques d’été 1896-2004 – fre (2). Received personal communication
with Olympic Studies Centre.
International Olympic Committee. (2006). Fact sheet: Women in the Olympic
movement – Key figures. http://multimedia.olympic.org/pdf/en_report_992.pdf.
Retrieved March 2, 2008.
International Olympic Committee. (2006). Programme of the Games of the XXIX
Olympiad, Beijing 2008. http://multimedia.olympic.org/pdf/en_report_1056.pdf.
Retrieved Jan. 29, 2008.
International Olympic Committee. (2005). Official Report of the XXVIII Olympiad.
Volumes I and II. www.la84foundation.org/6oic/OfficialReports/2004/or2004a.
pdf, www.la84foundation.org/6oic/OfficialReports/2004/or2004b.pdf. Retrieved
Jan. 29, 2008.
International Olympic Committee. (2005). Olympic Programme Commission.
Report to the 117th IOC Session. http://multimedia.olympic.org/pdf/en_report_953.
pdf. Retrieved March 2, 2008.
International Olympic Committee. (2005). Report: Women Participation at the
Games of the XXVIIIE Olympiad, Athens 2004, Statistics. International Olympic
Committee. (2002). Comparative Evolution of Women’s Participation in the
Olympic Games. http://multimedia.olympic.org/pdf/en_report_1000.pdf. Retrieved
April 2, 2008.
International Olympic Committee. (2004). III world conference on women and
sport: New strategies, new commitments. www.olympic.org/uk/news/olympic_
news/full_story_uk.asp?id=346. Retrieved March 2, 2008.
International Olympic Committee. (2002). Comparative Evolution of Women’s
Participation in the Olympic Games. http://multimedia.olympic.org/pdf/en_
report_206.pdf; Updated as Women’s Participation, http://multimedia.olympic.org/
pdf/en_report_993.pdf. Retrieved April 2, 2008
67Women in the 2000, 2004 and 2008 Olympic and Paralympic Games: An Analysis of Participation, Leadership and Media Opportunities
.
International Olympic Committee. (2000). Resolution of the 2nd IOC world
conference on women and sport. http://multimedia.olympic.org/pdf/en_report_757.
pdf. Retrieved March 2, 2008.
International Olympic Committee. (1999). Minutes of the 109th Session of the IOC,
Seoul, 17-20 June 1999. Olympic Studies Centre, Lausanne, Switzerland.
International Olympic Committee. (1998). Minutes of the 107th Session of the IOC,
Nagano, 3-5 February 1998.
Messner, M. A., Duncan, M. C., & Cooky, C. (2003). Silence, sports bras, and
wrestling porn: Women in televised sports news and highlights shows. Journal of
Sport and Social Issues, 27(1), 38-51.
Olympic Studies Centre, Lausanne, Switzerland.
International Olympic Committee. (1997). Minutes of the 106th Session of the IOC,
Lausanne, 3-6 September 1997. Olympic Studies Centre, Lausanne, Switzerland.
International Olympic Committee. (1996). IOC world conference on women
and sport: Resolution of the 1st IOC world conference on women and sport.
http://multimedia.olympic.org/pdf/en_report_756.pdf. Retrieved March 2, 2008.
International Olympic Committee. (1996). Minutes of the 105th Session of the IOC,
Atlanta, 15-18 July 1996. Olympic Studies Centre, Lausanne, Switzerland.
“Iran: Female athletes fear constraints will hamper Olympic hopes.” (2008, March
20). http://islamizationwatch.blogspot.com/2008/03/iran-female-athletes-fear-
contraints.html. Retrieved April 8, 2008.
“Islamic women making history in Athens.” (2004, August 20). http://nbcsports.
msnbc.com/id/5773347/print/1/displaymode/1098. Retrieved April 8, 2008.
Michaelis, V. (2009, July 8). Baseball, softball bumped from Olympics. USA Today.
www.usatoday.com/sports/olympics/2005-07-08-baseball-softball-dropped_x.htm.
Retrieved Aug. 1, 2008
Moore, K. (2004, August 6). Olympics 2004: Muslim women athletes move
ahead, but don’t leave faith behind. www.rferl.org/content/article/1054205.html.
Retrieved April 8, 2008.
NBC Olympics. (2008). NBC Universal presents the Games of the XXIX Olympiad.
www.nbcolympics.com/tv_and_online_listings/index.html. Retrieved Oct. 14, 2008.
NBC Universal Media Village. (2008). NBC’s coverage of the Beijing Olympics
delivers the most dominant primetime week in people meter history. www.nbcumv.
com/release_detail.nbc/entertainment-20080819000000-nbc039scoverage.html.
Retrieved Oct. 14, 2008.
A Women’s Sports Foundation Research Report68
Oglesby, C., & the International Working Group on Women and Sport and
WomenSport International (2008). Women 2000 and beyond. Women, gender
equality and sport. www.sportsbiz.bz/womensportinternational/initiatives/
documents/Women_2000_Report.pdf. Retrieved April 1, 2008.
Schell, L.A., & Duncan, M.D. (1999). A content analysis of CBS’ coverage of the 1996
Paralympic Games. Adapted Physical Activity Quarterly, 16, 27-47.
Taheri, A. (2004, August 18). Muslim women play only an incidental part in
the Olympics. Gulf News. www.benadorassociates.com/article/6651. Retrieved
April 8, 2008
Thomas, K. (27 June 2009). Wrenching shake-up of the U.S. Olympic Committee,
New York Times, SP1.
Tucker Center for Research on Girls & Women in Sport. (2007, December). The
2007 Tucker Center Research Report, Developing physically active girls: An
evidence-based multidisciplinary approach. www.tuckercenter.org/projects/tcrr/
default.html. Retrieved April 10, 2008.
Tuggle, C. A., Huffman, S., & Rosengard, D. S. (2002). A descriptive analysis of
NBC’s coverage of the 2000 Summer Olympics. Mass Communications & Society,
5(3), 361-375.
United Nations Department of Economic and Social Affairs. (2008). Article 30:
Participation in cultural life, recreation, leisure and sport. Rights and Dignities of
Persons with Disabilities Convention. www.un.org/disabilities/default.asp?id=290.
Retrieved April 24, 2008.
United States Olympic Committee elects Marty Mankamyer as its President.
(15 August 2002). www.avca.org/news/Marty-NW8-21-02.html. Retrieved
June 18, 2008.
United States Olympic Committee. (2006). 2006 Paralympic Winter Games US
team media guide. www.usocpressbox.org. Retrieved April 10, 2008.
USOC United States Olympic Team Roster by Sport (Final), August 15, 2004.
(2004). www.usocpressbox.org. Retrieved March 12, 2004.
USOC. (2008). Personal communication from Rana Dershowitz of the USOC,
May 9, 2008.
Wallechinsky, D. (2004). The complete book of the Olympics: Athens 2004 edition.
Wilmington, DE: Sport Media Publications.

69Women in the 2000, 2004 and 2008 Olympic and Paralympic Games: An Analysis of Participation, Leadership and Media Opportunities
Walseth, K., & Fasting, K. (2003). Islam’s view on physical activity and sport.
International Review for the Sociology of Sport, 38(1): 45-60.
Zinser, L. (2009, July 9). IOC Drops Baseball and Softball in 2012. New York Times.
www.nytimes.com/2005/07/09/sports/othersports/09olympic.html. Retrieved
Aug. 1, 2009.
Zurn, L., Lopiano, D., & Snyder, M. (2006). Women in the 2006 Olympic and
Paralympic Winter Games: An Analysis of Participation, Leadership and Media
Coverage. East Meadow, NY: Women’s Sports Foundation.
Web sitesInternational Olympic Committee: www.olympic.org/uk/index_uk.asp
International Paralympic Committee: www.paralympic.org/release/Main_Sections_
Menu/index.html
Paralympic Games Results: www.paralympic.org/release/Main_Sections_Menu/
Sports/Results/paralympics_search_form.html


About the Women’s Sports FoundationThe Women’s Sports Foundation—the leading authority on
the participation of women and girls in sports—advocates
for equality, educates the public, conducts research and
offers grants to promote sports and physical activity for
girls and women.
Founded by Billie Jean King in 1974, the Women’s Sports
Foundation builds on her legacy as a champion athlete,
advocate of social justice and agent of change. We strive
for gender equity and fight discrimination in all aspects
of athletics.
Our work shapes public attitude about women’s sports and
athletes, builds capacities for organizations that get girls
active, provides equal opportunities for girls and women,
and supports physically and emotionally healthy lifestyles.
The Women’s Sports Foundation is recognized worldwide
for its leadership, vision, strength, expertise and influence.
For more information, please call the Women’s
Sports Foundation at 800.227.3988 or visit
www.WomensSportsFoundation.org.
A Women’s Sports Foundation Research Report
Women’s Sports Foundation founded by Billie Jean King
Eisenhower Park 1899 Hempstead Turnpike, Suite 400 East Meadow, New York 11554 t 516.542.4700 • [email protected] www.WomensSportsFoundation.org


