271
kassel university press Dionisius Yusuf Women Migrant Street Food Vendors in Tangerang (Indonesia) and Hat Yai (Thailand): Family, Labour and Income
kasseluniversity
press
Dionisius Yusuf
Women Migrant Street Food
Vendors in Tangerang (Indonesia)
and Hat Yai (Thailand): Family,
Labour and Income

Dionisius Yusuf
Women Migrant Street Food Vendors in
Tangerang (Indonesia) and Hat Yai (Thailand):
Family, Labour, and Income
kasseluniversity
press
This work has been accepted by Faculty of Organic Agricultural Sciences of the University of Kassel as a thesis for acquiring the academic degree of Doktor der Agrarwissenschaften (Dr.-agr.).
Supervisor: Prof. Dr. Werner Troßbach Co-Supervisor: Prof. Dr. Barbara Freytag-Leyer
Defense day: 14th February 2020
This document – excluding quotations and otherwise identified parts – is licensed under the Creative Commons Attribution-Share Alike 4.0 International License (CC BY-SA 4.0: https://creativecommons.org/licenses/by-sa/4.0/)
https://orcid.org/0000-0002-8213-3151 (Dionisius Yusuf)
Bibliographic information published by Deutsche Nationalbibliothek The Deutsche Nationalbibliothek lists this publication in the Deutsche Nationalbibliografie; detailed bibliographic data is available in the Internet at http://dnb.dnb.de.
Zugl.: Witzenhausen, Univ., Diss. 2020 ISBN 978-3-7376-0893-0 DOI: https://dx.doi.org/doi:10.17170/kobra-202009221838
© 2020, kassel university press, Kassel http://kup.uni-kassel.de
Printed in Germany

iii
Acknowledgment
I would like to express my gratitude to my supervisor, Prof. Dr. Werner Trossbach for his
valuable advice, and critical comments from the initial stage of developing the proposal to
the production of this dissertation. Furthermore, I would like to address my sincere thanks to
my co‐supervisor, Prof. Dr. Barbara Freytag‐Leyer for her full support that she offered to me
from the beginning to the end of submitting my dissertation.
I would like to thank all my former street food traders in Tangerang and Hat Yai for their
willingness to participate in my research. I am highly indebted to those respondents for
accepting to participate in the study, without them the study would not have been possible.
I also express my appreciation to the Consulate of the Republic of Indonesia Songkla for
allowing me to collaborate with one of their staff, Mr. Suwit Binwang in conducting research
and I am sincerely indebted to all research assistants for their help and support ensures
smooth and successful data collection in Hat Yai and Tangerang.
I would also acknowledge the financial support for my PhD from KAAD (Der Katholische
Akademische Ausländerdienst) and STIBET scholarship. I also thank Podomoro University
Jakarta for allowing me to pursue my study abroad.
As always, my family remains a primary source of my inspiration, therefore my overwhelming
thanks goes to my beloved mother and father and my brothers for their love and
encouragement that kept me moving. May God bless you abundantly. It is difficult to mention
every individual who helped me by name, but I appreciate and express my sincere gratitude
to all people who in one way or the other contributed to successful completion of the study.
iv
Abstract
The present study deals with the issues of family, income, livelihoods, and the patterns of
employment of women migrants in the street food sector in Indonesia and Thailand. Based
on a sample of 200 women street food vendors in Tangerang city and 96 in Hat Yai city the
study employed a variety of methods in gathering the data. The cities were specifically
selected due to rapidly increasing numbers of street food vendors. To select the respondents,
purposive sampling technique was used. The "triangulation" research approach was adapted
in which survey questionnaires, personal interviews (biography interviews) and observations
of the researcher were used to collect data. 14 vendors from Tangerang and six vendors from
Hat Yai were enlisted as research participants for biographical interviews. Quantitative data
was analyzed using percentages, bivariate analysis, Pearson and Chi‐square analysis.
Among the women street food vendors, the age‐groups of 20 to 50 years old make up the
dominant group in Tangerang as well as in Hat Yai. Unlike Tangerang’s vendors, most Hat Yai’s
vendors were reasonably educated; a few even highly educated (high school and above).
Most vendors in both areas have been in the street business for more than nine years. These
results indicate that street vendor business activities are no longer a side job. Nevertheless,
the vendors still face serious security problems, especially in Tangerang where in a majority
of cases the vending locations have not been legalised by the local authorities. In turn, many
vendors have to pay a “fee” to local thugs. However, unlike Tangerang, 24.0% of Hat Yai’s
vendors operate their business in government market stores and pay monthly rental fees to
the local government.
As calculated by the researcher, the average daily income of women street food vendors in
Tangerang was at least two times higher than the official minimum wage earned by formal
sector workers, while in Hat Yai it was three times higher. However, the study pointed out
that the street food sectors in both study locations have a strongly disproportionate income
distribution, indicated by a Gini coefficient of 0.363 (Hat Yai) and 0.442 (Tangerang). The
v
linear regression model reveals that two independent variables, education and initial working
capital, are positively correlated to the daily income of street food vendors in Hat Yai, one,
the number of children, is negatively correlated. In Tangerang, the amount of initial working
capital and business experience have a significantly positive impact on the vendors’ income
level.
The study found out that 39.0% of the vendors in Tangerang and 42.8% of the vendors in Hat
Yai were the sole breadwinners in their households. An additional number have become the
main breadwinners due to low and volatile incomes of their husbands. Accordingly, in terms
of social capital, equally in the two cities, the vendors’ reputation has sharply increased
among their families and communities since they started to trade the street food business.
However, in the eyes of families and neighbourhoods, the appreciation of women working
outside the family is dependent on the supposition, that their so‐called responsibilities as
housewives and mothers have been carried out. Accordingly, in general, the women vendors
are still much more involved in doing domestic works than their male partners. However, the
study also showed that in Hat Yai a rising education level enables a number of vendors to
convince their husbands to enhance their domestic activities.
The following recommendations are suggested: The practice of giving street food vendors a
trading license, as already started in Hat Yai should be continued and immediately be adopted
in Tangerang. For the next steps on this way to at least a partial formalization of the informal
sector it would be crucial – from the authorities’ side – to acknowledge the vendors as
partners, not as objects, as it is at the moment. Generally, the authorities should take into
account that many women, even the less educated, have brilliant ideas but do not have the
capital and facilities to work on them. Consequently, to facilitate the access to loans, a locally
based fund should be issued, financed by local companies of the formal economy and the
high‐earning members of the vendors’ community. Furthermore, training courses should be
provided in various fields, such as business organization, accounting and especially hygiene,
the latter to become mandatory. Schools and universities are called upon to help. The

vi
vendors’ husbands should be addressed, too, in order to make the street food business more
beneficial to the community, the customers, and the vendors’ families.
vii
Table of Contents
Acknowledgment iii
Abstract iv
List of Tables xii
List of Figures xvii
List of Abbreviations xviii
CHAPTER I
Introduction 1
1. Background of the Study 1
1.1. Rural‐Urban Migration 1
1.2. The Informal Economy – Academic Perceptions of Grassroot Activities 4
1.3. Street Food Vending as a Prominent Sector of the Informal Economy 6
2. Characteristics of the Street Food Sector in Developing Countries – a Literature Review 8
2.1. Families and Individuals: Female Domination 10
2.2. Education Levels of Women Street Food Vendors 11
2.3. Working Conditions 12
2.4. Legal Issues 13
2.5. Socio‐economic Conditions of Women Street Food Vendors 15
2.5.1. Investment Costs 15
2.5.2. Fees for Permits and Rent 16
2.5.3. Income 18
2.5.3.1. Savings 19
2.5.3.2. Remittances 20
2.5.3.3. Determinants of Income Levels 21
2.6. Women as the Households’ (Main) Breadwinners 22
2.7. Gender (In)equality in Household Chores 24
3. Research Questions 25
viii
4. Scope of the Comparison 27
5. Hypotheses 32
CHAPTER II
Research Methods 34
1. Selection of the Study Areas and Respondents 34
1.1. Selection of the Study Areas 34
1.2. The Respondents on the Site 38
2. Sampling Method and Sample Size 39
3. Type and Data Sources 40
4. Research Methods and Designs 40
4.1. Quantitative Approach 41
4.2. Qualitative Approach 42
4.3. The Mixed Methods Research 42
4.4. Triangulation Design 43
5. Data Collection Instruments and Methods 44
5.1. Data Collection Instruments 44
5.1.1. Questionnaire Survey 44
5.1.2. Semi‐Structured Interviews 46
5.2. Methods of Data Collection 46
5.2.1. Pre‐Survey Phase 46
5.2.2. Survey Phase 48
5.2.3. Personal Biographical Narrative 51
5.3. Data processing and analysis methods 55

ix
CHAPTER III
Demographic Features of Women Street Food Vendors 57
1. Age Distribution 57
2. Marital Status and Household Profiles 61
3. Ethnicity 65
4. Religious Affiliation 66
5. Educational Level 67
6. Summary 70
CHAPTER IV
Causes and Consequences of Women Street Food Vendors Migration 72
1. Pattern and Process of Migration 73
1.1. Origin of the Women Migrants 73
1.2. Year of Migration 77
1.3. Decision Makers in Migration 80
1.4. The Main Source of Information 83
1.5. Occupations of Women Street Food Vendors before Migrating 85
2. Causes of Migration 86
2.1. Push Factors 87
2.2. Pull Factors 88
3. Belonging to the Community of People from the Previous Place of Residence 89
4. Future Plans of Women Migrants 90
5. Summary 91
CHAPTER V
Labour: Working conditions and Pre‐Conditions 93
1. Employment Biographies 93
1.1. Duration of Food Vending Experience 93
1.2. Employment Biographies before Starting the Current Business – in the Host Area 95

x
1.3. Business Experience before Operating Food Vending 98
1.4. Start Support 101
2. Working Conditions of Street Food Vendors 105
2.1. Average Working Hours 105
2.2. Employment of Wage Labour 107
2.3. Commuting between Residence and Workplace 110
2.4. The Vendors’ Attitude towards their Customers ‐ and Vice Versa 112
3. Degree of Social Protection 113
3.1. General 114
3.2. Health 115
4. Summary 118
CHAPTER VI
Access to Basic Resources: Startup‐Capital, Location, Facilities 120
1. Initial Working Capital 121
2. Location 131
2.1. Economic Aspects 131
2.2. Legal Aspects 138
2.2.1. Starting a Business ‐ Finding a Favourite Place 138
2.2.2. Squeezed between Landowners, Local Authorities and “Informal Leaders”: The Current
Situation 139
2.2.2.1. Tangerang 139
2.2.2.2. Hat Yai 146
3. Access to Facilities 150
4. The Financial Impact of Fees and Charges 153
5. Summary 156

xi
CHAPTER VII 15
Socio‐Economic and Livelihood Conditions of Women Street Food Vendors 158
1. Income Levels of Street Food Vendors 158
1.1. Average Earnings of Street Food Vendors 158
1.2. Income Determinants in the Street Food Business 166
1.3. A Success Story? Initial and Current Income 170
2. Gaining a Family Livelihood: Contributions of the Street Food Business 171
2.1. The Use of the Money Earned: An Overview 171
2.2. The Livelihood Approach: A Tool to Measure Economic Success 172
2.2.1. Physical Capital and Housing 174
2.2.2. Financial Capital 175
2.2.2.1. Savings 176
2.2.2.2. Remittances 179
2.2.3. Social Capital: Women’s Role as the Main Breadwinners 186
3. Summary 191
CHAPTER VIII
Gender (In)equality: Household Division of Labour in the Family 193
1. Types of Family Structures 193
2. Division of Household Chores 194
2.1. Nuclear Families 196
2.2. Extended Families 203
3. Methodological Reservations 207
4. Summary 207
CHAPTER IX
Conclusion and Recommendations 209
1. Hypotheses and conclusions 209
2. Hat Yai and Tangerang: Similarities and Differences 218

xii
3. Recommendations 221
3.1. Create “Security through Partnership” on the Local Level 221
3.2. Launch a Locally Based Fund to Improve Financing 223
3.3. Provide Training Programs 224
4. Limitations of the Study 225
References 227
Appendix 246
xiii
List of Tables
Table 2‐1. Total number of female street food vendors by sub‐district in Tangerang 38
Table 2‐2. Total number of female street food respondents by tambon in Hat Yai 38
Table 2‐3. Geographical spreading sample selection in Tangerang and Hat Yai cities 40
Table 3‐1. Street food vendors’ age structure by study areas (in percentage) 57
Table 3‐2. Cross tabulation between age‐groups of vendors and age of street food business 60
Table 3‐3. Correlation between age‐groups and age of business across study locations 60
Table 3‐4. Cross‐tabulation of age‐groups and levels of education 61
Table 3‐5. Correlation between age‐groups and level of education across study locations 61
Table 3‐6. Marital status of street food vendors (in percentage) 62
Table 3‐7. Chi‐square, χ2, ɸ and Cramer's V tests between marital status and study areas 62
Table 3‐8. Street food vendors’ household members living in the house by study areas 63
Table 3‐9. Street food vendors’ number of children by study areas (in percentage) 64
Table 3‐10. Correlation between number of children and religion and education levels 64
Table 3‐11. Street food vendors live with whom by study areas (in percentage) 65
Table 3‐12. Ethnic Affiliation of Tangerang’s street food vendors (n=200) 65
Table 3‐13. Ethnic Affiliation of Hat Yai’s street food vendors (n=96) 66
Table 3‐14. Religious affiliation distribution of street food vendors in the study locations 67
Table 3‐15. The education level of street food vendors by study locations (in percentage) 68
Table 3‐16. Chi‐square, χ2, ɸ and Cramer's V tests between education level and study locations 69
Table 4‐1. The place of origin of Tangerang’s street food vendors by province 74
Table 4‐2. Place of origin of Hat Yai’s street food vendors by province 76
Table 4‐3. Duration of migration (in percentage) 77
Table 4‐4. Chi‐square tests of years of migration and religion, age, ethnic, place of origin, education
and marital status of vendors in the study locations 79
Table 4‐5. Key figures involved in the decision to migrate (in percentage) 81
Table 4‐6. The main source of information to migrate (in percentage) 84
Table 4‐7. Occupations before migration (in percentage) 85
Table 4‐8. Most influential push factors (in percentage) 87
Table 4‐9. Most influential pull factors (in percentage) 88
xiv
Table 4‐10. Belonging to community from the previous place of (in percentage) 90
Table 4‐11. Future plans of women street food vendor migrants (in percentage) 91
Table 5‐1. History of food vending experience of vendors (in percentage) 94
Table 5‐2. Have vendors had previous job in the host area (in percentage) 95
Table 5‐3. The main jobs of vendors in the new area before engaged street food business 96
Table 5‐4. Previous business experience of vendors (in percentage) 99
Table 5‐5. Did vendors receive support for obtaining their business? (in percentage) 101
Table 5‐6. The persons who gave business advice and information to vendors 102
Table 5‐7. Cross tabulation between age‐groups of vendors and age of vendors and the persons who
gave business advice and information in Hat Yai (n=77) 103
Table 5‐8. Cross tabulation between age‐groups of vendors and age of vendors and the persons who
gave business advice and information in Tangerang (n=162) 103
Table 5‐9. The labour arrangements and wage (in percentage) 108
Table 5‐10. Correlation between family size and the number of paid workers i 109
Table 5‐11. Mode of transportation used to ferry products to trading site (in percentage) 111
Table 5‐12. Attitude the vendors’ customers (in percentage) 112
Table 5‐13. Access to public/private medical services in the research areas 117
Table 6‐1. The difficulties the vendors faced when their started the business 120
Table 6‐2. Initial working business capital in Tangerang and Hat Yai 122
Table 6‐3. The sources of capital to start the business (in percentage) 127
Table 6‐4. Chi‐square between marital status and source of startup capital in the study locations 127
Table 6‐5. Cross tabulation between marital status and the sources of capital to start the business in
Tangerang (n=200) 129
Table 6‐6. Cross tabulation between marital status and the sources of capital to start the business in
Hat Yai (n=96) 130
Table 6‐7. The location of street food vendors’ trading activities (in percentage) 132
Table 6‐8. How did the vendors obtain the location to sell (in percentage) 138
Table 6‐9. Access to the basic services (in percentage) 151
Table 6‐10. Payment of fees, taxes or levies for space in Tangerang and Hat Yai 154
Table 6‐11. Types of the payment for fees, taxes, and levies in Hat Yai and Tangerang 155
Table 6‐12. Mean monthly payment for fees, taxes, and levies in Tangerang 155
Table 6‐13. Mean monthly payment for fees, taxes, and levies in Hat Yai 156
xv
Table 7‐1. Income classification of street food vendors in Tangerang (in percentage) 160
Table 7‐2. Income classification of street food vendors in Hat Yai (in percentage) 160
Table 7‐3. Gini coefficient of the street food vendors in Tangerang 163
Table 7‐4. Gini coefficient of the street food vendors in Hat Yai 164
Table 7‐5. Income determinants of street food vendors in Hat Yai 167
Table 7‐6. Income determinants of street food vendors in Tangerang 169
Table 7‐7. Net income when vendors started the business compared to current income 171
Table 7‐8. Utilisation of the daily income (in percentage) 171
Table 7‐9. Household value assets in the research areas 175
Table 7‐10. Monthly savings (start of the business compared to current situation) 177
Table 7‐11. Monthly saving of the street food vendors in Tangerang 178
Table 7‐12. Monthly saving of the street food vendors in Hat Yai 179
Table 7‐13. Remittances to the previous place of residence (in percentage) 180
Table 7‐14. Recipients of migrants’ remittances (in percentage) 181
Table 7‐15. Frequency of remittances (in percentage) 182
Table 7‐16. The amount of remittances by vendors in Tangerang (in percentage) 183
Table 7‐17. The amount of remittances by vendors in Hat Yai (in percentage) 184
Table 7‐18. Chi‐square, χ2, ɸ and Cramer's V tests the amount of remittances of the Tangerang’s
vendors when they started the business and at present 184
Table 7‐19. Chi‐square, χ2, ɸ and Cramer's V tests the amount of remittances of the Hat Yai’s
vendors when they started the business and at present 185
Table 7‐20: The income distribution (cf. Table 7‐3) of economic household patterns in Tangerang 189
Table 7‐21: The income distribution (cf. Table 7‐4) of economic household patterns in Hat Yai 189
Table 7‐22. Attitude of the vendors’ families and husband (in percentage) 190
Table 7‐23. Perception of the vendors’ social interactions in the research areas 190
Table 8‐1. Distribution of nuclear and extended families in Tangerang and Hat Yai (in %) 194
Table 8‐2. Management of different household responsibilities in Tangerang 195
Table 8‐3. Management of different household responsibilities in Hat Yai 196
Table 8‐4. Correlation between religion, ethnic affiliation, age, education level, number of children
with household works responsibility of vendors and their husband in Hat Yai 199
Table 8‐5. Correlation between religion, ethnic affiliation, age, education level, number of children
with household works responsibility of vendors and their husband in Tangerang 200

xvi
Table 8‐6. Chi‐square tests of husbands who have a job and husbands who are unemployed in their
participation in household chores by study areas 203
Table 8‐7. Management of different household responsibilities of extended families excluding wife
and husband in the study locations (in percentage) 204
Table 8‐8. Husband's participation in household chores in extended families (how many in HY and
Ta) in the study locations (in percentage) 206

xvii
List of Figures
Figure 2‐1. Locations of field survey in Tangerang city, Indonesia. 36
Figure 2‐2. Locations of selected tambon in Hat Yai city, Thailand. 37
Figure 4‐1: The place of origin of Tangerang’s street food vendors 74
Figure 4‐2: Place of origin of Hat Yai’s street food vendors 76
Figure 6‐1. A street food vendor, Ibu Ria, prepared the food helped by her son 133
Figure 6‐2. A street food vendor, Mbak Harifah, sat next to her food cart 134
Figure 6‐3. A street food vendor selling “sop ceker” at night in the sidewalk near Tangcity Mall 135
Figure 6‐4. A food vendor selling Moo Ping (pork satay) on street side near Kim Yong market, Hat Yai
136
Figure 6‐5. Widi’s food carts ‐ without proper shelter to protect the food carts and consumers during
the rainy season. 137
Figure 6‐6. Bu Murni in front of her food stall and her customer 141
Figure 6‐7. Lina's food cart is located in front of her aunt's house. 146
Figure 6‐8. Kim Yong market: The market with the most products 149
Figure 6‐9. Activities in the morning of street food vendors at Sritrang market, Hat Yai 150
Figure 6‐10. A simple dishwater uses for cleaning the equipment by Tangerang’s vendor 153

xviii
List of Abbreviations
ASEAN Association of Southeast Asian Nation BPJS Employment Employees Social Security System BPJS Health Social Security Administrator for Health DFID Department for International Development EDI Early Development Instrument ESI Export Similarity Index FAO Food and Agriculture Organization GDP Gross Domestic Product ICEDR International Consortium for Executive Development Research ICLS International Conference of Labour Statisticians IEMS Informal Economy Monitoring Study IES informal Employment Surveys ILO International Labour Organization JKN National Health Insurance LEDCs Less Developed Countries NRI Natural Resources Institute OECD Organisation for Economic Co‐operation and Development PCU Primary Care Unit SPSS Statistical Package for the Social Sciences SUPAS The Intercensal Population Surveys THB The currency of Thailand UN DESA United Nations Department of Economic and Social Affairs UDHR Universal Declaration of Human Rights UNFPA United Nations Population Fund UN‐Habitat United Nations Human Settlements Programme UN United Nations UNESCO United Nations Educational, Scientific and Cultural Organization
WDR World Development Report WFP World Food Programme WHO World Health Organization WTO World Trade Organization Average exchange rates in 2018 (relevant period for the Thailand and Indonesian research findings): Thailand Baht USD 1 = 30.3 baht Indonesia Rupiah USD 1 = Rp 14,000
CHAPTER I
Introduction
1. Background of the Study 1.1. Rural‐Urban Migration The most rapid growth in urbanisation has occurred in economically less developed countries
(LEDCs) in South America, Africa and Asia. Between 1950 and 1990, the urban population
living in LEDCs doubled (UN DESA, 2014). Historically, urban living is linked with higher levels
of literacy and education; better health care; lower fertility; longer life expectancy; greater
access to social services and enhanced opportunities for cultural and political participation
(UN DESA, 2014). These factors drive people away from their hometowns (rural areas) and
draw people to a new location (urban areas). The United Nations Population Fund reporting
on the world population (UNFPA, 2007) stated: “For the first time in history, more than half
its human population, 3.3 billion people, will be living in urban areas. By 2030, this is expected
to swell to almost five billion. Many of these new urbanites will be poor. Their future, the
future of cities in developing countries, the future of humanity itself, all depend very much
on decisions made now in preparation for this growth.” A new United Nations (UN) data set
showed that by 2018, 55.0% of the world’s population would live in urban areas and this figure
is expected to increase to 68.0% by 2050. Projections by United Nations show that
urbanization, the gradual shift in residence of the human population from rural to urban
areas, combined with the overall growth of the world’s population could add another 2.5
billion people to urban areas by 2050, with close to 90.0% of urban residents in the world
found in developing countries, particularly in Asia and Africa (United Nations, 2018).
According to the UN, the urban population of the world has grown rapidly from 751 million in
1950 to 4.2 billion in 2018 with Asia being home to 54.0% to the urban population, followed
by 13.0% in both Europe and Africa. Southeast Asian countries have been urbanising rapidly
by hosting a large urban demographic base of 294 million people. In 2010, 41.8% of the
population (246.7 million people) in the region lived in urban areas compared to 15.5% in
2
1950. The United Nations expects the urban population of the region to increase to 49.7 % by
2025 (UN DESA, 2014).
Nevertheless, rapid population growth in the cities, particularly in developing countries is
mainly due to the high rate of rural‐urban migration, which in turn, has led to a significant
increase in the urban workforce. In almost all developing countries, the level of urbanization
exceeds the national average population growth rate which shows that migration is a major
factor for the urbanization process (UN‐Habitat, 2012). Rural‐urban migration is often
regarded as one of the most effective ways to reduce rural poverty, provide work, generate
capital and alleviate income inequality. Research by Cali and Menon (2009) in India proved
that the growth of urban areas has had a systematic and significant poverty‐reducing impact
on surrounding rural areas. At the same time, rapid growth in rural‐urban migration together
with a slow expansion of employment in the formal sector has forced the largest share of the
workforce into the informal economy (ILO, 2002; Kebede, 2015).
Rural‐urban internal migrants in Indonesia and Thailand constitute a significant population.
Nearly 9.8 million individuals in Indonesia were estimated to be temporary internal migrants
in 2010 against a merely 450,601 people migrating internationally for work in 2012 (Ananta
and Arifin, 2014). In Thailand, according to the 2010 Thailand Population and Housing Census,
8.3% of the Thai population had migrated internally during the previous five years, and 21.8%
of the total population did not live in their hometown (National Statistical Office of Thailand,
2010). This significantly outweighs the number of international migrants (inflows and
outflows from Thailand) estimated at just under 4.5 million in 2017 (UN DESA, 2017).
In Indonesia, the rural‐urban migration trend can be explained by a number of so‐called push
and pull factors (Nashrul, 2017). Tirtosudarmo (2009); Susanti and S (2015) and Sukamdi and
Mujahid (2015) summarize the main push factors of internal migration in Indonesia by the
lack of job opportunities in agricultural sectors, working matters, a desire to rejoin family
members, marriage, to seek a better economic opportunities and access to education. The
demand for labour in urban centres, however, is the main factor pulling people from rural
areas to urban areas. In Thailand, according to Amare et al. (2012), the lack of employment in

3
rural areas, following family and educational opportunities are push factors which have driven
people to migrate to urban areas. Wongchai et al. (2012) reported that the search for better
job opportunities instead of farming is a factor that significantly affects the migration of
farmers in northern Thailand. Chalamwong (1998) added that push factors, as well as pull
factors, increasingly drew people to urban areas.
One of the important changes in internal population movements within Indonesia and
Thailand has been the rise in the participation of women in migration streams that were
previously dominated by men. According to Sukamdi and Mujahid (2015), female migrants in
Indonesia are greater than male migrants in number among married, divorced and windowed
migrants, particularly for younger groups (15‐34 years) where the proportion of migrant
females and males were 66.9% and 63% respectively. The 2012 Migration Survey found that
the number of women in Thailand's internal migration was lower than in other countries in
Southeast Asia, including Indonesia. Notwithstanding, according to the National Statistical
Office of Thailand (2012) almost half of Thailand's internal migration flows were women
(47.8%). This has led to the conclusion that there is a ‘feminisation of internal migration’
suggesting that there is an increasing number of women in internal migration streams
occurring in both countries, especially in Indonesia. Changes in migration that are evident not
only occur in the increasing number of migrant women but also in migration patterns. In the
last few decades, the volume of unskilled migrant women has exceeded migrant men.

4
1.2. The Informal Economy – Academic Perceptions of Grassroot Activities
Since the 1960s, the informal economy has emerged as a concern for policy makers and
agents of development as they recognise that a persisting unemployment rate is a major
economic challenge in LEDCs (Tanga, 2009). In response, the International Labor Office (ILO)
initiated a study on urban employment by organising and allocating multi‐disciplinary
employment missions to different countries of the world (ILO, 1972). The first ILO mission to
Kenya used the term ‘informal sector’ to describe the activities of the poor, working very hard
but not recognized, protected or regulated by the public authorities. A year after this Kenya
mission, Keith Hart used the concept of the informal sector to describe a part of the urban
labour force, which operated outside of the formal labour market (Hart, 1973). Since then,
the work in the informal economy has become a subject of studies by many scholars and
international organizations.
The definition of informality has been subject to various debates in recent decades. According
to Shinder (1998), informal economies were described as economic activity excluded from
the national data on gross domestic product (GDP), not subject to formal contracts, licensing
and taxation. These businesses generally rely on domestic resources, small‐scale operations
and unregulated markets (Schneider and Enste, 2000). Likewise, Gërxhani (2003) defined the
informal economy as “grey economy”, that is neither taxed nor monitored by government
institutions. Valodia and Devey (2010) defined the informal economy as, (a) non‐registration
of the enterprise in terms of taxation and or other commercial legislation; (b) non‐registration
of employees in terms of labour legislation and (c) small size of the enterprise. According to
the International Labour Organisation (ILO), the informal sector consists of units not
constituted as separate legal entities; produces goods or services for sale or barter and
includes not only those enterprises that employ hired labour but also self‐employed persons
such as street vendors, taxi‐drivers, home based workers, etc (ILO, 2002).
For statistical purposes, the 15th International Conference of Labour Statisticians (ICLS) (ILO,
1993) defined informal sector enterprises by including all jobs in this sector and all persons
who, during a given reference period, were employed in at least one informal sector
5
enterprise, irrespective of their status in employment and whether it was their main or a
secondary job. A joint study of the International Labour Office and the Secretariat of the
World Trade Organization defined informal workers as those who do not benefit from social
security and are not protected by labour regulation (e.g. hiring and firing regulation, minimum
wage) (WTO and ILO, 2009). The ILO and ICLS definitions are now widely accepted and
consistently applied in employment‐related analyses.
The informal economy is the chief source of livelihood for the majority of the urban poor and
plays a crucial role in providing jobs and reducing unemployment for a number of rural‐urban
migrants, thereby helping alleviate poverty in developing countries (ILO, 2002). The ILO report
(2018) shows that two billion people work informally, of which 93.0% make their living in the
informal economy, indicating that this growth has been more rapid in emerging and
developing countries than elsewhere in the world. In Africa, approximately 86.0% of
employment is informal compared to 68.0% in Asia and the Pacific; 69.0% in the Arab States;
40.0% in the Americas and 25.0% in Europe and Central Asia (ILO, 2018).
In Indonesia, based on the latest global estimates, informal employment, as a percentage of
total non‐agricultural employment, was estimated at approximately 73.0% (ILO Department
of Statistics, 2011). According to the data from the Indonesian Central Bureau of Statistics in
2009, 69.0% of Indonesian workers (64.84 million people) were employed in the informal
sector (Nazara, 2010; Asian Development Bank and BPS‐Statistics Indonesia, 2011). Based on
the official informal employment surveys (IES), the share of informal employment in Thailand
was 62.0% of the total employment in 2010, which gradually increased to 62.5%, 62.7% and
63.7 % in 2011, 2012 and 2013, respectively (Dasgupta et al., 2015).
The informal sector became even more important when the two big economic crises (the
1997/98 Asian financial crisis and the 2008/09 global economic crisis) impacted Indonesia and
Thailand. These crises caused a decline in the ability of the formal sector to absorb
employments. A large number of employees lost their jobs as many companies closed
(Suryahadi et. al., 2003). Consequently, the informal sector can be regarded as a solution for
unemployment problems. Accordingly, there has also been a significant increase in the

6
number of urban informal activities in almost all cities in Indonesia and Thailand since the
crises (Brata, 2006; Tambunan, 2004; Warunsiri, 2011). Survey evidence of an urban village in
Jakarta (Tambunan, 2004) concluded that the informal sector is undoubtedly very important
for many urban families, at least as a secondary or a complementary source of income.
1.3. Street Food Vending as a Prominent Sector of the Informal Economy
As a part of the urban informal sector, street vending is one of the most visible activities in
the informal economy. Bhowmik (2005) defined street vending as an activity which takes
place outside enclosed premises on street pavements, sidewalks and in other public places
carried out by self‐employed workers. These self‐employed workers are either stationary or
mobile. Bhowmik further defined a street vendor as a person trading from the street who
offers goods for sale to the public without having a permanent built‐up structure from which
to sell. Street vending is considered to be one of the growing informal activities in urban areas
to survive in the growth circumstance (Irianto, 2014; Roy and Alsayyad, 2003) and is
associated with people having no professional skills and with low levels of education who
cannot get jobs in the formal sectors (Kamala, 2007).
Over the years, street vending has become an essential source of employment and income to
many urban dwellers. Hence, it is the largest sub‐group of informal workforces after home‐
based workers. Together, these two groups represent 10.0%‐35.0% of the non‐agricultural
workforce in developing countries compared to 5.0% of the total force in developed countries
(ILO, 2002). In the same study, ILO showed that street vending occupies 8.0%, 14.6% and
6.0% of the non‐agricultural labour force in Kenya, South Africa and Tunisia, respectively.
Adamtey (2015) revealed that in sub‐Saharan Africa, the trade of street vending accounts for
43.0% of all informal non‐agricultural employment. In Asian cities, street vendors account for
a slightly lower share of informal employment. For example, city‐level data for Hanoi and Ho
Chi Minh City, Vietnam show that street vendors form 11.0% of total non‐agricultural informal
employment whilst in Indian cities, the share of street vending is lower – from 4.4% (Mumbai)
to 6.5% (Ahmedabad) of total urban informal employment (Roever and Skinner, 2016).

7
Reports from Southeast Asian countries show an increase in the number of street vendors
after the financial crises of 1998 and 2007, affecting the Asian Tigers and causing a sharp rise
in street vendors in Thailand and Indonesia. In Thailand, the number of street vendors
increased from 310,500 in 1997 to 390,600 in 2000 (National Statistical Office of Thailand,
1997 and 2000 as cited by Kusakabe, 2006). Most of these street vendors were immigrants or
laid‐off workers (Maneepong and Walsh, 2013).
Among various occupations in street vending, street food vending is the most dominant and
prominent activity. Street food is defined as ready‐to‐eat foods and beverages prepared
and/or sold by vendors or hawkers, especially in the streets and other similar public places
that can be eaten directly without processing or further preparation (FAO, 1986; Dardano
2003). The vendor locations are usually popular spots such as marketplaces, busy street
corners and strategic locations. Similarly, WHO (1996), defined street‐vended foods or ‘street
foods’ as foods and beverages prepared and sold by vendors in streets and other public places
for immediate consumption or consumption at a later time without further processing or
preparation. This definition includes fresh fruits and vegetables which are sold outside
authorized market areas for immediate consumption.
There are at least three main characteristics of street food trading. Firstly, street food is an
important entrepreneurial activity and income source for urban and rural poor, particularly
women who are often the first victims of poverty (Tinker, 2003). Secondly, street food is
reasonably priced, flavoured and easily available (Marras and Agbendech, 2016). Thirdly,
street food is a nutritional option for the urban poor who often can only afford to buy small
quantities of food at a time (Bhat, 2000). As a means to provide sources of income and
employment for the urban poor, the street food sector is a simple way of income generation
by investing small capital (Adhikari, 2017). Many migrant workers and unemployed persons
who are in search of jobs obtain their first income from the street food business (Winarno,
2017). The Food and Agriculture Organization (FAO) showed that women, as a vital part of
the informal economy, were essential to the functioning of the street food industry (FAO,
2012). To meet the food demands of city dwellers and provide a source of affordable

8
nutrients, women food hawkers contribute significantly to the economy of whole countries
(Muzaffar et al., 2009).
The following definitions are used in the survey design and throughout this analysis. The
informal food economy in this study is defined as a business with less than ten people. It
includes small producers, enterprises, traders, all of whom ran their businesses on the
sidewalks selling foods and beverages using semi‐permanent tents or carts and are involved
in legal as well as unrecognized activities. The term ‘street foods’ as used in this study refers
to food prepared on the streets or prepared at home and for sale to the public on the streets
– meaning on the sidewalk (including pedestrianized streets) without having a permanent
built up structure but with a temporary static structure or mobile stall (or head load). Street
food vendors may be stationary by occupying space on the street, pavements or other public/
private areas or may be mobile in the sense that they move from place to place carrying their
wares on push carts or in cycles or baskets on their heads to sell their foods. The respondent
(woman migrant) in this study is a person who has lived continuously for most of the last six
months in the area of destination. A member of household is identified as a person who is
related to the vendors or lives with the vendors for the entire year as a member of the
vendor’s household.
2. Characteristics of the Street Food Sector in Developing Countries – a Literature Review This study aims to specifically explore the roles played by women street food vending in
Tangerang, Indonesia and Hat Yai, Thailand, especially by female migrants. To formulate
suitable strategic measures for the improvement of economic potentials of these women, this
study focuses on socio‐economic characteristics of women and their livelihood situations
before and after conducting the vending and examines their income strategies, along with
their scopes and constraints as economic subjects in the public space. Finally, a shift in
perspective turns the attention to the household level. Using the division of household chores

9
as a test, this study intends to examine how the women’s new role as breadwinners,
sometimes even as the sole breadwinners, might have changed family values and behaviours.
The interest in the role of women entrepreneurship in the street food sector began with a
review of the literature on informal economies in Indonesia and Thailand. The researcher
realized that in the literature the phenomenon is widely acknowledged, but for the two
countries research results are still sparse and inconclusive. Generally, the number of recent
micro‐studies on street food vending in Thailand and Indonesia is not abundant. The two
major studies, dealing with the topic from different points of view (Nirathron, 2006; Fixy,
2004) relied on data sets that are only partially appropriate for studying the contribution of
women migrant street food vendors. Fixy’s (2004) study about street food vendors in a special
area of Jakarta, for example, included women only as a part of the respondents, not as the
main research object. Their business success was not exhaustively evaluated, as a comparison
of livelihoods and well‐being before and after starting a business was not accomplished. There
was no discussion related to the role of women vendors in the family and the society as a
whole.
Similar to the study by Fixy, Nirathron’s study of street food vendors in Bangkok did not focus
on female vendors. Insofar, working conditions and the family role of women were not within
the scope of his study. Additionally, the study passes on a couple of economic parameters,
such as the capital investments to start the vending, the savings and the remittances to their
places of origin. However, these studies touch a couple of issues, playing an important role in
this study as well, and will partially allow comparative considerations, especially on the
economies of the street food business. In order to create a proper design of this study, the
scope had to be widened to examine methods and topics from a large range of international
studies on the street food business.
Street food sectors in developing countries are heterogeneous and their classification is fairly
diverse. This is the first impression, provided by a bulk of international literature. Therefore,

10
this subsection gives an overview of research findings on the main characteristics of the street
food sector focusing on labour conditions, legal issues and especially the role of women in
this business and the repercussions for the division of domestic duties.
2.1. Families and Individuals: Female Domination Most authors agree that the street food business is usually owned and operated by individuals
or families. Nirathron (2006) found out that of the 744 street food vendors in Bangkok,
approximately 37.0% were engaged in street vending as individual operators whilst 44.0%
were family operators. More precisely, the EPOC study of street food vendors in lower‐ and
middle‐income countries found high levels of women’s involvement in eight of the nine
countries studied (Tinker, 2003). Using Bangkok, Thailand as a case study, Chung et al. (2010)
have shown that most of the enterprise owners were women.
In African cities (FAO, 2012), including cities in South Africa (Martins, 2006); Zimbabwe (Njaya,
2014); Ghana (FAO, 2016) and Tanzania (Marras, 2018), women are the dominant vendors
selling food on most of the streets. Similarly, women in towns and cities of many developing
countries in Asia also play an important role in the street food industry including Iloilo city,
Philippines (Tinker, 1997), Chonburi, Thailand (Tinker, 1997; Gengaiah et al., 2018); Sarawak,
Malaysia (Rahman et al., 2012; Jores et al., 2018); Yangon, Myanmar (Lin and Yamao, 2014)
and Ho Chi Minh city, Vietnam (Thanh, 2015).
A study examining the empowerment of women street food vendors in West African by World
Food Programme (WFP, 2017) found that a little over half of the vendors ran their business
alone and without assistance. The study also discussed that those who do utilize assistance
(paid or unpaid), the most common type of association was help from a family member.
Women were likely to use children to assist in their business. Many women explained that
their children, especially daughters help performing secondary tasks such as sweeping,
dishwashing, and hawking. Similar findings from other African countries (Nyaruhucha et al.,
2007; Milanzi, 2011, Fellows and Hilmi, 2011; Marobhe and Sabai, 2016; Marras, 2018)
reported that street food business enterprises are usually owned and operated by individuals

11
or families and most owners rely on unpaid family labour (including children, siblings, and
other relatives), while some hire paid labourers.
2.2. Education Levels of Women Street Food Vendors According to the literature, a global characteristic of street food business across countries and
rural‐urban areas is that women vendors are overwhelmingly poorly educated (Osei‐Boateng
and Ampratwum, 2011; Bressers et al., 2016). For example, the study by Bereda et al. (2016)
in Eastern Ethiopia found the majority of the street food vendors were women with the
average age range of 23–49 years and most of them were illiterate. Conversely, a
comprehensive survey on the Natural Resources Institute (NRI) conducted from a sample of
334 respondents on street food sector in Accra, Ghana showed that the majority of the street
food vendor owners were women with minimal or no education (NRI, 2015). A survey on
street food vendors in Gaborone, Botswana revealed more differentiated results: In 2013,
approximately 76.3% of vendors involved in the business of street food vending were women.
The majority of the respondents in the study (84.5%) were aged between 21 and 40 years.
However, most street food vendors had attained basic education as 95.9% of vendors had
completed secondary education (Chicho‐Matenge and Ongori, 2013). Similarly, in Tanzania,
80‐90% of the street food vendors are women aged between 20 and 45 years with primary
education (Marras, 2018). Likewise, In Bahia, Brazil, 55.9% of the 247 food vendors
interviewed by Alves da Silva et al. (2014) were female with minimal education whilst 49.0%
had obtained elementary education.
In the case of Southeast Asia, a study of 72 street food vendors in Yangon, Myanmar, revealed
that the majority of the street vendors were women and most of the women entrepreneurs
passed the primary level of education (Lin and Yamao, 2014). Bangkok’s street food project
in Thailand and the municipality of Nonthaburi in 1994 showed that among the vendors
enrolled in the project, two‐thirds were women over 30 years of age and most of them were
married. More than 95.0% of the vendors had completed primary education or more,
suggesting that vendors were literate with basic levels (Dawson et al., 1994). Similarly, a Ford
Foundation‐funded street food project in Chonburi, Thailand showed that nearly four‐fifths
12
of the 948 vendors in Chonburi were women (78.0%). Most vendors were aged between 26
and 50 years (Cohen, 1984). In contrast to the previous studies, Gengaiah et al. (2018) found
that among the vendors enrolled in their project in Thailand, the literacy rate and minimum
qualification to enter street food vending are higher than in other countries.
2.3. Working Conditions Almost around the world, the work of women vendors is characterized by an extremely long
working day. In Phnom Penh, Cambodia, women vendors work long hours a day (8‐13 hours)
and most of them must balance their long working hours with other household
responsibilities (ILO, 2016). A study of 294 individual respondents, of whom 68 per cent were
female in Maiduguri, Nigeria reported that traders work on average between 8 to 11 hours a
day (WFP, 2017). Similarly, Kumari and Singh (2016) found that street vendors, on average,
work between 8‐12 hours per day. Nepalese vendors find that street food vending is a survival
strategy which involves working long hours (8.8 hours) per day to earn a basic income that
simply allows vendors to provide a means of subsistence for their families (Adhikari, 2017). A
study carried out In Dhaka, Bangladesh found that the women street food vendors selling
cooked food begin working early in the morning to prepare the food, resulting in some
vendors to now work for longer hours (Habib, 2016). Strikingly, women street food vendors
in Mongolia work longer hours—between 12‐15 hours a day (Kusakabe, 2006). As stated by
many authors, the general working hours of street food vendors are unusual and irregular.
Most of them often exceed the standard working hours set by the government for formal
workers and spend more than eight hours per day in vending. The primary reason for the
long working hours is the uncertainty of income.
In addition to working hours, female street food vendors face other forms of vulnerability at
the workplace. Anjaria (2006) mentions that vending is full of insecurity and uncertainty since
vendors work at the roadside and accidents may occur at any time. In a survey, Kumar and
Pillai (2017) found that as the workplaces of these vendors are public spaces, there is often
no provision of toilet facilities which result in health conditions, including diarrheal diseases.

13
The study of the informal food sector in developing countries conducted by the FAO (2007)
showed that in general, the informal food sector has limited access to basic services, including
access to potable water. Hence, it is seen that any vending activity that lacks basic services
may contribute to problems of food hygiene and safety. For example, the nutritional quality
of fresh and cooked street food may be compromised.
With regards to the social security of vendors at the workplace, Kumar and Pillai (2017)
commented that most vendors do not have access to social security or welfare benefits like
pension. They revealed that the local government in their study location, Kollam District, India
does not provide any health benefits or insurance to the vendors as they belong to the
unorganized informal sector. Since street vendors do not have access to any government
assisted social security, Kumar (2015) reported that in Kerala, India, around one‐third of
vendors borrow money for their social protection including health care, medicine, maternity,
and accidents. Lund (2009) suggested that the local government should be involved in
developing social security for informal street vendors, particularly health care, since most
vendors live in a poor environment with minimal to no access to local facilities and cannot
afford to buy insurance services from a private company.
2.4. Legal Issues
In many cities across the world, urban public space has become the place of work for the
urban poor. Many vendors operate their business in areas that can be classified as public
spaces including spaces where people assemble in great numbers. Unfortunately, the small
food stalls used for vending are mostly put up illegally because there is no license available
for street food vendors in those areas of public spaces.
Worldwide, the majority of street food vendors undertake their businesses with the fear of
eviction, imprisonment, harassment and fines because the laws do not recognize their
operations (Mramba, 2015). Almost in all Asian and African countries, street food vending is
illegal and sometimes they are treated as criminals. Bhowmik (2005) stated that in many

14
cases of street vendors in Asia, the vendors pay a part of their daily sales as a bribe to the
authorities to continue doing business as most of street vending is considered an illegal
activity. In Dhaka, Bangladesh, Etzold et al. (2013) showed that as most food stalls were put
up illegally and the lack of licenses for the vendors left them vulnerable to evictions from their
vending sites by the police, security officers of companies or public institutions or by local
powerful people. Kusakabe (2015) revealed that in Bangkok, the vendor must make extra
payments to the police, local authorities and sometimes, gangsters due to their illegal status.
The work of Bell and Loukaitou‐Sideris (2014) of street vending regulation in China shows that
food stalls used for vending are mostly put up illegally and unlicensed. Similar to the vendors
in Dhaka and due to the lack of licenses, Chinese street food vendors also face eviction from
the police, public institutions or by local powerful people. They also often have to cope with
confiscation of their equipment or total displacement from vending site.
However, not everywhere is street food vending deemed illegal by the local authorities. In
Cambodian cities (Kusakabe, 2010), being a legal vendor implies that a fee is paid to the city
council to conduct business from the streets. However, although street food vendors are
increasingly required to have identity cards and vending permits, the share of licensed street
food business has not risen significantly in many countries. According to Gadaga et al. (2014)
in Maseru City, Lesotho, almost all street food vendors were renting their stands from the city
council, but only 11 per cent of the vendors were licensed by Ministry of Trade and Industry
and the local government, while In Tanzania, the share of licensed street food businesses has
slightly increased (Nyaruhucha et al., 2007; Milanzi, 2011; Daudi, 2015). By constrast,
Mazhambe (2017) showed that in Harare, Zimbabwe, only seven per cent of street vendors
operated with a license from a government authority.
Scholars have identified many reasons for this observation. Nyaruhucha et al. (2007), in their
study of three municipalities namely, Kinondoni, Ilala, and Temeke that constitute the city of
Dar es Salaam, Tanzania found that many vendors do not get a license the moment they begin
their activity because they are still uncertain about their ability and willingness to carry it out
for a long period. Some point to high registration fees, while others simply do not know the
licensing procedures. In Mongolia, Kusakabe (2006) found that vendors spend about 18,700

15
MNT ($6,919) to obtain correct permits. On average, vendors operating small shops and
kiosks spend more than a month in obtaining a valid short‐term license.
One country that formally provides legal protection to street vendors on a national scale, is
India. According to the law, street vendor has the right to conduct street vending activities in
the vending zones allotted to them, in accordance with the terms and conditions mentioned
in a so‐called certificate of vending (Gupta, 2014 cited by Mramba, 2015). However, even in
India official licenses do not guarantee protection from harassment by police officers and local
warlords (see below).
2.5. Socio‐economic Conditions of Women Street Food Vendors The literature on the socio‐economic conditions of women street food vendors is
characterised by three themes. The first essential theme addresses how vendors establish a
street food business which covers capital investments to start the enterprise, business costs
and fees for rent to secure the business. The second theme discusses how the street food
trade strongly affects incomes and savings of the vendors. The last theme examines the
participation of women street food vendors as the main breadwinners of their households.
2.5.1. Investment Costs
One major obstacle in the start‐up process of a street food business is the lack of access to
formal credits. This is mostly because women are viewed as a high risk in investment by the
bank system since they lack control over land and other properties which formal financial
institutions view as collateral (Marras, 2018). Similarly, Temtime and Pansiri (2005) note that
commercial banks were reluctant to lend money to small scale business as they lacked
business skills, had high‐cost risk and that small business emphasized on short term survival
issues while banks were for long‐term competitiveness. However, all over the world, the
vendors found ways out of this difficult situation. Kusakabe (2006), in his article on Mongolia
found that half of the vendors had borrowed initial capital from various individuals. Vendors
in Botswana relied on loans from relatives and friends.
16
However, as demonstrated by a majority of researchers (Otoo et. al., 2011; Muzaffar et. al.,
2009; Iyenda, 2001; Acho‐chi, 2002) a street food enterprise is generally small in size, requires
simple and basic skills and small amounts of capital. Therefore, in many cases, for instance in
Tanzania (Njaya, 2014) and Cambodia (Kusakabe, 2006), the initial investment made by
women in the street food vending business came from their personal and/or spousal savings.
In Tanzania most female food vendors deliberately avoid applying for loans from credit
institutions. As a consequence, however, numerous women start with undercapitalization,
which leads to a permanent lack of working capital in the ongoing business process. Insofar,
limited access to financial credit and the dependence on informal, volatile and unreliable
sources of financial capital significantly hinder progress and sustainability of the street food
business.
2.5.2. Fees for Permits and Rent
In addition to operating under challenging conditions by being in a highly unstable and
competitive business, most street vendors commonly pay a variety of taxes, fees, and levies
that they have to contribute to local and national government (Chen et al., 2004; Roever,
2014). Roever (2014) showed that nearly two‐thirds of street vendors pay for special licences,
permits or access to public spaces and that many also pay value‐added tax on their purchases,
although they are unable to charge it to their sales. Marras and Agbendech (2016) found that
in Ghana, the vendors paid taxes and fees to different parties. The fee for business operating
permit was paid to the local authorities; an income tax was paid to the Ghana Revenue
Authority and the fee for the use of public space was paid to different recipients. Other studies
by Otoo et al. (2011) on women entrepreneurship in the street food sector in Niger and Ghana
found that in Niamey, Niger and Kumasi, Ghana, each female street food vendor paid daily
fees to the local authorities.
Due to their illegal status, vendors often pay bribes to resolve problems with city authorities
and police and to avoid greater hardship through fines, evictions and/or arrests. Etzold et al.
(2013) highlighted that street food vendors in Bangladesh commonly paid bribes to thugs

17
every day for their use of public space. The amount of money used as bribes depends on the
size of the shop and the business volume. In return for the payment of bribes, thugs allow
vendors to sell at "their" place, provide information regarding police evictions and serve as
middlemen in negotiations with more powerful figures such as the police or local political
leaders if the vendors experience problems related to their businesses. Similarly, Vyavahare
(2016) published that one‐third of the street food vendors in Mumbai, India have to pay
“inducement money” regularly to the traffic police linked with the problem of zoning and
traffic issues.
Recent research shows that street vendors, in addition to paying a variety of taxes, fees, and
levies, vendors are also required to pay for basic services, such as electricity, garbage cleaning,
fire safety, water supply, heating, sanitation and hygiene requirements. For example, the
Informal Economy Monitoring Study (IEMS) in their studies in 10 cities around the world
including Accra, Ghana; Ahmedabad, India; Bangkok, Thailand; Belo Horizonte, Brazil; Bogota,
Colombia; Durban, South Africa; Lahore, Pakistan; Lima, Peru; Nakuru, Kenya; and Pune, India
found that one in four vendors pays for lights, electricity, and water at the workplace. The
study also showed that half of the vendors pay to use public toilets and four in ten pay for
access to storage space (Roever, 2014). Magehema (2014) found that five per cent of the
street food vendors were paying for water fetched from public taps constructed by local
government authority in Songea District, Tanzania. According to Kusakabe (2006), in Bangkok,
Thailand registered street vendors were required to pay a monthly fee to the Bangkok
Metropolitan Administration (BMA) for the cleaning and maintenance of streets occupied by
vendors.
Anyidoho (2013) presents another argument linked to paying of taxes and other levies
collected by the local governments. In his study at Kumasi Metropolitan, Ghana, Anyidoho
found that taxes collected by the local government were supposed to be used in the provision
of infrastructure such as electricity, toilet facilities, pipes, and waste disposal system for
vendors. In fact, not much can be said about fulfilment of these tasks by the local government
and the provision of adequate public services for street food vendors in Kumasi Metropolis.
This evidence further highlights that the local authorities are failing to provide toilets, water
18
and garbage services and that the street vendors themselves are responsible for these basic
facilities.
2.5.3. Income
Street food vending is an essential source of food and provides critical income to women in
cities worldwide. Most street food vendors are attracted to this occupation because of the
possibility of earning relatively high incomes. Omemu and Aderoja (2008) reported that street
vendors in Abeokuta, Nigeria earned more than the minimum wage. In some countries, street
foods vendors can earn considerably above the minimum wage (Otoo et al., 2011). In Maseru
City, Lesotho, Gadaga et al. (2014) reported that nearly all vendors earn profits almost five
times the amount that workers in textile factories earn, which is approximately ten times the
minimum wage. Darko‐Koomson (2016) studied street food enterprises in Kumasi, Ghana and
showed that the average sales revenues produced by street food vendor owners were about
nine times more than the national daily minimum wage (at the time of the study). Similarly,
Otoo et al. (2011) reported profits of almost 16 times higher than the national minimum wage
for street food vending in Kumasi. Marras and Agbendech (2016) showed that enterprises
operating in Accra, Ghana have a slightly higher income than the official minimum wage
earned by public sector workers. The study found that there are significant differences
between vendor earnings and formal sector living standards with average vendor earnings
about five times higher than the wage earned by formal workers.
Like vendors in African cities, street food vendors in Asia can earn reasonably well above‐the‐
average minimum wage. In some Asian countries, Winarno and Allain (1991) revealed that
the average earnings of a vendor may be three to ten times more than the minimum wage
and are often comparable to the wages of skilled labourers employed in the formal sector.
This finding is similar to the results of other studies carried out by Fixy, 2004; Kusakabe, 2006;
Etzold et al., 2013. Etzold et al. (2013) showed that in Dhaka, Bangladesh the street food
vendor income is quite a substantial income compared to the wages of factory workers or
day‐labourers. In Bangkok, Thailand, Kusakabe (2006) published that the income from street
vending is relatively high compared to the minimum wage of Bangkok at the time (169 Baht

19
a day). In line with these reports, the daily income of most street food vendors in Jakarta
ranged from Rp 300,000 ($21.3) to Rp 1,000,000 ($71.0) (Fixy, 2004). At the time, the standard
minimum wage set by the Government of Jakarta was a little more than half a million Rupiah
per month. The higher daily income compared to formal workers may be one the reasons why
people stayed in this business for quite a number of years. However, the spread in the group
of vendors may be considerable. Setia (2008) claims that the income level is associated with
a variety of things, including the type of goods sold, selling locations, and several additional
conditions. Of all vendors, for instance, mobile vendors were noted as the least successful
(Kusakabe 2006; Fixy, 2004).
2.5.3.1. Savings The study by Otoo et al. (2011) on women entrepreneurship in the street food sector between
enterprises in Niamey, Niger and Kumasi, Ghana showed that approximately 80.0% of street
food vendors in Niamey have relatively stable incomes and some ability to generate savings.
In Kumasi, however, the percentage is lower (57.0%) but still significantly high. In a study of
dynamic and growth of street food enterprises in Kumasi city, Ghana, Darko‐Koomson (2016)
stated that the savings are usually reinvested into street food vending in the event of increase
in stock prices or when the vendors require cash for immediate use concerning their business
and personal matters. A study of saving culture among street food vendors in Kogi state,
Nigeria by Oluwoyo and Enemali (2016) published that the average savings of the vendors
were 35.0% of the total profit and that most of the respondents save for life cycle daily needs,
for unforeseen contingency otherwise called emergencies and for investments purposes.
Similar to African street food vendors, Chinese vendors in Kolkata, India also saved parts of
their earnings (Ghatak and Chatterjee, 2018). In a study of livelihood opportunities of street
vendors in Kathmandu, Nepal, Parajuli (2013) revealed that nearly half of the total vendors
had the habit of saving their income to re‐invest into the business for expansion. In India,
regional differences are apparent. In Hyderabad only 20.0% of the street food vendors have

20
savings. Consequently, vendors would borrow money from someone else in the event of
emergencies (Wipper and Dittrich, 2007).
2.5.3.2. Remittances
The migrants among the street food vendors are often the main income earner supporting
large families of dependents. This allows rural families to benefit from remittances (ILO, 2002;
Brown et al., 2010), the portion of a migrant’s earnings sent from the destination of
employment to the place of origin. Remittances from migrants have been seen to be crucial
to the growth prospects of developing nations with potentially positive impacts (Ratha and
Mohapatra, 2007). Most authors agree that remittances play a central role in the livelihood
of many households in rural areas. Some authors (Adger et al., 2002; Quartey and Blankson,
2004) even claim that migrant remittances have played an important role in the economic
development, social resilience and the improvement of household welfare in many
developing countries.
Ray and Mishra (2011) showed that there was a positive relationship between income level
and the likelihood of sending money home of street vendors in Surat City, India. However, the
topic has been neglected by most of the authors dealing with street food business.
Accordingly, many details of the urban‐rural money flow, induced by migrant food vendors
have not systematically been studied in the past. This study is starting to fill that gap.
21
2.5.3.3. Determinants of Income Levels Otoo et al. (2011) presented that married women in Niger have less successful enterprises in
comparison to single entrepreneurs. Adhikari (2017) argued that marital status indicates a
negative correlation with daily income. The study found that larger numbers of married
respondents were involved in vending, but the average monthly income was found less
compared to unmarried. Roever’s (2014) findings were more differentiated. He stated that
earnings of the street vendors in 10 cities around the world: Accra, Ghana; Ahmedabad, India;
Bangkok, Thailand; Belo Horizonte, Brazil; Bogota, Colombia; Durban, South Africa; Lahore,
Pakistan; Lima, Peru; Nakuru, Kenya; and Pune, India vary according to their marital status:
Widows have the lowest median monthly earnings and those who never married have the
highest. Age was found to be another determinant of the profit level. For Kigali, Rwanda,
Uwitije (2016) observed that normally younger respondents performed better than older
vendors. Accordingly, for Bangladesh, Adhikari (2017) found that when respondents’ age
increased, the probability of the respondents’ capacity to generate income decreased.
Bates (1990) is one of the first studies to examine the influences of entrepreneurs’ education
on business performance and confirms a positive relationship between owner’s education
and firm survival. Similar findings were made by Tsai and Yang (2018) and Begari (2017). Tsai
and Yang found a positive and significant result regarding education and profit in some of the
vendors in Taiwan, whether they were food and non‐food vendors, while Begari’s study
showed that there is a positive relationship between income and education level of vendors
in Hyderabad, India.
According to several studies, the number of working years conducting the business is another
variable affecting the incomes of vendors. Experience helps developing the insight of doing
business in an efficient manner, as stated in the case of women street vendors in Kenya
(Gatere, 2016). By contrast, Adhikari (2017) discovered that the variable of working years is
not significant to the daily income of the vendors in Bangladesh. Starting with a higher initial
capital, however, is likely to ensure a better performance even in the following years.

22
Muzaffar et al. (2009) also found that initial working capital positively affects the sales
revenues of the street food vendors in Dhaka, Bangladesh.
Female participation in the street food sector of Iloilo, Philippines varies widely due to social,
cultural and religious norms (Tinker, 2003). Thus, in this country, religion plays an important
role in determining the operation of enterprises. For Niger and Ghana Otoo et al. (2011) found
that religion is one of the key determinants that influences the success of women
entrepreneurs selling cowpea‐based street foods. The study revealed significant differences
between the average earnings of the vending’s run by Muslim and those operated by Christian
enterprisers.
2.6. Women as the Households’ (Main) Breadwinners
In a deep‐rooted traditional view of family roles, men are known as the breadwinners whilst
the women care for the family and household. This family model has been challenged for
many years, since women have been sharing the role of breadwinner, either as primary or co‐
breadwinners (Ben‐Galim and Thompson, 2013). The role of women in the economy received
new scholarly attention since Heather Boushey released ‘The New Breadwinner’ in 2009, a
chapter in The Shriver Report: A Woman’s Nation Changes Everything (Glynn, 2014).
Simultaneously, Boushey illustrated how the women labour‐force participation has grown
dramatically over the past 50 years and that mothers are more likely to provide significant
financial support to their families than ever before (Boushey, 2011 as cited by Glynn, 2014).
In this long‐standing and still ongoing process economic crises have played the role of an
accelerating factor (Badawi et al. 2008). Especially in developing countries, high
unemployment rates have contributed immensely to the loss of formal employment for men
and consequently, there has been a decline in the role of male breadwinners in the families
(Casale and Posel, 2002 as cited Mabilo, 2018). However, the activities of their wives are
almost exclusively directed towards the informal sector. One reason for women commencing
jobs in the street trading business is that they are often excluded from the remunerative
23
formal sector because of disadvantages they had experienced in the education system
(Ouédraogo et al., 2017), for instance a limited access to vocational training (Chen et al.,
2004).
However, this is not the only motivation for the female preference for jobs in the informal
sector. In a study on Penang, Malaysia, Franck (2012) concluded that women may consciously
prefer opting for street vending activities than for formal jobs. The responsibilities of a formal
job do mostly not allow women vendors to fulfil a double role as breadwinners and mothers.
So, a multiplicity of motives has to be taken into account, factors including flexible working
hours, the possibility to balance home and work responsibilities, proximity to economic
activities, and sometimes even dissatisfaction with conditions and wages in formal jobs (Perry
et al., 2007; Franck, 2012). In Zimbabwe, Manyanhaire et al. (2007) has shown that women
predominately engaged in street vending as the sole breadwinners when their husbands were
in poor health or had passed away. The work of Noritake (2008) states that female street
entrepreneurs in Seoul, South Korea started to work and become the breadwinners because
their husbands failed to set up and continue business or they did not want to earn money
anymore.
As a consequence, in all households economically engaged in the street vending business,
women contribute significantly to the household capacity to cope with basic needs, including
clothing, school fees and health care (Milanzi, 2011). By participating in street vending,
women financially empower themselves and thus, reduce their economic dependence on
men. In South Africa three‐quarters of the women street vendors have even become the main
breadwinners in their households (Bedford, 1995; James, 1998 as cited by Lund, 1998). Similar
findings by Kusakabe (2006) in Phnom Penh, Cambodia and Tacoli (2012) supported the
observation that most of the women street food vendors were the major breadwinners in
poor households.
24
2.7. Gender (In)equality in Household Chores Although there are varying definitions in the literature, household work is simply defined as
unpaid work conducted to run and uphold a household (Bray, 2003). Slight differences in the
definitions of household labour in the relevant literature are owed to different research
purposes and measuring methods. Household work may include activities such as general
housecleaning, meal planning, cooking, dishwashing, cleaning up after meals, grocery
shopping, laundry (washing, ironing, and mending clothes), caring for sick family members,
yard work, animal care, taking out the garbage, paying bills and driving family members
(Bianchi et al., 2000; Coltrane, 2000; Badr and Acitelli, 2008; Lincoln, 2008).
The study by Fuwa (2004) based on recent data trends in the last 10 or 20 years presented
that women continue to bear most of the responsibilities for the home, including caring for
children and other dependent household members, preparing meals and doing other
housework. The study showed that in all regions – European countries, the United States of
America, Africa, Latin America and the Caribbean, Asia and Oceania – women spend at least
twice as much time as men on domestic work.
By the early 1990s, in many countries’ women became more educated and female
participation in the labour market increased significantly. Hence the distribution of unpaid
work between male and female was becoming a matter of new negotiations (Pignatti, 2016).
The increasing participation of women in both formal and informal labour markets was
assumed to transform the division of housework within the household. Accordingly, the study
by McDonald (2000) showed that gender roles in the family and the division of housework
have slowly adjusted. By contrast, Fuwa (2004) studied gender inequality and the division of
household labour in 22 countries and concluded that a rising employment rate for women at
the country level does not have an equalizing effect on the average division of housework.
Altintas (2009); Lachance‐Grzela and Bouchard (2010) hold a more differentiated position.
They found that the equal distribution of paid work is compensated by a more equal
distribution of housework and childcare, but only partly. Other studies agree that the

25
gendered gap in housework distribution is narrowing but on average, men still only devote a
third to half of the time on household labour compared to women (Coltrane, 2000; McGinnity
and Russell, 2008). In line with other scholars, DeGenova and Philip (2005) reported that
women, in most families, continue to undertake a majority of routine housework and
childcare. According to their findings, women complete three times the amount of routine
housework, compared to men. Consequently, most scholars agree, that employed women
spend an inordinate amount of time on the double burden of paid work and family
responsibilities (Sayer, et al., 2009; Cooke, 2011; Hu and Kamo, 2007; Hsu, 2008).
Unfortunately, in spite of numerous studies on street food activities, the distribution of
household chores among the women street food vendors and their husbands did not receive
the attention it deserves. Starting to fill that gap, is one of the purposes of this study.
3. Research Questions
The study will be conducted in two elected cities: Tangerang and Hat Yai. According to the
literature, this research has been organized into six main research topics. Several research
questions have been developed and grouped under each research topic.
Research topic 1: Demographic features of women street food vendors
a. What are the demographic profiles of a women migrant street food vendor in
Tangerang and Hat Yai (age distribution, marital status, place of origin, number of
children and family size, religion and education level)?
26
Research topic 2: Patterns and processes concerning migration
a. What were the causes of internal migration from rural to urban areas for women
street food vendors in Tangerang and Hat Yai?
b. Are there still connections to the home areas, do remittances play a role?
Research 3: Labour: Working conditions and pre‐conditions
a. When the women street food vendors started their business, who gave the vendors
advice, information and moral support?
b. Did the vendors have jobs in the host area before starting their current business?
Which ones?
c. What difficulties did the vendors face when they started the business?
Research topic 4: Access to Basic Resources: Start‐up Capital, Location, Facilities
a. Have the vendors gained access to appropriate locations and basic facilities? Do they
experience security and certainty – legally and financially? To what kind of pressure
are they exposed?
b. Do they get any support from local authorities? Do they participate in unions or
associations?
Research topic 5: Socioeconomic and livelihood conditions of women street food vendors
a. What is the impact of street food vending on the socio‐economic lives of women street
food vendors in the areas of Tangerang and Hat Yai?
b. Do the demographic profiles of women street food vendors, especially religion and
education levels, have an impact on their economic performance and on family roles?
c. Has there been a change in livelihoods assets before and after joining street food
vending (physical capital and housing, financial capital, human capital and social
capital) of women street food vendors?

27
Research topic 6: Gender (in)equality: household division of labour in the family
a. How do women street food vendors manage their roles at home? Did the role profiles
change when the vendors started running the street food business?
b. Is there any difference concerning the participation in household chores of husbands
who have a job and husbands who are unemployed?
c. Is there any difference concerning the participation in household chores of husbands
living in extended families?
4. Scope of the Comparison
Street food sectors are a global phenomenon, therefore they are heterogeneous and display
a great deal of regional diversity. This is one of the main impressions created by any kind of
literature review. However, researchers have mostly focused on one study region while they
have contributed less efforts to develop comparative approaches. Most of the existing
overview studies (Draper, 1996; Kusakabe, 2006; Otoo et al., 2011), on the other hand, are
rather additive than comparative. Insofar, systematic studies of different regions with a
comparison aim are still desirable. Moreover, further research attempts are required to
develop adequate tools of comparison. This study does not claim to completely cope with
these challenges. However, directing one set of methods (and one questionnaire) on two
locations in two neighbouring countries like Indonesia and Thailand, may be a first step
towards the solution of a problem that requires and deserves ensuing efforts in the future.
Indonesia and Thailand are Asian countries that to a European visitor look very much alike. In
fact, both countries in question share similar basic attributes: (i) in climate as well as in plant
and animal life; (ii) in basic food systems, as the staple food is rice; and (iii) economically, as
they are the biggest palm oil exporter in the world. Although they have both been categorized
as LDCs, Indonesia and Thailand are countries with high economic potentials. Both countries
have become economic powers to be reckoned with in Asia as well as in the world. This is
surprising because 20 years ago the two countries experienced an economic crisis, as a result
of the Asian financial crisis, which devastated the economies of both countries.

28
In the trading sectors, besides palm oil, an essential part of other major export commodities
is similar between both countries. According to data of UN Comtrade (2017), Indonesia and
Thailand have 11 similar commodities out of 30 main export commodities, such as natural
rubber latex, petroleum oils, automotive products and components, shrimp and crab, as well
as radio and television components. In concordance with the results of UN Comtrade, Jayadi
and Azis (2017) stated Indonesia and Thailand are competing in similar industries of the
primary sector, such as vegetable oil, natural rubber, cocoa, animal and vegetable oils, spices,
and plywood, tin, and coal. Further, the study by Pholpirul (2010) which used the export
similarity index (ESI) found that the export similarity index between Thailand and Indonesia
increased more significantly than the export similarity index between Thailand and Malaysia,
Singapore and the Philippines. These basic natural, climatic and economic similarities provide
a solid ground for comparisons concerning economic and social phenomena.
Simultaneously, the two countries are characterized by striking dissimilarities in the field of
economy, education, religion and demography. The basic indicator to be considered in the
economic sphere is the gross domestic product (GDP). In 2018, Indonesia's GDP reached $
1.02 trillion, compared to Thailand's GDP which was only $ 504.9 billion (The World Bank,
2019). The success of Indonesia in this matter is quite reasonable considering that Indonesia
has the advantage of territory, population, and economic potential over Thailand. However,
GDP, by itself, is not a reflection of prosperity because there are still several other factors that
need to be taken into account. According to The World Bank, a country's gross domestic
product (GDP) per capita per year is classified into four categories: High income (GDP per
capita of $ 12,375 or more), middle‐high income ($ 3,996 to $ 12,375), middle‐low income
(GDP per capita of $ 1,026 to $ 4,035 USD) and low income (GDP per capita of $ 1,025 or less).
Based on this classification, Indonesia is now categorized as a middle‐low income country with
a GDP of $ 3,557, while Thailand was ranked as a middle‐high income economy with a GDP of
$ 5,479 (54.0% higher than Indonesia) in 2018 (The World Bank, 2019a).
Education is said to affect the economic growth and welfare of a country because efforts to
improve people's welfare can be realized through education. For this reason, development

29
theories claim it necessary to improve the quality of human resources, because in their view
high‐quality human resources can provide a multiplier effect on the development of a
country, both within formal and informal economies. At present, almost all developing
countries in the world, including Thailand and Indonesia, have problems with the quality of
their human resources due to the low quality of education. This is indicated by a low literacy
rate, a generally low level of education and an educational process of a relatively inadequate
standard. However, the Early Development Instrument (EDI) score showed that Thailand's
education level is fairly better than Indonesia's. Thailand's education ranks 89th in the world
when referring to EDI score, which is 0.608 in 2017, while Indonesia ranks 108th with a score
of 0.603. UNESCO Institute of Statistics (2018) reported that higher education and secondary
education in Indonesia is still lagging behind neighbouring countries such as Thailand. For
example, in 2015 about 53.5% of the female population in Thailand received an
undergraduate degree compared to 32.0% in Indonesia (UNFPA, 2015). In 2013, the tertiary
education attainment level in Indonesia was 18.0% (OECD, 2018), much lower than in the
neighbouring country, where nearly 50.0% of Thai women attend a college (Romanow, 2012).
Indonesia and Thailand received the title of the most religious countries from the Pew
Research Center for Religion and Public Life (2019). The institute found that 95% of Thai
residents claimed to be religious and only 5% claimed to be non‐religious. Likewise, 93% of
Indonesia's population claimed to be religious. These results show that in both countries the
community considered that religion played an important role in their daily lives. While
Indonesia may be proud to be one of the most religious countries in the world, in reality,
strong religious attachments do not translate to tolerance. Consequently, Indonesia was
ranked 48th in the global social tolerance index, with an index value of 0.207. However,
Thailand was only slightly better, ranked 46th with an index value of 0.294 (Zanakis et al.,
2016). Comparable results were found by the 2015 Legatum Institute's Prosperity Index
(Legatum Institute, 2015), which in the index of tolerant countries in the world ranked
Indonesia in place 123 and Thailand in place 106. Considering the growing number of
intolerance cases in Indonesia, it is not surprising that Indonesia was placed at such a low
position.

30
In Thailand, Buddhism is the major religion and is practiced throughout the country’s
population, including the Thai King. Buddhism has a significant influence on social life in the
country, as Islam does in Indonesia. Buddhism values greatly influence the culture and social
life of Thai people. These values include the application of Buddhist principles, such as
promoting the values of freedom, violence avoidance, and practicing tolerance towards
others. Although most Thai people are said to have acquired the characteristics of kindness
and friendliness accordingly, some survey institutions (as mentioned before) still give a high
intolerance ranking to this country because in many Southern Thailand regions violence often
occurs against minority groups practicing Islam.
However, in general, Thailand looks more modern, developed and open to other countries
than Indonesia. This is indicated by the number of tourist visits to the country compared to
Indonesia. Data from the Ministry of Tourism of Thailand noted that in 2018, 38.27 million of
tourists visited the country, 7.5% more than during the previous year (Rhee, 2019). While in
the same year, Indonesia was only visited by 15.81 million of tourists (Rahman, 2019).
Obviously, as a kind of feedback, tourism provides effects for many sectors, especially the
culinary sector, which is mostly run by informal street food vendors.
The impression of a secular “modernity” displayed by the Thai society, becomes especially
visible in the demographic differences between Thailand and Indonesia. Presently in Thailand,
2.7 million people live alone, and the trend is increasing (UNFPA, 2015). UNFPA further stated
that in the next 20 years, one in five households is expected to be a one‐person household.
The State of Thailand’s Population report showed that the profile of those who choose to live
alone expressively increased from 6.0% in 1987 to 14.0 % in 2013 (UNFPA, 2015), with more
women choosing to live alone compared to men. Between 1970 and 2000, the percentage of
women remaining single at age 30‐34 rose from 8.0% to 16.1% in Thailand, while in Indonesia
it increased from 2.2% to 6.9% (Jones, 2006).

31
As demographic data are mostly supposed to belong to the “hard facts”, the rising trend of
one‐person households has been correlated to changes in another sphere of “hard facts”, in
this case to the improvement economic living standards. However, some authors have shifted
the attention to religious and cultural change. Ultimately, it would be misleading to simply
oppose these diverging explanations, as processes of urbanisation and increasing wealth
often go hand‐in‐hand with better education, and the liberalisation of social norms. These
almost inseparably intertwined processes can result in lifestyle choices that deviate from the
traditional cultural and religious expectations of forming and maintaining families (OECD,
2014). The United Nations Population Fund (UNFPA) study of the features of Thai families
reveals that in 2014 most Thai people have fewer children (1‐2 children) compared to 1964
when average Thai families had six children (UNFPA, 2015). According to the UNFPA's study
the average Thai families have reached the era of low fertility and longevity, while Indonesia
is still lingering in the period of demographic transition.
However, Thailand’s economic and demographic modernity is overshadowed by an obvious
ambiguity of the political system. Since 1948, Thailand’s history has been characterised by
political unrest and a continuous pendulation between authoritarian and military‐dominated
governments on one side and democratic movements on the other side. Currently, this
struggle has led to a system of a parliamentary façade with a strong backstage domination of
the military. Indonesia, on the other hand, after the dictatorship of Suharto had come to end
in years of turmoil (1998‐2000), has been slowly progressing on the way to a solidification of
democratic conditions, albeit not without serious setbacks and political unrest, mostly
inspired by ethnical discord. Today, however, on “The Economist Intelligence Unit's” 2018
Democracy Index Indonesia is ranked 65th (score 6.39), while Thailand is lagging behind in
place 106 (score 4.63) (the Economist Intelligence Unit, 2019). However, with respect to a
special kind of political behaviour that, according to the literature, makes the most striking
impact on the informal economies, a difference between Thailand and Indonesia is almost
non‐existing. On the World Corruption Index (Transparency International, 2019) the two
countries appear as neighbours, with Thailand in place 99/180 (score 36/100) and Indonesia
– slightly better – in place 89/180 (score 38/100).

32
To sum up, Thailand and Indonesia are neighbouring countries with a set of basic similarities
concerning natural environment, economic potentials and political experiences. However,
they exhibit major differences in demographic behaviour, noticeable divergences in the level
of income per capita, the level of education and the degree of openness of local communities,
the latter being regarded as a variable mainly dependent on the underlying religious
affiliation. Among other aims, this study is trying to find out which kind of footprint the large‐
scale differences in the formal world of income, religion, education, and demography leave
on a regionally precisely defined part of the informal sector, the micro‐world of local street
food vendors in two cities, their business and their lifestyle.
5. Hypotheses
In accordance with the literature and in close connection with the research questions, ten
hypotheses have been developed in the present study. They will have to be tested by suitable
statistical and qualitative tools, for the two study locations, respectively:
1. Economic factors are the main inducement for women street food vendors‘ migration.
2. Women street food vendors are poorly educated and sometimes even illiterate.
3. Street food vendors regard their business not as a temporary makeshift, but as a long‐
term breadwinning strategy.
4. As an inherent part of the informal economy, street food business is exposed to
various elements of incertainty and insecurity.
5. A lack of access to loans is the major obstacle in the start‐up process.
6. Family support is pivotal for the decision to migrate, the start‐up process and the
continuation of the business.
7. The income gained from street food business is on average above the national
Minimum Wages set in the formal economies.

33
8. The daily net income of the vendors is affected by age, marital status, education level,
number of children, religion, initial working capital and the duration of running the
business.
9. The income earned in the business has a major impact on the livelihood improvement
of the vendors‘ families and enables the families to accumulate money for savings and
remittances.
10. According to their role as a breadwinner, the women’s position in families and
neighbourhoods has fundamentally changed.

34
CHAPTER II
Research Methods
This chapter presents the methodology, research design, methods and techniques. Firstly, the
chapter describes the study area, sample size and outlines the sampling techniques used to
select the respondents. Secondly, this chapter presents the type and sources of data used as
well as the research methods and designs used to conduct this study. Thirdly, methods of data
processing and analyses are described. Since this study does not consider all the places in
Tangerang and Hat Yai, the main limitations of the study are also presented in this chapter.
1. Selection of the Study Areas and Respondents
1.1. Selection of the Study Areas
The research for this study was conducted in two cities, namely Tangerang, Indonesia and Hat
Yai, Thailand. Both cities have become a harbour for a large number of migrants from different
parts of the two countries. The cities were specifically selected due to rapidly increasing
numbers of street food vendors. The increase gained special momentum in the last economic
crisis of 2007/08.
Tangerang
After Jakarta and Bekasi, Tangerang is the third largest urban centre in the Jabotabek region,
the largest city in Banten province and currently the sixth largest city in Indonesia. It is located
approximately 25 kilometres (16 miles) west of Jakarta with an area of 164.54 square
kilometres (63.53 square miles). Tangerang is divided into thirteen sub‐districts (kecamatan),
which are Ciledug, Larangan, Karang Tengah, Cipondoh, Pinang, Karawaci, Jatiuwung,
Cibodas, Periuk, Batu Ceper, Tangerang, Neglasari, and Benda. Due to the lack of resources

35
and time constraints, it was difficult to research street food vendors located in all sub‐
districts. Therefore, a few districts were chosen with the expectation that a generalisation of
the Tangerang street food vendors could be reached from the respondents. The study was
undertaken in 6 out of the 13 districts. The different interview locations (Figure 2‐1) were
chosen on the basis of the socio‐economic setting of the community. Among the districts
those with a great deal of economic diversity were selected, where street food vendors could
serve many customers of various occupations. So, in the study areas, factories, government
offices, train stations, bus terminals, shopping centers, markets (modern and/or traditional)
and the schools/universities are situated. The total number of female street food vendor
respondents interviewed by geographic location in Tangerang is shown in Table 2‐1.
Hat Yai
Hat Yai is the largest city of Songkhla Province, the largest metropolitan area in southern
Thailand and the third largest metropolitan area of the country. The city is located on the
Southern Gulf Coast, roughly 950 km (600 miles) from Bangkok and 30 km (18.5 miles) from
the Malaysian border. Consequently, Hat Yai is a popular tourist destination for visitors from
Malaysia who enjoy dining and experiencing local cuisine. The city was ranked the fourth
largest in the country after Bangkok, Nonthaburi and Pak Kret (National Statistical Office of
Thailand, 2017).
The city of Hat Yai is divided into 13 sub‐districts (tambon) ‐ Hat Yai, Khuan Lang, Khu Tao,
Kho Hong, Khlong Hae, Khlong U Taphao, Chalung, Thung Yai, Thung Tam Sao, Tha Kham, Nam
Noi, Ban Phru, and Phatong. The two tambon ‐ Hat Yai and Kho Hong (Figure 2‐2), were
selected for this study as many migrant street food vendors from different parts of Thailand
were based in these locations. Moreover, the train station, bus terminal, the government and
private offices as well as many shopping malls, markets, schools and universities were found
in these sub‐districts. To certain degree, the economic structure of the selected districts tends
to be similar to the districts selected in Tangerang. The total number of female respondents
interviewed by geographic location in Hat Yai is presented in Table 2‐2.

36
Figure 2‐1. Locations of field survey in Tangerang city, Indonesia. Selected sub‐districts in Tangerang: 1. Kec. Cipondoh, 2. Kec. Ciledug, 3. Kec. Jatiuwung, 4. Kec. Cibodas, 5. Kec. Tangerang and 6. Kec. Karawaci. Source: Pemerintah Kota Tangerang, 2018

37
Figure 2‐2. Locations of selected tambon in Hat Yai city, Thailand. Selected sub‐districts include, 1. Hat Yai municipality and 2. Kho Hong municipality. Source: Sawadee Public Company, 2019.

38
Table 2‐1. Total number of female street food vendors by sub‐district in Tangerang
No Location (sub‐district) Number of respondents
1 Cipondoh 43
2 Ciledug 12
3 Jatiuwung 18
4 Cibodas 20
5 Tangerang 75
6 Karawaci 32
Total 200 Source: Field work conducted 2017‐2018; own compilation.
Table 2‐2. Total number of female street food respondents by tambon in Hat Yai
No Tambon Number of respondents
1 Hat Yai 65
2 Kho Hong 31
Total 96 Source: Field work conducted 2017‐2018; own compilation.
1.2. The Respondents on the Site
The selection of respondents was based on the criteria that (i) women migrants lived and
worked as street food vendors in Tangerang and Hat Yai cities and (ii) the respondents form
a part of the street food labour force. A ‘migrant’, according to Intercensal Population Survey
(SUPAS, 2010), is defined as a person who had moved officially to or lived at least six months
in the area of destination.
In the selected locations for the study, the researcher was introduced as a student conducting
research in Hat Yai about women street food vendors. The research assistants and the
researcher approached as many female street food vendors as possible in both Hat Yai and
Tangerang cities upon the agreement of using the information provided by the respondents
solely for academic purposes.
39
2. Sampling Method and Sample Size Purposive sampling technique was used to select the women street food vendors as the
respondents in Tangerang and Hat Yai. Malhotra and Birsk (2008) and Daniel (2012) explain
that the purposive sampling technique is considered ideal for research because it is primarily
qualitative and exploratory; requires limited financial and time resources; provides illustrative
examples for comparisons; lacks a comprehensive sampling frame and has a difficult‐to‐reach
population. Moreover, the use of purposive sampling permits a speedy collection of research
data. Cohen and Lea (2004) selected participants with specific characteristics including street
food vending, gender and migrant in the host communities to achieve the goals of their
research in sub‐Saharan African cities.
For the present study, the total sample size was 296 respondents consisting of 200
respondents in Tangerang and 96 respondents in Hat Yai. The participants were selected from
the six study areas in Tangerang and two in Hat Yai (Figures 2‐1 and 2‐2) with large numbers
of street food vendors. Firstly, the selection was based on specific characteristics of the
vending locations. The respondents were found around the markets, near downtown, on the
sidewalks, and at the edges of various stores. Furthermore, the respondents had to fulfill the
following criteria:
1. The street food vendors had to sell ready‐to‐eat food on a street or at a public place
by bike, food carts, food stalls as well as in a kiosk.
2. The respondent should be the owner of a street food business, not an employee.
3. Before starting with the questionnaire, the first question was about the future
respondent’s birthplace, to identify her as a migrant. Furthermore, a threshold of six
months of business duration was set to enhance the validity of the responses.

40
Table 2‐3. Geographical spreading sample selection in Tangerang and Hat Yai cities
Study locations
Sub‐district / Tambon Geographical spreading
Morning Evening
Tangerang
Cipondoh 30 13
Ciledug 9 3
Jatiuwung 13 5
Cibodas 15 5
Tangerang 60 15
Karawaci 20 12
Total 147 53
Hat Yai Hat Yai 50 15
Kho Hong 22 9
Total 72 24 Source: Field work conducted 2017‐2018; own compilation.
3. Type and Data Sources
The study was planned and conducted on the basis of both primary and secondary data
sources. Primary data was directly gathered by the researcher to address the questions whilst
the secondary data includes any relevant data collected by others but which are of
importance to the study (Dawson, 2002; Ahiadeke, 2008). A combination of these two sources
provided an opportunity for the researcher to learn about the phenomenon directly through
first‐hand information and from the perspectives of others (Dawson, 2002). Primary data was
collected with the help of both quantitative and qualitative methods. Research journals on
the subject matter and other related literature sources were reviewed for secondary data for
the study.
4. Research Methods and Designs
This section describes the research methodology used in the present study. Firstly, to examine
the economic potential of women migrant street food vending in urban Tangerang and Hat
Yai, a descriptive survey research design was adopted. Creswell (2014) explains that a
descriptive design is an approach that may combine qualitative and quantitative methods of
41
data collection and analysis. Kothari (2004) however, states that the qualitative approach is
appropriate to study a phenomenon concerning the subjective assessment of attitudes,
opinions and behavior of people whilst a quantitative study captures the general
characteristics of a phenomenon. Secondly, to address the objectives of this research study,
a combination of quantitative and qualitative methods, referred to as the mixed method was
used. The mixed research strategy employs different techniques of data collection. Thirdly, to
achieve mutual compatibility between quantitative and qualitative approaches in a thorough
manner, the application of the triangulation method was carried out.
4.1. Quantitative Approach
Quantitative research can be defined as research that explains phenomena according to
numerical data analysed by means of mathematically based methods, particularly statistics
and therefore can be seen as scientific in nature. Bryman (2001) argued that the use of
statistical data reduces the time and effort for research descriptions and analyses which the
researcher, otherwise would have invested in describing their results. Data including
numbers, percentages and measurable figures can be calculated by a computer through the
use of a statistical package for social science (SPSS) (Gorard, 2001; Connolly, 2007) which
saves energy and resources.
The aim of quantitative research in the present study is to measure and analyse causal
relationships between variables, such as the dependent and independent variables. In
quantitative research, the researcher collects more than one type of data to achieve a better
and more holistic picture of the current landscape of the field. The primary survey research,
such as semi‐structured questionnaire and structured observations were conducted in this
quantitative method of analysis.

42
4.2. Qualitative Approach
Unlike quantitative studies which encompass outcomes, generalisation, prediction and cause‐
effect relationships through deductive reasoning, qualitative studies are concerned with
process, context, interpretation, meaning or understanding through inductive reasoning
(Berg and Howard, 2012). Qualitative research produces findings not arrived at by traditional
statistical procedures or other means of quantification (Strauss and Corbin, 1998). Compared
to quantitiatve research, qualitative research does not hypothesise or predict outcomes of
the study (Creswell, 2014).
In contrast, the qualitative methods of research in this study aims to describe and understand
the phenomenon studied by capturing and communicating participants’ experiences in their
own words from interviews. Qualitative data instruments such as in‐depth interview and field
notes were used to collect data from participants in their natural settings. Open‐ended
responses let the researcher understand and present the information as it is seen and
experienced by the participants without predetermining those standpoints. Hence,
qualitative findings are more detailed and variable in content compared to quantitative
outcomes (Flick, 2004).
4.3. The Mixed Methods Research
In addition to standalone quantitative and qualitative approaches, the mixed method
research strategy was used in this study. This method involves the integration of both
qualitative and quantitative approaches where data are collected using a combination of
methods such as open‐ended and closed‐ended questionnaires, experiments, focus groups as
well as qualitative interviews. Proponents of this approach argue that the use of mixed
research methods allows researchers to simultaneously generalize from a sample to a
population and gain a richer contextual understanding of the phenomenon being researched
(Hanson et al., 2005; cited in Gray, 2009; Creswell, 2014). Therefore, a mixed research method

43
was used in collecting data for the present study and the presence of qualitative data assisted
the analysis of quantitative data.
4.4. Triangulation Design In the 1970s, Denzin developed this concept further into a more systematic approach of
triangulation for social research and expanded the scope of mixed‐methods research to the
whole research design (Flick, 2018). Denzin defined triangulation as “the combination of
methodologies in the study of the same phenomenon.” In social sciences, the use of
triangulation can be traced back to Campbell and Fiske (1959) who coined the term ‘multiple
operationism’. They argued that more than one method should be used in the validation
process to ensure that the variance reflected that of the trait and not of the method. Creswell
et al. (2003) however, claimed that triangulation design is the most common and well‐known
research design. Methodological triangulation has also been found to be beneficial in
providing confirmation of findings, more comprehensive data, increased validity and
enhanced understanding of the studied phenomenon (Halcomb and Andrew, 2005; Casey and
Murphy, 2009).
The triangulation approach is probably the most familiar of the mixed‐method models
(Creswell and Clark, 2007) with the rationale that the quantitative and qualitative phases
occur at the same time and the researcher equally values the two methods to subsequently
combine the strengths of each method of data (Flick, 2004; Mertler and Charles, 2008).
Therefore, the data are merged, and the results of the analyses are used simultaneously to
address the research questions by comparing findings from both quantitative and qualitative
analyses. Creamer (2018) stated that during interpretation, the triangulation design helps the
researcher to compare and contrast quantitative statistical results with qualitative findings in
order to elaborate valid and well‐substantiated conclusions about the problem under study.
Patton (2001) advocated for the use of triangulation by stating that triangulation strengthens
a study by combining different methods, which includes both quantitative and qualitative

44
research approaches. This is supported by Jick (2006) who mentioned that triangulation can
help researchers improve the precision of their judgements and compensate for the
shortcomings of each single method by the counterbalancing strengths of another.
In this study, the triangulation mixed methods approach was used to confirm and to verify
quantitative results (from questionnaire surveys and site observations) with qualitative
findings (from semi‐structured interviews). The objective was to supplement the
questionnaire results in instances where the questions asked during the interviews differed
from the questionnaire. It was hoped that by using this approach the nature of street food
vendor experience in running the street food business in Tangerang and Hat Yai could be
revealed comprehensively.
5. Data Collection Instruments and Methods
5.1. Data Collection Instruments
To address the research question in the most comprehensive way, two types of data
collection instruments were used during the fieldwork i.e. a questionnaire and an in‐depth
interview. These techniques were organized in a complementary fashion, with findings of
each method informing the process and progress of the others.
5.1.1. Questionnaire Survey
To obtain systematic, representative and reliable information, the semi‐structured
questionnaire was used to directly associate with the survey research based on the objectives
and research questions of this study. The questionnaire was developed before commencing
the fieldwork and complemented with street food vendor interviews. It was designed based
on the issues related to the theories in literature and to previous similar studies, focusing on
finding answers to similar criteria set. The questionnaire was designed to be answered by the

45
owners of street food stalls with an understanding that adjustments would be made later on
depending on the observations made and results obtained in the field. The questions were
created with the purpose of answering the research questions in this study.
The questionnaires consisted of ten sections (see Appendix 1), which focused on enterprise
structures of street food trading (i.e. history of business activities, production process, and
employment figures and legality); characteristics of human development of street traders (i.e.
economic capital, human capital and social capital); gender discrimination and family roles.
Most of the data obtained from this questionnaire were statistically amenable to serve as a
basis for generalisation.
All questions were designed to be as clear and simple as possible. The questionnaire was
translated into Bahasa Indonesia and Thai language. The pre‐survey questionnaire for Hat Yai
vendors was translated from English to Thai by a post‐graduate student from Thailand. The
final questionnaire for the survey phase was translated from Bahasa into the Thai language
by one of the Indonesian consulate staff in Songkhla, fluent in Indonesian and English. Prior
to carrying out field work, the questionnaire was carefully designed and discussed by the
researcher and their academic supervisor.
In the pre‐survey phase, the questionnaire was taken to the field and tested to see, if any
modifications were required. Some comments received during the pre‐survey phase were
recorded and considered in modifying the questionnaire. After the pre‐survey phase, the
researcher modified the questionnaire based on the results of field work and input from the
supervisor. Most modifications involved questions related to the socio‐economic impact of
street food vending, workplace conditions, history of business activities and family roles.

46
5.1.2. Semi‐Structured Interviews During the survey, it was found that important information required to address the research
questions of the present study was not included in the prepared questionnaires, and hence
needed to be covered in subsequent interviews. The semi‐structured interview was therefore
used with participants either during or just after surveys to gain additional knowledge and
information by allowing the participants to express their views in their own words. The
conversation was noted on the back of the survey questionnaire during the interview, to be
reconstructed afterwards at home. The researcher did not use a tape recorder during the
interview process for fear that its presence might cause the respondent to become rigid or
self‐conscious and refrain from discussing personal stories.
5.2. Methods of Data Collection
The data collection method used in this study was classified into two phases ‐ pre‐survey and
survey.
5.2.1. Pre‐Survey Phase
The pre‐survey was conducted with the aim of achieving an insight and information from
street food vendors in the study locations, about the impact of street food trading on socio‐
economic factors. More importantly, this phase attempted to conduct a census of street food
vendors in the sampled areas who fall within the definition specified in the present study. The
pre‐survey information was valuable for the design and construction of data collection
instruments in the survey phase (second field work).
During the pre‐survey phase in Hat Yai, Thailand the research team consisted of the
researcher as the principal researcher assisted by two field data collection assistants. Since
the researcher did not speak the Thai language, the recruited field assistants were both Thai
nationals fluent in English. The assistants were two male Masters students from Prince
Songkla University with experience in survey activities and therefore facilitated the process
of gathering information and data collection in the field. The researcher recruited the two

47
assistants following the recommendation of their fellow Indonesian students studying at the
same university. Post‐recruitment, the researcher explained the aims and methodology of the
present study to the assistants and due to their previous practical experiences in fieldwork,
the assistants understood what was required of them to conduct the study.
In Tangerang, Indonesia, the pre‐survey phase was carried out by the researcher and six
research assistants. All the research assistants were undergraduate students at the Nutrition
and Food Technology program, Surya University, Banten. Most of the research assistants did
not have previous experience in field research. Therefore, following recruitment, the
researcher organised a training program which included six hours long for each intensive
sessions on the procedures of data collection and the administration of the survey
questionnaire. The researcher explained about the procedures of data collection including
sampling procedures; interpersonal communication and ethical issues; skills to approach
street food vendors; gaining the trust of the respondents; interview techniques; phases and
challenges of data collection and techniques to responding to data collection problems.
Pre‐survey was conducted in Tangerang, Banten province, from 01 May to July 10, 2017, while
in Hat Yai, Southern Thailand, the field work was held from 15 July to October 18, 2017. The
researcher and the research assistants interviewed the respondents from different locations
of field work including public spaces such as bus stations, train stations, markets, schools,
government areas and shopping malls. In Hat Yai, the place of birth of the participating street
food vendors varied from Northern to Southern Thailand. The respondents who participated
in interviews in Tangerang came from several islands in Indonesia such as Java, Sumatera and
Kalimantan. During the field work, the researcher and the research assistants met the
respondents one to two times to complete one questionnaire. Out of 260 participants, 180
respondents and 80 respondents were collected in Tangerang and Hat Yai, respectively.

48
This pre‐survey phase helped the researcher to discover pitfalls and to modify the structure
and contents of the questionnaire. It also helped to appraise the reaction of respondents to
the survey questions. Moreover, the pre‐survey phase offered practical experiences for the
research assistants before they started collecting the main data in the final survey (second
field work).
5.2.2. Survey Phase
At the time of the survey phase, primary data were collected by administering the semi‐
structured questionnaire to sampled women street food vendors. The final phase (the second
field work) for the primary data collection was conducted between 06 March and 24 July of
2018. In Hat Yai, primary data were collected between 06 March to 30 April 2018. Two field
assistants were recruited for this phase where one assistant was a consulate of the Republic
of Indonesia in Songkla while the other assistant was a doctoral student at Prince of Songkla
University, Hat Yai. In this phase, the researcher set several criteria before recruiting the
research assistants. As this was the final phase of the research, the assistants were selected
based on the criteria that (i) they were local people who lived in Hat Yai city or nearby,
facilitating the reduced cost of transportation and accommodation; (ii) they spoke Thai and
were able to communicate in English or Malay dialect. Since the researcher did not speak
Thai, it was important to that the assistants could communicate with the researcher and (iii)
they have previous experience of data collection procedures (interviews) to show that they
are able to work independently.
Before the start of the study, the researcher trained the research assistants accordingly to
provide sufficient background knowledge about the study, how and why certain details were
being collected with the specific information included in the questionnaire. Since they all were
experienced in conducting surveys, the researcher did not experience any difficulty in
explaining the aims and objectives of the present study. In addition, the researcher explained
the purpose of each questionnaire, examined the questionnaires in detail and discussed how
to obtain and record answers. Data collection techniques in the fieldwork were also
discussed.
49
Fieldwork for the collection of primary data in Tangerang city was conducted between 07 May
and July 24, 2018. To avoid time being spent mainly on surveys, six new enumerators were
recruited. They were final year undergraduate students at Surya University and some of them
had considerable basic knowledge of social research methods. The researcher did not use
enumerators from the pre‐survey phase because they had graduated. After the recruitment,
the researcher explained the research objectives of the study and introduced techniques
involved in carrying out the survey questionnaire such as interview techniques, recording of
notes and note‐taking.
The researcher targeted 400 respondents from the study locations, however, only 296 street
food enterprise owners or vendors participated and were subsequently interviewed. This
original target of 400 respondents could not be met mainly due to time and budgetary
constraints. Out of 296 respondents, 200 vendors were sampled from the Tangerang city,
while the remaining 96 respondents were from Hat Yai city. Based on the formula (Leedy and
Ormrod, 2015), the margin of error for the samples in the study locations is below 10 per cent.
The formula for margin of error is calculated by multiplying critical factor (for a certain
confidence level) with the population standard deviation and then the result is divided by the
square root of the number of observations in the sample.
During the survey phase, a broad spectrum of data was gathered using the modified semi‐
structured questionnaire, based on the results of the pre‐survey phase at the previous stage.
This questionnaire included demographic characteristics of the vendors; history of the
business; the process of migration; cost and revenue of business activities; business assets;
membership to street food vendor associations; government policies; livelihood conditions;
household responsibilities, family roles and gender discrimination faced by vendors. The
questionnaires which were written in English were thoroughly reviewed to ensure that
written English could be easily translated into the local language (Thai and Bahasa) for the
interviews. The Thai national research assistant helped the researcher translated the
questionnaire from English to Thai language.
50
To complete the questionnaires, the researcher and the research assistants conducted face‐
to‐face interviews with street food enterprise owners. Before each interview, the researcher
and enumerators explained the rights of the vendors, the content and purpose of the study
and also practical information about how the interview would be carried out. The researcher
used the personal interview to collect primary data because it allowed for flexibility, better
focus and the possibility of rich, detail and in‐depth information (Patton, 2001). The
interviews took place at a location chosen by the vendors where they felt comfortable, which
was predominantly at their places of trading and in a few cases, at their residences. According
to the most favourable situation felt by the vendors, the interviews were arranged to be as
informal as possible.
During the survey phase, many respondents refused to be taped. In those cases, extensive
notes were made during the interview session to record participant responses. Where the
research assistant was invited to the interviewees’ home, they were always accompanied by
the researcher. In Hat Yai, the research assistant asked the researcher to join interviews
which took place in the Malay language. Generally, the interview with a vendor lasted for
about one to one‐half hours, but interviews at the places of trade meant that the vendor also
had to respond to customers as well as partake in other personal activities and therefore,
many respondents were visited twice to complete the interview.
5.2.3. Personal Biographical Narrative
A few personal biographical narratives were added to the research with the hope of providing
greater insight into the particular circumstances that shaped the lives of women street food
vendors. These personal biographical narratives complemented the data gathered during the
interview sessions. The vendors were offered to tell their story in their own way, without
interruption or guidance from the researcher. The method required the researcher to abstain
from interrupting and to offer the interviewee a sense of open‐ended space within which to
speak (Roseneil, 2012). During the vendors’ responses, the researcher would take notes about

51
the topics discussed by the vendor, paying particular attention to the sequence in which
topics were raised. This method allowed the interviewees to decide for themselves about the
topic they wanted to discuss whilst the interviewer only asked for additional details about the
events and experiences (Roberts, 2002; Roseneil, 2012).
A personal biographical narrative interview was used with participants either during or
immediately after the surveys. The biographical interview was to provide further
supplementary information about the vendors’ stories and experience of everyday life as well
as to obtain extensive and rich materials for the researcher to analyse. With the permission
of the participants, synopses of their life stories have been included in a few chapters of the
thesis.
As this method applied a qualitative approach, the number of participants was flexibly
adjusted to accommodate the process of research activities. Along with the survey phase,
the biographical narrative interviews were only conducted by the researcher. The researcher
prepared himself thoroughly for the interview. Furthermore, the researcher prepared
questions to assist in understanding the biography of each individual and the events that
occurred in their lives as a street food vendor. During the interview, the respondents had the
opportunity to tell the story of their whole life without interruptions, setting their own
priorities and following an associative or chronological structure as they deemed appropriate.
In Hat Yai, the research assistants accompanied the researcher when the researcher
conducted the biographical interviews to translate questions from the researcher to the
participant and conversely, translate participant responses.
52
The researcher chose the respondents for the in‐depth biographical interviews according to
following criteria:
1. The respondents had a business history of at least one year at the time of their
interview.
2. The targeted respondents were of different marital status, namely single, married, and
divorced.
3. The selected respondents had to represent at least three ethnic groups and three
areas of origin in the study areas.
The rationale behind the criteria above was to obtain a diverse perspective from the
respondents, so the biographical narratives obtained will be more varied. After determining
the criteria, the researcher asked the respondents if they were willing to be the "subject" in
the biographical narratives. Getting the respondent's permission made writing the biography
much easier and ensured they are open with information about their lives as a street food
vendor. Lastly, in total, 20 women street food vendors were enlisted as research participants
for the case studies, which consisted of 14 vendors from Tangerang and six vendors from Hat
Yai (Table 2‐4). The biographical accounts were elicited in face‐to‐face interviews. The
interview opened with a discussion of the participant’s current activity before they were
asked to tell the researcher about their previous activities; describing the changes in their life;
when they started the street food business; education; leaving the place of origin; getting
married and having children and running the street food vending business were offered as
examples of life events to outline their story and the interviews.

53
Table 2‐4. List biographical narrative participants in Tangerang and Hat Yai
No Name Religion Ethnicity Age Marital status
Education Come from Year of
migration
Year of starting the
business
Tangerang
1 Harti Islam Javanese
38 Married Primary school
Central Java
2002 2008
2 Harifah Islam Javanese 40 Divorced Secondary school East Java 2014 1999
3 Wati Islam Javanese
31 Married Secondary school
Central Java
2008 2017
4 Lina Islam Javanese
51 Married Secondary school
Central Java
1986 1999
5 Ida Islam Palembangnese
35 Divorced Secondary school Sumatera 2014 2016
6 Murni Islam Javanese
55 Married Senior high
school Yogyakarta 1991 2012
7 Noh Christian Chinese Indonesian 62 Married Illiterate Banten 1993 1993
8 Ria Islam Javanese
46 Married Secondary school
Central Java
1995 1995
9 Rusmini Islam Javanese 58 Married Primary school East Java 1984 2010
10 Yati Islam Javanese
46 Divorced Senior high
school Central
Java 1991 2010
11 Widi Islam Javanese
32 Married Secondary school
Central Java
2014 2017
12 Cawi Islam Sundanese 49 Married Illiterate West Java 1991 2002
13 Wartiyem Islam Javanese
49 Married Illiterate
Central Java 1987 2005
14 Susi Islam Javanese 20 Married Secondary school Yogyakarta 2000 2017
Hat Yai
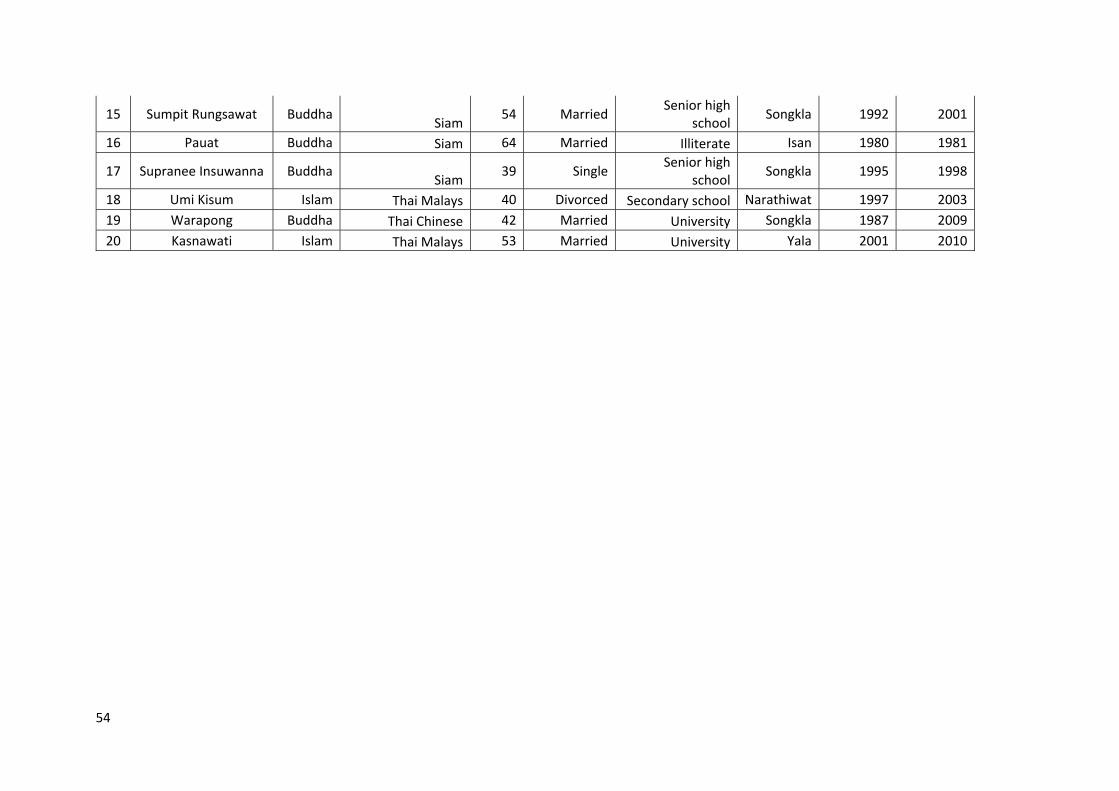
54
15 Sumpit Rungsawat Buddha Siam
54 Married Senior high
school Songkla 1992 2001
16 Pauat Buddha Siam 64 Married Illiterate Isan 1980 1981
17 Supranee Insuwanna Buddha Siam
39 Single Senior high
school Songkla 1995 1998
18 Umi Kisum Islam Thai Malays 40 Divorced Secondary school Narathiwat 1997 2003
19 Warapong Buddha Thai Chinese
42 Married University Songkla 1987 2009
20 Kasnawati Islam Thai Malays 53 Married University Yala 2001 2010

55
5.3. Data processing and analysis methods
Following the completion of data collection, the information gathered from the surveys was
processed and analyzed. Firstly, all collected data were carefully compiled and coded where
applicable for easy storage into a Microsoft Excel database. Secondly, the collected data were
checked randomly and when error was detected, the necessary corrections were made
accordingly after exporting to Microsoft Excel. Further consultation with the research
assistants was required to determine the cause of the error. Lastly, data were exported from
Microsoft Excel into SPSS version 23.0, which offered statistical tools to apply to social science
research.
Since the mixed‐method was used to collect the primary data in this study, triangulation was
applied in the data analysis. Combining quantitative and qualitative methods provided a
holistic picture of the street vending in the study locations. The quantitative approach was
used to analyse the data statistically while the qualitative approach facilitated the quantitative
approach. The results and statistical data were validated and cross‐checked by the case
narrative analyses of the street food vendors. Cases were developed from in‐depth interviews
with women street food vendors. Nevertheless, the case narratives also were cross‐checked
with quantitative evidence and data.
Quantitative data from the survey were analysed using SPSS. Both descriptive and analytical
techniques were utilised in order to analyze the data. Descriptive statistical techniques were
used to illustrate current situations, describe different variables separately and construct
tables and graphs presented in results. Frequency distribution, percentage, range, mean,
median, standard deviation, and cross‐tabulation were used to describe characteristics of
women street food vendors. In most cases, the opinions of respondents were grouped in
broader categories. Statistical analytical techniques were used to investigate relationships
between two variables and compare the difference between two groups of participants and
significant differences/association among the groups. Statistical tests including Chi‐Square
test, Pearson correlation and linear regression analysis were used in this study. Each statistical
56
technique used under specific conditions was dependent upon on the measurement scale of
different variables.
Qualitative data was analyzed with field notes and observations. All field notes were
immediately typed upon returning from the field each day. Qualitative analysis was
undertaken through content analysis described as a social research method appropriate for
studying human communications as well as other forms of social behavior (Babbie, 2005). This
involved identifying key patterns that emerged from the collected qualitative data to describe
benefits and challenges from the street food business, run by local vendors in the study
locations. Qualitative methods were also used as an additional tool to illustrate and further
explain statistical evidence emerging from the quantitative data.
Finally, all findings obtained from both quantitative and qualitative data analyses were
presented coherently in conjunction with each other to enrich the profile and the dynamics
of street food traders being analysed. This triangulation procedure is aimed at achieving
convergence, corroboration and correspondence of the research results.
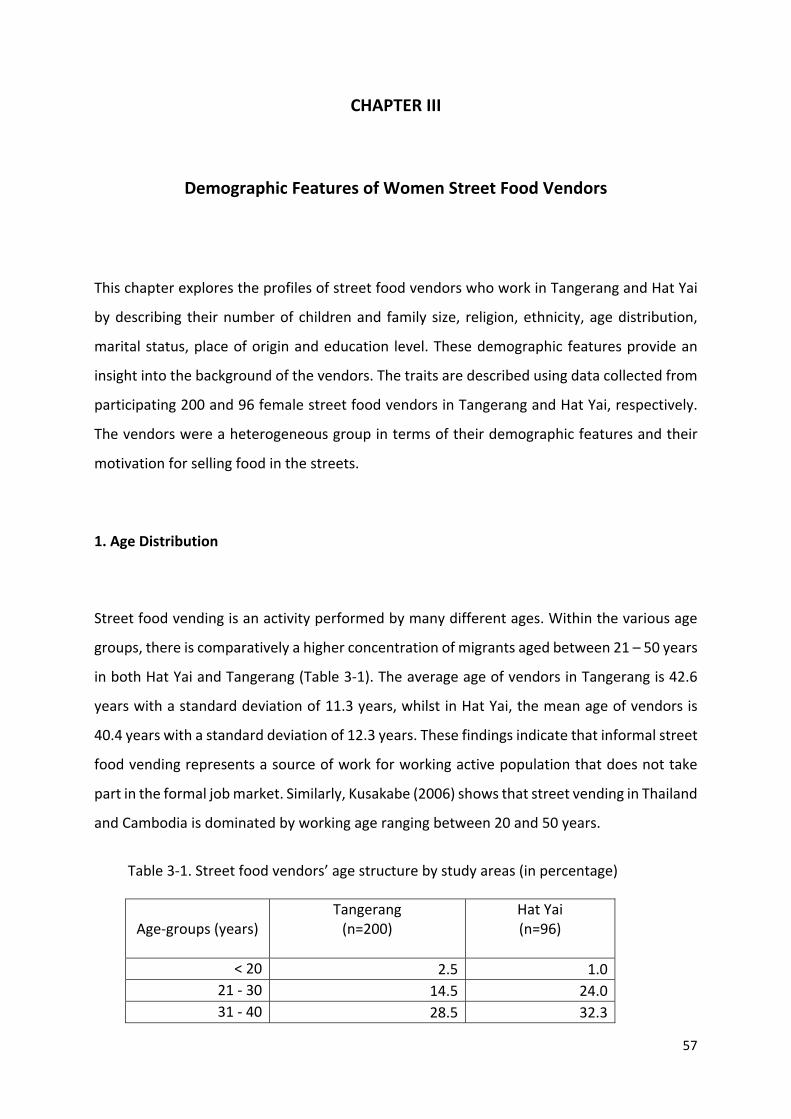
57
CHAPTER III
Demographic Features of Women Street Food Vendors
This chapter explores the profiles of street food vendors who work in Tangerang and Hat Yai
by describing their number of children and family size, religion, ethnicity, age distribution,
marital status, place of origin and education level. These demographic features provide an
insight into the background of the vendors. The traits are described using data collected from
participating 200 and 96 female street food vendors in Tangerang and Hat Yai, respectively.
The vendors were a heterogeneous group in terms of their demographic features and their
motivation for selling food in the streets.
1. Age Distribution
Street food vending is an activity performed by many different ages. Within the various age
groups, there is comparatively a higher concentration of migrants aged between 21 – 50 years
in both Hat Yai and Tangerang (Table 3‐1). The average age of vendors in Tangerang is 42.6
years with a standard deviation of 11.3 years, whilst in Hat Yai, the mean age of vendors is
40.4 years with a standard deviation of 12.3 years. These findings indicate that informal street
food vending represents a source of work for working active population that does not take
part in the formal job market. Similarly, Kusakabe (2006) shows that street vending in Thailand
and Cambodia is dominated by working age ranging between 20 and 50 years.
Table 3‐1. Street food vendors’ age structure by study areas (in percentage)
Age‐groups (years) Tangerang (n=200)
Hat Yai (n=96)
< 20 2.5 1.0
21 ‐ 30 14.5 24.0
31 ‐ 40 28.5 32.3

58
41 ‐ 50 29.5 19.8
51 ‐ 60 19.5 15.6
> 60 5.5 7.3
Total 100.0 100.0
Mean ± SD 42.6 ± 11.3 40.4 ± 12.3 Source: Field work conducted 2017‐2018; own compilation
FAO (1989) study reported that in other developing countries such as the Philippines and
Thailand, 79% and 80% of the population, respectively, had an average age of 41 years.
Muyanja et al. (2011) showed that 74.6% of the street vendors interviewed in Kampala,
Uganda were aged between 21 and 40 years whereas in India, Choudhury et al. (2011)
reported that 98% of the street vendors interviewed were aged between 21 and 50 years. In
line with the literature, the average age of vendors in Salvador, Bahia, Brazil was shown to be
40.3 years (Alves da Silva et. al., 2014).
In the sample populations within this study, it was observed that a high proportion of vendors
in Tangerang city was older compared to Hat Yai (Table 3‐1). However, a large majority of the
vendors interviewed in both cities were aged 30 years or more and many of them reported
their formal working days were over. Some vendors explicitly stated this was because they
were far too old to be hired. Beef ribs soup vendor in Tangerang, Ibu Ida said that she tried to
find a job in a company when she was 33 years old, following her divorce from her husband,
but she was unsuccessful at the time because of her age.
“I’m struggling to find a job in a factory or a company. However, no one wants to hire someone my age. It's not easy for me to get a job. Many companies want young
employees.”
Ibu Ida is now 35 years old and does not think anyone would hire her. She explains that is the
main reason why she started the street food business. Indonesian stir‐fried rice vendor, Ibu
Ria expressed the same feelings as she is 46 years old, it would be difficult for her to find a job
in wage labour.
59
“When I was the thirties, I tried to find a job but never succeeded. At that time, I was only offered a job as a housemaid. Besides being age, I also don't have any skills, so it's
hard for me to get a formal job.”
Like the vendors in Indonesia, street food vendors in Thailand experience the same problem.
Of note, the recruitment of employees in the Thai formal economy is discriminatory regarding
age and gender. This form of discrimination is not illegal and is very common. Several vendors
conveyed this opinion in the in‐depth interviews. One of the interviewees, Pee Umi Kassuem,
a 32‐year‐old spoke of her experience about the inconvenience of applying for a job as follows:
“Three years ago, when I was 30 years old, I tried to find a job in some companies as a staff. I looked for a job in newspapers, but the age restriction was stated in these
vacancies, such as a woman under 30. Certainly, my age is an impediment to applying for these positions.”
One vendor, Pee Pauat, Thai street snack vendor, who is 64 years old, narrated the following
point:
“I want to be hired by a factory, but they probably would not hire me because I am in my sixties. It was extremely difficult to find a job after age 50. Most people from my age
find work as a street sweeper or a cleaner. I don’t want to do that kind of work, so I decided to work as a street food vendor.”
Even fairly “young” people, like Pee Umi Kassuem, a 32‐year‐old spoke of the same experience
of age‐related inconvenience when applying for a job as follows:
“Three years ago, when I was 30 years old, I tried to find a job in some companies as a staff. I looked for a job in newspapers, but the age restriction was stated in these
vacancies, such as a woman under 30. Certainly, my age is an impediment to applying for these positions.”
Table 3‐2 is a presentation of a cross‐tabulation of age‐groups of women street food vendors
with the age of their business showing that the age of business is directly proportional to the
age of vendors. For instance, 44 out of 296 vendors (14.8 %) aged between 31 and 50 years
have run their businesses for one to five years, indicating that the street food business is
dominated by productive women aged between 31 and 50 years. The interest of women aged
60 years and older to practice the street food business is quite small.

60
Table 3‐2. Cross tabulation between age‐groups of vendors and age of street food business
Age of business
Age groups Total
<20 21‐30 31‐40 41‐50 51‐60 >60
< 1 2 15 16 9 4 2 48
1 – 5 3 22 25 19 7 5 81
6 – 10 0 12 14 21 18 1 66
11 – 15 1 1 17 8 6 1 34
16 – 20 0 2 10 10 9 3 34
> 20 0 0 6 11 10 6 33
Total 6 52 88 78 54 18 296 NB. Figures in brackets are percentages Source: Field work conducted 2017‐2018; own compilation
Furthermore, a correlation between the age‐groups of the vendors and the age of their
businesses (Table 3‐3) was established by a statistically significant linear relationship (p<0.01).
The direction of the relationship is positive; i.e. therefore, a higher age of the vendors is
associated with a greater duration of business.
Table 3‐3. Correlation between age‐groups and age of business across study locations
Age‐groups Age of business
Age‐groups
Pearson Correlation 1 0.347**
Sig. (2‐tailed) 0.000
N 296 296
Age of business
Pearson Correlation 0.347** 1
Sig. (2‐tailed) 0.000
N 296 296 Note, **. Correlation is significant at the 0.01 level (2‐tailed).
With regard to the educational level of the street vendors interviewed, younger vendors (20‐
40 years) were educated to a higher level compared to than elderly vendors (Table 3‐4). For
instance, 18 of 35 vendors who had academic/university education were the younger vendors
(21‐30 years). Only a few teenaged street vendors and those aged under 30 years were
educated to the primary school level or below. There are variations between young vendors and
elderly vendors regarding the level of education.

61
Table 3‐4. Cross‐tabulation of age‐groups and levels of education
Education level Age group
Total <20 21‐30 31‐40 41‐50 51‐60 >60
No schooling 0 0 3 6 3 3 15
Primary school 1 4 14 21 21 7 68
Secondary school 3 12 36 23 10 3 87
Senior High school 2 18 26 24 17 4 91
Academic / university 0 18 9 4 3 1 35
Total 6 52 88 78 54 18 296 NB. Figures in brackets are percentages Source: Field work conducted 2017‐2018; own compilation
A Pearson correlation examination on the age‐groups and the level of education indicate a
statistically significant reverse between them (p < 0.01) as shown in Table 3‐5. The direction
has a negative relationship (‐0.31). However, the magnitude or strength of the association is
approximately moderate (0.3).
Table 3‐5. Correlation between age‐groups and level of education across study locations
Age‐groups Education level
Age‐groups
Pearson Correlation 1 ‐.313**
Sig. (2‐tailed) .000
N 296 296
Education level
Pearson Correlation ‐.313** 1
Sig. (2‐tailed) .000
N 296 296 Note, **. Correlation is significant at the 0.01 level (2‐tailed).
2. Marital Status and Household Profiles
Marital status is another demographic variable that might influence enterprise performance.
Marital relationships have implications for individual decision making and influencing what
people can or cannot do. It is quite clear from Table 3‐6 that a larger proportion of Hat Yai’s
vendors than Tangerang’s vendors were not married and were single. Conversely, the

62
proportion of Tangerang’s vendors who were currently married were higher as compared to
Hat Yai’s vendors.
Table 3‐6. Marital status of street food vendors (in percentage)
Marital status (%) Tangerang Hat Yai
Single 5.0 21.0
Married 87.5 66.7
Separated 1.0 1.9
Widowed 4.0 7.6
Divorced 2.5 2.9
Total 100.0 100.0 Source: Field work conducted 2017‐2018; own compilation
The differences in marital status across study locations is statistically significant (p<0.01)
(Table 3‐7) as the vendors in Hat Yai were more likely to live as a single family than Tangerang's
vendors do. This is perfectly in line with general trends in Thailand’s demographic features
(see introduction). In the present study, many women in Hat Yai unable to find a suitable
partner may have chosen to forego a partnership entirely.
Table 3‐7. Chi‐square, χ2, ɸ and Cramer's V tests between marital status and study locations
Value df Asymp. Sig. (2‐
sided)
Pearson Chi‐Square 26.841a 4 .000
Phi .301 4 .000
Cramer's V .301 4 .000
Contingency Coefficient
.288 4 .000
N of Valid Cases 296 a3 cells (30.0%) have expected count less than 5. The minimum expected count is 1.30.
Data from the in‐depth interview stage were compiled to understand the household dynamics
of the women street food vendors in both Hat Yai and Tangerang cities (Table 3‐8). In Hat Yai,
20.9% of the total vendors were characterized by one‐person household compared to 3.0% of
total vendors in Tangerang. UNFPA (2015) reported similar findings in Thailand, where 2.7
million Thais were living alone in 2014.
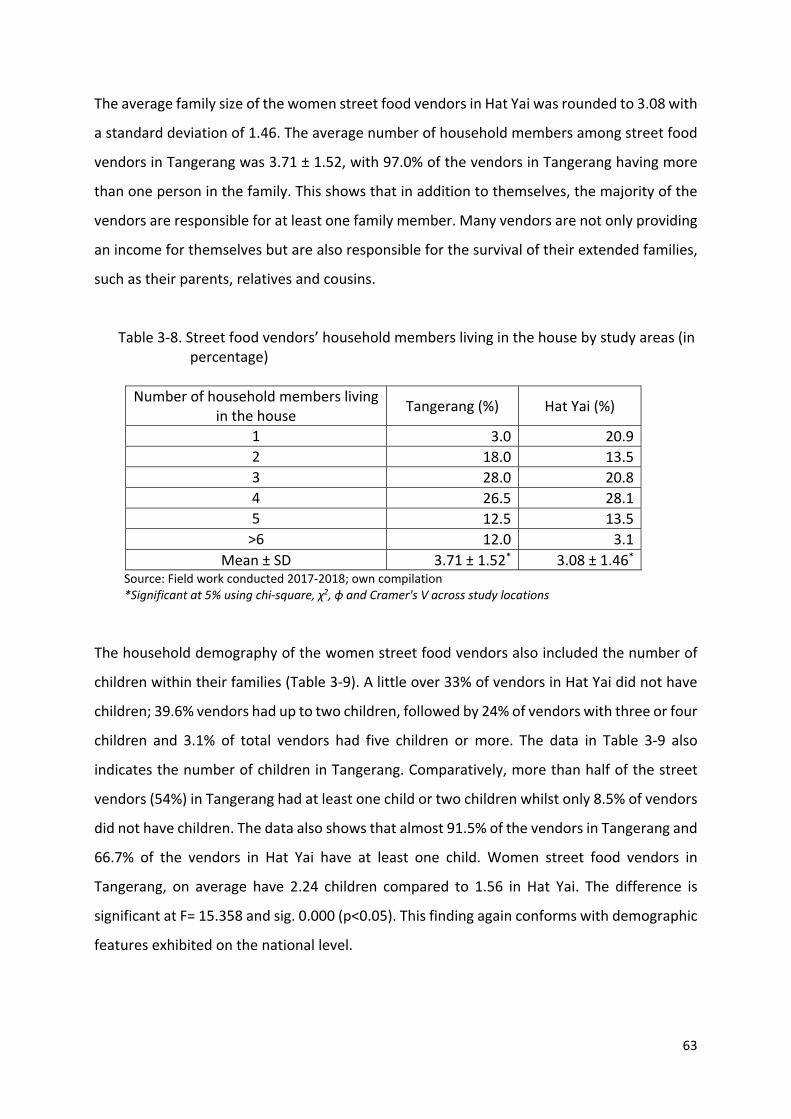
63
The average family size of the women street food vendors in Hat Yai was rounded to 3.08 with
a standard deviation of 1.46. The average number of household members among street food
vendors in Tangerang was 3.71 ± 1.52, with 97.0% of the vendors in Tangerang having more
than one person in the family. This shows that in addition to themselves, the majority of the
vendors are responsible for at least one family member. Many vendors are not only providing
an income for themselves but are also responsible for the survival of their extended families,
such as their parents, relatives and cousins.
Table 3‐8. Street food vendors’ household members living in the house by study areas (in percentage)
Number of household members living in the house
Tangerang (%) Hat Yai (%)
1 3.0 20.9
2 18.0 13.5
3 28.0 20.8
4 26.5 28.1
5 12.5 13.5
>6 12.0 3.1
Mean ± SD 3.71 ± 1.52* 3.08 ± 1.46* Source: Field work conducted 2017‐2018; own compilation *Significant at 5% using chi‐square, χ2, ɸ and Cramer's V across study locations
The household demography of the women street food vendors also included the number of
children within their families (Table 3‐9). A little over 33% of vendors in Hat Yai did not have
children; 39.6% vendors had up to two children, followed by 24% of vendors with three or four
children and 3.1% of total vendors had five children or more. The data in Table 3‐9 also
indicates the number of children in Tangerang. Comparatively, more than half of the street
vendors (54%) in Tangerang had at least one child or two children whilst only 8.5% of vendors
did not have children. The data also shows that almost 91.5% of the vendors in Tangerang and
66.7% of the vendors in Hat Yai have at least one child. Women street food vendors in
Tangerang, on average have 2.24 children compared to 1.56 in Hat Yai. The difference is
significant at F= 15.358 and sig. 0.000 (p<0.05). This finding again conforms with demographic
features exhibited on the national level.

64
Table 3‐9. Street food vendors’ number of children by study areas (in percentage)
Number of children Tangerang Hat Yai
0 8.5 33.3
1 20.5 17.7
2 33.5 21.9
3 21.5 16.7
4 11.5 7.3
>5 4.5 3.1
Mean ± SD 2.24 ± 1.35* 1.56 ± 1.44* Source: Field work conducted 2017‐2018; own compilation *Significant at 5% using chi‐square, χ2, ɸ and Cramer's V across study locations
In both Tangerang and Hat Yai cities, at the 99% confidence level, the variable of religion has
no significant relationship with number of children. From the bivariate analysis, as shown in
the Table 3‐10, the education levels of the vendors have a significant relationship with the
number of children in their households. The relationship is a negative one because as
educational level increases, the number of children decreases. Understandably, education
would impede childbearing. In nearly every country (Mehrass et al., 2017; The Economist
Intelligence Unit, 2019), women with more education tend to have fewer children than less‐
educated mothers.
Table 3‐10. Correlation between number of children and religion and education levels of the
vendors in Hat Yai and Tangerang
Variables Tangerang Hat Yai
Number of children Number of children
Religion
Pearson Correlation ‐0.051 ‐0.024
Sig. (2‐tailed) 0.471 0.816
N 200 96
Education levels
Pearson Correlation ‐.238** ‐.370**
Sig. (2‐tailed) 0.001 0.000
N 200 96 **. Correlation is significant at the 0.01 level (2‐tailed).
In terms of the family dynamics, out of the total 96 vendors in Hat Yai, 45.8% were living with
their nuclear family whilst 11.5% respondents were living in a joint family, including their
parents (Table 3‐11). In Tangerang, 80.5% of the vendors surveyed were a part of the nuclear

65
family and 4.5% were living with relatives rather than their immediate family members.
Approximately 2.5% of the total vendors in Tangerang were living alone compared to a higher
percentage of vendors (10.4%) in Hat Yai.
Table 3‐11. Street food vendors live with whom by study areas (in percentage)
Live with whom Tangerang Hat Yai
Only children 3.0 6.3
Only husband 4.0 4.2
Husband and children 80.5 45.7
Husband, parents and children 3.5 11.4
Husband, children and relatives 4.5 6.3
Only friends 0.5 9.4
Alone 2.5 10.4
Spouse 1.5 6.3
Total 100.0 100.0 Source: Field work conducted 2017‐2018; own compilation
3. Ethnicity
In terms of ethnic distribution of vendors, Table 3‐12 shows that the majority of street food
vendors in Tangerang are Javanese (56%), followed by Sundanese (23%) and Chinese (9.5 %).
Table 3‐12. Ethnic Affiliation of Tangerang’s street food vendors (n=200)
Ethnic Affiliation Frequency % (%)
Sundanese 46 23.0
Javanese 112 56.0
Bataknese 2 1.0
Padangnese 2 1.0
Chinese 19 9.5
Madurese 4 2.0
Betawinese 11 5.5
Others 4 2.0
Total 200 100.0 Source: Field work conducted 2017‐2018; own compilation
Four‐fifths of all the Muslims in Thailand are ethnic Malays, who live primarily in the area near
the Northern part of Peninsular Malaysia (Southern Thailand). They comprise around five

66
percent of the total population of Thailand (69.2 million in 2018 based on the latest United
Nations estimates) and are the second largest minority group, after the Chinese. When the
vendors were asked about their ethnicity and ethnic backgrounds, 79.2% of the total vendors
answered their ethnicity as Siamese, followed by Malay (19.8%) (Table 3‐13).
Table 3‐13. Ethnic Affiliation of Hat Yai’s street food vendors (n=96)
Ethnic Affiliation Frequency % (%)
Siam 76 79.2
Chinese 1 1.0
Malay 19 19.8
Total 96 100.0 Source: Field work conducted 2017‐2018; own compilation
4. Religious Affiliation
Religion in Thailand is varied. According to the National Statistical Office of Thailand (2015),
approximately 94.5% of the population is Buddhist (nearly all of them Theravada Buddhist)
and 4.29% is Muslim. There are small Christian, Confucian and Hindu populations. The
majority of Thai Muslims live in the most southerly provinces near the Malaysian border. Even
though the Muslim population in Thailand is relatively small, however, Thailand's
southernmost provinces — Pattani, Yala, Narathiwat and Hat Yai (part of Songkhla) — have
large populations of Muslims with an estimated 1.5 million people. The National Statistical
Office of Thailand (2015) reported that Islam was the second largest religion in Southern
Thailand, which made up 24.3% of the total population, aged 15 years or older, followed by
Christianity (0.2%). Buddhism was still the majority religion in this region with around 75.4%
of adherents. The religious affiliation of vendors in Table 3‐14 obtained from field research
shows relatively similar distribution of religion in Southern Thailand. Interestingly, the present
study shows that there are more women Muslim vendors (35.4%) in Hat Yai than the average
Muslim population.

67
Table 3‐14. Religious affiliation distribution of street food vendors in the study locations (in percentage)
Religion Tangerang Hat Yai
Buddhism 4.5 63.5
Islam 89.5 35.4
Catholicism 1.5 0.0
Protestantism 4.0 1.0
Hinduism 0.5 0.0
Total 100.0 100.0 Source: Field work conducted 2017‐2018; own compilation
Most other Southeast Asian countries have Muslim minority populations, including the
Philippines, Thailand, Singapore and Myanmar (Burma) but this is not the case with Indonesia.
Islam is the dominant religion in Indonesia, with 87.2% of its inhabitants identifying
themselves as Muslim (Statistics Indonesia, 2010). Like others regions in Indonesia, Islam is by
far the most common religion in Tangerang city, accounting for almost 87.1% of population,
followed by Protestantism (5.8%); Buddhism (4.1%); Catholicism (2.7%); Hinduism (0.21%) and
Confucianism (0.06%) (BPS Kota Tangerang, 2019).
The communities of vendors in Tangerang can be categorised into mainly Islamic, Protestant
and Buddhist communities. Though the majority of vendors are Muslim (89.5%), this is
followed by Buddhists and Protestants at 4.5% and 4%, respectively. Only 1.5% and 0.5% of
the street food vendors follow Catholicism and Hinduism. This illustrates that the data shown
regarding the religious affiliations of the street food vendors in this study (Table 3‐14) is nearly
the same as their proportion in the Tangerang city.
5. Educational Level
Education is one of the most important factors in one’s upbringing in society that shapes and
affects their attitudes and understanding to any social setting. Consequently, responses in any
survey are influenced by the educational status of the respondents. It is, therefore, imperative
to know the educational background of the vendors. Street food vending does not require
special educational skills to operate it and it is easy to enter for those who have low education
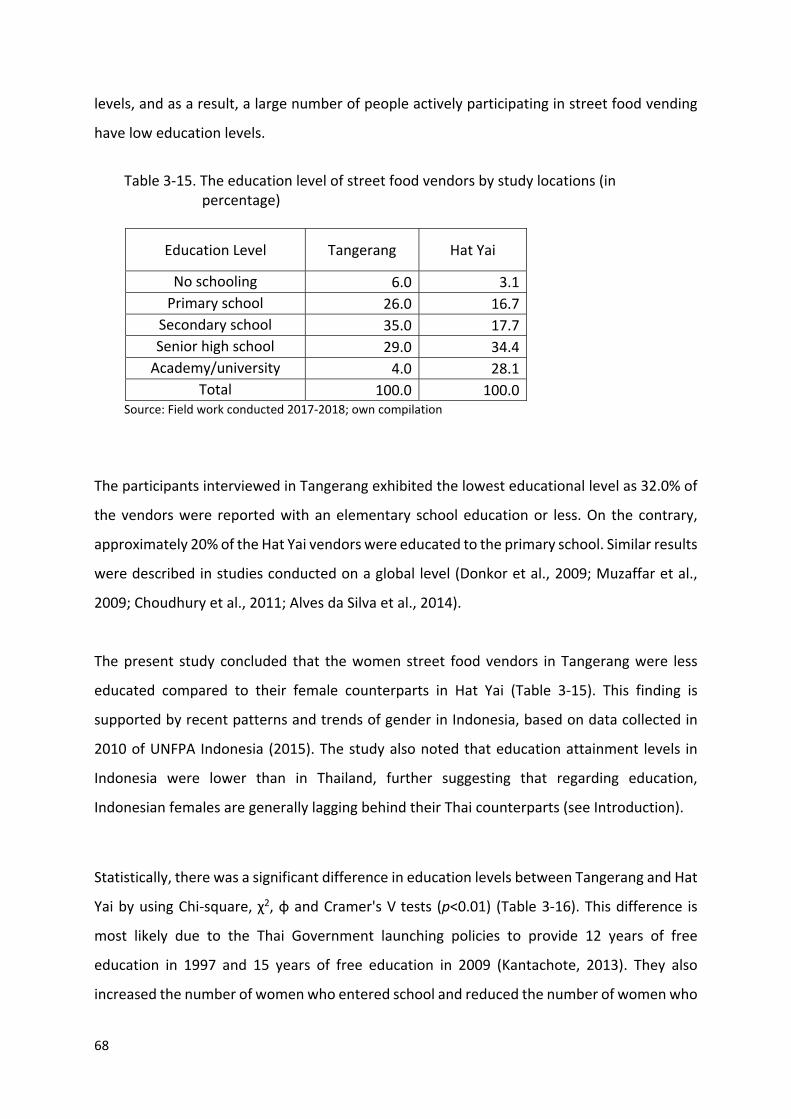
68
levels, and as a result, a large number of people actively participating in street food vending
have low education levels.
Table 3‐15. The education level of street food vendors by study locations (in percentage)
Education Level Tangerang Hat Yai
No schooling 6.0 3.1
Primary school 26.0 16.7
Secondary school 35.0 17.7
Senior high school 29.0 34.4
Academy/university 4.0 28.1
Total 100.0 100.0 Source: Field work conducted 2017‐2018; own compilation
The participants interviewed in Tangerang exhibited the lowest educational level as 32.0% of
the vendors were reported with an elementary school education or less. On the contrary,
approximately 20% of the Hat Yai vendors were educated to the primary school. Similar results
were described in studies conducted on a global level (Donkor et al., 2009; Muzaffar et al.,
2009; Choudhury et al., 2011; Alves da Silva et al., 2014).
The present study concluded that the women street food vendors in Tangerang were less
educated compared to their female counterparts in Hat Yai (Table 3‐15). This finding is
supported by recent patterns and trends of gender in Indonesia, based on data collected in
2010 of UNFPA Indonesia (2015). The study also noted that education attainment levels in
Indonesia were lower than in Thailand, further suggesting that regarding education,
Indonesian females are generally lagging behind their Thai counterparts (see Introduction).
Statistically, there was a significant difference in education levels between Tangerang and Hat
Yai by using Chi‐square, χ2, ɸ and Cramer's V tests (p<0.01) (Table 3‐16). This difference is
most likely due to the Thai Government launching policies to provide 12 years of free
education in 1997 and 15 years of free education in 2009 (Kantachote, 2013). They also
increased the number of women who entered school and reduced the number of women who
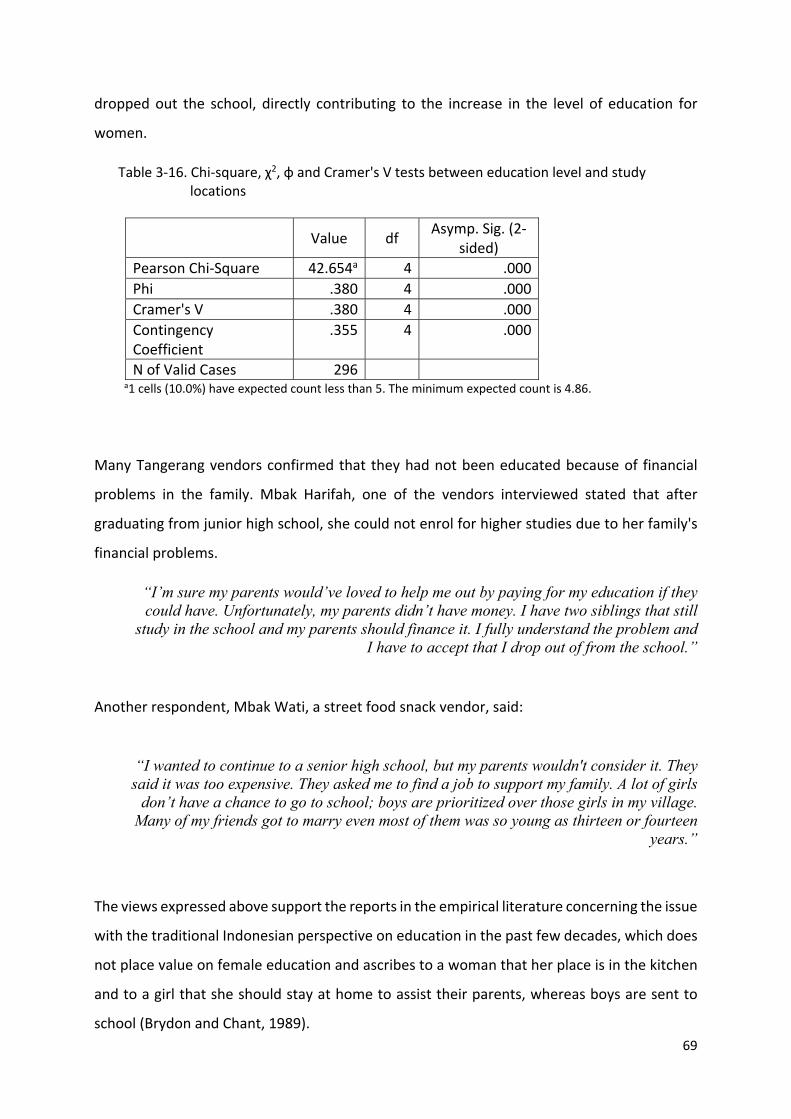
69
dropped out the school, directly contributing to the increase in the level of education for
women.
Table 3‐16. Chi‐square, χ2, ɸ and Cramer's V tests between education level and study locations
Value df Asymp. Sig. (2‐
sided)
Pearson Chi‐Square 42.654a 4 .000
Phi .380 4 .000
Cramer's V .380 4 .000
Contingency Coefficient
.355 4 .000
N of Valid Cases 296 a1 cells (10.0%) have expected count less than 5. The minimum expected count is 4.86.
Many Tangerang vendors confirmed that they had not been educated because of financial
problems in the family. Mbak Harifah, one of the vendors interviewed stated that after
graduating from junior high school, she could not enrol for higher studies due to her family's
financial problems.
“I’m sure my parents would’ve loved to help me out by paying for my education if they could have. Unfortunately, my parents didn’t have money. I have two siblings that still
study in the school and my parents should finance it. I fully understand the problem and I have to accept that I drop out of from the school.”
Another respondent, Mbak Wati, a street food snack vendor, said:
“I wanted to continue to a senior high school, but my parents wouldn't consider it. They said it was too expensive. They asked me to find a job to support my family. A lot of girls
don’t have a chance to go to school; boys are prioritized over those girls in my village. Many of my friends got to marry even most of them was so young as thirteen or fourteen
years.”
The views expressed above support the reports in the empirical literature concerning the issue
with the traditional Indonesian perspective on education in the past few decades, which does
not place value on female education and ascribes to a woman that her place is in the kitchen
and to a girl that she should stay at home to assist their parents, whereas boys are sent to
school (Brydon and Chant, 1989).
70
Unlike Tangerang’s vendors, most Hat Yai’s vendors in this study, who were engaged in the
informal sector activities, were reasonably educated. In line with the vendors’ accounts and
the results of this study, (Romanow, 2012) states that compared to some decades ago, Thai’s
women are now offered more educational opportunities than before, and it is becoming
increasingly accepted for women to become a part of the workforce. This is causing many Thai
women who were migrating from rural areas to urban areas to seek jobs.
Among the interviewees in Hat Yai, a few were highly educated (high school and above). One
of the vendors mentioned that: “Many who engage in street food selling are students who have
completed their primary and secondary schooling. There were also some university graduates.”
Some were vending due to a lack of employment opportunities as alluded to by a few
respondents in the in‐depth interviews. One of the street food vendors in Hat Yai, Pee Vikanda
Kuymsap explained that:
“I kicked out of my home to gather some funds and enroll in a university here in Hat Yai. In my village, it is not easy to find a job, even casual jobs, because … not many
economically engaging activities were taking place within my village.”
6. Summary
The majority of the vendors are concentrated between the ages of 20‐50 years. Around half
of the vendors of Tangerang (approximately 58 %) and Hat Yai (52.1 %) are aged between 31
and 50 years, with the proportion of vendors declining over the age of 50 years. A Pearson
correlation examination showed that there was a statistically significant linear relationship
between the age‐groups and level of education.
With respect to marital status, the highest proportion of vendors of these above mentioned
are married, suggesting that married people carry out this occupation to support their
families. However, the proportion of vendors in Tangerang who were married at the time of
the study was higher than the proportion of married vendors in Hat Yai. The differences in
71
marital status across study locations is statistically significant (p<0.01). It can be explained by
general demographic data confirming that people in Thailand are more likely to live as a single
person than people in Indonesia.
In terms of household size, around 54.5% of the Tangerang vendors reside with three to four
household members while 34.4% of the respondents in Hat Yai have one to two coresidents.
The average number of children in Tangerang is 2.24 and in Hat Yai 1.56, respectively. The vast
majority of vendors in Tangerang (80,5%) were living with their nuclear family and, in Hat Yai
it is only 46%. These differences can be explained by a reference to general demographic data
of the two countries, reflecting a more “modern” demographic structure in Thailand.
However, there are some data in contradiction with this generalized view. So, in Hat Yai, 11.5%
of the vendors were living in stem families (husband, parents and children) and 6.3 % in joint
families composed of husband, children and relatives, both being mostly regarded as
reflecting a more “traditional” lifestyle. In Tangerang it was only 3.5%, respectively 4,5%.
The religious affiliation of the vendors is important because some religions proscribe certain
types of food or the way they are processed. Tangerang is a cosmopolitan city with diverse
religions, but the vast majority of these population follows Islam, which also explains why
most of the vendors are Muslim. In contrast to Tangerang city, the majority of vendors in Hat
Yai profess the Buddhist faith and only 35.4% are Muslims because Thailand is known as one
of the largest Buddhist‐populated countries in the world.
Concerning the education level of vendors, the participants interviewed exhibited a low
educational level, exclusively in Tangerang city, as almost 67.0% of the vendors reported
having a secondary school education or less. On the contrary, out of the total vendors, 34.4%
of Hat Yai’s vendors had senior high school education level, of which 28.1% had attended
college or university, which is in conformity with general data on education performance in
the two countries.

72
CHAPTER IV
Causes and Consequences of Women Street Food Vendors Migration
Over the last decades or so, international migration has garnered considerable attention.
More recently, internal migration, particularly in general and rural‐urban migration was
viewed favorably in the economic development literature. Several studies globally indicate
that internal migration is a driver of growth and an important route out of poverty with
significant positive impacts on people’s livelihoods and well‐being (Siddiqui, 2003; Hossain,
2001; Murrugarra et al., 2011; Sukamdi and Mujahid, 2015). In Asia, including Indonesia and
Thailand, the focus is often on international migration, even though internal migration is far
more significant in terms of the number of people involved, the amount of remittances they
send back home and the potential of reduction in poverty due to internal migration.
Despite the increasing numbers of women on the move as internal migrants and their
gendered implications, very few studies have focused on the process of the causes and
consequences of migration of migrant women. A large proportion of the existing work on
internal migrants focuses on issues such as migrant health and nutrition (Lu, 2008, 2010);
migrant responses to the 1998 Asian financial crisis (Frankenberg et al., 1999; Hugo, 2000) or
the legacies of transmigration (Bazzi et al., 2016). Therefore, the objective of this section is to
examine the causes and consequences of internal migration from rural to urban areas in
Tangerang and Hat Yai, particularly women street food vendors by looking the process and
pattern of migration and future plans of migrants.

73
1. Pattern and Process of Migration
1.1. Origin of the Women Migrants
Vendors are usually either city inhabitants or migrants from a different part of the region. This
study aimed to identify the origin i.e. the birthplace of female street food vendors. The
majority of respondents in Tangerang were born in the rural areas of Java provinces, whilst
the remaining 8% of vendors were born in urban areas i.e. Jakarta (Table 4‐1). When analysing
the provincial birthplaces of the vendors, who later migrated to Tangerang, 38.5% of the
interviewed vendors were migrants from Central Java. This finding is consistent with the data
published by Handiyatmo (2010), who stated that the largest number of people migrating to
other provinces in Indonesia orginated from the Central Java province. After Central Java,
23.5% of vendors orginated from West Java province, while only 11.0% of vendors were from
outside of Java island (Table 4‐1). Figure 4‐1 presents the various places of origin of
Tangerang’s street food vendors.
From an urban perspective, it is not surprising that Tangerang has become a popular
destination for rural migrants who are often less skilled or less educated. Since Jakarta
experienced a decline in the number of migrants caused by suburbanization and the slow
economic growth due to the economic crisis in 1997, the periphery of Jakarta, however, has
experienced a drastic increase in population. The population in the periphery Jakarta has
tripled from 4,4 million in 1980 to 12,6 million in 2000 (Rukmana, 2007). The explosive growth
of migrants from Jakarta and rural areas is a key driver of population growth on the periphery
of Jakarta, including the municipality of Tangerang.

74
Table 4‐1. The place of origin of Tangerang’s street food vendors by province
Place of origin Frequency Percent (%) Kilometers
Central Java 77 38.5 483
West Java 47 23.5 199
South Sumatera and Babel (Sumatera)
21 10.5 626
East Java 20 10.0 736
Jakarta 16 8.0 38
Banten 10 5.0 107
West Kalimantan 5 2.5 1,756
Yogyakarta 3 1.5 585
Others 1 .5
Total 200 100.0 Source: Field work conducted 2017‐2018; own compilation
Figure 4‐1: The place of origin of Tangerang’s street food vendors Source: Own compilation, 2018
In Tangerang, most women migrants came from certain rural communities in the island of Java
(Table 4‐1). Nearly 38.5% migrants from Central Java travelled a long‐distance to migrate to
the city of Tangerang. The distance from Central Java to Tangerang is 403 kilometers (250
miles). About 23.5% of female migrants from West Java traveled 153 kilometers (or 95 miles)
to arrive in Tangerang. Nowadays, the movement of migrants to Indonesia has been
75
dominated by long‐distance migration. The improvement of transportation and
communication have changed the length of movement for migrants and consequently, the
average distance of migration can become longer than before.
The data collected in this study to ascertain the various places of origin of the street food
vendors in Tangerang city (Table 4‐1; Figure 4‐1), support the literature discussed by
Deshingkar (2006) and Sukamdi and Mujahid (2015). Deshingkar (2006) mentions that rural‐
urban migrants cover greater distances, often traveling to different states/regions than rural‐
rural movements are only mainly travelled short distances. Meanwhile, Sukamdi and Mujahid
(2015) show that long‐distance migration in Indonesia increased between the 1990s and
2000s, which was driven by faster inter‐provincial transportation linkages. The research also
indicates that the number of short‐distance migrations declined in the same time period.
On the contrary, when analysing the migrants in Hat Yai city and their place of origin, short‐
distance migrants made up the majority of interviewed migrants (Table 4‐2). Half of the female
in‐migrants to Hat Yai were reportedly born in the Songkhla province, while 11.5%, 5.2%, and
4.2% of female migrants orginated from Pattani, Patthalung and Satun, respectively. The four
provinces, together with Yala and Narathiwat provinces are located in the southern region of
Thailand (Figure 4‐2).
The distance from Hat Yai to Songkla is only 30 kilometers and 62 kilometers (or 39 miles) to
Satun. The distance from Patthalung province to Hat Yai, however, is approximately 82
kilometers. The distance to the destination city, Hat Yai and ease of transportation are the
main pull factors for rising of rural‐urban migrant in Hat Yai areas. These results are in line
with the results from Jampaklay et al. (2017) who stated that in southern Thailand, the
migration movements were relatively closer to their rural areas and were over a shorter
distance.
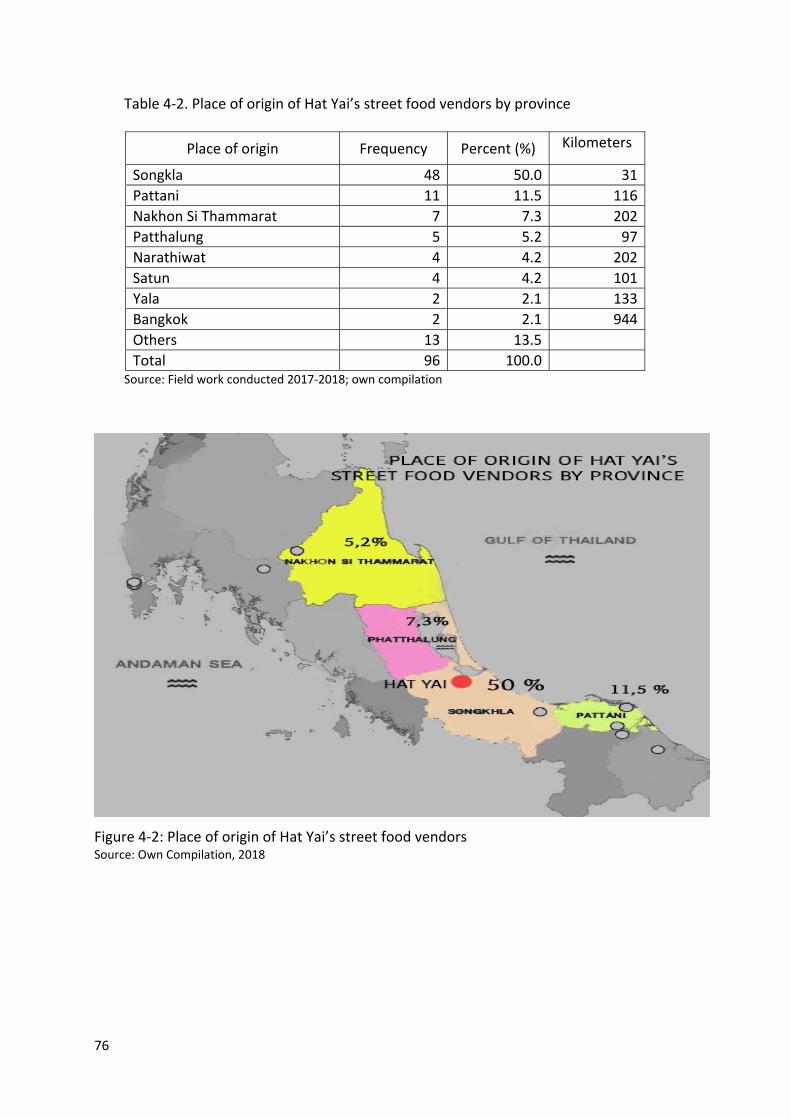
76
Table 4‐2. Place of origin of Hat Yai’s street food vendors by province
Place of origin Frequency Percent (%) Kilometers
Songkla 48 50.0 31
Pattani 11 11.5 116
Nakhon Si Thammarat 7 7.3 202
Patthalung 5 5.2 97
Narathiwat 4 4.2 202
Satun 4 4.2 101
Yala 2 2.1 133
Bangkok 2 2.1 944
Others 13 13.5
Total 96 100.0 Source: Field work conducted 2017‐2018; own compilation
Figure 4‐2: Place of origin of Hat Yai’s street food vendors Source: Own Compilation, 2018

77
1.2. Year of Migration
Migrants do not arrive at the same time to a certain place. Some of them will arrive earlier
than others and some of them may have arrived recently. An attempt was made to examine
when the migrants arrived in Tangerang and Hat Yai cities. The present survey data (Table 4‐
3) shows that only 4.0% of the vendors had moved to Tangerang less than one year ago. Most
of the migrant vendors (33.5%) came to Tangerang before 1998. Similar with their counterpart
in Tangerang, most of the migrants in Hat Yai had moved before 1998, while only 3.3% of
vendors migrated less than a year ago (Table 4‐3). The average duration of migration of
vendors in Tangerang is 16.8 years with a standard deviation of 10.6 years compared with an
average of 14.8 years and standard deviation of 10.9 years in Hat Yai. Moreover, it can be
concluded that the average duration of migration of the majority of the vendors in both
Tangerang and Hat Yai cities took place during the 2000s (Table 4‐3).
Table 4‐3. Duration of migration (in percentage)
Year of migration Tangerang Hat Yai
2018 4.0 3.3
2013 ‐ 2017 9.0 24.2
2008 ‐ 2012 23.5 15.4
2007 ‐ 2003 13.0 15.4
2002 ‐ 1998 17.0 14.3
Before 1998 33.5 27.5
Total 100.0 100.0
Mean ± SD 16.8 ± 10.6 14.8 ± 10.9 Source: Field work conducted 2017‐2018; own compilation
In migration, there are push and pull factors that cause migration movements from place of
origin to a new place. Push factors being reasons why people would want to leave their home
place and pull factors being reasons why people would want to come to a new place. The push
and pull factors in migration can be driven by economic, environmental, social and political
(safety factor) circumstances. In Tangerang, the large scale migration growth may be closely
related to its, (i) economic potential following the city’s development as the center of the
economic region for Banten province, and (ii) location which is straight‐bordered with the
78
Indonesian capital, Jakarta. Gradually, the city of Tangerang significantly became a magnet for
migrants in search of employment. The above argument is also strengthened by research from
Pratomo (2017). Pratomo showed that Tangerang, which is a sub‐urban of Jakarta, had more
paid employment than other cities in Indonesia, especially for women. Pratomo noted that
women migrants in Tangerang had a greater chance of being hired as paid employees than
women in other cities. This is also related to the location of Tangerang which is close to Jakarta,
the capital city of the country that offers more varied modern sector employment than other
cities in Indonesia.
In Thailand, Jampaklay et al. (2017) found that poverty and lack of employment were
significant determinants of migration from southernmost provinces of the country to other
regions, including Hat Yai. The other important push factor that caused people to leave their
place of origin and migrate to Hat Yai was their safety, especially for those who lived in
provinces bordering with Malaysia such as Yala, Pattani and Narathiwat, which have suffered
long‐term instability and violence. Since 2004, the insurgency in the southern provinces of
Yala, Narathiwat and Pattani, is currently ongoing, and as a result, many people living in those
provinces have moved to other places, including Hat Yai. The issue of this violent insurgency
in these provinces is known throughout the world which has been ongoing for more than 200
years. The conflict originates from the legend of Pattani guerillas fighting with the northern
Muslim Malayans – namely those from Kedah, Kelantan, and Terengganu against the Thai
(Siamese) government, since the early Rattanakosin era (Phuyuthanon and Kumjim, 2018).
Abuza (2011) studied the insurgency in this region and found there were tens of thousands
affected. More than 4,500 people have been killed and over 9,000 wounded in 2007 till 2008,
making it the most lethal conflict in this region. Women became widows and had to struggle
for life alone in fear. Thai Muslims in this region believe they are being threatened by the
insurgency and it directly impacts their well‐being.

79
Table 4‐4. Chi‐square tests of years of migration and religion, age, ethnic, place of origin, education and marital status of vendors in the study locations
Variables The study location
Tangerang Hat Yai
Ethnic Affiliation
Pearson chi‐square 326.1 43.1
Sig.(2‐tailed) .096 .968
N 200 91
Age
Pearson chi‐square 2375.2 1196.9
Sig.(2‐tailed) .000** .322
N 200 91
Marital status
Pearson chi‐square 167.7 110.7
Sig.(2‐tailed) .493 .797
N 200 91
Education
Pearson chi‐square 199.0 157.9
Sig.(2‐tailed) .051 .418
N 200 91
Place of origin
Pearson chi‐square 485.9 211.7
Sig.(2‐tailed) .000** .954
N 200 91
Religion
Pearson chi‐square 194.2 50.2
Sig.(2‐tailed) .081 .858
N 200 91 **. Correlation is significant at the 0.01 level (2‐tailed). Source: Field work conducted 2017‐2018; own compilation
In Tangerang, chi‐square tests examination on year of migration age and place of origin and
age of the vendors indicate a statistically significant reverse between them (p < 0.01) as shown
in Table 4‐4. While in Hat Yai the demographic features of the vendors have no significant
relationship with year of migration at the 99% confidence level.
When asked about the reasons behind their migration, interviewee Pee Umi Kasssuem, 32
years old, ethnically Malay, originating from Narathiwat, and engaged in selling chicken fried
near the bus station said the following:
“I was born and raised in Narathiwat. As you know, the place that I live is dominated by the Islamic community.When I was in the school, around the 2000s, there were often acts of
violence from outside. At that time I was young. Indeed, the violence was far away from my place, but it still made us worried. At age eighteen, after attending a private Islamic school, I decided to work in Malaysia. I had friends from my village who were working there already, and I wanted to make money and live in a big city like my friends. However, my parents did

80
not allow me to work in Malaysia. But I persuaded them and told them that I wanted a better life. Here (Narathiwat), it was hard to find a job. Lastly, I left my birthplace and came to
Malaysia. I worked in Malaysia for about four years, and after that, I decided to go home and work in Hat Yai. It’s better to be home.”
1.3. Decision Makers in Migration
People migrate based on prevailing conditions and the reasons vary from one person to
another depending on the situation that brings the decision. Migration is a selective process
that affects individuals or families with certain economic, social, educational and demographic
characteristics. The choice to migrate is generally made by the individual and household or
family members (Lall et al., 2006; De Haas et al., 2010). Individuals can make rational decisions
to leave their place of birth in the hope of better living and work opportunities than achieving
their goals. This is always a risky decision for migrants and one that is full of uncertainty, which
is made based on information and knowledge of their destination city, and moulded by their
perception. The decision to migrate by the individual or encouraged by the family (mostly by
parents) is primarily motivated by the need to ensure the survival of rural households.
The results from the survey reveal that more than half of women migrants (53.8%) in Hat Yai
migrated of own volition (Table 4‐5). This may be due to two underlying reasons. The short
distances to their destination enabled young women to decide on their own, and – additionally
– 21.0% of them were singles when they stared their migration. On the contrary, 48.5% of
women vendors of Tangerang were influenced by their husbands (Table 4‐5).

81
Table 4‐5. Key figures involved in the decision to migrate (in percentage)
Key figures involved in the decision to migrate
Tangerang Hat Yai
Self‐desire 26.0 53.8
Relatives 14.5 12.1
Parents 7.0 6.6
Friends 4.0 4.4
Husband 48.5 19.8
Spouse 0.0 3.3
Total 100.0 100.0 Source: Field work conducted 2017‐2018; own compilation
Though the survey in Hat Yai indicated that the vendors decided they wanted to migrate by
themselves, their decision to do so was not totally independent. Most of them made the
decision to migrate on their own with the consent of their parents. In some cases, parents
even encouraged their children to migrate and sometimes even helped fund the
transportation cost of migrants. The decision to migrate that is made or encouraged by the
family mainly occurs when migration from the village is primarily motivated by the need to
ensure the survival of rural households (Jampaklay et al., 2017). The following views expressed
by vendors in biographical interviews imply a similar reasoning that although the decision
making was left to them, their parents still played a role in the final decision.
One vendor in Hat Yai, Pee Vikanda said:
“When I finished my education [senior high school], I decided to leave my hometown. My parents supported my decision, even they said, look at your age mates, how they are now
going to the city, you should also go and look for money. This encourages me to migrate to the cities.”
Another woman migrant in Hat Yai, Pee Warapong stated:
“Before I moved to Hat Yai, I had the job in Malaysia. After several years, I finally decided to return back and settled in Hat Yai. My mother strongly supported my decision, even she
offered me to help her street food business.”

82
Among married women vendors, their husband was dominant in their decision to migrate. If
the husband disapproved of the migration, their wives did not or were less likely to migrate.
This situation is common for migrants who come from Muslim communities in southern
Thailand, especially from Yala, Pattani, Satun and Narathiwat since under the Islamic family
law, wives must obey what is conveyed by husband (Neelapaijit, 2009; Samah et al., 2017).
From the Tangerang vendors only 26.0% left their place of origin of their own volition. Some
women decided to move on their own to Tangerang because they were involved in
occupations and got a job offer from their relatives which led them to migrate to Tangerang.
The decision to move to Tangerang was often motivated by the desire of their family.
However, nearly half of the women vendors said, their decision was mostly made by their
husbands. These results are in line with the research conducted by Pew Research Center For
Religion and Public Life (2013) and Thorsen (2017). Thorsen found that in Indonesia, migration
of married women was contingent upon their husbands’ approval. The social and cultural
norms emphasise male entitlement to make decisions about women's migration when they
have officially become husband and wife. Therefore, the above results are not surprising
because the majority of respondents in Tangerang are married Muslim women and in Islam,
men and women have different roles that are defined by religious teachings. An interviewee,
Ibu Wartiyem, 49 years old, a mother with two children from Wonogiri, Central Java described
the following experience which illustrates the role of men in women's migration.
“I moved to Tangerang twenty-six years ago. My husband moved to Tangerang, so I had to
follow his movement. Before migrating to Tangerang, our family lived in Jakarta.”
Another female vendor, Ibu Wati, 31‐year‐old explained:
“In 2001, my friend in the village returned back to celebrate Eid al-Fitr and we met each other. My friend spontaneously invited me to move to Jakarta and offered a nanny job like her
doing. Then I talked with my parents and they gave their permission. I decided to go to Jakarta with my friend. I was only 15 years old then. I got married in 2008 when I was 22
years old. My husband comes from the same village as me. I moved to Tangerang city with my husband after we married. We moved to Tangerang because my husband's older brother
invited us to come and live in the city. So, we migrated to Tangerang.”

83
The interview additonally shows the importance of factors such as the presence of relatives
and friends (see below) in the target area.
However, the role of husbands in the decision‐making process was not despotic, at least not
always. Qualitative interviews show, that women vendors may enjoy a greater degree of
autonomy and independence especially when they seek employment outside the home. One
woman vendor, Ibu Harifah, 40 years old, the owner of the food stall Soto Lamongan
expressed that the couple took a joint decision (“I and my husband”):
“After graduated from junior high school, I worked in my hometown. I was 15 years old at that time. I had been working in that job for five years. Marrying in 1997, I resigned from my
job. I married a man who comes from the same village as me. After seven months of my daughter was born, I and my husband decided to migrate to Jakarta. I and my husband made the choice of coming to Jakarta for our children’s future as well as the desire to improve our family welfare. We migrated in early 1999. Our first destination was Jakarta. After 15 years
running the business in Jakarta, in 2014, I moved to Tangerang.”
From the statistical data, it is impossible to reveal, in how many cases women took the
initiative and husbands were persuaded or convinced to give their approval: So, Ibu Rusmini,
59‐year‐old from Madiun, East Java expresses her experience of migration as the following:
“Before deciding to migrate, I lived in my hometown Madiun with my husband. In 1982, I
requested permission to my husband to migrated to Jakarta. In the beginning, my husband did not give permission, but finally, he approved. After two months, my husband followed me to Jakarta. In Jakarta, I worked as a housemaid, while my husband worked as a construction
worker. After two years living in Jakarta, in 1984 we decided to move to Tangerang.”
1.4. The Main Source of Information
In order to make the final decision to move to any area, migrants often knew of the place in
advance through many sources of information. Sources of information play a significant role
in the process of migration to any place. When people have migrated from a given origin to a
specific destination, a greater amount of information will flow between the two places. There
are various sources of information available for potential migrants to take their migration
decision. Improvement in technology and communication has facilitated the flow of

84
information. Visits return, mass media, internet access, and telephone calls are served to
inform the members of the home community about the opportunities in the new community
or region. This flow of communication may be one of the important roles that the family plays
on the migration process.
It is observed that the availability of information concerning alternative localities plays a
prominent role in the potential migrant's decision regarding a destination. Those who are
more likely to move to places about which they have at least some information, rather than
to localities about which they know little or nothing. Kuadamah (2017) point out that friends
and relatives who have previously migrated in Accra, Nigeria from one place to another may
provide persons in their former locality with an important source of information about their
present localities. Zeleke (2011) found that more than three‐quarter of migrants had obtained
information about the destination (Addis Ababa) prior to their migration. The sources of
information were friends, relatives, family members, school, their previous knowledge and
some other informal sources. This information and personal networks such as friendship and
kindship, may turn in increase the propensity of persons to move to the right destination.
Table 4‐6. The main source of information to migrate (in percentage)
Source of information to migrate
Tangerang n = 200
Hat Yai n = 911
Friends and Relatives 46.4 55.6
Mass Media 3.3 6.9
Previous Visit 18.6 12.5
Family Members 30.1 25.0
Others 1.6 0.0
Total 100.0 100.0 Source: Field work conducted 2017‐2018; own compilation
Table 4‐6 above shows that a greater percentage of the women street food vendor migrants
both in Tangerang (46.4%) and Hat Yai (55.6%) had information of the conditions of the
destination through friends and relatives and this observation is consistent with the literature
1 The actual sample in Hat Yai was 91 respondents, 5 respondents did not answer this question.

85
as stated above. Another proportion of vendors in Tangerang (30.1%) and 25.0% of vendors
in Hat Yai claimed family members were a source of information for them. Very few vendors
(3.3%) in Tangerang and 6.9% of the vendors in Hat Yai had heard information from mass
media because many of them were of rural origin and had been less sensitive to mass media.
1.5. Occupations of Women Street Food Vendors before Migrating
The Occupational status of women street food vendors before migrating to a new destination
is one of the significant factors influencing the migrant decision making, which plays a role for
the vendor to migrate from their place of origin to the destination. The pre‐migration
occupation of vendors provides a better understanding of the factors that may serve as
motivation for migration (Babi et al., 2017). Prior to migration, some of the migrants were
primarily self‐employed as farmers, artisans or in various capacities in the rural informal
sector. Others were either students or unemployed (Potts, 2004).
As shown in Table 4‐7, about a third (33.5%) of the women migrants in Tangerang were
previously housewives, while 22.5% of the vendors were unemployed. Many of the
respondents who were housewives said that they did not have a job when they were in their
place of origin. The study also illustrated that 27.0% and 17.0% of the vendors were working
as a wage labourers and vendors, respectively. The majority of vendors were employed as day
labourers in farming. On the contrary in Hat Yai, the data presented in Table 4‐7 reveal that a
greater percentage of vendors (31.9%) were unemployed before migrating whereas 26.4%
and 25.3% were working as vendors or daily wage earners, respectively and the remaining
vendors were housewives (11.0%).
Table 4‐7. Occupations before migration (in percentage)
Occupations before migration
Tangerang n = 200`
Hat Yai n = 912
Vendor 17.0 26.4
Wage Labor 27.0 25.3
Housewife 33.5 11.0
2 5 respondents in Hat Yai did not answer the question in Table 4‐7.

86
Unemployed 22.5 31.9
Student 0.0 5.5
Total 100.0 100.0 Source: Field work conducted 2017‐2018; own compilation
Female migrants, however, were described predominantly as unemployed, even though they
were also involved in the various limited occupations available in the villages. Many of the
women migrants who declared themselves as unemployed prior to migration were also
engaged in farming. Although they were involved in farming, they felt that the work was
inadequate to be considered as an employment. They worked in farming only for a few days
a month. Income limitations, poverty and lack of employment prospects in the farming sector
are the cause of migration from women to urban centers. However, the migration of female
labourers has an implication on the agricultural production because the youthful labour force
crucial to the agricultural industry and cultivation of land, migrate to the urban centre. As a
result, agricultural production in rural areas can be hampered and adversely affected because
of the dominance of an older labour workforce by in rural areas.
2. Causes of Migration
It is a commonplace that migration processes are motivated by economic and non‐economic
factors. To come to a closer determination, this study grouped the motives into two main
categories ‐ economic and socio‐cultural factors. Furthermore, economic and non‐economic
causes of migration can be differentiated into push and pull factors (World Development
Report, 2009). Push factors are those that compel a person, due to different reasons, to leave
the place of origin and to go to some other place. For example, people of a certain area may
be pushed away by poverty to move towards towns for employment. On the other hand, pull
factors indicate the factors which attract migrant to an area such as better employment or
education opportunities. In this study, according to the responses, the pull factors seem to
have had a greater influence on the decision to migrate than the push factors. However,
especially concerning the economic factors, a servile adherence to a differentiation between
the two sets of factors does not always make substantial sense. In fact most of the responses
express that these are two sides of the same coin.
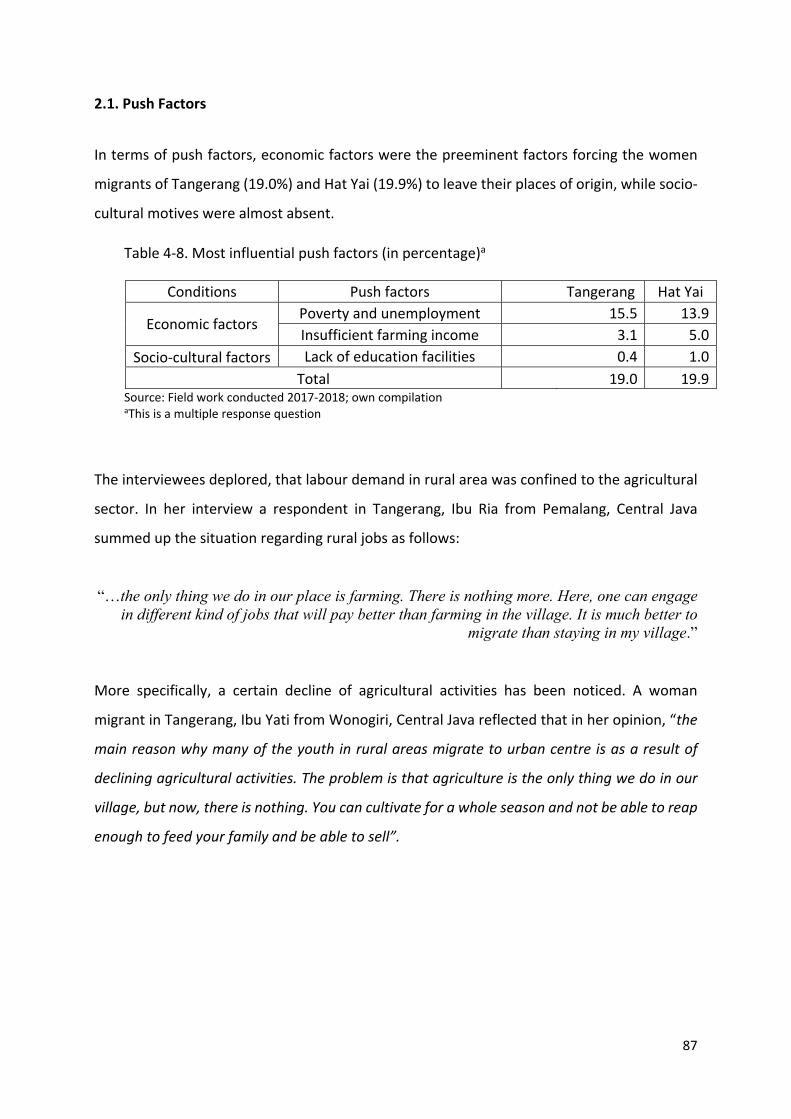
87
2.1. Push Factors
In terms of push factors, economic factors were the preeminent factors forcing the women
migrants of Tangerang (19.0%) and Hat Yai (19.9%) to leave their places of origin, while socio‐
cultural motives were almost absent.
Table 4‐8. Most influential push factors (in percentage)a
Conditions Push factors Tangerang Hat Yai
Economic factors Poverty and unemployment 15.5 13.9
Insufficient farming income 3.1 5.0
Socio‐cultural factors Lack of education facilities 0.4 1.0
Total 19.0 19.9 Source: Field work conducted 2017‐2018; own compilation aThis is a multiple response question
The interviewees deplored, that labour demand in rural area was confined to the agricultural
sector. In her interview a respondent in Tangerang, Ibu Ria from Pemalang, Central Java
summed up the situation regarding rural jobs as follows:
“…the only thing we do in our place is farming. There is nothing more. Here, one can engage in different kind of jobs that will pay better than farming in the village. It is much better to
migrate than staying in my village.” More specifically, a certain decline of agricultural activities has been noticed. A woman
migrant in Tangerang, Ibu Yati from Wonogiri, Central Java reflected that in her opinion, “the
main reason why many of the youth in rural areas migrate to urban centre is as a result of
declining agricultural activities. The problem is that agriculture is the only thing we do in our
village, but now, there is nothing. You can cultivate for a whole season and not be able to reap
enough to feed your family and be able to sell”.
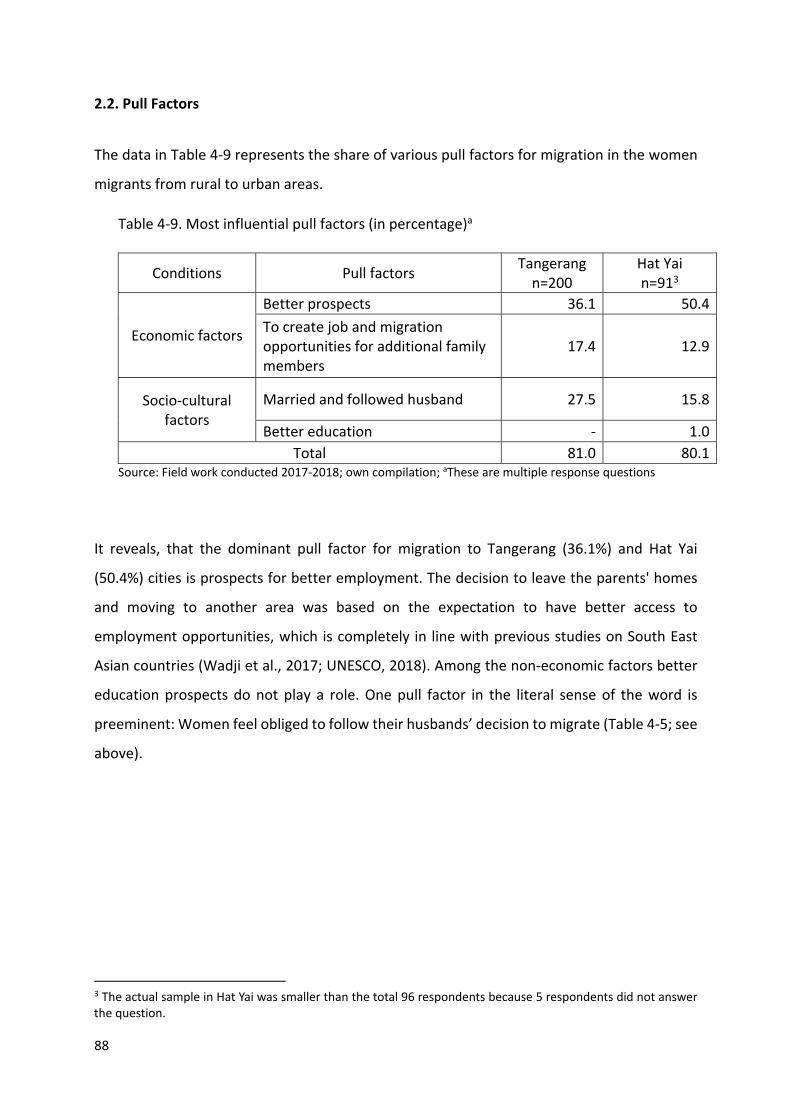
88
2.2. Pull Factors
The data in Table 4‐9 represents the share of various pull factors for migration in the women
migrants from rural to urban areas.
Table 4‐9. Most influential pull factors (in percentage)a
Conditions Pull factors Tangerang n=200
Hat Yai n=913
Economic factors
Better prospects 36.1 50.4
To create job and migration opportunities for additional family members
17.4 12.9
Socio‐cultural factors
Married and followed husband 27.5 15.8
Better education ‐ 1.0
Total 81.0 80.1 Source: Field work conducted 2017‐2018; own compilation; aThese are multiple response questions
It reveals, that the dominant pull factor for migration to Tangerang (36.1%) and Hat Yai
(50.4%) cities is prospects for better employment. The decision to leave the parents' homes
and moving to another area was based on the expectation to have better access to
employment opportunities, which is completely in line with previous studies on South East
Asian countries (Wadji et al., 2017; UNESCO, 2018). Among the non‐economic factors better
education prospects do not play a role. One pull factor in the literal sense of the word is
preeminent: Women feel obliged to follow their husbands’ decision to migrate (Table 4‐5; see
above).
3 The actual sample in Hat Yai was smaller than the total 96 respondents because 5 respondents did not answer the question.

89
3. Belonging to the Community of People from the Previous Place of Residence
Sample vendors were interviewed about their participation in any formal or informal
community from their previous place of origin, for example micro‐credit associations, women
associations and different formal associations. Only a small proportion (17.0%) of vendors in
Tangerang had participated in such a community while around 83% of the vendors were not
involved in any community associations with connections to their place of origin (Table 4‐10).
The percentage of vendors in Hat Yai who were involved in such a community (4.4%) is even
lower than in Tangerang.
However, even though they did not participate in a community of their place of origin, many
of them are currently involved in several local communities, such as prayer groups and saving
groups (arisan). This indicates that migrant women are more interested in local communities
and want to spend time with other people from the same areas of residence such as their
neighbors, leading to greater local participation and likely increasing their ties to the area.
One respondent, Ibu Murni 55‐year‐old from Yogyakarta expressed this view:
“Belonging to the community from my hometown here is not necessary to me. It is just a waste of time. I don’t have time to attend meetings. Nobody is helping me from my hometown.
When I have a problem, my neighbor helped me. I have to be close to them. They are my family now. Once a month I attend the prayer group which held in my neighborhood.”
Apart from formal associations, there are different community based informal associations in
Tangerang aiming to help members in time of death or other sudden socio‐economic crises
that women migrants may experience. These associations are known as Banyumas family
community and Paguyuban Wonogiri which serve the local members as coping strategies for
problems related to financial shortage. Some sample respondents further mentioned that
their participation in such associations helped them to access support when they experienced
sudden natural life events like death of a family member. In this case the community helps
strengthen their social networks and even enable them to improve their money saving habits.
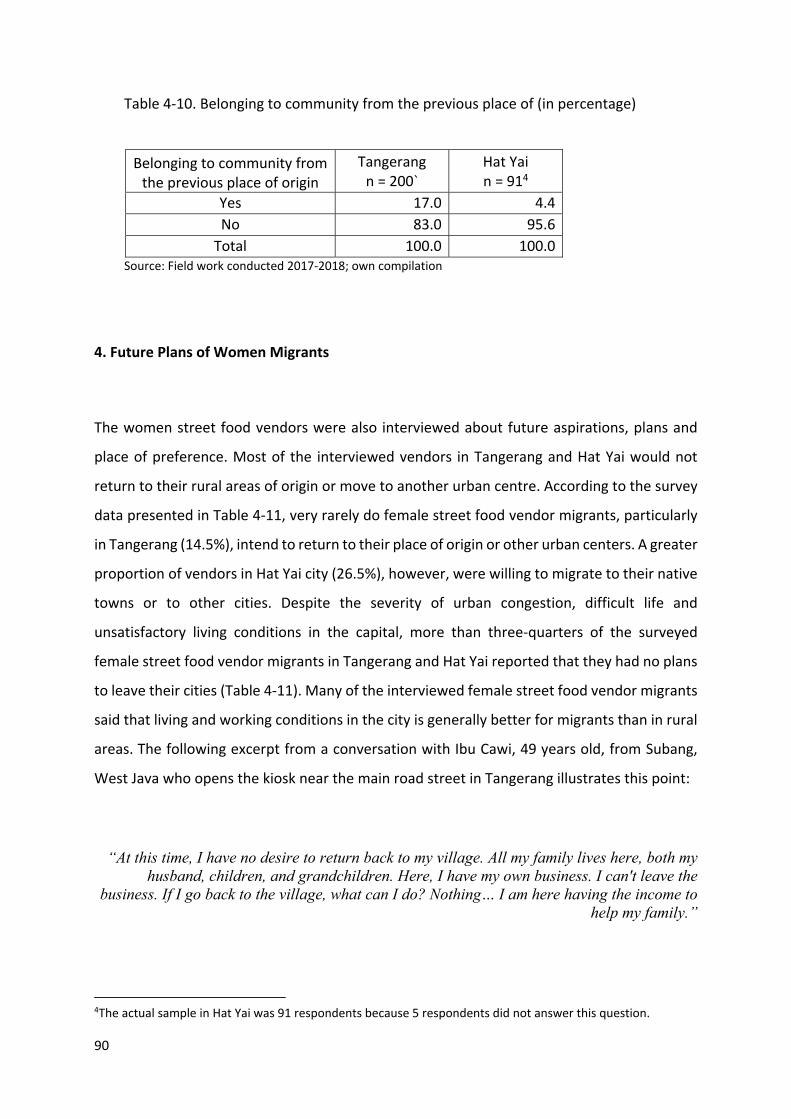
90
Table 4‐10. Belonging to community from the previous place of (in percentage)
Belonging to community from the previous place of origin
Tangerang n = 200`
Hat Yai n = 914
Yes 17.0 4.4
No 83.0 95.6
Total 100.0 100.0 Source: Field work conducted 2017‐2018; own compilation
4. Future Plans of Women Migrants
The women street food vendors were also interviewed about future aspirations, plans and
place of preference. Most of the interviewed vendors in Tangerang and Hat Yai would not
return to their rural areas of origin or move to another urban centre. According to the survey
data presented in Table 4‐11, very rarely do female street food vendor migrants, particularly
in Tangerang (14.5%), intend to return to their place of origin or other urban centers. A greater
proportion of vendors in Hat Yai city (26.5%), however, were willing to migrate to their native
towns or to other cities. Despite the severity of urban congestion, difficult life and
unsatisfactory living conditions in the capital, more than three‐quarters of the surveyed
female street food vendor migrants in Tangerang and Hat Yai reported that they had no plans
to leave their cities (Table 4‐11). Many of the interviewed female street food vendor migrants
said that living and working conditions in the city is generally better for migrants than in rural
areas. The following excerpt from a conversation with Ibu Cawi, 49 years old, from Subang,
West Java who opens the kiosk near the main road street in Tangerang illustrates this point:
“At this time, I have no desire to return back to my village. All my family lives here, both my husband, children, and grandchildren. Here, I have my own business. I can't leave the
business. If I go back to the village, what can I do? Nothing… I am here having the income to help my family.”
4The actual sample in Hat Yai was 91 respondents because 5 respondents did not answer this question.
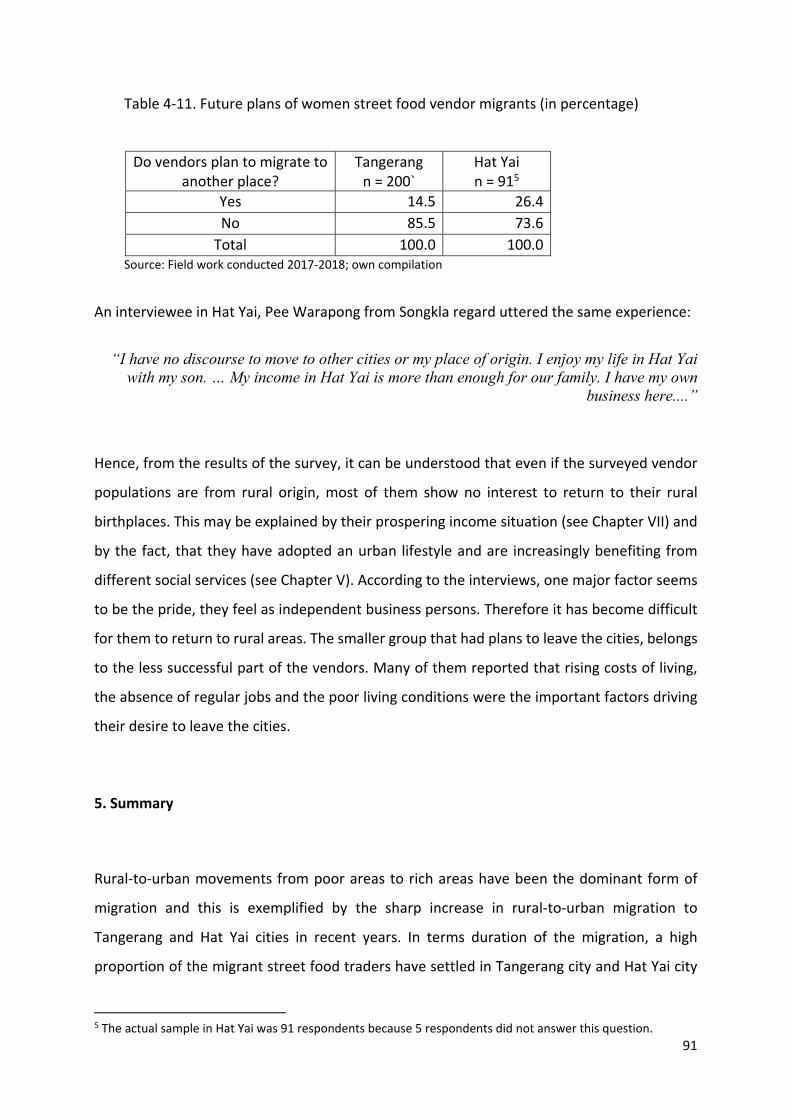
91
Table 4‐11. Future plans of women street food vendor migrants (in percentage)
Do vendors plan to migrate to another place?
Tangerang n = 200`
Hat Yai n = 915
Yes 14.5 26.4
No 85.5 73.6
Total 100.0 100.0 Source: Field work conducted 2017‐2018; own compilation
An interviewee in Hat Yai, Pee Warapong from Songkla regard uttered the same experience:
“I have no discourse to move to other cities or my place of origin. I enjoy my life in Hat Yai
with my son. … My income in Hat Yai is more than enough for our family. I have my own business here....”
Hence, from the results of the survey, it can be understood that even if the surveyed vendor
populations are from rural origin, most of them show no interest to return to their rural
birthplaces. This may be explained by their prospering income situation (see Chapter VII) and
by the fact, that they have adopted an urban lifestyle and are increasingly benefiting from
different social services (see Chapter V). According to the interviews, one major factor seems
to be the pride, they feel as independent business persons. Therefore it has become difficult
for them to return to rural areas. The smaller group that had plans to leave the cities, belongs
to the less successful part of the vendors. Many of them reported that rising costs of living,
the absence of regular jobs and the poor living conditions were the important factors driving
their desire to leave the cities.
5. Summary
Rural‐to‐urban movements from poor areas to rich areas have been the dominant form of
migration and this is exemplified by the sharp increase in rural‐to‐urban migration to
Tangerang and Hat Yai cities in recent years. In terms duration of the migration, a high
proportion of the migrant street food traders have settled in Tangerang city and Hat Yai city
5 The actual sample in Hat Yai was 91 respondents because 5 respondents did not answer this question.
92
for many years. The majority of the vendors settled before the year 2013. Only 13.0% and
27.5% of the total respondents in Tangerang and Hat Yai, respectively arrived after 2013.
When the women migrant street traders were interviewed about their region of origin, it was
found that most of the vendors in Tangerang migrated from Java island. In Hat Yai, most of
the female migrant vendors come from nearby regions, including Songkhla, while fewer
women migrant vendors were attrected from more distant regions.
The study also indicates that more than half of the women migrants in Hat Yai migrated by
themselves, whereas in Tangergang, almost half of the total respondents were more likely to
be influenced by their husband in making the decision to migrate to Tangerang city. The
findings also indicate that the network of contacts, such as the flow of information from earlier
migrants about the availability of job opportunities at the destination is seen as a highly
significant motivator for the vendors to migrate. The majority of the vendors obtained
information about the destination conditions through their friends, and relatives as well as
family members, giving the vendors confidence to make the decision to migrate.
The present study has revealed that poverty, job searching, insufficient farming income and
lack of education facilities were the main push factors for outmigration, while at the place of
destination, the availability of employment, better opportunities, being married and search
for better education were the main pull factors behind migration. At the place of destination,
the availability of employment was the main pull factor. This study also confirms that most of
the respondents mentioned “pull”‐ factors rather then “push”‐factors, but both underscore
the significance of economic reasons.

93
CHAPTER V
Labour: Working conditions and Pre‐Conditions
The chapter is divided into three sections. The first section presents the pre‐history of street
food business activities. It will review the situation before the vendors started their business.
More detailed, it will deal with several fundamental questions concerning the setup of their
business: Who gave the future vendors business advice, information and moral support when
they started the business? Did the vendors have had any employment before starting the
current business, and did the vendors have business experience before operating the food
business? The second section discusses the main issues of working conditions of street food
vendors, including the average working hours and conditions, labour arrangements and wages
they pay to their employees, if they have any. Finally, section three details the degree of social
protection, particularly the access to health insurance systems in both countries.
1. Employment Biographies
1.1. Duration of Food Vending Experience
To understand the biographical history of the vendors’ experience, it was important to
measure the number of years vendors of Tangerang and Hat Yai have spent on operating a
food vending enterprise. Data revealing the time span of food vending experience was collated
from the respondents’ interviews. Table 5‐1 shows that most street food vendors were found
to be operating their business between 2012 and 2017. This is similar for both Tangerang
(42.0%) and Hat Yai (42.7%). Approximately, 23.5% of the street food vendors in Tangerang
and 21.9% in Hat Yai have been operating their businesses since 2000 and 2005. However,
only 8.0% and 5.2% of the total vendors in Tangerang and Hat Yai, respectively, reported being
in existence before 1994. The average duration of the business experience is similar in both
Tangerang (9.57 years) and Hat Yai (9.23 years). This is supported by no significant association
between study location and year of starting the vending business (Table 5‐1).

94
Table 5‐1. History of food vending experience of vendors (in percentage)
Year of starting the business Tangerang n = 200
Hat Yai n = 96
2018 6.0 6.3
2012 – 2017 42.0 42.7
2006 ‐ 2011 23.5 21.9
2000 ‐ 2005 11.0 11.5
1994 ‐ 1999 9.5 12.5
< 1994 8.0 5.2
Total 100.0 100.0
Mean ± SD 9.57 ± 8.98a 9.23 ± 8.19a Source: Field work conducted 2017‐2018; own compilation; aThere was no significant association between study location and when the vendors started their business using Anova (p<0.05); sig. 0.757
This suggests that the sector is not merely a temporary source of income but can be seen as a
long‐term employment option. However, initially many vendors shifted to street food vending
after trying other forms of employment. Some vendors received training from their family
members already established in the trade, while some chose food vending after losing
employment in the formal sector. One of the interviewees, Ibu Lina, 51 years old, from Solo,
Central Java shared her experience of starting her food vending business as follows:
“When I migrated from my hometown, I worked as a maid in Jakarta for 4 years. In 1986, I
moved to Tangerang with my husband after we got married. I started running my business in early 1995. I had begun the business by selling coconut ice and in mid-1999, I opened the
food stall. My family livelihood changed drastically since I started the business. I don't worry again about our finances. Previously, I often overwhelmed to manage money from my husband. The wages of my husband didn't enough to cover our living costs. From the
business, I could finance our children, although only up to senior high school. I can also acquire the house with the various equipment, include television, refrigerator, furniture and
so on”.
The study participant in Hat Yai, Pee Umi Kassuem, 40 years old revealed that: “When I migrated to Hat Yai from Malaysia, I did jobs here and there. After a few years, I left
due to very low salary to fulfill my needs and my family. Then I used to sell Thai Deep-Fried Chicken. Selling food in the street is better, you are independent, and you earn more”.

95
1.2. Employment Biographies before Starting the Current Business – in the Host Area
As seen in Table 5‐2, 43.0% (86 of 200) and 44.8 % (43 of 96) of the street vendors in Tangerang
and Hat Yai, respectively reported that they never participated in any type of occupation
(including the informal sector) in the host area before they started street food vending. This
may indicate that a main motivation to migrate was the decision to open a street food
business in the destination area, albeit it is not clear for how many of this group. As noted in
Chapter III, some of the vendors reported, they did not have the chance to obtain a regular
job in the formal sector, partially due to age reasons.
On the other side, the survey shows that just over half of the street vendors in Tangerang
(57.0%) and Hat Yai (55.2%) had been employed before moving into the street food vending
field.
Table 5‐2. Have vendors had previous job in the host area (in percentage)
Previous jobs Tangerang n = 200
Hat Yai n = 96
Yes 57.0 55.2
No 43.0 44.8
Total 100.0 100.0 Source: Field work conducted 2017‐2018; own compilation
In many cases, as reported by Ibu Lina, mentioned before, when young single women are
migrating into urban areas, before becoming a vendor they would find a job as a domestic
worker. One of the migrant women interviewed, Ibu Wati from Kebumen, Central Java
represents this observation.
“It has been nearly 16 years since 15-year-old I migrated from my hometown in Kebumen, Central Java to Jakarta. I, jobless, migrated from my village to eke out a living for my family,
hoping that the new place would offer better prospects. In 2001, my friend in the village returned back to celebrate Eid al-Fitr and we met each other. My friend spontaneously invited
me to move to Jakarta and offered a nanny job like her doing. Then I talked with my parents and they gave their permission. I decided to go to Jakarta with my friend. I was only 15 years
old then. In my the first job, I workeMd with people who told me to take care of the children as a nanny.”

96
Such biographies with a housemaid phase are to be found in Yat Hai more often than in
Tangerang (Table 5‐3) because the celibacy rate in the sample is much lower in Tangerang (see
Chapter III). The majority of these vendors said Malaysia was the main destination for them
when they worked as a domestic helper and they must return to their origin countries after
the completion of their employment contracts. Many of them came from the southern
provinces of Thailand because people in the southern border provinces are often closely to
Malaysians through language as well as their religion. In Tangerang, by constrast, over one
quarter of the vendors were previously engaged in jobs like coconut ice street vendor, mbok
jamu (traditional herbal medicine) gendong sellars, and itinerant cake seller, representing
types of business, that allowed an easy switching to the street food business.
However, among the persons with a previous job the majority of the future vendors had been
permanently employed, some even in the formal sector (Table 5‐3).
Table 5‐3. The main jobs of vendors in the new area before engaged street food business
(in percentage)
Types of jobs Tangerang Hat Yai
Permanent employment 59.6 62.3
Paid government employment 3.5 0.0
Housemaid 4.4 17.0
Student 1.8 17.0
Own business 25.4 3.2
Others 5.3 0.0
Total 100.0 100.0 Source: Field work conducted 2017‐2018; own compilation
Many of vendors reported, that they started street vending because that business allowed
them the flexibility to earn money as well as continue to do other household chores. A street
food vendor, Ibu Yati, 46 years old, selling nasi uduk in M.H. Thamrin street, Tangerang, a
former factory employee, revealed:
“I have been to Tangerang for more than 20 years. I arrived in the city in 1990 and worked in
a manufacturing factory for 8 years from 1991 to 1998. At that time, I was 19 years old. I liked working in the factory and was satisfied with my salaries. Until the day, I met my
husband, then we decided to get married and have children. After I had a child, I took the

97
decision to drop out of the factory and concentrate on taking care of my baby. After 5 year, I started a business. I first rented a food stall on the street to sell fried snacks. My business was
progressing because the location that I occupied was very strategic. Along with the development of the business, then I decided to rent a kiosk for selling various menu dishes.”
A female street vendor in Hat Yai, Pee Warapong, a 42‐year‐old, who opened a kiosk on the
main road near the Prince of Songkla University shared a similar experience:
“I did my bachelor in Kuala Lumpur, Malaysia about 15 years ago. After graduating from
university, I got a job in Malaysia. While working in Malaysia, I met my future husband. Having acquainted with him about two years, we decided to get married. Two years later, we had a son. After my son was five years old, I entrusted him to my mother in Hat Yai. It’s hard to part with my son. Even though I got a pretty good salary, however I lost my time with him.
Finally, I decided to return back to Hat Yai and take care of my son by myself. After one year, my mother asked me to manage her kiosk. Since then, I began to go practice the street
food business.”
A recent global ICEDR (2018) study revealed similar results where leaders believe that the
majority of women around the age of 30 leave their jobs because they struggle to balance
work and life, especially when planning to have children.
Surprisingly, according to some of the women, the primary factor influencing their decision to
leave their employment was different, it was pay. An interviewee in Tangerang, Mbak Widi,
32 years old reported:
“Before I went into this business, I used to work in a factory which is located in Bekasi. I
started working in 2008. My first experienced to work was at Yamaha music factory. After one year, I left Yamaha music because my contract was not renewed. Then, I moved to the
Sanyo factory for one year too. In 2010, I was accepted to work at the Mattel manufacturing. I worked there until November 2014. In all factories, the salaries followed the regional minimum wage. For a single person, the income is enough, but if you have a family, the
salary that you earn will not be enough to fulfill your family life. It’s too little. In early 2014, I married my future husband. After marriage, he suggested me to stop working at Mattel
because we planned to have children soon. We waited for three years however we have not been blessed with children. I don't know why Allah doesn't give us children, but I believe that
it's always for our own good. I then discussed with my husband to allow me to open a food stall. He agreed. Since then I started the street food vending in 2017.”

98
One vendor who was highly successful after quitting her formal sector job, Pee Supranee
Insuwanna, a 39‐year‐old reported:
“After I finished from senior high school, I had the job in the private company near Hat Yai. I was feeling bored when I worked at the company. So, I decided to quit my formal job a few years ago. I earn much more from my business. One day selling on the street
is equivalent to fortnightly pay that I was getting in that formal sector job.”
1.3. Business Experience before Operating Food Vending
It was important to collect information related to the experience of women food vendors in
operating their businesses to understand why some operators were more successful than
others. Vendors were asked about their experiences in managing and operating a business.
Most of the women food vendors both in Tangerang (62.0%) and Hat Yai (66.7%) said that
they did not have any previous experience of working in business before food vending and
that running their food vending stall was their first business (Table 5‐4). On the other hand,
38.0% vendors in Tangerang and 33.3% vendors in Hat Yai shared that they had some previous
business experience. The business experience in the food sectors had been gained by the
vendors when they worked as a worker in other places, such as in the store, a food kiosk or
food booth, cafeteria, and restaurant. One respondent, Ibu Susi from Yogyakarta explained:
Before I am running this business, I was a restaurant worker. When I worked in the restaurant, I learned how to make murtabak like what I sell now.
When asked for further information, most vendors stated that the nature of their previous
business was different to the business they are currently managing. One of the migrant
women interviewed, Ibu Wartiyem from Wonogiri, Yogyakarta represents this observation.
She said that before running this business, she had experienced running a business by selling
herbal medicine (jamu) since she was 12 years old.
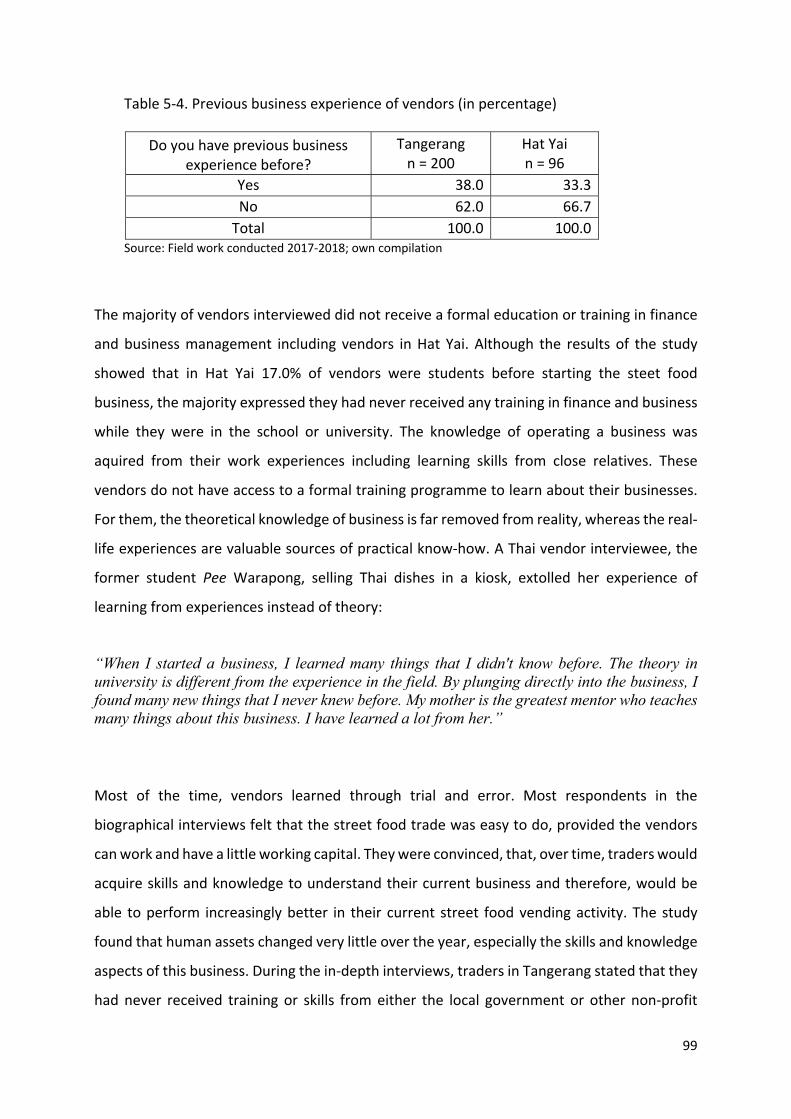
99
Table 5‐4. Previous business experience of vendors (in percentage)
Do you have previous business experience before?
Tangerang n = 200
Hat Yai n = 96
Yes 38.0 33.3
No 62.0 66.7
Total 100.0 100.0 Source: Field work conducted 2017‐2018; own compilation
The majority of vendors interviewed did not receive a formal education or training in finance
and business management including vendors in Hat Yai. Although the results of the study
showed that in Hat Yai 17.0% of vendors were students before starting the steet food
business, the majority expressed they had never received any training in finance and business
while they were in the school or university. The knowledge of operating a business was
aquired from their work experiences including learning skills from close relatives. These
vendors do not have access to a formal training programme to learn about their businesses.
For them, the theoretical knowledge of business is far removed from reality, whereas the real‐
life experiences are valuable sources of practical know‐how. A Thai vendor interviewee, the
former student Pee Warapong, selling Thai dishes in a kiosk, extolled her experience of
learning from experiences instead of theory:
“When I started a business, I learned many things that I didn't know before. The theory in university is different from the experience in the field. By plunging directly into the business, I found many new things that I never knew before. My mother is the greatest mentor who teaches many things about this business. I have learned a lot from her.” Most of the time, vendors learned through trial and error. Most respondents in the
biographical interviews felt that the street food trade was easy to do, provided the vendors
can work and have a little working capital. They were convinced, that, over time, traders would
acquire skills and knowledge to understand their current business and therefore, would be
able to perform increasingly better in their current street food vending activity. The study
found that human assets changed very little over the year, especially the skills and knowledge
aspects of this business. During the in‐depth interviews, traders in Tangerang stated that they
had never received training or skills from either the local government or other non‐profit
100
institutions since they started their business. While in Hat Yai, only two traders said that they
had received training related to the business they are currently engaged in. One of the vendors
in Hat Yai, Pee Warapong who had joined in the training stated:
“I have participated in food hygiene practice for street food vendors which were organized by the local government two years ago. I got the certificate that I had attended the training. After training, my kiosk received certification from the Hat Yai Health Agency.Within a year two or
three times, they will come and check the safety and hygiene of the food that I sell.” However, in the interviews, according to this issue, serious contradictions emerged. Many
vendors demonstrated that they would want training to be provided by local governments in
making their business more successful and profitable. Indeed, they require basic training
covering finance and accounting methods, business marketing, knowledge of how to handle
and outsmart the competition and negotiation skills with customers and suppliers and before
all in the sector of food hygiene (see Chapter VII), as apparently launched in Hat Yai. It is
important for local authorities to provide a focussed training, encompassing the various
aspects of the street food business to street vendors which would enable them to grow,
expand and run their businesses to its full potential.
Many street food traders not only lack the skills and knowledge to do business but also do not
have formally acquired cooking skills. The results of the interviews show that many street food
vendors in both countries acquired cooking skills by observing family members, friends,
relatives and from experience. In Indonesia and Thailand, cooking and household chores are
defined as the roles of women. Women in both countries learn to cook to prepare food for
other members at home (Gengaiah et al., 2018). Family members are, therefore, more
encouraging and motivating women to start their own business with this skill in the food
sector. A woman street food vendor in Tangerang, Ibu Murni, selling rice cooked in coconut
milk, commented:
“I started the street food business six years ago. At that time, I was a housewife. When I opened the business, I did not have business experience and cooking skills. In my mind was
how can I help to make my family financially secure. I was motivated by my friend who already had a street food business. With a friend’s help, I decided to open up this business

101
from nothing. I learned from friends how to open and manage a business. My husband also fully supported my decision to open the street food business. My step began to feel really
heavy after a few weeks opening this business. I didn’t have many customers. It took several months to say that the business was on the track”.
1.4. Start Support
In line with the findings of this study, Tissington (2009) stressed in his research in
Johannesburg, that 9 of 10 street traders did not receive any formal business training. Another
study conducted by Bromley and Mackie (2009) found that a large proportion of females
operating in the informal sector in Latin American city centre have little or no schooling.
However, it was not just trial and error that taught them how to conduct their business. Like
Pee Warapong and Ibu Murni, mentioned before, the majority of respondents in Tangerang
(81.0%) and Hat Yai (80.2%) indicated that they received support for obtaining their current
business from other family members, friends or relatives (Table 5‐5). This is in line with the
studies of Tissington and Bromley, who found out, that many of the food vendors received
assistance from family members, such as their mothers, grandmothers or friends in selling
various items prior to engaging in informal trading. Thus, the ability to learn from one’s social
network becomes an important feature of a street trader’s livelihood strategy as without it,
they would not be able to do their jobs. Consequently, most of the knowledge and skills that
street food vendors possess were gained through observing and working with previous
employers, family members, relatives and receiving advice from friends.
. Table 5‐5. Did vendors receive support for obtaining their business? (in percentage)
Did vendors receive support for obtaining their business?
Tangerang n = 200
Hat Yai n = 96
Yes 81.0 80.2
No 19.0 19.8
Total 100.0 100.0 Source: Field work conducted 2017‐2018; own compilation

102
Powell and Eddleston (2013) as cited by Xia (2015) found that family‐to‐business support
positively influences entrepreneurial success in the United States, especially in terms of
financial capital, feedback as well as advice on business problems and emotional sustenance.
Accordingly, many vendors emphasized that support from family members was a strong factor
in encouraging these women to become self‐employed. Additionally, women vendors feel that
the support of their husbands and family members have played an important role in
motivating and encouraging them when the market situation is poor or when the business has
performed poorly.
The investigation shows that a nearly half (44.2%) of the women street food vendors in Hat
Yai received support from their husbands in launching the business, while in Tangerang it was
at 60.0% (Table 5‐6). The lower rate of conjugal support in Hat Yai can be explained by the
practice of delayed marriage beginning to prevail on the national scale (see Introduction).
Table 5‐6. The persons who gave business advice and information to vendors (in percentage)
Business advice and information Tangerang n = 1621
Hat Yai n = 776
Husband 58.60 44.2
Children 6.20 3.9
Parents 5.60 14.3
Friends 9.30 18.2
Relatives 17.30 11.7
Spouse 0.60 6.5
Others 2.50 1.3
Total 100.0 100.0 Source: Field work conducted 2017‐2018; own compilation
Over 14% of the vendors in Hat Yai received support and advice from their parents, only 5.6%
of vendors in Tangerang received similar support. This may be associated with differences in
the age profile. The study shows that traders in Hat Yai on average are younger than their
counterpart in Tangerang. In the sample of this study, more than a quarter of Hat Yai's vendors
are below 30 years, while in Tangerang (as seen in Table 5‐7 and 5‐8) it is only 18.5%.
6 38 respondents in Tangerang and 21 respondents in Hat Yai did not inform about the persons who gave them business advice and information.
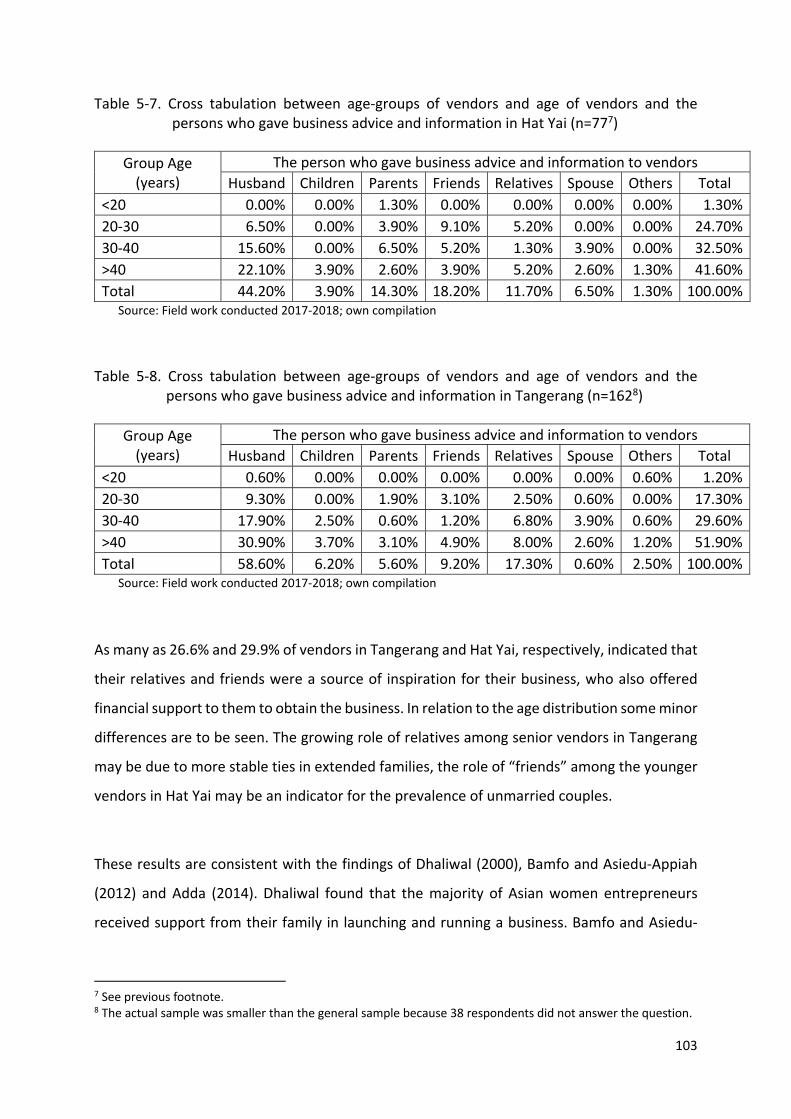
103
Table 5‐7. Cross tabulation between age‐groups of vendors and age of vendors and the persons who gave business advice and information in Hat Yai (n=777)
Group Age (years)
The person who gave business advice and information to vendors
Husband Children Parents Friends Relatives Spouse Others Total
<20 0.00% 0.00% 1.30% 0.00% 0.00% 0.00% 0.00% 1.30%
20‐30 6.50% 0.00% 3.90% 9.10% 5.20% 0.00% 0.00% 24.70%
30‐40 15.60% 0.00% 6.50% 5.20% 1.30% 3.90% 0.00% 32.50%
>40 22.10% 3.90% 2.60% 3.90% 5.20% 2.60% 1.30% 41.60%
Total 44.20% 3.90% 14.30% 18.20% 11.70% 6.50% 1.30% 100.00% Source: Field work conducted 2017‐2018; own compilation
Table 5‐8. Cross tabulation between age‐groups of vendors and age of vendors and the persons who gave business advice and information in Tangerang (n=1628)
Group Age (years)
The person who gave business advice and information to vendors
Husband Children Parents Friends Relatives Spouse Others Total
<20 0.60% 0.00% 0.00% 0.00% 0.00% 0.00% 0.60% 1.20%
20‐30 9.30% 0.00% 1.90% 3.10% 2.50% 0.60% 0.00% 17.30%
30‐40 17.90% 2.50% 0.60% 1.20% 6.80% 3.90% 0.60% 29.60%
>40 30.90% 3.70% 3.10% 4.90% 8.00% 2.60% 1.20% 51.90%
Total 58.60% 6.20% 5.60% 9.20% 17.30% 0.60% 2.50% 100.00% Source: Field work conducted 2017‐2018; own compilation
As many as 26.6% and 29.9% of vendors in Tangerang and Hat Yai, respectively, indicated that
their relatives and friends were a source of inspiration for their business, who also offered
financial support to them to obtain the business. In relation to the age distribution some minor
differences are to be seen. The growing role of relatives among senior vendors in Tangerang
may be due to more stable ties in extended families, the role of “friends” among the younger
vendors in Hat Yai may be an indicator for the prevalence of unmarried couples.
These results are consistent with the findings of Dhaliwal (2000), Bamfo and Asiedu‐Appiah
(2012) and Adda (2014). Dhaliwal found that the majority of Asian women entrepreneurs
received support from their family in launching and running a business. Bamfo and Asiedu‐
7 See previous footnote. 8 The actual sample was smaller than the general sample because 38 respondents did not answer the question.
104
Appiah stated that the majority of women entrepreneurs in Ghana started their businesses
after getting family support. Meanwhile, research by Adda (2014) on female entrepreneurs in
Central Sulawesi, Indonesia discovered that ‘family values’ is one factor that encourages the
family to work together and creates advantages for women in their businesses; the spouses,
children and other relatives to get involved in the businesses and support self‐employed
women. This favourable result was highlighted by a woman entrepreneur, Pee Sumpit running
a street food business in Hat Yai for more than six years who stated:
“My husband encouraged me all the way and my family always showed me how proud they were for me and for what I have achieved. I wouldn’t be standing here in my own business if
it weren’t for them.”
However, as revealed in the qualitative interviews, family support as a process did not always
work so smoothly as expressed by the resulting data. This is due to the fact that working in a
public space often presents a problem for women in a patriarchal society. This can include
their families objecting them working in an open public space due to the potential stigma
women vendors may face. Women working outside their home, especially in the market
selling food, were considered unacceptable in many families, particularly in Indonesian
families. In the beginning, the families of many vendors opposed the idea of women starting
this business, and women vendors had to fiercely argue for their choice. Once the vendors
had convinced their families, they could rely on even increasing family support because their
family members gained insight that the new business was caring for their income. For
example, a woman street food vendor with more than eight years of experience in business
mentions:
“Without the support of my husband, I would not be where I am today. I think it is very important to get family support when starting a business. It was difficult to persuade my
family that street vending was my only option because they know that the nature of this work usually involves male customers and they worry that I may become involved in a relationship
with them. I am there to vend and make money to help my family finances.” One of the well‐established vendors involved in the street food business for a little more than
seven years explained:
105
“When I expressed the request to open a street food business, there were doubts and disapproval from my husband. As time goes by, in the end, my husband and children were my
big supporters financially and morally. I owe my business success to them.”
2. Working Conditions of Street Food Vendors
2.1. Average Working Hours
The life of a woman as a street food vendor is fraught with hardship. Along with the very tough
working conditions that come with the territory, women street food vendors have another
important duty – being a homemaker. In addition to irregular earnings, women street food
vendors often face very poor working conditions as they work excessively long hours per day.
The survey found that in most cases, women street food vendors work between eight to
fourteen hours a day in their business, including preparation of food and sales, every day of
the year, which is well beyond the government regulations pertaining to the maximum
number of working hours per day.
Though most of the food they sell is cooked on time, vendors need to carry out many
preparatory tasks beforehand, such as visiting the markets to buy vegetables and later sorting,
cleaning and chopping the vegetables, preparing cooking sauces and cleaning the stalls.
Hence, the number of working hours increase as the preparation activities time ranges from
one to four hours a day. In most cases, the working hours of the vendors depend on the target
customers, the season, the type of food sold, the location of the business and their general
health. For example, a vendor that operates at stations or in the central business districts runs
her business in a 24‐hour style. During Ramadan i.e. the fasting period, for example in
Indonesia, the majority of vendors will not start their business in the morning, but they will
open their stall after 4 pm.
The street food vendors’ day often begin as early as 4 am in the morning. They complete all
the household work, prepare breakfast and then visit the market to buy the goods. Those
involved selling breakfast food should reach their stall by 6 am. These vendors work for five

106
hours at the stall, return home to prepare lunch for their family, clean the house, freshen up
and take a short break. The majority of vendors who provide supper will begin their activities
from 4 pm to 12 am midnight and some even end as late as 2 am.
Moreover, there are no weekends and holidays in the minds of street food vendors, but many
uncertain factors may affect their business. Weather, regular holidays, poor health, national
events all lead to fewer customers. Sometimes they suffer the confiscation of their goods and
stalls which means that they cannot work the following days. Therefore, in order to ensure
their income, the street food vendors seize every opportunity to be able to set up stalls and
work extremely long hours without rest. These working conditions can clearly be illustrated
with the help of the following case study and excerpts from one of the women vendors’
interviews, Mbak Harifah.
“As a street food vendor, I and my mother had to get up at 2:00 am every day to prepare for our sales. We start our days with cleaning, chopping the vegetables, cooking rice, boiling
eggs, and chicken. Sometimes I prepared the items for sale at 10:00 pm if I had to fry onions. I left home around 8:00 and returned at 12:00. After I returned, my mother replaced me.
Every day, I only slept 4 or 5 hours. Sometimes, I didn't have time to communicate with my children.”
The following account by Ibu Harti in Tangerang, of her working day, exemplifies the working
conditions under which street vendors operate:
“I wake up before the crack of dawn and go to the local market. I buy chicken, beef, fish and the appropriate fresh vegetables and other ingredients to go with it. I will stock as much food
as I think I can reasonably sell. I wheel my food cart to the desired location and begin preparing the day’s meals as customers begin to order. At the beginning of trading, I did it myself. But now my husband and an employee help me to prepare these items for sale and wheel the food chart. I am at my “warung makan” for 9 hours and I start serving food in the
afternoon around 16:00 pm until the last customer has left.”
A woman street vendor in Hat Yai, Pee Supranee exposed similar working conditions to her
counterpart in Tangerang.
“I get up as early as 2:00 am, then go to the market near my house. When coming home, I start to make preparation for the street vending. I spend two and a half hours washing,
cutting, and cooking of foods. Then I fully stock my stall with the source, water, utensils, and

107
packaging bags. After that, I load up all the food and ride my vending trike to the vending site near the Prince of Songkla University. I usually begin my business at 06:00 am and end at 11:00 am. I keep operating my business at the same time in the same place. Sometimes, the
sales are not good and there are still some food items left at the regular leaving time. At such time, I will give the food to my neighbors or people who need it because the leftover food
couldn’t be sold for the next day. However, I preferred to work longer than just throw them away. After arriving at home, I need to clean the cooking equipment and other food
containers, check the profit and do some housework.”
Like other street food vendors in Hat Yai, Pee Supranee usually works for six days a week,
unless it rains heavily. To summarize, Supranee sleeps about five hours a night and works at
least 13 hours a day. Moreover, she stands during her working hours. When asked if she felt
tired and sleepy, Supranee smiled and said that she has adapted to the working conditions
after years of working as a street food vendor.
2.2. Employment of Wage Labour
Street food vendors are mostly micro‐entrepreneurs, who provide employment not only for
themselves but also for other people who are unemployed. As shown in Table 5‐9, vendors in
Hat Yai city have more helpers than their counterparts in Tangerang. Currently, 31.8% of Hat
Yai’s vendors employ paid workers to work for them. In Tangerang, only 10.0% of the
respondents, reported employing a helper when they started their own business, which has
increased to 12.5% at present. In Hat Yai, this is presumably due to busier locations and a
large‐scale business so that they may generate high sales and hire paid workers.
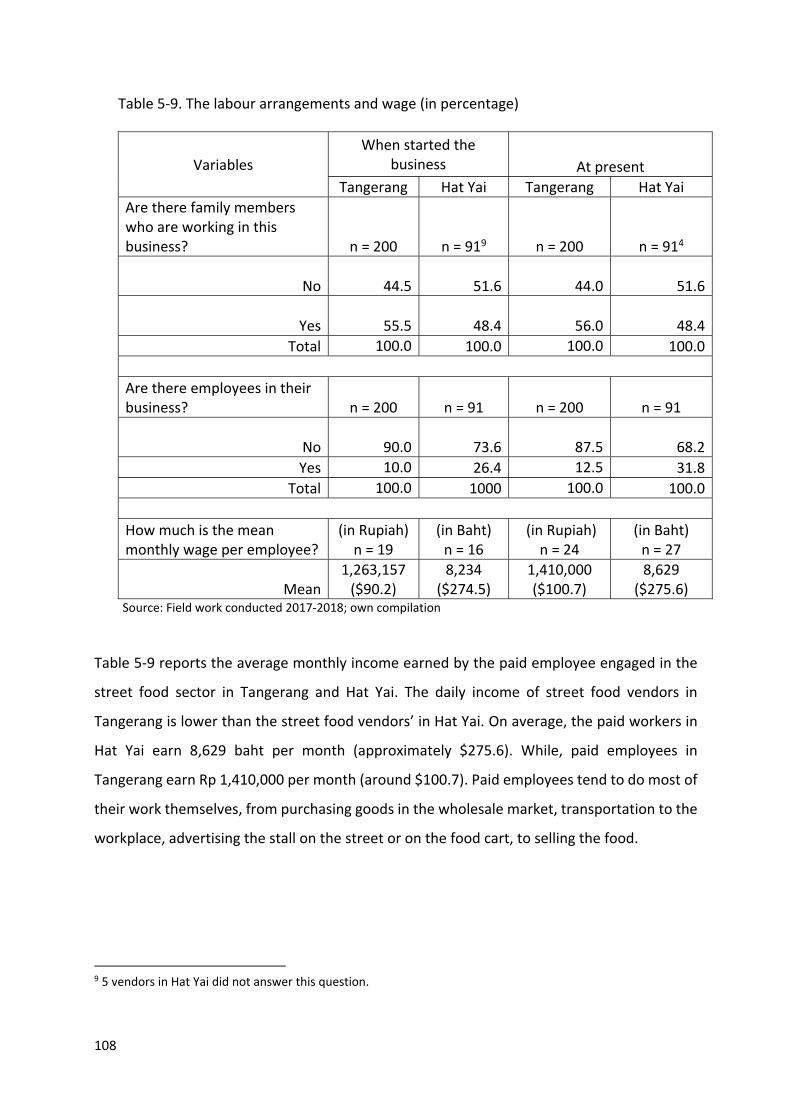
108
Table 5‐9. The labour arrangements and wage (in percentage)
Variables
When started the business At present
Tangerang Hat Yai Tangerang Hat Yai
Are there family members who are working in this business? n = 200 n = 919 n = 200 n = 914
No
44.5 51.6
44.0
51.6
Yes
55.5 48.4
56.0
48.4
Total 100.0 100.0 100.0 100.0
Are there employees in their business? n = 200 n = 91 n = 200 n = 91
No
90.0 73.6
87.5 68.2
Yes 10.0 26.4 12.5 31.8
Total 100.0 1000 100.0 100.0
How much is the mean monthly wage per employee?
(in Rupiah) n = 19
(in Baht) n = 16
(in Rupiah) n = 24
(in Baht) n = 27
Mean 1,263,157 ($90.2)
8,234 ($274.5)
1,410,000 ($100.7)
8,629 ($275.6)
Source: Field work conducted 2017‐2018; own compilation
Table 5‐9 reports the average monthly income earned by the paid employee engaged in the
street food sector in Tangerang and Hat Yai. The daily income of street food vendors in
Tangerang is lower than the street food vendors’ in Hat Yai. On average, the paid workers in
Hat Yai earn 8,629 baht per month (approximately $275.6). While, paid employees in
Tangerang earn Rp 1,410,000 per month (around $100.7). Paid employees tend to do most of
their work themselves, from purchasing goods in the wholesale market, transportation to the
workplace, advertising the stall on the street or on the food cart, to selling the food.
9 5 vendors in Hat Yai did not answer this question.

109
At present, the average monthly income of paid workers from the street food sector in Hat Yai
is, in fact, higher than the city’s monthly minimum wage. The Central Wage Committee (2018)
in Thailand assigned the minimum wage for Songkla province, including Hat Yai city around
330 baht per day. On the contrary, paid employees in Tangerang, according to the survey
received a significantly lower wage than the city’s minimum wage. As stated by the Banten
Governor’s Decree (2018), the minimum wage in Tangerang city is Rp 3,582,000 per month
(approximately $255.8), which means that the paid workers in the street food sector receive
a wage which is less than half of the minimum wage in Tangerang city. To summarise, cross‐
country comparison revealed that paid workers in the street food sector in Hat Yai are earning
higher wages than those in Tangerang.
Although vendors employ paid workers, there is no correlation between the family size and
the number of paid workers, both in Hat Yai and Tangerang (Table 5‐10). Many of vendors in
these urban centers operate with unpaid contributing family members. During busy seasons,
including festival days and vacations, the vendors will get more help from unpaid family
members, such as their children who are on their school holidays. In few cases, a paid
employee will be hired by vendors if they need people to help them.
Table 5‐10. Correlation between family size and the number of paid workers in Tangerang and Hat Yai
The number of paid workers
Tangerang Hat Yai
Family size
Pearson Correlation ‐0.067 0.051
Sig. (2‐tailed) 0.346 0.636
N 200 89 Source: Field work conducted 2017‐2018; own compilation
In accordance with the Minimum Wage Act, the employer is obliged to pay wages on a regular
and timely basis, at least once a month. The wage period may be fixed on an hourly, daily,
weekly or monthly basis. The employer is under obligation to pay wages in cash on a working
day before the expiry of the 7th day after the last day of the wage period. Unfortunately, the
majority of paid workers in Tangerang do not have an employment contract with the vendors.
The contract is only based on verbal agreements and principles of trust, which makes it

110
difficult for employees to claim their rights during disputes over wages and other social
benefits. The absence of an employment contract is common in the informal sector, such as
street food vending. In the vendors’ defence, if they were to pay wages in accordance with
the minimum wage, their business would be less competitive. When asked the reason why
the vendors gave low wages to their employees, most of them chose to remain silent on the
matter and did not want to answer any follow‐up questions.
Apparently, many of the employees only want to learn and acquire knowledge of setting up
and running the food stalls from the vendors and after that, they leave. In addition, the paid
employees labour only for a few hours, more specifically to help the vendor sell the food. One
participant, Mbak Wati, narrated the following experience.
“…I and my husband employed two workers to manage the business, paying them Rp 1,500,000 each per month. Unfortunately, since the beginning of this year, our employees
went out and did not return to work. It is not easy now to find employees who want to work with us for a long time. Some of them just want to learn from us. After they fully understand
how to run the business, they will leave. We've changed employees several times. Always like that. One of the advantages of operating your own business is hiring family members.
Thereof, I decided to help my husband running the business when the employees went out…”.
2.3. Commuting between Residence and Workplace
The mode of commuting between residence and workplace work differs considerably. As seen
in Table 5‐11, a high proportion of the vendors, both Tangerang (42.5%) and Hat Yai (55.2%)
travelled using their own motorcycle to their place of work. More than 20.0% of the vendors
in Tangerang walked by foot to their workplace and only 4.2% in Hat Yai, while nearly one‐
third of the total vendors in Hat Yai (33.3%) used their own car to reach their workplace. In
contrast, only 5.0% of the vendors in Tangerang travelled by car.
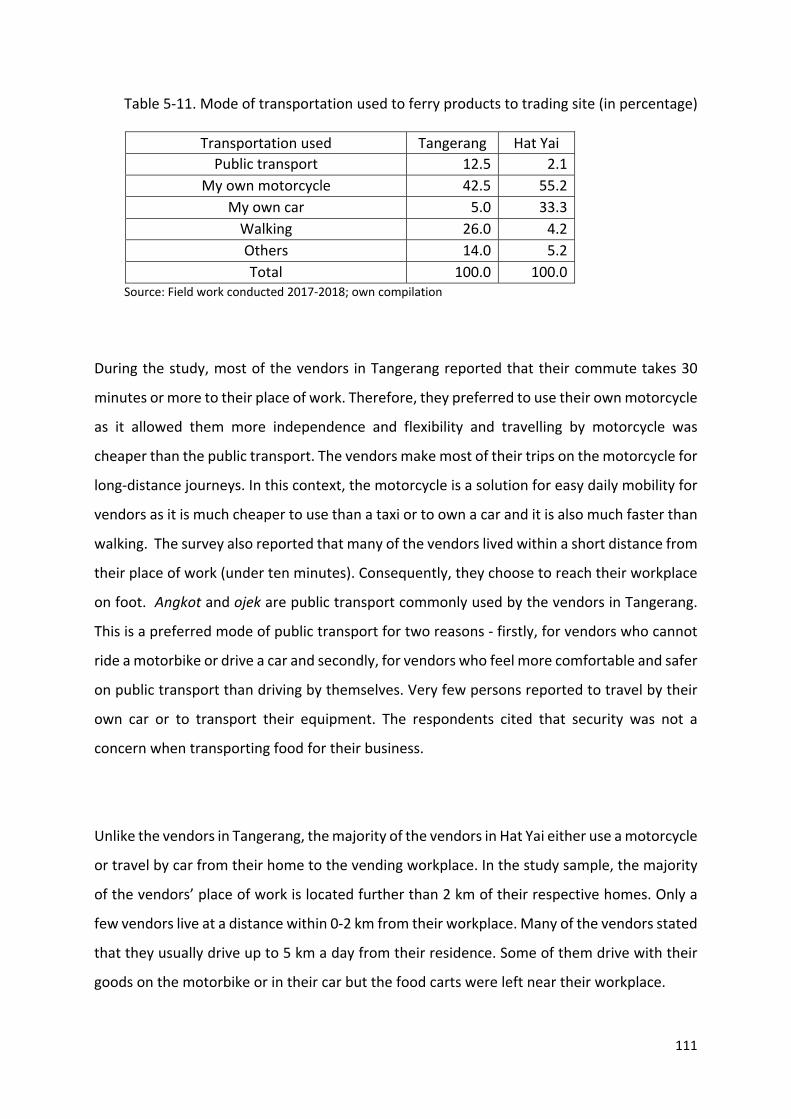
111
Table 5‐11. Mode of transportation used to ferry products to trading site (in percentage)
Transportation used Tangerang Hat Yai
Public transport 12.5 2.1
My own motorcycle 42.5 55.2
My own car 5.0 33.3
Walking 26.0 4.2
Others 14.0 5.2
Total 100.0 100.0 Source: Field work conducted 2017‐2018; own compilation
During the study, most of the vendors in Tangerang reported that their commute takes 30
minutes or more to their place of work. Therefore, they preferred to use their own motorcycle
as it allowed them more independence and flexibility and travelling by motorcycle was
cheaper than the public transport. The vendors make most of their trips on the motorcycle for
long‐distance journeys. In this context, the motorcycle is a solution for easy daily mobility for
vendors as it is much cheaper to use than a taxi or to own a car and it is also much faster than
walking. The survey also reported that many of the vendors lived within a short distance from
their place of work (under ten minutes). Consequently, they choose to reach their workplace
on foot. Angkot and ojek are public transport commonly used by the vendors in Tangerang.
This is a preferred mode of public transport for two reasons ‐ firstly, for vendors who cannot
ride a motorbike or drive a car and secondly, for vendors who feel more comfortable and safer
on public transport than driving by themselves. Very few persons reported to travel by their
own car or to transport their equipment. The respondents cited that security was not a
concern when transporting food for their business.
Unlike the vendors in Tangerang, the majority of the vendors in Hat Yai either use a motorcycle
or travel by car from their home to the vending workplace. In the study sample, the majority
of the vendors’ place of work is located further than 2 km of their respective homes. Only a
few vendors live at a distance within 0‐2 km from their workplace. Many of the vendors stated
that they usually drive up to 5 km a day from their residence. Some of them drive with their
goods on the motorbike or in their car but the food carts were left near their workplace.

112
2.4. The Vendors’ Attitude towards their Customers ‐ and Vice Versa
To increase sales, one of the strategies that vendors use is to encourage customer loyalty. The
vendors assume that the ability to retain loyal customers will be decisive for success and
failure or their business. Many vendors interviewed indicated that customer relationship is a
key to their business. A personal approach might be used as marketing strategy by vendors to
manage their customers. Some vendors explained, they make an effort with a personable and
persuasive attitude by being friendly and polite, in attempt to make customers feel privileged
and important.
Furthermore, many vendors reported, their relationships with customers go far beyond a
mere commercial attitude. During the interviews, the female vendors were asked about their
customers’ attitudes towards them in their workplace. Most of them replied that the
customers’ attitudes towards them were co‐operative (Table 5‐12), in Tangerang considerably
more (70.5%) than in Hat Yai (49.0%).
Table 5‐12. Attitude the vendors’ customers (in percentage)
Attitude the vendors’ customers Tangerang n = 200
Hat Yai n = 96
Co‐operative 70.5 49.0
Neutral 28.0 50.0
Adverse 1.5 1.0
Total 100.0 100.0 Source: Field work conducted 2017‐2018; own compilation
Reversely, most of the women street food vendors are very happy with the attitudes of their
customers. According to the vendors, many customers treat them as a friend. They have
regular communication which takes place at the workplace when the customers come to buy
food. In addition, customer relations between the women vendors and their customers were
remarkable as they could even confide in each other about various problems. One interviewee
in Hat Yai, who operates from her food cart in the campus area of Prince of Songkla University,
gave an example of a good relationship with her customers:
113
“I have always been called "mami" (= mother) by some of my customers, especially students. They feel so familiar with me. They did not hesitate to share their problems, including
personal problems. I have been considered as a “mother” by some of them. I also considered them no longer as customers but like my family. This made them always come and come
again to my food cart.”
One vendor’s statement in Tangerang, however, shows a slightly higher degree of reservation:
“I have never perceived the difficulty in running the business. In spite of the fact that I am a woman, I am in all respected by my customers as well as other vendors. I vigorously respect
others; I hope the same thing. If only a verbal joke, for me it does not matter.”
3. Degree of Social Protection
3.1. General
Another challenge facing the street food vendors is the lack of social protection for the
informal economy. In both Tangerang and Hat Yai, there is almost no access to social security
for street food vendors, despite the ILO conventions and UN instruments clearly stating that
social security is a basic human right. Social security was first officially recognised as a human
right in 1989 by the International Labor Organization (ILO, 2000) which stressed the need and
protection of workers against sickness, medical care, maternity benefits, employment injury,
inability and survivor's benefits, old age pension etc. (ILO, 2000). It was subsequently accepted
by the General Assembly of the United Nations whilst also implementing the Universal
Declaration of Human Rights (UDHR) which states that every member of the society has a right
to social security.
According to the estimates of International Labour Organisation (ILO), half of the global
population has no social security coverage and only one‐quarter of the population has
adequate social security coverage (Ginneken, 2003).

114
In Indonesia, the Employee Social Security System (BPJS Employment) has been created to
provide universal social security for Indonesian workers, such as a pension scheme, old‐age
benefits, workplace injury benefits and death benefits. In 2015, based on the National Labour
Force Survey (known as Sakernas) data, the total number of workers in Indonesia reached
122,3 million people and approximately 95.0% (114 million) were classified as employed.
However, only around 23 million Indonesian workers are covered by the BPJS Employment.
This scheme therefore faces many challenges, including the treatment of unregistered
informal workers. Out of the employed workers, about 70,9 million are assigned to the
informal sector. Hitherto, only 1,7 million informal workers are registered as a member of the
BPJS employee social security scheme (BPJS Employment, 2017). In line with these findings,
Van der Loop and Andadari (2010) in their research about social security for informal workers
in Indonesia found that about 80.0% of the interviewed informal workers did not have social
security whatsoever and 90.0% of the informal workers stated that in the event of poor health
or unplanned incidences, their families will take care of them. The survey also discovered that
60.0% of the total informal workers were aware of schemes for social security implemented
by BPJS Employment.
It is challenging to ask informal workers to participate in social security schemes even though
they are aware of the benefits of the schemes. The main reason is that many of them lack
fixed contracts and often without a fixed amount of salary, which makes their participation
problematic. Although the government might be able to assist them in the registration stage,
their long‐term membership remains uncertain. Like many informal workers, the majority of
the food vendors interviewed stated they did not have the social security or welfare benefits
like pension, work accident insurance or life insurance benefits,
As one street food vendor in Tangerang, Mba Widi noted, “I have been registered as a BPJS
employment participant when I worked at PT. Mattel Indonesia and PT. Yamaha Music
Indonesia, but when I left out, I have not registered anymore because I did not pay membership
contributions. Now, I don't have any social security schemes.” Another street food vendor

115
described her challenges by saying, “I have never had a social security scheme. I don't
understand about the program and how to register it.”
Like in Indonesia, the social security program in Thailand does not protect all informal sector
workers. In 2015, there were 38,3 million working‐age people in Thailand, with approximately
21,4 million (55.9%) employed in the informal sector (National Statistical Office of Thailand,
2015). Although these worker groups are very important to the Thai economy, the majority
are, unfortunately, excluded from the social security scheme (Nilvarangkul et al., 2016).
3.2. Health
Health care protection is undeniably important for every citizen, especially for informal
workers, as their profession is full of insecurity and uncertainty. Because of the location of
their workplace at crowded places, on sidewalks or on the roadside (see following Chapter),
accidents are most likely to occur at any time. Furthermore, as the women are exposed to
poor hygiene and bad weather conditions, vendors tend to fall more often sick than other
citizens. When vendors or their family members fall sick, their productivity is seriously
affected, resulting in lost income and possible descent into poverty. Thus, assistance with
meeting the costs of healthcare is necessary throughout the community, particularly for the
poor and vulnerable.
For women street food vendors, their health is their wealth; if they fall ill, they lose their
income, and in events of chronic illnesses they are doomed to incur their financial ruin. The
vendors also find that illness among their children or families is a major source of expenditure.
As stated by one of the respondents, Ibu Noh, 62, who has been a vendor for 25 years by
selling Indonesian salad opposite the Buddhi Dharma university in Tangerang:
“I will tell you this, vending is just making money for consumption of one day and tomorrow I
have to come and do the same thing…normally I get net income Rp 50.000 a day…it's too little but I have no option where would I get money for water, electricity, and all other things
that require cash. I pray I don't get ill. I don't know where I should go if I get ill. Who will pay
116
for my treatment? I don't have a health insurance. I am afraid to think about it, I am getting older.”
In 2014 the government of Indonesia has officially launched the National Health Insurance
(JKN) program, which is managed by the Health Services and Social Security Agency (BPJS
Health). The program was and the agency is tasked with providing national health insurance
for all Indonesians, with a primary focus on low‐income groups and workers. Unfortunately,
informal workers, in particular, are yet to be covered adequately. In March 2019, the official
BPJS Health website released the number of participants reaching 218 million people, which
has exceeded 82.5% of the total population of Indonesia (BPJS Health, 2019).
Although the National Health Insurance program is mandatory for all Indonesian residents, at
present, a substantial number of informal workers do not have health insurance. A recent data
by BPJS health shows that only 30,4 million (44.7%) informal workers were registered as JKN
program participants, and about 55.3% of those workers lacked health insurance (BPJS Health,
2019). Among our respondents in Tangerang 49.5% of the respondents (Table 5‐13) were not
covered by this scheme.
There are various reasons for the lack of health protection for vulnerable street food vendors
in Tangerang. It is not uncommon that many informal workers have a negative perception on
the effectiveness of health centres and therefore, prefer to visit private practices. One major
reason for this common view is that health centres are severely underfunded because the
government subsidies have been mostly directed to public hospitals (Sparrow et al., 2013 as
cited by Kartika, 2015). As a result, patients receive poor services and/or pay high user fees.
The amount of premiums is another factor that prevents the vendors from registering for the
health insurance scheme. According to various surveys, BPJS Health premiums are higher than
the amount that informal workers are willing to contribute. A study by Handayani et al. (2013)
in a district of Hulu Sungai Selatan, Borneo found that majority of informal workers are only

117
willing to pay IDR 5,000 ($0.4) per month, which is a quarter of the lowest premium set by
BPJS (IDR 25,500 or around $1.8). Van der Loop and Andadari (2010) study for informal workers
on various districts in Indonesia also revealed that 26.0% of workers cannot afford to pay the
premium, whereas 40.0% of the sample are only willing to pay less than IDR 10,000 ($0.7).
Furthermore, only 11.0% of informal workers are willing to pay above IDR 20,000 ($1.4) who
are most likely to fall into the highest income quintile of informal workers.
Table 5‐13. Access to public/private medical services in the research areas
Access to public/private medical services
Tangerang (n=19810) Hat Yai (n=9411)
Yes No Yes No
When vendors started the business
47 (23.7%) 151 (76.3%) 20 (21.3%) 74 (78.7%)
At present 101 (50.5%) 97 (49.5%) 33 (35.0%) 61 (65.0%) Source: Field work conducted 2017‐2018; own compilation
Similarly to the Indonesian government, the Government of Thailand in 2001 introduced a
universal coverage scheme with the aim of ensuring equitable health care access, for even the
poorest citizens. For a flat user fee of 30 Baht per consultation, or free for those falling into
exemption categories, every scheme participant has access to registered health services. The
number of vendors in Hat Yai who have now access to public/private medical services have
increased compared against the time before joining the business, however, compared against
Tangerang the gains were fairly modest.
In line with the findings from Nilvarangkul et al. (2016) in Khon Kaen, Thailand, this study
shows that the majority of the respondents in Hat Yai, as seen in Table 5‐13 do not have access
to public or private medical services as they were not registered as health insurance
participants. This can be explained by various factors. The health service is not easily accessible
as it requires one to have a registed house in a specific area to apply for the 30 baht‐for‐all
10 Two vendors in Tangerang did not answer the question in Table 5‐13. 11 Two vendors in Hat Yai did not answer the question in Table 5‐13.

118
health schemes. There is also no subsidy from the government for a voluntary insurance
scheme to support informal labour. Furthermore, many respondents explained that they are
not satisfied with the health care service they received through the 30‐baht scheme. Like the
Indonesian JKN, this scheme only covers health problems in a narrow sense excluding accident
insurance or child care.
Additionally, in Thailand, vendors can make use of an alternative facility. Informal sector
workers can now access free health care by visiting the primary care health centers which are
spread throughout all sub‐districts in Thailand. However, although informal sector workers
have free access to these primary health centers, none provide specific health services for
work‐related illness/injuries, or education, or health promotion to reduce work‐related
illness/accident risk (Nilvarangkul et al., 2016).
Street food vendor, Pee Pauan, 64 years old recounts their experience with a primary care
unit:
“I used to go to the primary care unit (PCU) nearby my home when I got ill. It was free. Since
I do not have a medical insurance scheme, so I decided to go to PCU. In PCU, of course, there are many people! Wait in the queue. The service, itself, was good but very slow. I spent
a whole day in the PCU.”
Attempts to extend the coverage the social security programs, for the informal workers and
their families remain one of the main challenges in both countries.
4. Summary
Street food vending, an integral part of informal sector has been reported to be one of the
important urban activities of many developing countries and appears to be an important
category of economic street activities. Many street food vendors are women. These women
street food vendors are micro‐entrepreneurs rather than dependent workers, providing
employment not only for themselves but also for others. This study reveals that street food
vendors are not merely a temporary source of income as most of the vendors interviewed
119
have been in vending for a long time and are very well established. A very small portion of
women vendors have come to their respective markets in the last two years. Albeit, the
remaining vendors had joined the business at least five years ago. Family support is central to
the operation of most street food vendors, and the study found that the women street food
vendors received support either from their family members or their friends or relatives.
The daily life of women street food vendors is characterised by very poor working conditions,
where they usually work from early in the morning to late at night. The time spent by women
vendors for different activities, including selling time and preparing time ranged from 8 ‐ 14
hours daily. The vendors prefer to use either a motorcycle or car from their home to the
vending place to transport their goods. Vendors in Tangerang had more helpers from their
family members than vendors in Hat Yai. Conversely, nearly a third of vendors in Hat Yai have
help from paid workers, while only fewer vendors in Tangerang hired paid workers due to they
engaged non‐paid family members in the business. Additionally, paid employees in Tangerang
earn lower wages than their counterpart in Hat Yai.
The Indonesian government launched the universal healthcare for Indonesian workers both
in the formal and informal sector in 2014, but unfortunately the study found that nearly half
(49.5%) of vendors in Tangerang were not covered by the health insurance systems. Like in
Indonesia, the health insurance program in Thailand does not protect all informal sector
workers; only 35% of the vendors in Hat Yai have access to health insurance systems.
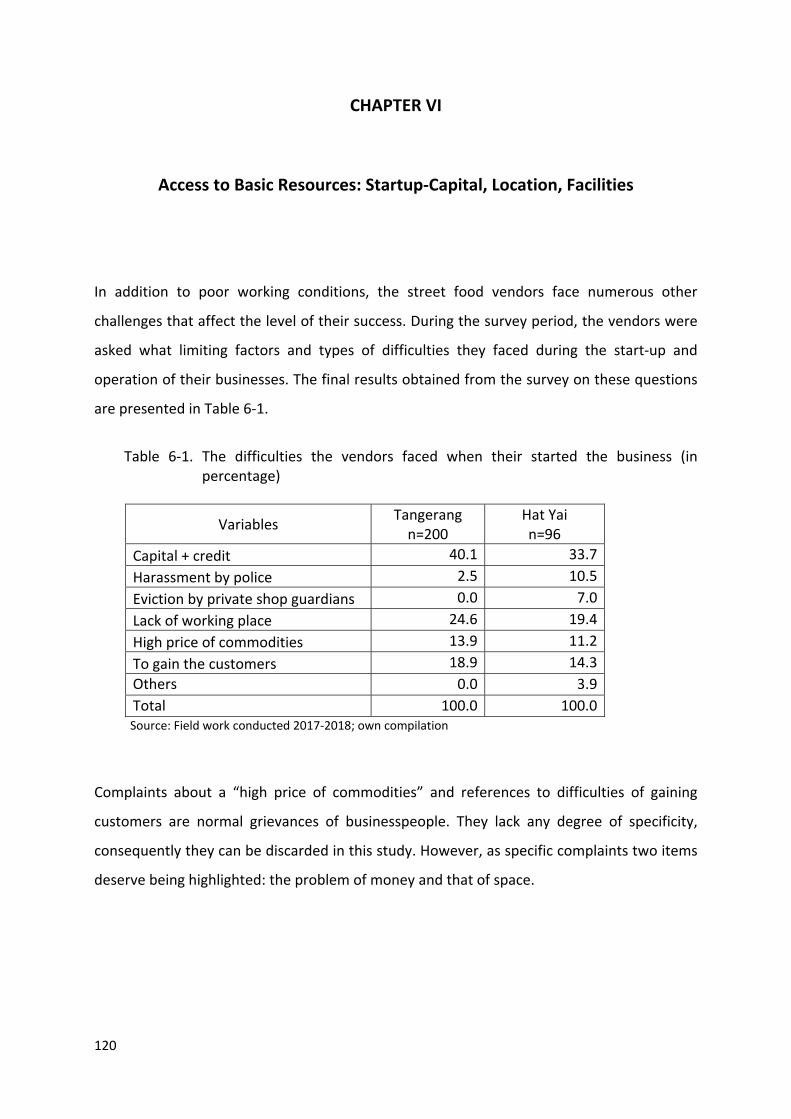
120
CHAPTER VI
Access to Basic Resources: Startup‐Capital, Location, Facilities
In addition to poor working conditions, the street food vendors face numerous other
challenges that affect the level of their success. During the survey period, the vendors were
asked what limiting factors and types of difficulties they faced during the start‐up and
operation of their businesses. The final results obtained from the survey on these questions
are presented in Table 6‐1.
Table 6‐1. The difficulties the vendors faced when their started the business (in percentage)
Variables Tangerang n=200
Hat Yai n=96
Capital + credit 40.1 33.7
Harassment by police 2.5 10.5
Eviction by private shop guardians 0.0 7.0
Lack of working place 24.6 19.4
High price of commodities 13.9 11.2
To gain the customers 18.9 14.3
Others 0.0 3.9
Total 100.0 100.0 Source: Field work conducted 2017‐2018; own compilation
Complaints about a “high price of commodities” and references to difficulties of gaining
customers are normal grievances of businesspeople. They lack any degree of specificity,
consequently they can be discarded in this study. However, as specific complaints two items
deserve being highlighted: the problem of money and that of space.

121
1. Initial Working Capital
Before starting a street food business, all new vendors must first obtain the required start‐up
capital. Start‐up capital, also known as working capital, is the funding that helps entrepreneurs
(vendors) pay for equipment, rent, supplies, and so forth during the first year of operation.
According to Myrick (2018) to open a food business, there are three types of funding, namely
seed capital, start‐up capital and expansion capital. Seed capital is the initial funding used to
begin creating a business, such as for planning and research when they start the business.
Then, expansion capital is used when the business is ready to and expand. However, most new
street food entrepreneurs need only initial working capital as many of them would have never
used seed capital.
The biggest question when a vendor starts their business is from what and where exactly are
they going to trade? Do they want a stall, a cart, a tent or a table? Where will they buy or lease
it from? One of the biggest costs for a street food business occurs on the type of display itself.
The exact amount of initial working capital of street food business will mostly be spent on the
type of display. In addition, the amount of costs in the different categories can vary across
type of food items prepared by vendors.
In the present study, most of the respondents are basically street food vendors who are
considered as informal vendors and most of them are from a poor economic background. The
reported startup capital requirements for most of the women’s street food business in
Tangerang, as shown in Table 6‐2, was relatively small. It ranged from one million ($71.4) to
ten million rupiahs ($714.3), and rarely exceeded Rp 15 million ($1,071.4), with average initial
working costs of Rp 6,57 million ($469.3). The majority of vendors in Hat Yai invested less than
50,000 THB ($1,666.7) during startups, and the average costs were 40,620 THB ($1,354) in the
initial phase. These results are consistent with the findings from Kusakabe (2006) on street
vendors in Thailand where street vendors would need at least USD 1,000‐2,000 as starting
capital.
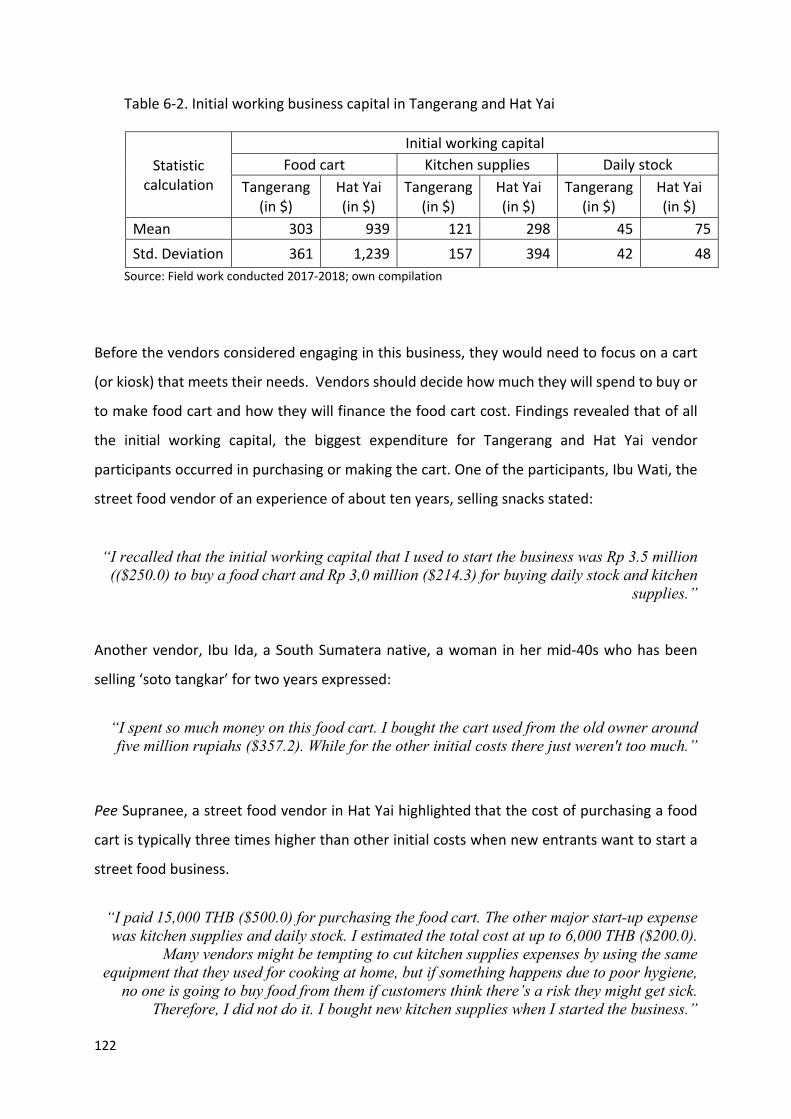
122
Table 6‐2. Initial working business capital in Tangerang and Hat Yai
Statistic calculation
Initial working capital
Food cart Kitchen supplies Daily stock
Tangerang (in $)
Hat Yai (in $)
Tangerang (in $)
Hat Yai (in $)
Tangerang (in $)
Hat Yai (in $)
Mean 303 939 121 298 45 75
Std. Deviation 361 1,239 157 394 42 48
Source: Field work conducted 2017‐2018; own compilation
Before the vendors considered engaging in this business, they would need to focus on a cart
(or kiosk) that meets their needs. Vendors should decide how much they will spend to buy or
to make food cart and how they will finance the food cart cost. Findings revealed that of all
the initial working capital, the biggest expenditure for Tangerang and Hat Yai vendor
participants occurred in purchasing or making the cart. One of the participants, Ibu Wati, the
street food vendor of an experience of about ten years, selling snacks stated:
“I recalled that the initial working capital that I used to start the business was Rp 3.5 million (($250.0) to buy a food chart and Rp 3,0 million ($214.3) for buying daily stock and kitchen
supplies.” Another vendor, Ibu Ida, a South Sumatera native, a woman in her mid‐40s who has been
selling ‘soto tangkar’ for two years expressed:
“I spent so much money on this food cart. I bought the cart used from the old owner around five million rupiahs ($357.2). While for the other initial costs there just weren't too much.”
Pee Supranee, a street food vendor in Hat Yai highlighted that the cost of purchasing a food
cart is typically three times higher than other initial costs when new entrants want to start a
street food business.
“I paid 15,000 THB ($500.0) for purchasing the food cart. The other major start-up expense was kitchen supplies and daily stock. I estimated the total cost at up to 6,000 THB ($200.0).
Many vendors might be tempting to cut kitchen supplies expenses by using the same equipment that they used for cooking at home, but if something happens due to poor hygiene,
no one is going to buy food from them if customers think there’s a risk they might get sick. Therefore, I did not do it. I bought new kitchen supplies when I started the business.”

123
A food cart can be purchased. However, building an own food cart enables the vendor to be
more creative with the design and save money. In this study, most women vendors explained
that members of their family designed and built a food cart for them. One vendor from
Tangerang, Ibu Harifah, described how her family supported the availability of the equipment
of food cart.
“Inspired by the success of my brother, I decided to start street food business selling soto lamongan around in the middle of 1999 as a way out to start working independently. How to
start the business, I still remember that my brother made the food chart for me.”
Another vendor in Tangerang, Ibu Lina who started running her business in early 1995 added:
“My husband fully supported my desire to have my own business. My husband gave Rp
500,000 ($35.7) as the initial working capital. The money was used to buy daily stocks and kitchen supplies. The food cart was made by my husband himself.”
In spite of a great deal of practical support on the spot, ‘economic barriers’ turned out to be
the primary hindrances people face to successfully enter informal trading, such as the street
food business. The interviews revealed that one of the important requirements in starting the
business was access to credit. Several studies have shown that small players like women street
food vendors in developing countries experience difficulties when seeking financial help.
Janaki and Jeyakumar (2017) found that women hawkers in Tuticorin district, India, face
problems due to lack of capital and low income. This is because vendors are ineligible for
formal financial services due to their lack of education and their small‐scale business (Sclama
and Aguiari, 2017).
Unfortunately, banks or formal financial institutions notice that lending to street food vendors
is not attractive due to high administrative costs, lack of deposits and low revenues (Serrano‐
Cinca and Gutierrez‐Nieto, 2014). In addition, the results of the study from Adusei (2015)
showed that women petty traders in Upper West Region of Ghana often faced difficulties in
accessing financing from organized banking services as they lack documents, tenure or legal
rights over their place or business and evidence of their trades. In this study street food
vendors further raised an issue with the lack of credit facilities as the financial institutions did

124
not give the loan to people who – as migrants – did not possess an identification card of the
city and to people with no collateral security. Although they usually demonstrate a high
payment capacity, because of the absence of collateral and firm domicile status, formal
financial institutions usually reject them. Many vendors stated that they failed to obtain a loan
from established formal financial institutions because they did not meet the requirements.
Only 4.2% (Hat Yai) respectively 3.5% (Tangerang) had borrowed money from banks.
In order to survive, vendors borrow money from various other sources including
moneylenders, and they pay a high amount of interests to the sources from where they
borrow money (Malik, 2017). In the present study, this experience was often confirmed when
vendors were asked to elaborate on the nature of difficulties associated with finances. The
lack of capital to start the business forces vendors to take loans from a local lender (as opposed
to a bank) at high‐interest rates. High‐interest rates are typically charged to vendors who
borrow from moneylenders. As stated by a vendor in Tangerang, Ibu Cawi, 49 years old:
“When I started the business, I borrowed a portion of working capital from moneylenders. I have to set aside my sales to be paid to the moneylender. I have to repay the responsibilities day to day. Moneylender every day came and took money in the kiosk. The interest was very
high, but I had no choice. My husband at that time did not have the money nor did my children. Finally, I decided to borrow money from the moneylender. Even now, there is
sometimes no initial capital to pay for the purchase, so I take loans from moneylenders. When my sales weren't doin' too good, I didn't pay installments to the moneylender. I experienced it several times. They understood it. I really want to borrow money from the bank with a lower
interest. But is it possible? It seems people like me will never be given a loan by a bank.”
The problems were not limited to the initial period of business start‐up:
“Financial problems which I faced in my life are like if some emergency takes place, like a few months ago, I ran out of working capital when my youngest son got married, then I have to take money on credit from moneylenders on the high interest. After taking money on credit I
worked and then returned it after 2‐4 months. I tried to apply for a microfinance loan but could not get it. Economically, I am less empowered. I don't have collateral and my business
is too small.”
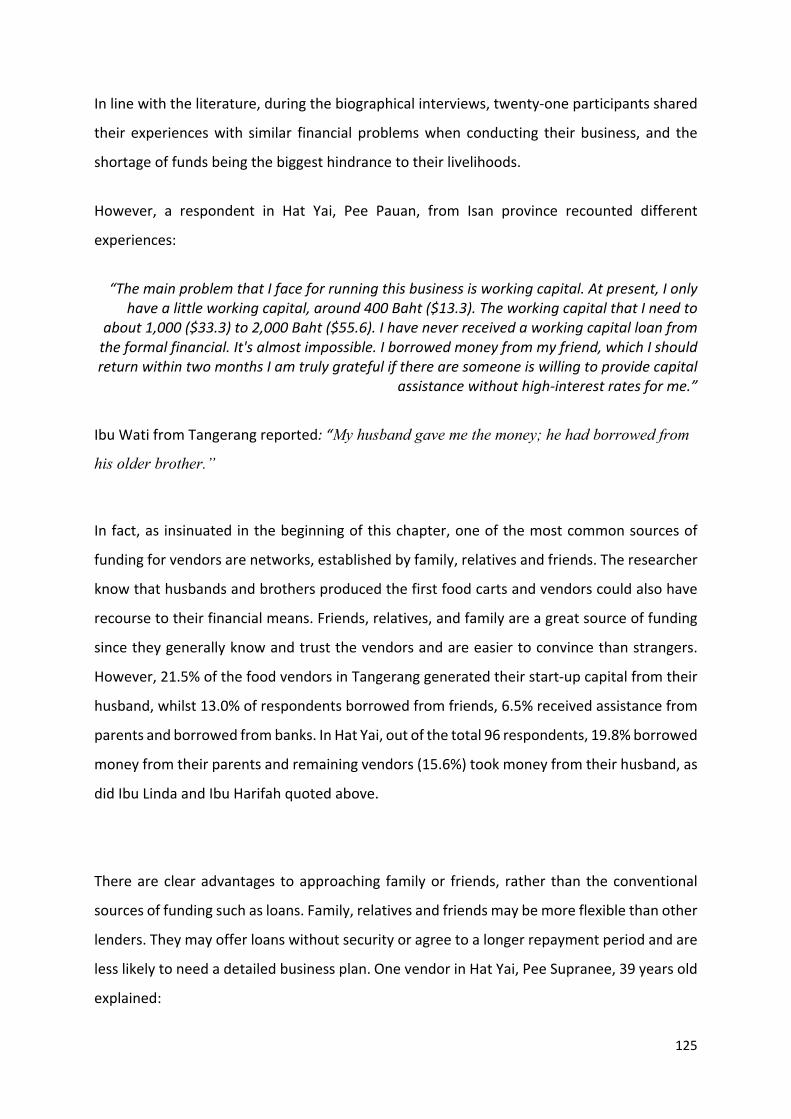
125
In line with the literature, during the biographical interviews, twenty‐one participants shared
their experiences with similar financial problems when conducting their business, and the
shortage of funds being the biggest hindrance to their livelihoods.
However, a respondent in Hat Yai, Pee Pauan, from Isan province recounted different
experiences:
“The main problem that I face for running this business is working capital. At present, I only
have a little working capital, around 400 Baht ($13.3). The working capital that I need to about 1,000 ($33.3) to 2,000 Baht ($55.6). I have never received a working capital loan from the formal financial. It's almost impossible. I borrowed money from my friend, which I should return within two months I am truly grateful if there are someone is willing to provide capital
assistance without high‐interest rates for me.”
Ibu Wati from Tangerang reported: “My husband gave me the money; he had borrowed from
his older brother.”
In fact, as insinuated in the beginning of this chapter, one of the most common sources of
funding for vendors are networks, established by family, relatives and friends. The researcher
know that husbands and brothers produced the first food carts and vendors could also have
recourse to their financial means. Friends, relatives, and family are a great source of funding
since they generally know and trust the vendors and are easier to convince than strangers.
However, 21.5% of the food vendors in Tangerang generated their start‐up capital from their
husband, whilst 13.0% of respondents borrowed from friends, 6.5% received assistance from
parents and borrowed from banks. In Hat Yai, out of the total 96 respondents, 19.8% borrowed
money from their parents and remaining vendors (15.6%) took money from their husband, as
did Ibu Linda and Ibu Harifah quoted above.
There are clear advantages to approaching family or friends, rather than the conventional
sources of funding such as loans. Family, relatives and friends may be more flexible than other
lenders. They may offer loans without security or agree to a longer repayment period and are
less likely to need a detailed business plan. One vendor in Hat Yai, Pee Supranee, 39 years old
explained:

126
“When I'd like to open the business, I didn't have enough money to fulfill all working capital that it needed. I requested help from my friend to borrow funds to finance my business. She agreed. I still remember it well, the amount that I lent from her, which was around 15,000 Baht ($500.0). I asked when I should return back the money. She said don't have to worry,
you can return the money if you already have it. I don't need it now.” However, the rate of financial support coming from family members and familiar persons was
considerably lower than their mental support (see Chapter V, Table 5‐6). Surprisingly, but fairly
in line with literature findings (see Introduction), a majority of vendors in Tangerang (52.5%)
and Hat Yai (51.0%), used their own money as working capital (Table 6‐3). The high percentage
of street food vendors using their own savings as start‐up funds can be explained by the fact
that street food vending is a small‐scale business which does not require high operating costs.
As expressed by Mbak Widi, a 32 years old female vendor running a food cart over one year:
“After a few years working for others, I decided I was ready to open my own business as a
street food vendor. I opened the business because I know everyone needs to eat. Even though it was my first experience as an owner, however, I have to confidence that I'll survive in this
business. I started the business using my own saving. The initial working capital, I used to buy a food cart, kitchen supplies, and daily stocks. I asked people to make a food cart and I
paid them around Rp 3 million ($214.3). For daily stock, I only spent about Rp 200 thousand ($14.3) a day when I started selling.”
In the beginning, the savings originated from their previous jobs (see Chapter V), which
underscores the importance of this experience. As a result of economic success, when the
vendors’ incomes increased rapidly and when their turnover became fairly high, they could
even more invest from their own savings. One respondent, Ibu Ria, 46 years old who has run
her street food business for more than 15 years in Tangerang stated:
“I quitted my job as a maid and decided to start my own business about 15 years ago. I talked to my husband about the idea, and he agreed with my decision. I've always wanted to have my
own business, and I think I have a solid idea for a business. I really loved cooking and I felt confident that I'd succeed in this business. I knew that one of the important things to start the
business is working capital. Without any venture funding or loans would be tricky but not impossible. I'd accepted that the only way to fund my passion would be to use my savings. At that time, I couldn't ask for money from my husband because he didn't have it either. … Since I started my own business, I have never borrowed money for my business. Now, the business
has been continued by my second son, I occasionally help him.”
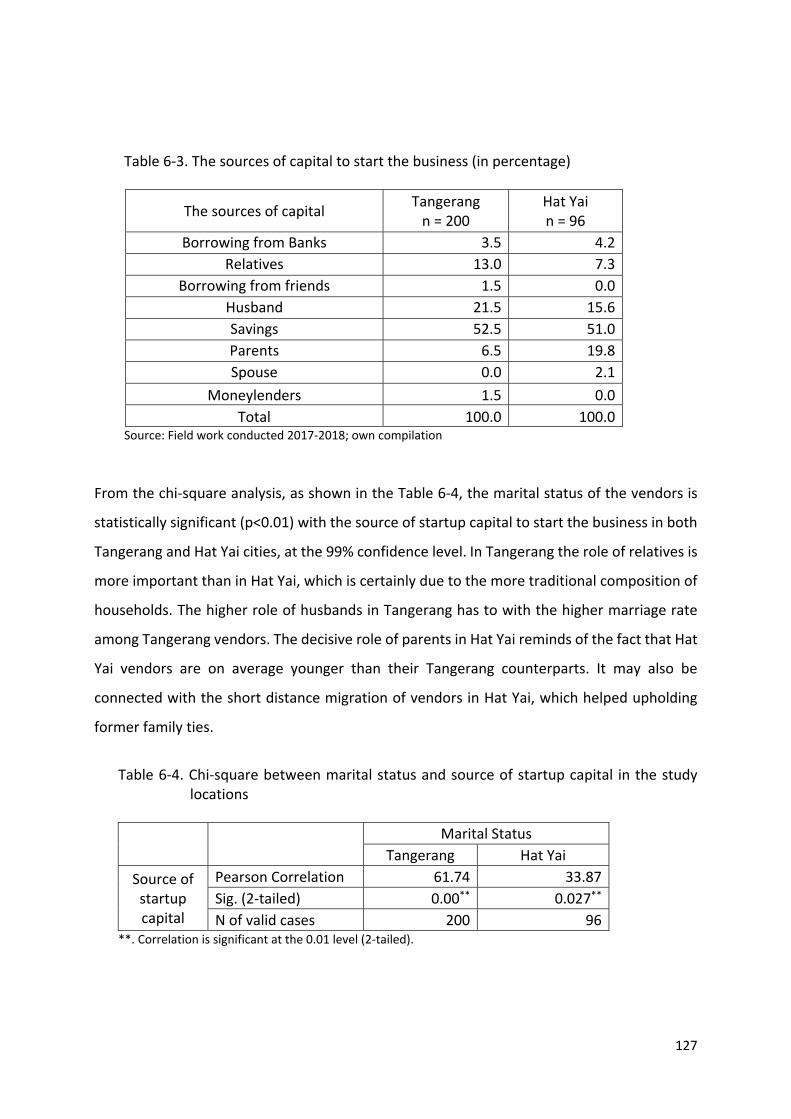
127
Table 6‐3. The sources of capital to start the business (in percentage)
The sources of capital Tangerang n = 200
Hat Yai n = 96
Borrowing from Banks 3.5 4.2
Relatives 13.0 7.3
Borrowing from friends 1.5 0.0
Husband 21.5 15.6
Savings 52.5 51.0
Parents 6.5 19.8
Spouse 0.0 2.1
Moneylenders 1.5 0.0
Total 100.0 100.0 Source: Field work conducted 2017‐2018; own compilation
From the chi‐square analysis, as shown in the Table 6‐4, the marital status of the vendors is
statistically significant (p<0.01) with the source of startup capital to start the business in both
Tangerang and Hat Yai cities, at the 99% confidence level. In Tangerang the role of relatives is
more important than in Hat Yai, which is certainly due to the more traditional composition of
households. The higher role of husbands in Tangerang has to with the higher marriage rate
among Tangerang vendors. The decisive role of parents in Hat Yai reminds of the fact that Hat
Yai vendors are on average younger than their Tangerang counterparts. It may also be
connected with the short distance migration of vendors in Hat Yai, which helped upholding
former family ties.
Table 6‐4. Chi‐square between marital status and source of startup capital in the study locations
Marital Status
Tangerang Hat Yai
Source of startup capital
Pearson Correlation 61.74 33.87
Sig. (2‐tailed) 0.00** 0.027**
N of valid cases 200 96 **. Correlation is significant at the 0.01 level (2‐tailed).

128
A cross tabulation analysis between marital status and the source of capital to start the
business in Table 6‐5 and Table 6‐6 shows the percentage of self‐financing and the use of
credit in general is quite similar in the two cities, the sources of credit however, displays
certain dissimilarities, which can be ascribed to the demographic differences.
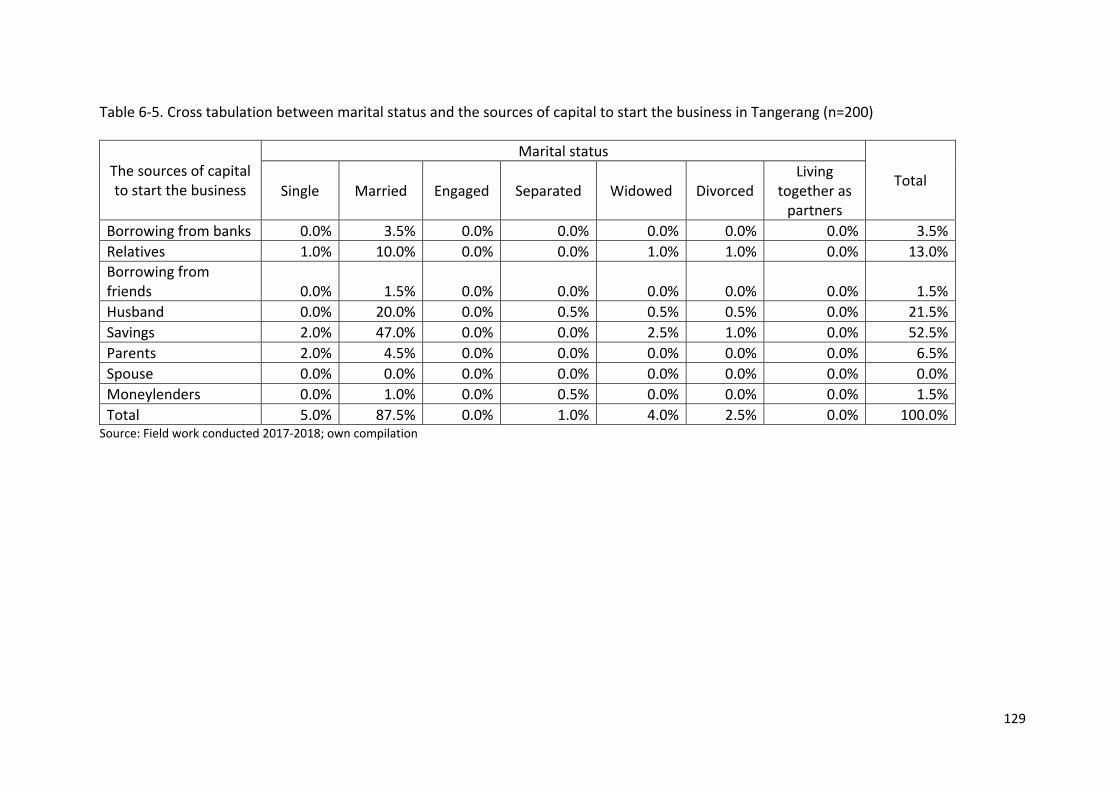
129
Table 6‐5. Cross tabulation between marital status and the sources of capital to start the business in Tangerang (n=200)
The sources of capital to start the business
Marital status
Total Single Married Engaged Separated Widowed Divorced
Living together as partners
Borrowing from banks 0.0% 3.5% 0.0% 0.0% 0.0% 0.0% 0.0% 3.5%
Relatives 1.0% 10.0% 0.0% 0.0% 1.0% 1.0% 0.0% 13.0%
Borrowing from friends 0.0% 1.5% 0.0% 0.0% 0.0% 0.0% 0.0% 1.5%
Husband 0.0% 20.0% 0.0% 0.5% 0.5% 0.5% 0.0% 21.5%
Savings 2.0% 47.0% 0.0% 0.0% 2.5% 1.0% 0.0% 52.5%
Parents 2.0% 4.5% 0.0% 0.0% 0.0% 0.0% 0.0% 6.5%
Spouse 0.0% 0.0% 0.0% 0.0% 0.0% 0.0% 0.0% 0.0%
Moneylenders 0.0% 1.0% 0.0% 0.5% 0.0% 0.0% 0.0% 1.5%
Total 5.0% 87.5% 0.0% 1.0% 4.0% 2.5% 0.0% 100.0% Source: Field work conducted 2017‐2018; own compilation
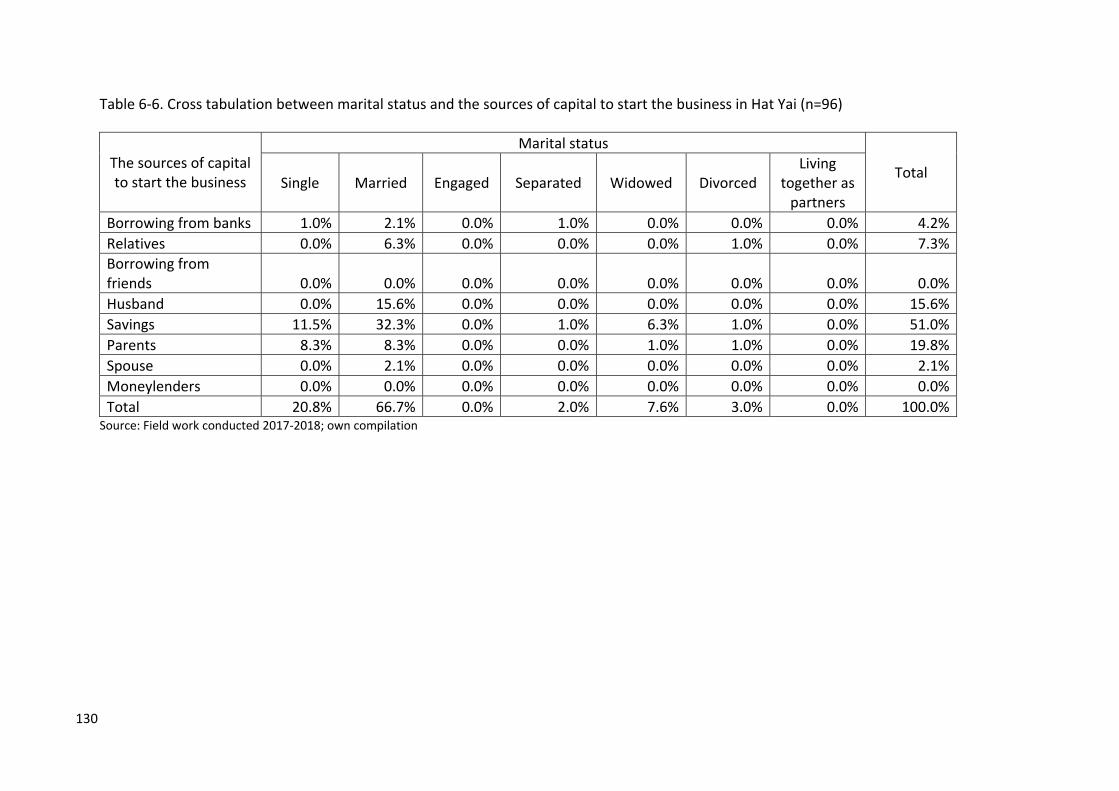
130
Table 6‐6. Cross tabulation between marital status and the sources of capital to start the business in Hat Yai (n=96)
The sources of capital to start the business
Marital status
Total Single Married Engaged Separated Widowed Divorced
Living together as partners
Borrowing from banks 1.0% 2.1% 0.0% 1.0% 0.0% 0.0% 0.0% 4.2%
Relatives 0.0% 6.3% 0.0% 0.0% 0.0% 1.0% 0.0% 7.3%
Borrowing from friends 0.0% 0.0% 0.0% 0.0% 0.0% 0.0% 0.0% 0.0%
Husband 0.0% 15.6% 0.0% 0.0% 0.0% 0.0% 0.0% 15.6%
Savings 11.5% 32.3% 0.0% 1.0% 6.3% 1.0% 0.0% 51.0%
Parents 8.3% 8.3% 0.0% 0.0% 1.0% 1.0% 0.0% 19.8%
Spouse 0.0% 2.1% 0.0% 0.0% 0.0% 0.0% 0.0% 2.1%
Moneylenders 0.0% 0.0% 0.0% 0.0% 0.0% 0.0% 0.0% 0.0%
Total 20.8% 66.7% 0.0% 2.0% 7.6% 3.0% 0.0% 100.0% Source: Field work conducted 2017‐2018; own compilation

131
Even though the working capital in the sector is low, the street food business is highly
competitive, and the source of competitive advantage tends to wane quickly. Existing
competitors are most likely to react strongly against new entrants, particularly when the
business is characterized by slow growth. Vendors who possess resources and skills are able
to grow in this business by overcoming challenges and barriers more easily than others, as
conveyed by Ibu Wartiyem, one of the Tangerang's vendors:
“If you want to succeed in the street food business, you must be prepared to work hard and
have a skill. You have to struggle a bit. After a few years, you will have a better life, work less, earn a bit more. You can see how your finances are getting better all the time.”
2. Location
2.1. Economic Aspects
The main determining factor for the location of street traders is not necessarily the distance
between home and work but the location, which is mainly dependent upon a space with the
greatest concentration of people and other economic activities (Ayeh et al., 2011). Only a few
(4.5% in Tangerang; 1.0% in Hat Yai) place themselves in front of their house, as seen in Table
6‐7. Although the survey found that the majority of street food vendors in Tangerang
travelled for more than 30 minutes to reach their workplace, most of these vendors operated
daily from the same place.
Most of the vendors choose the sidewalks and streets as these locations as they have a high
frequency of potential customers. Access to customers for most vendors was the main reason
for choosing the locations. Vendors require space that will allow ease of visitors to the stalls
and thus, the visibility will increase the sales. Yankson’s study of Accra, Ghana (2000) stated
that customer attraction, availability of access roads, and plots allocated by the municipal
authority were the factor that most influenced site selection. As noted by Cohen (2000),
location is the ‘be‐all and end‐all’ of street food vending.

132
Table 6‐7. The location of street food vendors’ trading activities (in percentage)
The location Tangerang n = 200
Hat Yai n = 96
Street side 27.5 18.8
Sidewalks 18.0 16.7
In front of a store 17.5 14.6
Empty lot 7.5 12.5
Government market store 3.5 24.0
Parking lots 13.5 8.3
In front of their house 4.5 1.0
Others 8.0 4.2
Total 100.0 100.0 Source: Field work conducted 2017‐2018; own compilation
The results of Suharto’s study (2004) in the Bandung Metropolitan Region in Indonesia show
that although street vendors were widespread in many different places, their locations always
reflected their reliance on economic activities either located on or affected by the street. A
narrative of one of the interviewed women street food vendors, Ibu Ria (Figure 6‐1), who runs
her business on the sidewalk near crowded transport junctions illustrates these findings:
“I have sold street food for more than 20 years, but I have been here five years ago. I settled in this workplace spontaneously without any official allocation. This place is very strategic,
it's never quiet even at night. As you can see, the time was 11 pm, there were still many customers seeking the food. This area is the place for workers to get food at night. If there are no customers, I won't stay here. I’d moved elsewhere since a long time ago. In here, I
have never had to fight for space with other vendors because all the vendors who trade here have their own space. I commuted everyday with my son from our house by motorcycle. I and
my son rode into the workplace from my house about 20 minutes. With the help by my son, I cooked and served up tasty fried rice and fried noodles to hungry workers each day by
around 6 pm and finished on till 1 am in the night. When my customers come for dinner, I know them, and I know without asking what they like and what they want. It's a small thing,
but believe me, it makes your customers feel comfortable, and it's why they keep coming back. I will not move anywhere else but sell in here because this is where our crowd is, and I will
continue to stay as long as there is demand.”
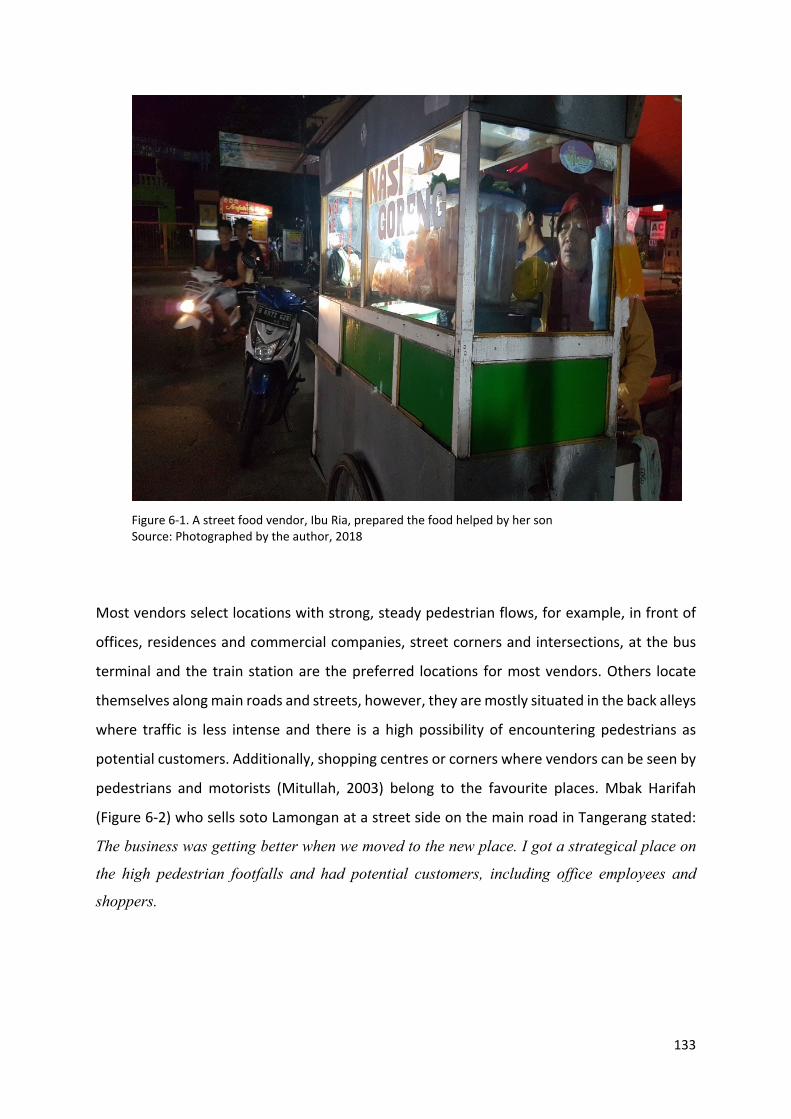
133
Figure 6‐1. A street food vendor, Ibu Ria, prepared the food helped by her son Source: Photographed by the author, 2018
Most vendors select locations with strong, steady pedestrian flows, for example, in front of
offices, residences and commercial companies, street corners and intersections, at the bus
terminal and the train station are the preferred locations for most vendors. Others locate
themselves along main roads and streets, however, they are mostly situated in the back alleys
where traffic is less intense and there is a high possibility of encountering pedestrians as
potential customers. Additionally, shopping centres or corners where vendors can be seen by
pedestrians and motorists (Mitullah, 2003) belong to the favourite places. Mbak Harifah
(Figure 6‐2) who sells soto Lamongan at a street side on the main road in Tangerang stated:
The business was getting better when we moved to the new place. I got a strategical place on
the high pedestrian footfalls and had potential customers, including office employees and
shoppers.

134
Figure 6‐2. A street food vendor, Mbak Harifah, sat next to her food cart Source: Photographed by the author, 2018
Some, however, are compelled to operate from a less favourite location as their current
spaces were the only spaces available for them. From their side, the vendors avoid selling in
places in close proximity to landowners who offer similar products. For instance, one of the
food franchises which is located in the Kelapa Dua street, Tangerang asked vendors to not sell
food in front of their building. In view of these obstacles, it is not surprising that the majority
of vendors in Tangerang and Hat Yai do not have a permanent place to sell their food (Table
6‐7). Thus, they cannot retain regular customers. In the instance where vendors are forced to
relocate, then location becomes a key constraint. This is because, they lose relationships with
their customers and may have to operate from locations that limit access to potential
customers, reducing distribution and sales.
The luckier ones are those who can operate on sidewalks and roadside around shopping or
market areas, such as Tangerang city mall (Figure 6‐3), Bale Kota mall, Pasar Lama market in
Tangerang or Lee Garden Plaza, Diana shopping mall, Kim Yong market in Hat Yai (Figure 6‐4).
Vendors usually operate from the early morning until noon in the market areas, while in the
shopping centers, vendors sell from noon until late at night. The first and most obvious reason
why vendors trade at shopping and marketplaces is these are frequented by shopping visitors.
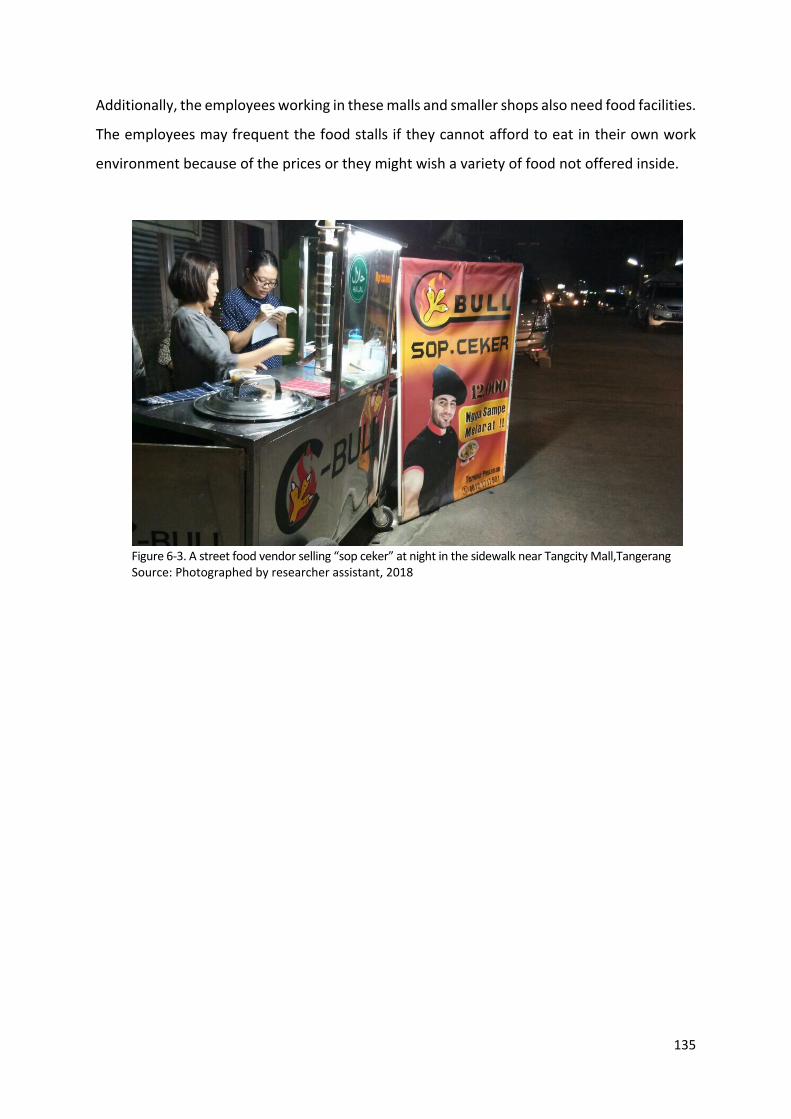
135
Additionally, the employees working in these malls and smaller shops also need food facilities.
The employees may frequent the food stalls if they cannot afford to eat in their own work
environment because of the prices or they might wish a variety of food not offered inside.
Figure 6‐3. A street food vendor selling “sop ceker” at night in the sidewalk near Tangcity Mall,Tangerang Source: Photographed by researcher assistant, 2018
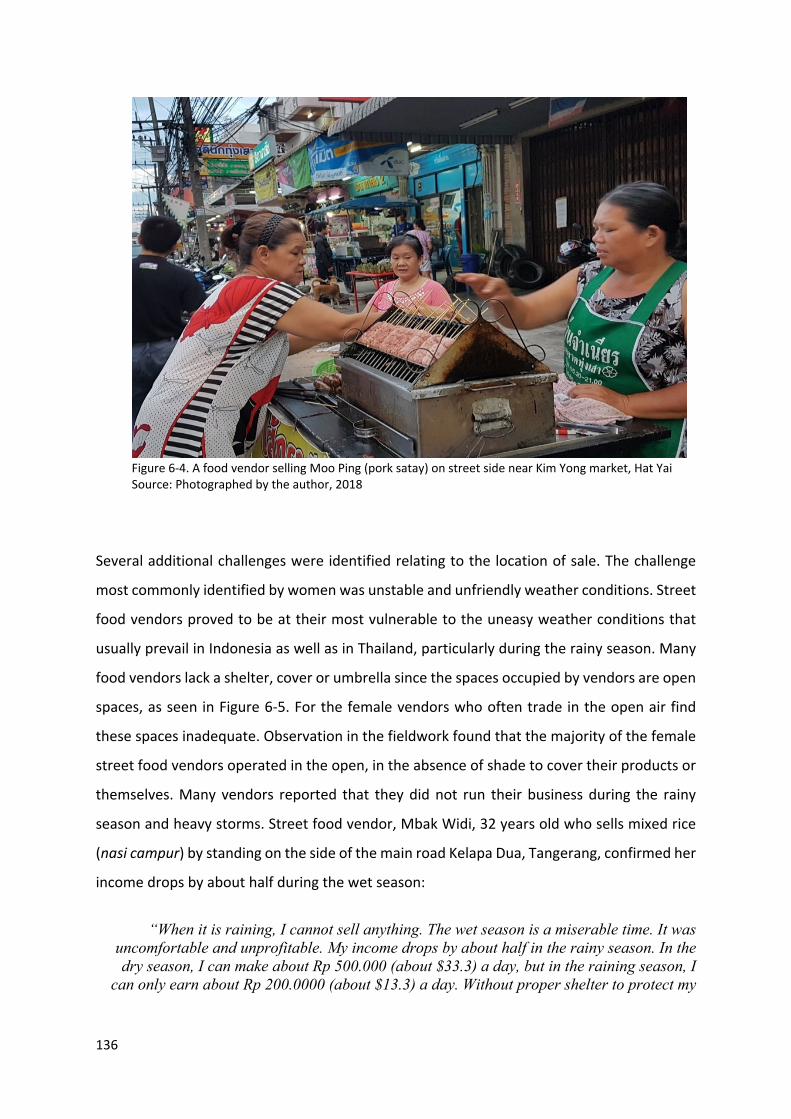
136
Figure 6‐4. A food vendor selling Moo Ping (pork satay) on street side near Kim Yong market, Hat Yai Source: Photographed by the author, 2018
Several additional challenges were identified relating to the location of sale. The challenge
most commonly identified by women was unstable and unfriendly weather conditions. Street
food vendors proved to be at their most vulnerable to the uneasy weather conditions that
usually prevail in Indonesia as well as in Thailand, particularly during the rainy season. Many
food vendors lack a shelter, cover or umbrella since the spaces occupied by vendors are open
spaces, as seen in Figure 6‐5. For the female vendors who often trade in the open air find
these spaces inadequate. Observation in the fieldwork found that the majority of the female
street food vendors operated in the open, in the absence of shade to cover their products or
themselves. Many vendors reported that they did not run their business during the rainy
season and heavy storms. Street food vendor, Mbak Widi, 32 years old who sells mixed rice
(nasi campur) by standing on the side of the main road Kelapa Dua, Tangerang, confirmed her
income drops by about half during the wet season:
“When it is raining, I cannot sell anything. The wet season is a miserable time. It was
uncomfortable and unprofitable. My income drops by about half in the rainy season. In the dry season, I can make about Rp 500.000 (about $33.3) a day, but in the raining season, I
can only earn about Rp 200.0000 (about $13.3) a day. Without proper shelter to protect my
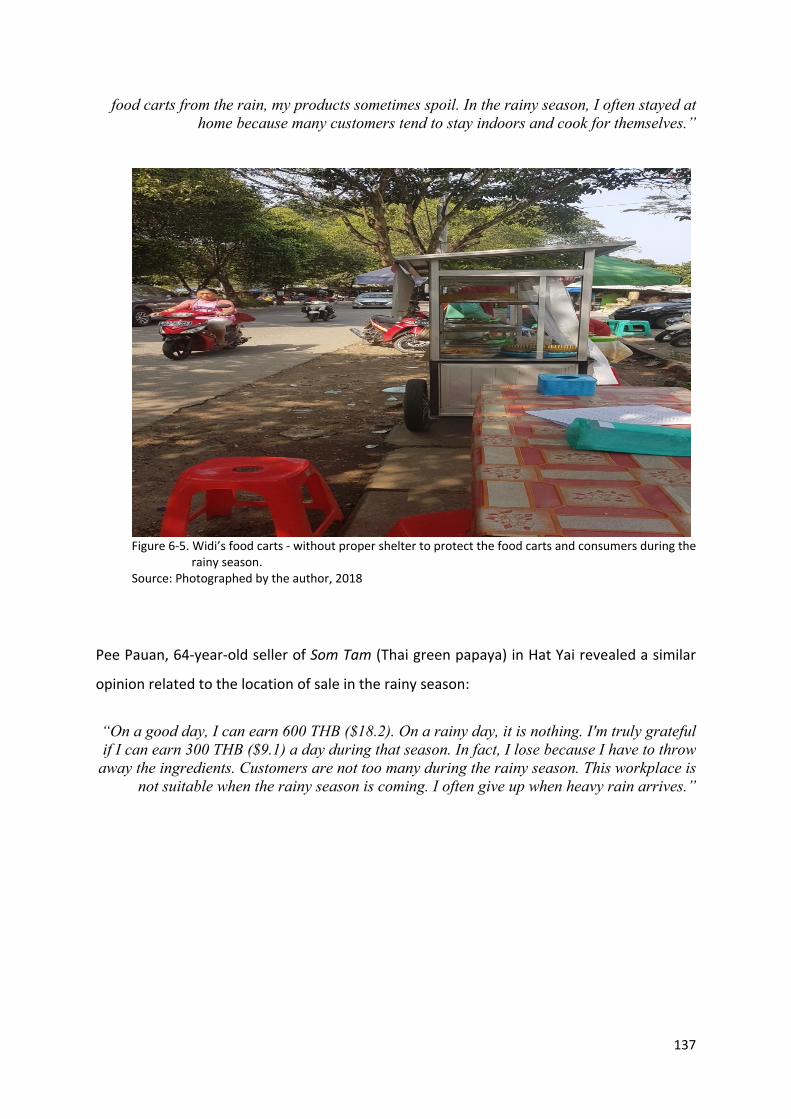
137
food carts from the rain, my products sometimes spoil. In the rainy season, I often stayed at home because many customers tend to stay indoors and cook for themselves.”
Figure 6‐5. Widi’s food carts ‐ without proper shelter to protect the food carts and consumers during the
rainy season. Source: Photographed by the author, 2018
Pee Pauan, 64‐year‐old seller of Som Tam (Thai green papaya) in Hat Yai revealed a similar
opinion related to the location of sale in the rainy season:
“On a good day, I can earn 600 THB ($18.2). On a rainy day, it is nothing. I'm truly grateful if I can earn 300 THB ($9.1) a day during that season. In fact, I lose because I have to throw
away the ingredients. Customers are not too many during the rainy season. This workplace is not suitable when the rainy season is coming. I often give up when heavy rain arrives.”
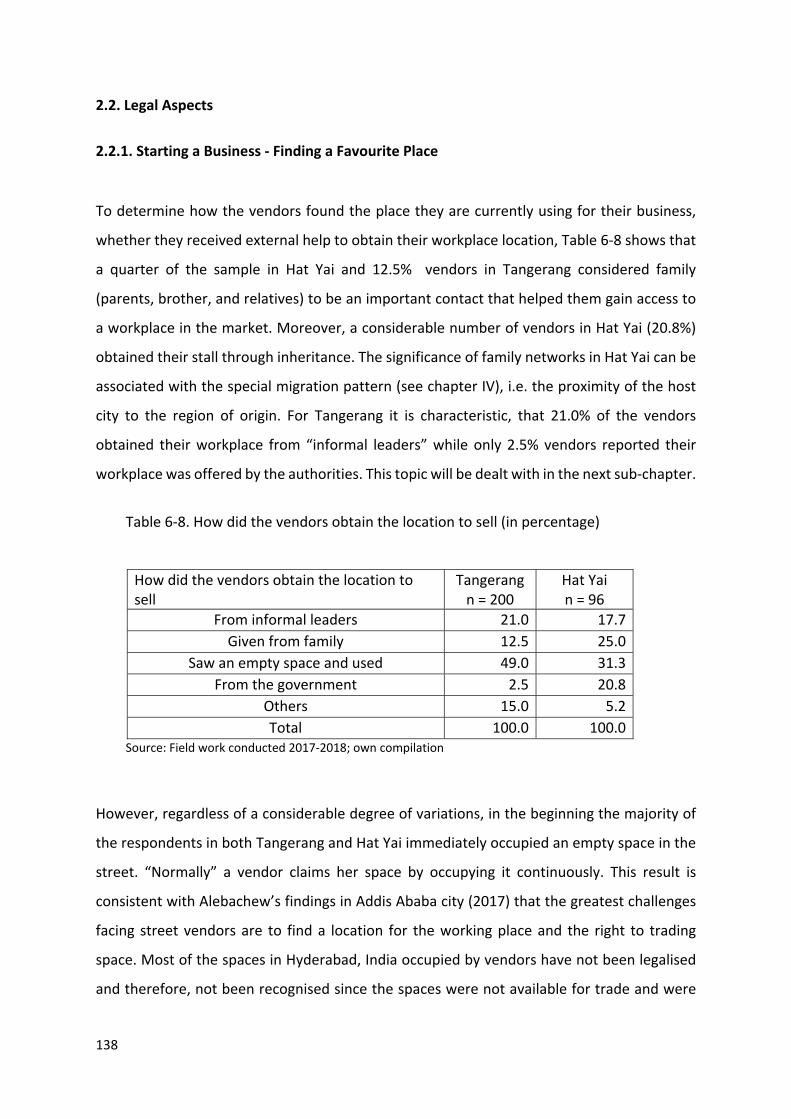
138
2.2. Legal Aspects
2.2.1. Starting a Business ‐ Finding a Favourite Place
To determine how the vendors found the place they are currently using for their business,
whether they received external help to obtain their workplace location, Table 6‐8 shows that
a quarter of the sample in Hat Yai and 12.5% vendors in Tangerang considered family
(parents, brother, and relatives) to be an important contact that helped them gain access to
a workplace in the market. Moreover, a considerable number of vendors in Hat Yai (20.8%)
obtained their stall through inheritance. The significance of family networks in Hat Yai can be
associated with the special migration pattern (see chapter IV), i.e. the proximity of the host
city to the region of origin. For Tangerang it is characteristic, that 21.0% of the vendors
obtained their workplace from “informal leaders” while only 2.5% vendors reported their
workplace was offered by the authorities. This topic will be dealt with in the next sub‐chapter.
Table 6‐8. How did the vendors obtain the location to sell (in percentage)
How did the vendors obtain the location to sell
Tangerang n = 200
Hat Yai n = 96
From informal leaders 21.0 17.7
Given from family 12.5 25.0
Saw an empty space and used 49.0 31.3
From the government 2.5 20.8
Others 15.0 5.2
Total 100.0 100.0 Source: Field work conducted 2017‐2018; own compilation
However, regardless of a considerable degree of variations, in the beginning the majority of
the respondents in both Tangerang and Hat Yai immediately occupied an empty space in the
street. “Normally” a vendor claims her space by occupying it continuously. This result is
consistent with Alebachew’s findings in Addis Ababa city (2017) that the greatest challenges
facing street vendors are to find a location for the working place and the right to trading
space. Most of the spaces in Hyderabad, India occupied by vendors have not been legalised
and therefore, not been recognised since the spaces were not available for trade and were
139
not allocated by the local authorities (Begari, 2017). In cases where the vendors are allowed
to operate, the spaces are considered temporary and eviction occurs at the will of urban
authorities (Alebachew, 2017). In this study, concerning the security of the vendors’ current
locations, the situations in the two cities have been found to differ considerably.
2.2.2. Squeezed between Landowners, Local Authorities and “Informal Leaders”: The
Current Situation 2.2.2.1. Tangerang
Even if most of the vendors started as squatters, the overwhelming majority in Tangerang
have to pay various taxes and fees – among which the rent for space/table, tax and so‐called
security fees are the most prominent. The vendors pay fees and levies to stay on the
pavements or vacant lots and to maintain their locations. The study notes that the majority
of taxes and fees are paid to three sources ‐ officers from the city administration, land or
building owners and thugs.
As the study revealed, many vendors operate their business in front of buildings or houses.
The vendors who occupy the pavement next to a house or a building can run their business,
as long as the owner grants permission for their land to be used by vendors. In most of the
cases a fee is paid to the owners of the houses/buildings to use their space and the fee rate
has to be mutually accepted between the vendors and the landowners. Some vendors also
pay money to local shopkeepers to store their food carts since they do not have access to a
safe space. There is no regulation or criteria in determining the rate. In general, the landowner
will request the higher fees to the vendors if their building/house is located in a strategic
location. During the in‐depth interviews with the participants, it was found that many
house/building owners strongly understood that their house/building is strategically located
and therefore, wished for a higher fee, even when the vendor used the space on the far side
of the pavement from the house.
140
Ms. Wati, 31, who rents the space in front of one of the houses, said:
“I pay Rp 300,000 ($21.4) a month to rent this space to the landowner. The landowner provides water and light. Before I leave, I wash down my food cart so that it’s clean and I put
the food cart near the house of the landowner after I finish the business.”
One of the respondents during the in‐depth interview, Ibu Murni in Tangerang, who has been
a street food vendor since 2011 indicated that a place with more profit attracts her. The
location where she currently trades is right in front of the traditional market (Kelapa Dua
market, Figure 6‐6).
“Before you start this business, consider precisely where your business will be located. I found this location after I searched in many places. A good location will generate more
profit. For this space, I paid Rp 400,000 ($28.5) per month in the beginning I started the business. Nowadays, I have to pay more (Rp 500,000 or $35.7). But it's still fine for me. The
other vendors should pay Rp 750,000 ($53.6) per month. I get a special price from the landowner because I know him well.”

141
Figure 6‐6. Bu Murni in front of her food stall and her customer Source: Photographed by the author, 2018
Based on a mutual agreement signed by both parties (vendors and private landowners)
vendors can use the sites for a stated period of time. This can be renewed upon expiry until
the landowner decides to terminate the contract.
When the contracts are recalled, a period of insecurity may ensue. This is supported by the
participant, Mbak Harifah, who asserted that:
“…when I started a business, I did not have the permanent location. I moved from one place to another. After two years, around mid-2001, I was given the permanent place in Bintaro
sector 7 (South Jakarta) by a local businessperson. Unfortunately, after four years traded in that location, I should move away and find another location. By early 2010, for no apparent
reason, the shopkeeper requested to move out from his land. At that time, I was confused about the location for my business. With my brother's help, I searched for a new location.
Finally, we found the empty place that was not too far from the previous place. Notwithstanding, the new location was not strategic so there were not many customers
coming as before…”
During the fieldworks, it was found that in some strategic locations, the street food vendors
did not pay fees and levies to the regular owners but to the so‐called “local leaders”, which
can indeed be named local thugs. The thugs pretend to be ‘owners’ of a strategic location
within the public space, particularly on the sidewalks or vacant lots. So, the use of such a

142
location is subject to their consent. The respondents stated that they have been continuously
disturbed by thugs to pay the fees and levies and out of fear, they concede. If vendors fail to
pay fees and levies, the thugs come, they ask for payment of fees (they call it “biaya
keamanan”) again, and when the vendors cannot pay the fees, they ask the vendors to move
out.
The so‐called market committees turned out to be another recipient of fees and taxes. The
market commissions are semi‐official boards composed of a number of people from the
community development council (Lembaga Musyawarah Kelurahan). They are closely
associated with the public order agency officers and the local thugs as well. As there is no
legal justification for a market committee to levy fees and taxes, the fees bear the name of a
“security charge” or a “cleaning fee”. The study found the monthly “security fees” rates for
the vendors ranged between Rp 50,000 ($3.5) and Rp. 100,000 ($7.1), depending on the place.
Of the few women vendors who reported paying a “cleaning fee”, most paid between Rp
60,000 ($4.3) or less per month. However, many vendors complained that even though they
pay a “cleaning fee”, the space is not cleaned and they themselves have to make efforts to
keep the space clean.
As a rent for the space the vendors in Tangerang pay between Rp 100,000 ($7.1) and Rp
500,000 ($35.7) per month to the market associations or the thugs, depending on the location
and the size of the stall. According to one of the vendors, Ibu Ria, the rates have increased in
the last years.
“I have been paying illegal levies to a market association. Previously I had to pay Rp 150,000 ($10.7) a month and it was increased to Rp 180,000 ($12.8) last year. These
payments are such as protection money payments. By paying the contributions, I feel safe to trade here.”
The vendors are completely aware that the fees are illegal and that the market committees
are closely aligned to local thugs, as complained by Ibu Harti.
143
“I should pay a variety of fees and levies. I pay a form of rent through daily fees levied in exchange for use of public space to a chairperson in charge of the market. I also pay
cleaning charges and security charges to the thugs. I pay Rp 500,000 ($35.7) a month to rent space to a group that calls itself Kelapa Dua Market Association. The Kelapa Dua market
vendor association represents the interests of all vendors in Kelapa Dua market and they are responsible for the overall management of that Kelapa Dua's area (e.g., allocation of space,
cleanliness, etc.). I have been paying illegal levies, which are claimed to be security and cleaning fee to so-called preman (the thugs) who regularly trawl the market since I first set
up my warung. I pay Rp 100,000 ($7.1) a month.”
Of all the vendors surveyed, the majority understand that even though they pay these bribes,
it does not guarantee any protection against civil authorities taking action against them, such
as eviction of the vendor or confiscation of goods sold. The thugs do not help against the
authorities’ actions, and reversely, the authorities do not help against the thugs. Instead after
an eviction they take the initiative to assign the working space to new‐coming traders.
Many vendors stated that the local authorities should be aware of such illegal levies but in
most cases, they never touch the thugs. Rather than receiving assistance and protection from
the local government, the vendors are exploited and evicted. Ibu Rusmini is a 58‐year‐old
woman who sells the snacks in front of a school shared the government's impartiality with
them.
“…the government should protect its citizens. But what happened. I was evicted this morning. Many of the goods were taken by the police municipality. Even though it was only a few days
ago, I gave my vote in the election. I chose the elected mayor in the hope that he could pay attention to our livelihoods, but what they did…”
Vendors have the natural propensity to assemble at special places because the customers find
it convenient to purchase from them and here, they find a ‘natural market’ for their foods
(Bhowmik, 2005). Hence, if these places are allotted to the vendors along with proper
regulations in the form of space demarcations and so forth, then vending will not be a
problem. However, the key issue is that the local governments are not willing to understand
the main economic rationale. They simply do not consider informal trading as an important
factor in the economy. Accordingly, most of the spaces occupied by vendors – regardless if

144
they are paying rents or not ‐ are considered illegal by local authorities since they have not
been set aside for trade.
The interview with Mbak Harifah reveals that the space question consists of a set of
multidimensional, often intertwined issues: Already mentioned Harifah living in a cottage in
Tangerang is a hard‐working businesswoman, feeds a family, pays the bills and educates her
children. She has no help from anyone and no husband to lean on. Before starting her own
business, she helped her husband who was a street food vendor. When they divorced, Harifah
started her own business. Harifah said she moved to her present workplace four years ago
after 15 years running her business in Jakarta. She moved because her last place was evicted.
The new place was obtained from her customer's information.
"When I was confused to find a new location, one of my customers informed me that in her area there is an empty place for selling. I then asked my brother to conduct a survey in that
whole area. The customer also informed that there is no one selling soto lamongan in the area."
After surveying several places, her brother finally found the location. “The location where I
vend now is a vacant space and hence, I found it the right place for me to start.” The land
(actually) belongs to the government. Last year, Harifah heard from local residents that her
place will be evicted by the government for road expansion. Before this location is dismantled
by the government, she will still use this location for her business. Harifah pays a rent of Rp
200,000 ($14.2) per month to the neighborhood association (Ketua RT) for having permission
to vend on their location. Frankly, Ketua RT is not a landowner, but all the street vendors in
this area are required to pay a rent to it. Almost Rp 100,000 ($7.1) out of Harifah pocket is
given away to local thugs per month. This explains the probable role played by such
institutions in a life of street food vendors. Harifah also spends Rp 200,000 ($14.2) per month
to leave the cart in one of the residents' houses and Rp 400,000 ($28.5) to the one who pushes
the cart back and forth.
145
Since most of the vendors are not legally recognized, some of them choose a place where
they are able to hide from local authorities when they come to arrest them or to confiscate
their products. Many street food vendors were likely to trade at a place which was not far
from their home, in order to avoid eviction from the city authorities. By trading near the area,
they live in, the vendors can easily spare from city authorities because the vendors may argue
that they are citizens in the area and have the right to sell in their area. In addition, some
vendors received support from local leaders to vend on their location. Again, for many food
vendors in the streets, it appeared that trading near the house is one of the best choices
compared on the street side or sidewalks. One respondent, Ibu Wartiyem reported:
“I have been here for two years ago. Previously, I traded in front of the house. I then asked
permission to RT (neighborhood association) to trade near the entrance of the residence. The RT leader allowed me to occupy the workspace, and I paid the rent for working place Rp
50.000 ($3.6) a month.”
Concerning the benefits of trading near at home rather than on the streets (Figure 6‐7),
another vendor, Ibu Lina, 51 years old, the owner of food stall “Nasi Uduk” said:
“…I never pay the rent. My auntie is the owner of business premises this place. I’m not
required to pay the rent. In spite of that, sometimes, I gave money to the kiosk tenant to help them for paying the electricity. But it is very rare. I don’t need to pay for other charges, such as security and cleaning. I have never received any tax charges for my business. No one has
come yet to ask me for paying the taxes.”

146
Figure 6‐7. Lina's food cart is located in front of her aunt's house. Source: Photographed by the author, 2018
This study reveals that the lack of publicly allotted vending space is at the core of most of the
problems. This includes harassment by formal shops and housing societies and ensuing
evictions by local authorities or – instead – the burden of bribes. Even if sometimes the local
authorities of Tangerang prepared a vending space for vendors, unfortunately, the working
place was not occupied by vendors, but taken by acquaintances or relatives of officials and
formal business operators. This is due to the lack of transparency in the distribution of the
working places and the high costs required to be paid by vendors.
2.2.2.2. Hat Yai
In Hat Yai, the survey indicated that most of the street food vendors still operate from the
streets and sidewalks, at 18.8% and 16.7%, respectively. Approximately 14.6% of the vendors
are located in front of a store whilst only 1.0% chose to locate their stall near their place of
residence (Table 6‐7). Like in Tangerang, in most cases, the fees were paid to the shop owners

147
from whose frontage the street food vendor was operating. To do this, the vendors establish
their own individual rental agreements with landowners, negotiate the usage of these spaces,
and compensate owners before they set up a food cart/stall. Monthly, the vendors pay an
average of about 2,500 ($83.3) to 4,000 THB ($133.3) in fees and levies. Those costs collected
by private owners normally include electricity and water charges. For example, one street
food vendor in the bus terminal of Hat Yai, Pee Umi Kasoem, a Thai deep‐fried chicken seller,
explained:
“I have to pay the house owner 8,000 baht for vending one month, including public utilities
(water and electricity). I share the fees with my cousin. I trade here in the morning from 5:30 till noon. In the afternoon until late night, my cousin takes over space. I am so lucky that I
can trade here (in front of the bus terminal). Some vendors are even charged more for vending here.”
However, different from Tangerang, about 24.0% of the total street food vendors operate in
a government market store (Table 6‐7), in Hat Yai, the district administration declares which
zones are open for business and which are not. This means that street food vendors have to
operate in designated areas, at designated times. Next, the local authority decides which
vendors can use how much of the space and at what time of the day. Each area of business,
for example at Sri Trang food market and Kim Yong market where the fieldwork was carried
out, has its own schedules, as well as a limited number of slots. Sri Trang market is situated
near the Prince Songkla University, which offers a morning and an evening shift to vendors,
and this who want to sell the entire day have to pay double the fee. Kim Yong market, located
in Supasarnrangsan Road, operates by allowing wet market to trade during the early morning
hours, whilst street food vendors operate in the evening.
Due to the fact that the Sri Tang market is managed by the local government, the traders are
requested to pay monthly rentals. The rental fee is relatively low compared to the fee for
renting space owned by a private landlord. The vendors paid the district administration
around 1,000 THB ($33.3) to rent the space. The fee amount is at the discretion of the district
officials, but the money goes to the district administration. There are hundreds of vendors in
the market managing their businesses selling almost the same thing ‐ Thai foods. These
148
vendors are divided into two groups. The first group of vendors open their food cart from
05:00 am to 10:00 am. The second group of vendors sell their products in the evening, from
5:00 pm until late at night. When asked whether there has been a conflict over space
between the two groups of vendors, almost all vendors collectively agreed that conflicts over
space rarely occur because vendors know each other well, having worked alongside each
other for a long time.
Unlike the market in Sri Trang where the whole area is managed by the district, in Kim Yong
market, there are many spaces arranged privately since the demand for space in this area is
very high. Kim Yong market is located in a strategic area ‐ as a central business district and
popular tourist spot. The market opens every day from early in the morning to the afternoon.
Kim Yong market is a prime destination for food lovers, seeking authentic Thai cuisine to
Chinese and Malay dishes. Unsurprisingly, a lot of street food vendors who open their stalls
in Kim Yong market either rent the space provided by local governments or pay to private
owners.
In many locations in Kim Yong market (Figure 6‐8), for instance, in front of the local shopping
mall (Lee Garden Plaza), vendors pay market price for their stall/cart. The price of each stall
depends on its size and location in the market. There is a gap between the fee set by the local
administration and the market rent. The rent is significantly higher than the fee. Some
respondents said that they pay rent around 8,000 ($266.7) to 15,000 THB ($500.0) monthly –
ten times more than the registered vendor’s fee. Those who pay the fee to private owner do
not register with the district but face no problems from the city administration, probably
because the owner has already negotiated with them. Such arrangements are not official but
are universally recognized.

149
Figure 6‐8. Kim Yong market: The market with the most products Source: Photographed by the author, 2018
The transition from chaotic allotment into a more regulated system has started in the early
2000s. The local government in Hat Yai was putting up a formal market infrastructure across
the city so that street vendors should be able to trade in an orderly, safe and good
environment, including Sritrang market, Santisuk market and the Klonghae floating market.
Places in the markets were “offered” to street vendors who previously had sold on the side
of the road or sidewalk. This step seems to have been free from an atmosphere of disregard
and corruption, that has been typical for the authorities’ activities elsewhere, for instance in
Tangerang. However, interviews with several vendors in the government market store
revealed that this step did not evolve without frictions, as it was not based on mutual
agreements. Instead, the municipality of Hat Yai relocated the street vendors, including
vendors operating from the side of the streets to the commercial centres. Many vendors said
that in the beginning they did not want to move because they were afraid that the customers
would not visit their stall. Many of those who were forced to move said that initially, their
income declined when they moved to a new place. They slowly gained new customers and
their income slightly increased. At present, they feel comfortable and safe trading on the
market provided by the local government, as seen in the Sritrang market (Figure 6‐9).

150
Figure 6‐9. Activities in the morning of street food vendors at Sritrang market, Hat Yai Source: Photographed by the author, 2018
3. Access to Facilities
Vendors have varying reasons for their choice of a trading location. Access to basic services in
the street markets is not their primary incentive, but does play a significant role, once a place
has been fixed. Many vendors experience several problems with services and infrastructure
such as water, electricity, toilet facilities and waste removal. In the survey, it was found that
43.0% of the total vendors in Tangerang had free access to water at their place of work, 44.0%
had free access to a toilet while only 12.0% stated that they had free access to electricity
(Table 6‐9). More than one third (37.0%) of the vendors reportedly had free access to rubbish
removal. In Hat Yai, the majority (72.9%) of the vendors had free access to a toilet, 67.7% had
free access to garbage collection and more than half (57.3%) of the vendors had free access
to running water. Another 16.7% vendors reported that they had free access to electricity.

151
Table 6‐9. Access to the basic services (in percentage)
Access Tangerang Hat Yai
Clean water n = 200 n = 96
Free access 43.0 57.3
Paid access 49.5 32.3
Not required 7.5 10.4
Total 100.0 100.0
Toilet n = 200 n = 96
Free access 44.0 72.9
Paid access 11.0 22.9
Not required 45.0 4.2
Total 100.0 100.0
Electricity n = 200 n = 96
Free access 12.0 16.7
Paid access 67.0 74.0
Not required 21.0 9.4
Total 100.0 100.0
Garbage collection n = 200 n = 96
Free access 37.0 67.7
Paid access 55.0 26.0
Not required 8.0 6.3
Total 100.0 100.0 Source: Field work conducted 2017‐2018; own compilation
Vendors without a proper workplace were able to pay for access to facilities such as water,
toilets, electricity and garbage collection. Many vendors used public toilets in the locality. In
addition, they buy drinking water for which they pay daily. Those who have their place of
accommodation nearby, visit their homes for drinking water and to use the toilet. For
electricity facility, vendors either use lights operated through batteries or depend on street
lights. Depending on their location of workplace, quite a few of the vendors were using a
rented electricity connection.
When asked which access facilities are the most desirable from the local government, many
of the vendors stated that their number one request would be of the provision of electricity

152
and water supply. At present, the majority of vendors do not have direct electricity access for
lighting at night. Since many vendors start their business in the evening (from 5 pm until 12
am midnight), electricity is essential for the street food vendors. The vendors manage their
demand for electricity by borrowing from the nearby shops and/or rechargeable light.
Majority of the vendors receive electricity supply from the nearest big shop by paying a small
fee per month to the owner of the shop. A small chargeable light is now a popular source of
electricity and is widely used by vendors, particularly those conducting business at night.
Many vendors reported that they required water for the daily operation of their business.
This water is primarily used for cooking, cleaning and drinking by watering down flavored
syrups for beverage sold to the public. Despite the high demand, most vendors transport their
own water to the site. Since most of them commute on the motorcycle, the transportation
of water is very difficult. Unsurprisingly, a small amount of water was available in very small
pails or a few gallons at most of the vending sites, as shown in Figure 6‐10. This water is used
sparingly throughout the day for drinking while dishwater is constantly reused and changed
only once during the day. The implications on health are obvious and the demand for
municipal response in these urban centres is imperative.

153
Figure 6‐10. A simple dishwater uses for cleaning the equipment by Tangerang’s vendor Source: Photographed by the author, 2018
The easier accessibility of toilets in Hat Yai may be associated with the government’s activities
in locating the vendors. However, major hygienic problems are faced by the vendors in
Tangerang as well as in Hat Yai. Local governments in both cities should immediately take
action to find solutions for these problems that affect the health of a huge number of vendors
and consumers. On the other side, vendors should be informed about and sensitized for
hygienic issues. They will have to accept that resources securing hygiene and hence health for
their customers cannot be obtained for free.
4. The Financial Impact of Fees and Charges
Among the vendors who answered the question regarding the fees, taxes and levies for the
use of the space, nearly 93.0% of street food vendors in Hat Yai make payments for access to
public space for trading, while over four‐fifths of Tangerang’s street food vendors in the
sample pay for selling space (Table 6‐10). A little less than 8.0% of vendors in Hat Yai stated
that they do not need to pay any fee due as they are the owner of such space. Unlike Hat Yai,

154
the majority of vendors in Tangerang who did nothing to access vending space declared that
they operate their business from a space owned by their family.
Table 6‐10. Payment of fees, taxes or levies for space in Tangerang and Hat Yai (in percentage)
Payment of fees, taxes or levies
Tangerang n=200
Hat Yai n=96
Yes 87.0 92.7
No 13.0 7.3
Total 100.0 100.0 Source: Field work conducted 2017‐2018; own compilation
Payment for the space is just one facet in the ensemble of fees and charges described above.
Table 6‐10 shows the percentage of vendors that pay varying types of fees, taxes and levies
to operate their business in Tangerang and Hat Yai. Most importantly, the percentage of
vendors in Hat Yai that pay rent for space (76.0%) was much higher than their counterparts
in Tangerang (53.5%), as seen in Table 6‐11. On the contrary, the street food vendors in
Tangerang were more likely to pay “cleaning charges” and other “public” charges than their
counterparts in Hat Yai. Moreover, twice as many of the respondents in Hat Yai (14.6%) paid
a municipal tax compared to 7.0% of traders in Tangerang. Not surprisingly, illegal retribution
is more prevalent in Tangerang where around 15.5% of the total traders paid these charges
compared to only 4.2% in Hat Yai. The percentage increases sharply, when contributions like
“cleaning charges” and “security charges” are included, which during the in‐depth interviews
with the respondents in the majority of cases turned out to be disguised names for illegal
levies.
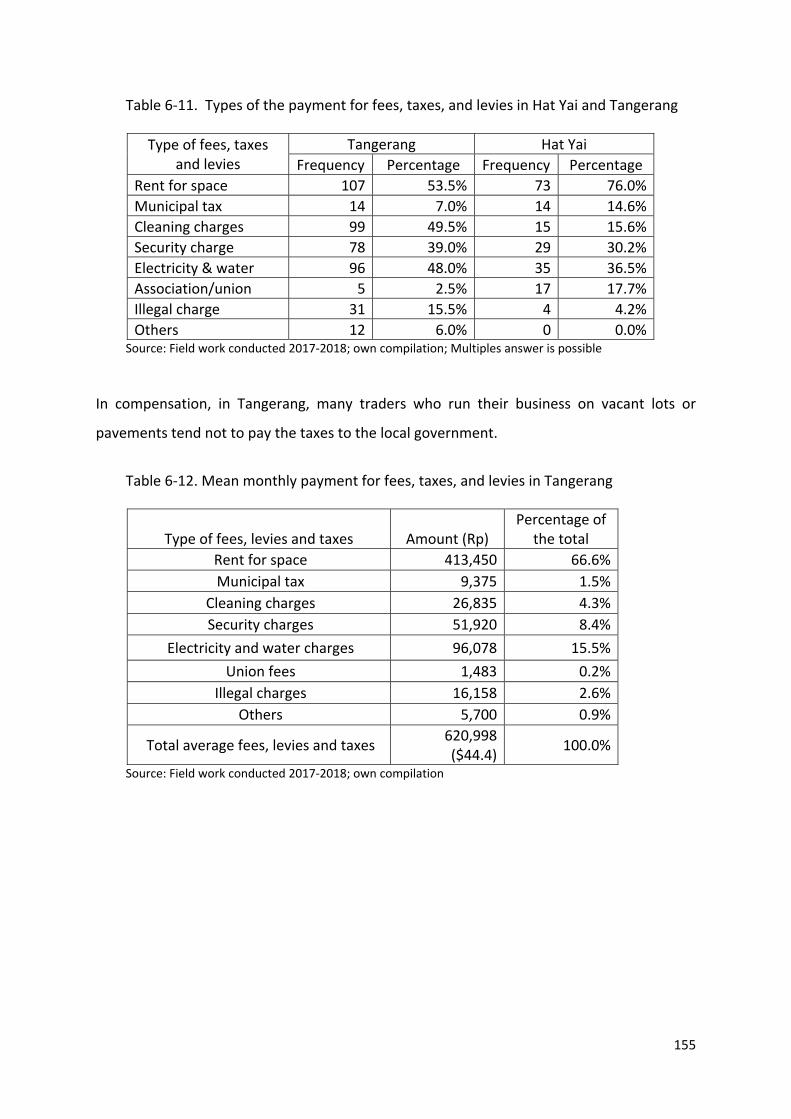
155
Table 6‐11. Types of the payment for fees, taxes, and levies in Hat Yai and Tangerang Type of fees, taxes
and levies Tangerang Hat Yai
Frequency Percentage Frequency Percentage
Rent for space 107 53.5% 73 76.0%
Municipal tax 14 7.0% 14 14.6%
Cleaning charges 99 49.5% 15 15.6%
Security charge 78 39.0% 29 30.2%
Electricity & water 96 48.0% 35 36.5%
Association/union 5 2.5% 17 17.7%
Illegal charge 31 15.5% 4 4.2%
Others 12 6.0% 0 0.0% Source: Field work conducted 2017‐2018; own compilation; Multiples answer is possible
In compensation, in Tangerang, many traders who run their business on vacant lots or
pavements tend not to pay the taxes to the local government.
Table 6‐12. Mean monthly payment for fees, taxes, and levies in Tangerang
Type of fees, levies and taxes Amount (Rp) Percentage of
the total
Rent for space 413,450 66.6%
Municipal tax 9,375 1.5%
Cleaning charges 26,835 4.3%
Security charges 51,920 8.4%
Electricity and water charges 96,078 15.5%
Union fees 1,483 0.2%
Illegal charges 16,158 2.6%
Others 5,700 0.9%
Total average fees, levies and taxes 620,998 ($44.4)
100.0%
Source: Field work conducted 2017‐2018; own compilation

156
Table 6‐13. Mean monthly payment for fees, taxes, and levies in Hat Yai
Type of fees, levies and taxes Amount (Baht) Percentage of
the total
Rent for space 2,819 86.4%
Municipal tax 61 1.9%
Cleaning charges 15 0.4%
Security charges 81 2.5%
Electricity and water charges 267 8.2%
Union fees 18 0.5%
Illegal charges 4 0.1%
Others ‐ 0.0%
Total average fees, levies and taxes 3,264
($108.8) 100.0%
Source: Field work conducted 2017‐2018; own compilation
To sum up, Hat Yai traders pay twice as much as their counterpart in Tangerang for fees, taxes,
and levies. However, rent and electricity and water charges in Hat Yai are two times more
expensive than in Tangerang. Furthermore, according to the present study (see Chapter VII),
the average daily income of food vending activities in Hat Yai was two times ($45,24 per day
or $1,131 per month) higher than their counterparts’ in Tangerang ($21,52 per day or $538.0
per month). In this respect, the share made up by taxes and fees is fairly similar in the two
locations, 9.6% of the average total net income per month in Hat Yai, 8.2% in Tangerang,
respectively. The difference may be the price for a higher degree of security in Hat Yai.
5. Summary
Lack of financial resources, lack of secure and stable business locations to conduct their
business, in addition to geographic concentration of street food vendors were the key factors
complained by the interviewees. To obtain loans, support of family members and friends was
again (see previous chapter) crucial to enable the women to start a street food business.
Surprisingly however, this study found out that more than half of the vendors had an initial
capital, which originated from their own savings.

157
Concerning the vending location, the study found that nearly half of the vendors in Tangerang
locate on pavements and pedestrian paths. This is due to the fact, that when starting their
business, the majority of the respondents in both Tangerang and Hat Yai immediately
occupied an empty space in the street. In a majority of cases these locations have not been
legalised since the spaces were not available for trade and were not allocated by the local
authorities.
Especially in Tangerang many spaces are considered temporary and eviction occurs at the will
of urban authorities. Local neighbourhood committees fill the gap and offer “protection” in
exchange for a “fee” to a local thug. No wonder, that the majority of vendors in Tangerang
and Hat Yai do not have a permanent place to sell their food. However, in Hat Yai, a ray of
hope is associated with the activities of the local authorities. Unlike Tangerang, nearly a
quarter of vendors in Hat Yai operate their business in a recently established government
market store, while 35.5% of them still run the business on the street side and sidewalks.
Across the two cities, access to infrastructures, such as access to toilets, garbage collection,
electricity and running water was considered to be one of the pressing problems because
many of the vendors depend on electricity and water to prepare cooked foods. However,
from the observations, most street food vendors are relatively satisfied with infrastructure
conditions. This satisfaction, however, reflects a considerable unawareness of basic hygiene
issues.
During the in‐depth interviews, participants were asked to identify the challenges that affect
their trade. In sum, the key constraints faced by vendors are the lack of social security and
stability in addition to very little access to credit. Moreover, the absence of secure allotted
space for vending was identified to be the paramount issue.

158
CHAPTER VII
Socio‐Economic and Livelihood Conditions of Women Street Food Vendors
Similar to other Asian countries, many people in Indonesia and Thailand migrate to cities and
urban areas in search of better opportunities and jobs. Not all individuals, however, who
migrate to towns can equally reap the benefits by gaining a stable employment. In contrast,
to survive, many people find themselves engaged in the informal economy by, for example,
food vending on the side of the street. Street food vending plays a tremendous role in
supporting a large number of households and providing livelihood opportunities for people
irrespective of gender and age. It also provides an outlet to people seeking seasonal
employment. Chandra et al. (2015) examined the condition of women street vendors in Delhi
and stated that encouraging and organizing street vending activity can and will go a long way
in reducing urban poverty. Since women street food vendors have been emerging as a major
part in this sector activity in the urban areas, therefore street food vending is a way for them
to earn a livelihood and make their way out of poverty. The purpose of this chapter is to
exclusively discuss the impact of street food vending to the socio‐economic lives and
household livelihood conditions of women street food vendors in different areas of
Tangerang, Indonesia and Hat Yai, Thailand.
1. Income Levels of Street Food Vendors
1.1. Average Earnings of Street Food Vendors
Previous research in various developing countries has shown that, like any other informal
sector, street food vending is an important source of income for a household, in spite of its
legal insecurity. Mitullah (2003) in his research in Kenya, Cote D’Ivoire, Ghana, Zimbabwe,
Uganda and South Africa found that the street vending activities provide many opportunities
for urban residents, including a source of income and employment. Findings reported by
159
Hermawati and Runiawati (2017) in Bandung, Indonesia also expressed that the profession of
the street vendor is not only a means to earn a livelihood/to meet basic needs, but it is also
as a strategy and an opportunity for the owners to develop a business of capital and goods.
It is difficult to assess the earnings of street food traders accurately. They vary from day to
day and from month to month. Furthermore, the earning of street food vendors depends on
various factors such as the type of merchandise sold, the place from where they operate, the
volume of trade and terms of trade. However, the overwhelming majority of the respondents
in the two cities (184 in Tangerang and 78 in Hat Yai) ware able and willing to give exact
information about the average net income they obtained from their business. On the basis of
these specifications it has been calculated that enterprises operating in Tangerang had an
average net income of Rp 305,839 per day ($21,5) with a median of Rp 200,000 per day
($14,3), while the daily average net income from food vending activities in Hat Yai was 1,440
baht ($45,2) with a median of 1,000 baht ($33,3). In both cities street food vendors operated
on average 25 days per month. The sum for fees and taxes (see Chapter VI) is not contained
in the net income.
In Indonesia the population is classified into the three categories based on their incomes.
These are high‐class group, middle‐class and low‐class groups of income. The World Bank,
Indonesia Bureau of Statistic, The Economist Intelligence Unit cited by The Deloitte Southeast
Asia (2015) classified the consumer income in Indonesia as a social class proxy into four levels,
namely, 1. Higher income (more than IDR 120 million per annum); 2. Upper middle income
(IDR 60‐120 million per annum); 3. Lower middle income (IDR 36‐60 million per annum); and
4. Lower income (lower than IDR 36 million per annum).
According to the field findings (Table 7‐1), more than half (52.7%) of the families of street
food vendors in Tangerang fall within the lower middle‐income group. More important, only
5% belong to the lowest group.

160
Table 7‐1. Income classification of street food vendors in Tangerang (in percentage)
Types of income Valid % Cumulative %
Valid < Rp 125,000 Lower income 5.4 5.4
Rp 125,000 ‐ Rp 200,000 Lower middle income 52.7 58.1
Rp 200,001 ‐ Rp 350,000 Upper middle income 17.7 75.8
> Rp 350,000 Higher income 24.2 100.0
Total 100.0
Source: Field work conducted 2017‐2018; own compilation; n=184
In Hat Yai, as seen in Table 7‐2, the majority of participants are more likely to have even upper‐
middle socio‐economic status. This dissimilarity is mainly due to the general differences
between the two countries, for in 2011, The World Bank (2011) improved the income
categorization of Thailand from a lower‐middle income economy to an upper‐middle income
economy due to the increasing average income and the decrease of poverty in the population.
Table 7‐2. Income classification of street food vendors in Hat Yai (in percentage)
Types of income Valid (%)
Cumulative (%)
Valid <330 THB Lower income 2.7 2.7
330 THB ‐ 450 THB Lower middle income 5.3 8.0
451 THB ‐ 800 THB Upper middle income 62.7 70.7
> 800 THB Higher income 29.3 100.0
Total 100.0
Source: Field work conducted 2017‐2018; own compilation; n=78 respondents

161
As this category, especially for Indonesia, due to inflation and devaluation processes, are fairly
volatile, an additional standard of comparison has to be set. In Tangerang based on the
Governor of Banten’s Decree, the 2019 minimum wage has been set at Rp 3,841,368 ($274,4)
per month, on a 25‐days‐basis $10,98 accordingly. Consequently, the differences between
street food vendors’ average earnings and formal sector living standards are significant, with
more than two‐thirds of the vendors earning at least two times more than the official
minimum wage earned by formal sector workers (Table 7‐3). The same scenario has been
found in Hat Yai city where the majority (88.4%) of street food vendors earn better than the
income received by the lowest rank of the formal workers (Table 7‐4). The new minimum
wage in Hat Yai based on The Thailand’s Central Wage Committee (2018) is 330 Thai Baht
($9,9} per day, on a 25‐days‐basis accordingly $247,5.
However, in both cities, the differences between the arithmetical average and the median
(the median being considerably lower than the arithmetical average) indicate substantial
differences within the vendors’ group. Although the income of a majority of vendors is located
fairly above the minimum wage line, the present study indicated that the street food sectors
in both study locations have a strongly disproportionate income distribution. In the literature,
a comparable spread in the group of the vendors is sometimes noted (Setia; 2008; Kusakabe
2006; Fixy, 2004), however, a detailed examination is mostly missing. As a first step, in this
study, the Gini‐coefficient (Table 7‐3 and Table 7‐4) as the primary tool to analyse social
inequality is being used. The range of this coefficient goes from zero to one, with zero
indicating perfect equality and one perfect inequality. Normally, a Gini coefficient below 0.2
indicates an equitable income distribution, 0.2‐0.3 a fairly equitable; 0.4 symbolizes the
international inequality threshold alert line.
The Gini coefficient based on the vendors’ net incomes in Hat Yai stood at 0.363, briefly below
the alert line. These results almost exactly conform with Thailand’s national income inequality
value of 0.365 on the Gini index (The World Bank, 2019b). In Tangerang, the Gini coefficient
based on the net income of the vendors is placed at 0.442, a figure higher than the national
Gini coefficient (0.381). In the case of Tangerang, the relatively high Gini coefficient may be

162
attributed to differences in working experience (specifically, the duration in running the
business) and working capital.

163
Table 7‐3. Gini coefficient of the street food vendors in Tangerang
No Group of income
Number of vendors
Average income per capita/daily
% cumulative of vendors
(Xk)
Total income
% cumulative of income
(Yk) Xk‐Xk‐1 Yk+Yk‐1
(Xk‐Xk‐1)*(Yk+Yk‐1) (Score)
1 < $5.0 8
3,660
0.043
29,280
0.007
0.043 0.007 0.000
2 $5 ‐ $9,9 46
7,050
0.293
324,300
0.088
0.250 0.095
0.024
3 $10 ‐ $14,9 54
12,760
0.587
689,040
0.260
0.293 0.348
0.102
4 $15 ‐ $19,9 8
18,080
0.630
144,640
0.296
0.043 0.555
0.024
5 $20 ‐ $24,9 25
21,430
0.766
535,750
0.429
0.136 0.725
0.098
6 $25 ‐ $29,9 7
27,550
0.804
192,850
0.477
0.038 0.906
0.034
7 $30 ‐ $34,9 0 ‐
0.804
‐
0.477
‐ 0.954
‐
8 $35 ‐ $39,9 13
35,710
0.875
464,230
0.593
0.071 1.070
0.076
9 >$40 23
71,120
1.000
1,635,760
1.000
0.125 1.593
0.199
Total 184
4,015,850
0.558
Gini
coefficient
0.442 Source: Field work conducted 2017‐2018; own compilation; n=184 respondents
For the Tangerang sample three clusters are discernible, a larger one around the minimum wage line (No 2 + 3; 100 vendors), a smaller one in
the upper segment above the triple of the minimum wage sum (No 8 + 9; 36 vendors), a narrow “middle class” (No 4 – 6) of 40 vendors and a

164
misery group of eight vendors. The majority of the upper‐class vendors have a permanent stall, part of them employ paid workers. Conversely,
most of the traders with profits around the minimum wage are mobile in the sense that they move from place to place by carrying their food on
push carts or in baskets on their heads. The majority of them do not have any other source of income.
Table 7‐4. Gini coefficient of the street food vendors in Hat Yai
No Group of income
Number of
vendors
Average income per capita/daily
% cumulative of vendors
(Xk)
Total income
% cumulative of income (Yk)
Xk‐Xk‐1 Yk+Yk‐1 (Xk‐Xk‐1)*(Yk+Yk‐1)
(Score)
1 < $5.0 0 ‐ ‐
‐
‐
‐ ‐
‐
2 $5 ‐ $9,9 10
9,927
0.128
99,272
0.021
0.128 0.021
0.003
3 $10 ‐ $14,9 1
13,236
0.141
13,236
0.023
0.013 0.044
0.001
4 $15 ‐ $19,9 13
17,054
0.308
221,707
0.069
0.167 0.093
0.015
5 $20 ‐ $,4,9 0 ‐
0.308
‐
0.069
‐ 0.139
‐
6 $25 ‐ $29,9 7
26,473
0.397
185,308
0.108
0.090 0.177
0.016
7 $30 ‐ $34,9 9
33,091
0.513
297,816
0.170
0.115 0.278
0.032
8 $35 ‐ $39,9 0 ‐
0.513
‐
0.170
‐ 0.340
‐
9 >$40 38
105,190
1.000
3,997,220
1.000
0.487 1.170
0.570
Total 78
4,814,560
0.637
Gini
coefficient
0.363 Source: Field work conducted 2017‐2018; own compilation; n=78 respondents

165
In the Hat Yai sample a misery group is completely absent; the “minimum wage group” (24 vendors) is smaller than in Tangerang, as it is the
“middle class” (16 vendors), while the prosperity group (38 vendors) is the most extensive. Comparable to Tangerang, almost all the vendors
belonging to the minimum wage class in Hat Yai offer foods to the public without having a permanent built‐up structure. They use a temporary
stall for running their activities for instance putting tables on sites that they have occupied on a temporary basis. By contrast, the upper‐class
members can rely on fixed stalls such as kiosks; some hire paid employees. The majority belong to the group of licensed vendors in a government
market store.
166
1.2. Income Determinants in the Street Food Business
The overall data collected in this study allow a comprehensive approach to determine the
factors responsible for the substantial income spreads within the vendors’ group in each city.
Because of the differences between the two countries, the test has to be conducted
separately for each city. The linear regression model turned out to be the best tool to analyze
the factors affecting the incomes of the street food vendors both in Tangerang and in Hat Yai.
The model focuses on how the street food vendors’ earnings have been affected by the
changes in various explanatory variables.
As observed by the author, the income from the vendor business on the streets seems to
depend very much on the traders’ experience, knowledge and marketing skills. Reversely,
limited skills and low levels of marketing knowledge make minimal profits for many street
traders, which is in line with the literature for several African countries (Mitullah, 2003).
However, according to the literature (see Introduction) and the vendors’ narratives, further
variables have been added. Among the overall data generated by the questionnaire, eight
variables have been isolated as potential explanatory factors: Besides the duration in running
the business (years) and the education level of respondents as two proxies for the business
skills already mentioned, the amounts of initial investment have been selected as their
influence has been highlighted in the literature. Furthermore, demographic factors are added
as the complexes “family” and “religion” play a major role in the literature (see Introduction)
and the qualitative narratives of the interviewees. Accordingly, the influence of the marital
status, the number of children and household members and the religious affiliation is also
being tested.
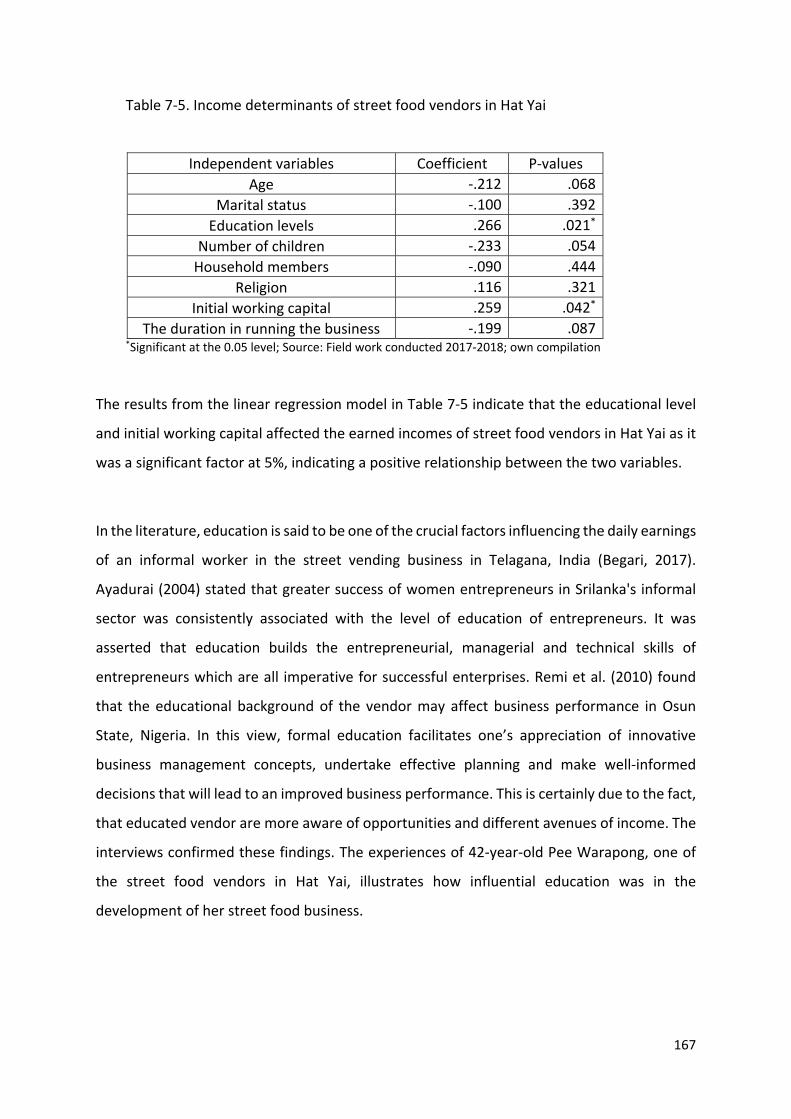
167
Table 7‐5. Income determinants of street food vendors in Hat Yai
Independent variables Coefficient P‐values
Age ‐.212 .068
Marital status ‐.100 .392
Education levels .266 .021*
Number of children ‐.233 .054
Household members ‐.090 .444
Religion .116 .321
Initial working capital .259 .042*
The duration in running the business ‐.199 .087 *Significant at the 0.05 level; Source: Field work conducted 2017‐2018; own compilation
The results from the linear regression model in Table 7‐5 indicate that the educational level
and initial working capital affected the earned incomes of street food vendors in Hat Yai as it
was a significant factor at 5%, indicating a positive relationship between the two variables.
In the literature, education is said to be one of the crucial factors influencing the daily earnings
of an informal worker in the street vending business in Telagana, India (Begari, 2017).
Ayadurai (2004) stated that greater success of women entrepreneurs in Srilanka's informal
sector was consistently associated with the level of education of entrepreneurs. It was
asserted that education builds the entrepreneurial, managerial and technical skills of
entrepreneurs which are all imperative for successful enterprises. Remi et al. (2010) found
that the educational background of the vendor may affect business performance in Osun
State, Nigeria. In this view, formal education facilitates one’s appreciation of innovative
business management concepts, undertake effective planning and make well‐informed
decisions that will lead to an improved business performance. This is certainly due to the fact,
that educated vendor are more aware of opportunities and different avenues of income. The
interviews confirmed these findings. The experiences of 42‐year‐old Pee Warapong, one of
the street food vendors in Hat Yai, illustrates how influential education was in the
development of her street food business.

168
“At the first time, my mother asked me to help her after I graduated from college in Malaysia. However, I have no interest in my mother’s suggestion. I wanted to be an
employee in a company. I thought it’s cool … and I can at least learn some skills and practice my knowledge. That might be helpful and bring me some other chance in the future.
But after working a few years, I decided to go back to Songkhla and help my mother. My mother has a small kiosk assisted by one employee. I’ve developed the business through my
work experience and knowledge. I practice many concepts to expand the business. In a highly competitive market, I should have many strategies to stay in this business.”
Additionally, for Hat Yai the coefficient of the investment variable is positive which confirms
that an increase in initial investment creates a stable substance for the income in the
following years. This is in line with the findings by Adhikari in Bangladesh (2017). Research in
Padang, West Sumatera by Harahap (2017) additionally showed, that the income increases
not only with the grade of education but also with the rate of initial investments (Adhikari,
2011). In this study, this is confirmed the vendors’ narratives: An elderly vendor, Ibu Mariana,
53 years old narrated the importance of start‐up capital in determining a street food business’
well‐being:
“I started the vending at this site three years ago. Previously, I was a mobile food vendor for around 20 years and the income was not sufficient to sustain my family. It was very difficult
to have money in my hand. Besides, I was so tired of selling the food without having a permanently built structure. In the end, I decided to trade permanently in this place. With a startup capital of 600 thousand rupiah ($43), I started this business. … Slowly, my business began to develop, and consumers started coming to my food stall. Now at least I can use my
money as for my need and my family. Finically, this street food business is far better than my previous work as a mobile food vendor.”
Initial working capital costs are one of the factors which may give an additional reason for the
income disparities at the two study locations. As discussed before, vendors in Hat Yai spent
more money when they started the business compared to vendors in Tangerang. By contrast,
the independent variable ‘number of children’ was significant at 5% with a negative
relationship suggesting that vendors who have fewer children might have more time to take
care of their business and earned a higher income.

169
Table 7‐6 shows that the amount of initial capital plays a significant role in raising the sales
revenue of the street food business in Tangerang as well, even if the investments were on
average lower than in Hat Yai. The coefficient of “duration of business”/ “experience in
business” is also positive and significant at the 5% level, which means that vendors that are
more experienced in this business, have higher incomes.
Table 7‐6. Income determinants of street food vendors in Tangerang
Independent variables Coefficient P‐values
Age ‐.120 .103
Marital status ‐.044 .550
Education levels .066 .369
Number of children ‐.099 .179
Household members ‐.079 .284
Religion .020 .790
Initial working capital .298 .000**
The duration in running the business .182 .013* *. Correlation is significant at the 0.05 level; **. Correlation is significant at the 0.01 level Source: Field work conducted 2017‐2018; own compilation
On a similar note, Muzaffar et al. (2009) collected data on street food vendors in Dhaka city,
Bangladesh and found that business experience does have a significant impact on business
performance. The results in Table 7‐6 reveal that the coefficient of education levels is positive
but, unlike in Hat Yai, not significant at a 5% level. Therefore, it can be concluded that the
level of education does not significantly affect the sales revenue generated by street food
vendors in Tangerang. It suggests that the duration of conducting business in this sector is
more important than formal education in generating higher income for street food vendors
in Tangerang.
This reflects the different role education plays in the two countries. The education system in
Thailand is much more developed and accessible for a larger share of its population than its
counterpart in Indonesia. An analysis by the ASEAN (2018) showed that the percentage of
population aged 15 years and over who can both read and write with understanding a short
simple statement on his/her everyday life in Thailand was 97.0% compared to 95.4% in

170
Indonesia. Net enrolment rate in primary and secondary education in Thailand (98.0%) was
also higher than Indonesia (96.8%). According to The World Bank (2018) the percentage of
Indonesians over the age of 25 that had attained at least a bachelor’s degree in 2016 was just
under 9.0% compared to Thailand which jumped from 19.0% in the early 1990s to 47.7% in
2011 (ASEAN State of Education Report, 2013).
Formally, for Tangerang, business experience can be perceived as a proxy for lacking grades
of formal education. To a certain degree, street business is the Tangerang vendors’ university.
However, the question remains: Would Tangerang vendors be more successful if their formal
education would reach the Hat Yai level? As this question is counter‐factual, an answer, based
on empirical data is impossible. Reversely, this comparison may reveal the limited scope of
the Thai education system. It did not prevent educated people from seeking employment in
the informal sector with its basic weaknesses: insecurity, poor hygiene and a never‐ending
workday. However, it may have enabled them to do a more successful job than a majority of
their Indonesian counterparts and to become members of the upper‐middle income class.
1.3. A Success Story? Initial and Current Income
With reference to Table 7‐7, it is clear that most of the participants in Tangerang (51.1%)
stated that their daily income when starting the business was lower than at present. The
majority of participants noted that their vending has now grown, and the business is operating
well, while only a few vendors responded that their vending business is performing badly.
Nevertheless, street food vending activities have been a powerful engine of economic growth
and wealth creation in their households. For Hat Yai the findings are not unequivocal. Only
one‐fourth of the total respondents in Hat Yai (24.0%) stated that they earn a higher daily
income at present than at the beginning of their business, while 10.7% stated that their daily
income was getting worse.
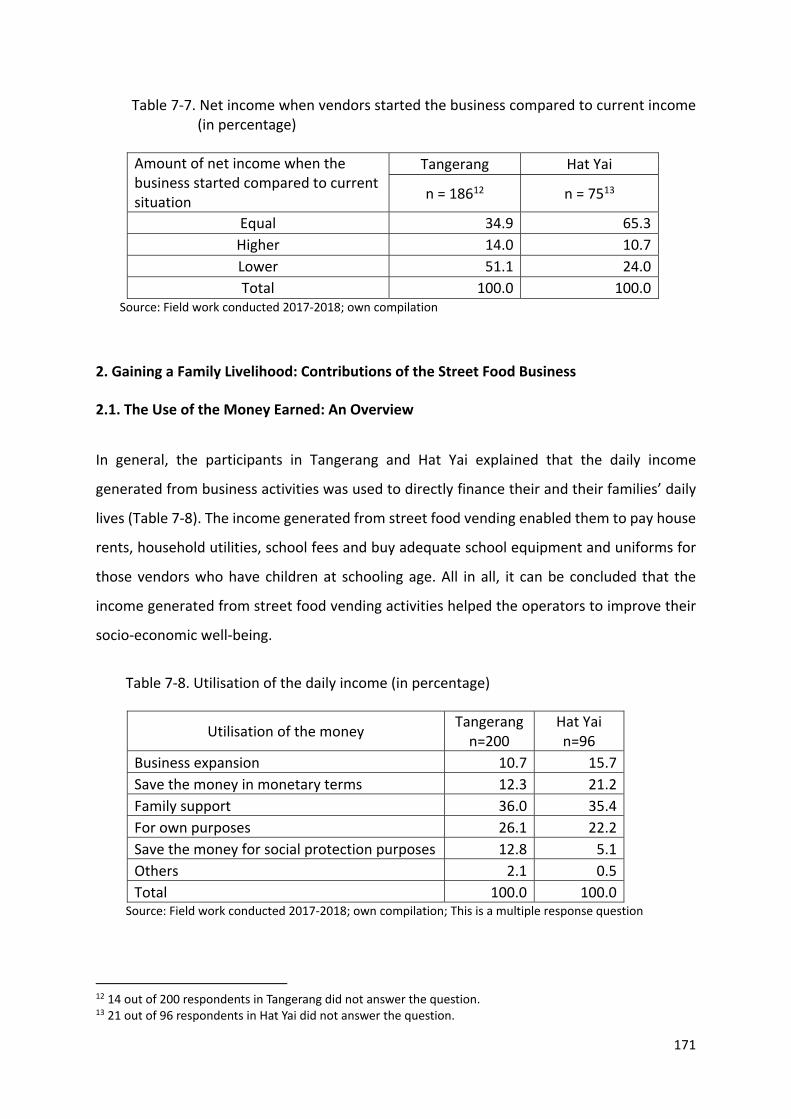
171
Table 7‐7. Net income when vendors started the business compared to current income (in percentage)
Amount of net income when the business started compared to current situation
Tangerang Hat Yai
n = 18612 n = 7513
Equal 34.9 65.3
Higher 14.0 10.7
Lower 51.1 24.0
Total 100.0 100.0 Source: Field work conducted 2017‐2018; own compilation
2. Gaining a Family Livelihood: Contributions of the Street Food Business
2.1. The Use of the Money Earned: An Overview
In general, the participants in Tangerang and Hat Yai explained that the daily income
generated from business activities was used to directly finance their and their families’ daily
lives (Table 7‐8). The income generated from street food vending enabled them to pay house
rents, household utilities, school fees and buy adequate school equipment and uniforms for
those vendors who have children at schooling age. All in all, it can be concluded that the
income generated from street food vending activities helped the operators to improve their
socio‐economic well‐being.
Table 7‐8. Utilisation of the daily income (in percentage)
Utilisation of the money Tangerang n=200
Hat Yai n=96
Business expansion 10.7 15.7
Save the money in monetary terms 12.3 21.2
Family support 36.0 35.4
For own purposes 26.1 22.2
Save the money for social protection purposes 12.8 5.1
Others 2.1 0.5
Total 100.0 100.0 Source: Field work conducted 2017‐2018; own compilation; This is a multiple response question
12 14 out of 200 respondents in Tangerang did not answer the question. 13 21 out of 96 respondents in Hat Yai did not answer the question.

172
One of the participants, Ibu Harifah, aged 40, expressed the importance of the contribution
of income to her family, primarily to finance the education of her children.
“…I have to continue this business until I cannot afford it anymore. I would like to invest my earnings in providing good education to my children. I fully understand this work is not easy,
but I have to keep doing it.”
Pee Supranee, 39, a street vendor who operates her food cart on the sidewalk near the Prince
Songkla University mentioned that the daily income earned from the trading was used to
meet the needs of her family.
“I earn from selling Khao Neow Moo Ping (grilled pork with sticky rice), khao phat (Thai
fried rice), and Pad Kee Mao (drunken noodles). I can't sell enough foods to break even because I should share this place with another vendor. I start my trading in the early
morning till noon around 11:00 am. I make about 2,500 baht ($83,3) a day, but sometimes, I get less when the semester break is coming. Even so, I am grateful that the earned income
that I have enough to sustain my family. Since a few years ago, I have been the sole breadwinners of the family. Both of my parents became ill and stopped working.”
These views are consistent with Chukuezi (2010) who reported that the majority of street
food vendors in Nigeria stated that the income from street food vending was sufficient to
provide for the entirety of their family needs. These findings also correlate with those of
Muyanja et al. (2011) who have shown that the income generated by food vending in Uganda
contributes to the total family income as well as to the satisfaction of additional financial
needs.
2.2. The Livelihood Approach: A Tool to Measure Economic Success Furthermore, most of the narratives show, that some of them have increased their financial
capital substantially and have been going to invest in other sectors i.e. establishing permanent
shops. Others have built their own house and many of them have invested in education for
their children. In order to approach these issues in detail, this chapter will have a closer look
at the use of the money earned and will provide an understanding of street food vending as
an opportunity for a livelihood to urban poor. The livelihood approach highlights five salient
173
categories of household capitals known as “assets pentagon” (physical, financial, social,
human and natural capital) (Ellis, 2000).
Natural capital is a primary source that creates livelihoods in society, mainly in rural areas. It
comprises the land, water and biological resources that are utilized by people to generate
means of survival (Ellis, 2000). The utilisation of natural capital is less significant to the urban
poor, which suggests that an increasing number of households in urban areas have become
less dependent on activities such as subsistence farming and instead rely on purchasing what
they need (Rakodi and Llyod‐Jones, 2002). Therefore, this research did not discuss natural
capital as the contribution of these assets is not large and is even non‐existent to street food
vendors. The access to water, electricity and space, however, has been discussed in the
previous chapter. Human capital, as related to the vendors themselves (especially the
education and health issue), has been discussed in the demography and the labour chapters.
As related to their children, their education would be a crucial factor for the human capital
approach. However, information on this item is sparse and would in the majority of cases be
premature, because of the low age of most children.
Accordingly, this chapter focusses on physical, financial and social capital. It is designed to
present the vendors’ livelihood situations when they started the business and at present, in
order to assess elements of progress, achieved in the time in‐between. This study thus
provides an understanding of the importance of the street food sector and how it provides
livelihoods alternatives for the urban poor and pleads that it will be considered as an
employment provider sector rather than an illegal or insignificant sphere.

174
2.2.1. Physical Capital and Housing
Physical capital comprises the basic infrastructure and producer goods needed to pursue the
vendors’ livelihoods. Six physical assets are identified as important indicators of the
households’ physical wealth in goods ‐ television devices, refrigerators, mobile phones,
motorcycles, cars and house/residence. Mobile phones have a functional value as assets in
that they enable social relationships with family and friends and are used to listen to music,
but they are also forms of physical capital which are ‘easy to sell’ if cash is needed urgently.
Besides entertainment, television can also be used to transmit information over a wider
population. Motorcycles or cars are used to transport people and goods to marketplaces,
public buildings or other short/long distances. The house is the basic infrastructure that
people need to live in with their family. The fundamental reason for having a refrigerator is to
keep food cold and perishable raw materials for preparation the next day (Alimi, 2016).
To enable an easier comparison of the total physical assets between households, the six assets
are accumulated in a total asset value score. This is done as each asset has a significant
relationship with household welfare. For each asset that the household possesses, one point
was given. Therefore, the highest possible score is six and the lowest is zero. The mean score
of all households in Tangerang and Hat Yai before starting the business and at present, as
shown in Table 7‐9, are 3.64 and 4.58, respectively. At present, all households in Hat Yai own
mobile phones resulting in the highest score on physical assets compared to 90.0% of the
households in Tangerang. The percentage of car ownership in Hat Yai (61.0%) was nearly four
times higher than their counterparts in Tangerang (16.0%). Interestingly, the percentage of
home ownership of traders in Tangerang (60.0%) was higher than traders in Hat Yai (51.0%).
This shows that many traders in Tangerang might choose to invest the majority of their money
into housing rather than buying other assets, such as a new car.
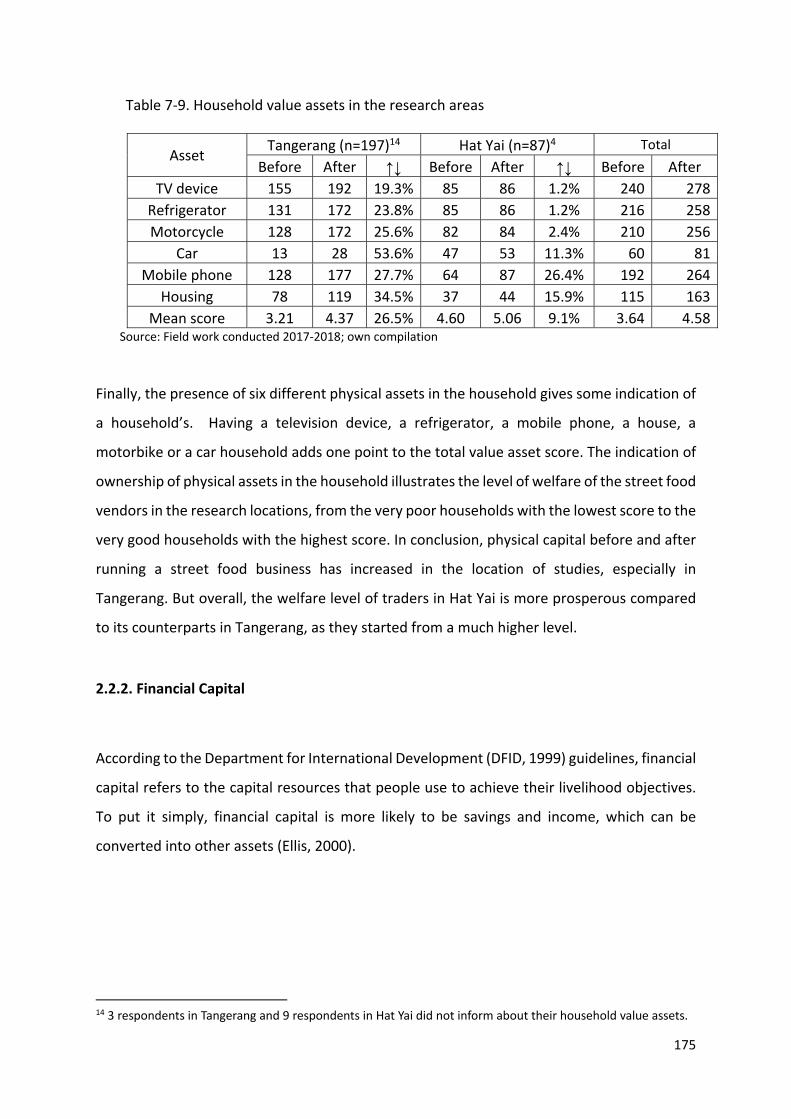
175
Table 7‐9. Household value assets in the research areas
Asset Tangerang (n=197)14 Hat Yai (n=87)4 Total
Before After ↑↓ Before After ↑↓ Before After
TV device 155 192 19.3% 85 86 1.2% 240 278
Refrigerator 131 172 23.8% 85 86 1.2% 216 258
Motorcycle 128 172 25.6% 82 84 2.4% 210 256
Car 13 28 53.6% 47 53 11.3% 60 81
Mobile phone 128 177 27.7% 64 87 26.4% 192 264
Housing 78 119 34.5% 37 44 15.9% 115 163
Mean score 3.21 4.37 26.5% 4.60 5.06 9.1% 3.64 4.58 Source: Field work conducted 2017‐2018; own compilation
Finally, the presence of six different physical assets in the household gives some indication of
a household’s. Having a television device, a refrigerator, a mobile phone, a house, a
motorbike or a car household adds one point to the total value asset score. The indication of
ownership of physical assets in the household illustrates the level of welfare of the street food
vendors in the research locations, from the very poor households with the lowest score to the
very good households with the highest score. In conclusion, physical capital before and after
running a street food business has increased in the location of studies, especially in
Tangerang. But overall, the welfare level of traders in Hat Yai is more prosperous compared
to its counterparts in Tangerang, as they started from a much higher level.
2.2.2. Financial Capital
According to the Department for International Development (DFID, 1999) guidelines, financial
capital refers to the capital resources that people use to achieve their livelihood objectives.
To put it simply, financial capital is more likely to be savings and income, which can be
converted into other assets (Ellis, 2000).
14 3 respondents in Tangerang and 9 respondents in Hat Yai did not inform about their household value assets.
176
2.2.2.1. Savings Saving is one of the most important tools to sustain the livelihoods of people. All people,
regardless of where they live, can benefit from a range of savings to enable them to tackle
difficult conditions like food insecurity and a sudden economic crisis. When street vendors
were asked what happens when they are unable to earn enough to cover their daily expenses,
the majority of respondents said that when such a situation occurs, they use their savings as
expressed by one of the participants, Ibu Wartiyem, a native from Wonogiri, Central Java, 49
years old:
“I make enough for my daily use. My major problem is rain. It makes trading very
uncomfortable and only a few customers come to my food cart. On those days, the earned incomes were too small. So, I must take money from the savings.”
Collins et al. (2009), in their research in Bangladesh, South Africa, and India found that many
poor people save money at home, save in kind or purchase assets such as jewellery, which
can be sold in times of need. Poor people also make use of individual informal financial service
providers. These can range from friends, relatives or neighbours who provide each other with
fairly informal loans, with or without interest, depending on the nature of the relationship.
There are also individuals who provide savings services, collecting regular deposits from
clients and keeping them safe until the client wants to access them.
According to the findings of this study, more than half of the actual respondents in Hat Yai
and Tangerang saved a portion of their income at present and when they started running their
street food business (Table 7‐10). The figure in the table 7‐10 shows that the average monthly
saving of vendors when joining the business of the vendors was equal and lower in both Hat
Yai and Tangerang. However, due to the low number of respondents, especially for Hat Yai,
the results are lacking statistical validity.
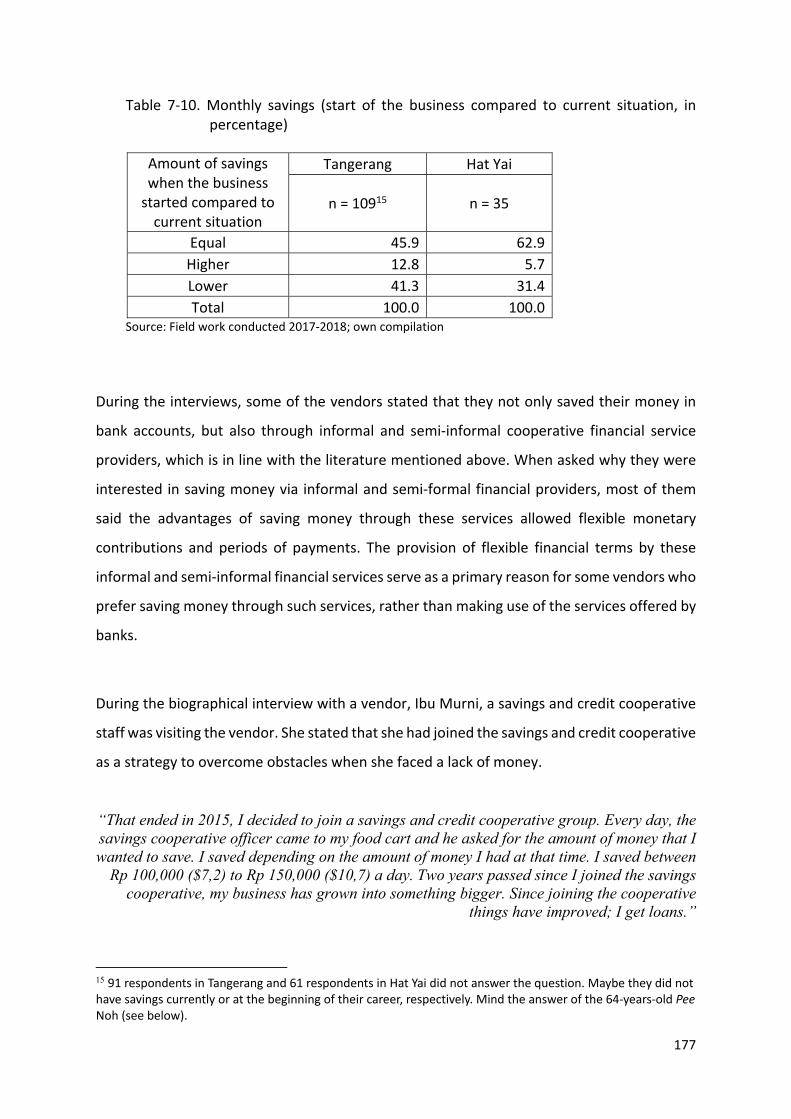
177
Table 7‐10. Monthly savings (start of the business compared to current situation, in percentage)
Amount of savings when the business started compared to current situation
Tangerang Hat Yai
n = 10915 n = 35
Equal 45.9 62.9
Higher 12.8 5.7
Lower 41.3 31.4
Total 100.0 100.0 Source: Field work conducted 2017‐2018; own compilation
During the interviews, some of the vendors stated that they not only saved their money in
bank accounts, but also through informal and semi‐informal cooperative financial service
providers, which is in line with the literature mentioned above. When asked why they were
interested in saving money via informal and semi‐formal financial providers, most of them
said the advantages of saving money through these services allowed flexible monetary
contributions and periods of payments. The provision of flexible financial terms by these
informal and semi‐informal financial services serve as a primary reason for some vendors who
prefer saving money through such services, rather than making use of the services offered by
banks.
During the biographical interview with a vendor, Ibu Murni, a savings and credit cooperative
staff was visiting the vendor. She stated that she had joined the savings and credit cooperative
as a strategy to overcome obstacles when she faced a lack of money.
“That ended in 2015, I decided to join a savings and credit cooperative group. Every day, the savings cooperative officer came to my food cart and he asked for the amount of money that I wanted to save. I saved depending on the amount of money I had at that time. I saved between
Rp 100,000 ($7,2) to Rp 150,000 ($10,7) a day. Two years passed since I joined the savings cooperative, my business has grown into something bigger. Since joining the cooperative
things have improved; I get loans.”
15 91 respondents in Tangerang and 61 respondents in Hat Yai did not answer the question. Maybe they did not have savings currently or at the beginning of their career, respectively. Mind the answer of the 64‐years‐old Pee Noh (see below).

178
It is therefore clear that street food vendors make use of different methods to save their
money and use different sources to gain access to money. The use of a various strategies,
including the informal financial services also suggest that access to formal institutions, such
as banks, is not easy for some traders. Street food traders, therefore, make use of alternative
sources in order to save and gain access to financial capital.
From Table 7‐11, out of the actual respondents in Tangerang, nearly 44.0% reported saving
less than Rp 1,000,000 ($70,0) a month. These results reveal that the daily expenses were
lower than the income earned, leaving a small surplus which was saved for times of need or
for further investment. The findings also revealed that a small percentage of vendors saved
more than the considerable sum of Rp 5,000,000 ($350,0) per month.
Table 7‐11. Monthly saving of the street food vendors in Tangerang
Frequency Percent
Valid Percent
Cumulative Percent
Valid
< Rp 1,000,000 ($71,4)
47 23.5 43.1 43.1
Rp 1,000,001 ‐ Rp 2,500,000 ($71,4 ‐ $ $178,5)
32 16.0 29.4 72.5
Rp 2,500,001 ‐ Rp 5,000,000 ($178,5 ‐ $357,2)
20 10.0 18.3 90.8
> Rp 5,000,000 ($357,2)
10 5.0 9.2 100.0
Total 109 54.5 100.0
Missing System 91 45.5
Total 200 100.0 Source: Field work conducted 2017‐2018; own compilation; n=109 respondents

179
Table 7‐12. Monthly saving of the street food vendors in Hat Yai
Frequency Percent Valid
Percent Cumulative Percent
Valid
< 2,200 THB ($73,3)
4 4.2 11.4 11.4
2,200 ‐ 5,500 THB ($73,3 ‐ $183,3)
16 16.7 45.7 57.1
5,501 ‐ 11,000 THB ($183,3 ‐ $ 366,7)
8 8.3 22.9 80.0
> 11,000 THB ($366,7)
7 7.3 20.0 100.0
Total 35 36.5 100.0
Missing System 61 63.5
Total 96 100.0 Source: Field work conducted 2017‐2018; own compilation; n= 35 respondents
Table 7‐12 shows the savings status of the actual respondents in Hat Yai per month. The
majority of the vendors’ savings range between 2,200 ($73,3) to 5,500 baht ($183,3) and
about 11.4% vendors save less than 2,200 baht ($73,3) per month. Some study participants,
however, reported that they did not save any earnings due to the small profit margins and
economic hardship. One elderly vendor, Pee Noh, 64 years old explained that “I use the earned
incomes to maintain a living livelihood my family, so I have no savings at the end of the month”.
Pee Noh believes that she is leading a miserable life. “Sometimes, I was unable to maintain
family expenses with the income I earned from the trading. If I ran out of money, I forced to
borrow money from my friends to cover my family expenses”. Similar accounts and stories in
Hat Yai were, however, rare.
2.2.2.2. Remittances
The aim of this section is to scrutinize and analyze the frequency, amount of remittances and
recipients of migrant's remittances. In addition, the difference in the amount of remittances
sent at the time of starting a business and at present is also analysed. The results in Table 7‐
13 show that nearly half of the proportion of women migrant street food vendors in
Tangerang send cash remittances in the proportions of 48.0% and 46.5% when they started
the business and at present, respectively. While only around one fifth (19.1%) of the women

180
migrant street food vendors in Hat Yai send remittances to their hometown when they started
the business and at present.
Table 7‐13. Remittances to the previous place of residence (in percentage)
Variables
Tangerang n = 200
Hat Yai n = 9416
When started the business
At present When
Started the business
At present
Do you send remittances to your previous place of residence or your relatives?
n = 200 n = 200 n = 94 n = 94
Yes 48.0 46.5 19.1 19.1
No 52.0 53.5 80.9 80.9
Total 100.0 100.0 100.0 100.0 Source: Field work conducted 2017‐2018; own compilation
The sharp difference between the two cities in the proportion of female street food vendors
who send remittances may be due to the distance between the place of origin and the
vendors’ residence. In fact, most of the vendors in Hat Yai city are from the rural areas nearby
their workplace, such as Songkhla city. The distance between Hat Yai and Songkhla is only
around 30 kilometres, which can be travelled by car in half an hour. Due to this close distance,
many of women migrants in Hat Yai chose to go home to give remittances directly to their
parents and their relatives. On the other hand, the majority of migrant women in Tangerang
came from areas far from where they live now. They do not have time to come and provide
the remittances to their families at their place of origin.
As a final point, they use various informal and formal channels to send remittances to their
families and households, including the use of formal banks, in the case when the recipients
have a bank account. In case they have not, friends and relatives are charged with the money
transfer. This finding is in line with the results by The World Bank Development Economics
Department & Africa Region (2007) for Ghana. They added that this way is not without risk,
16 2 respondents in Hat Yai did not answer the question.
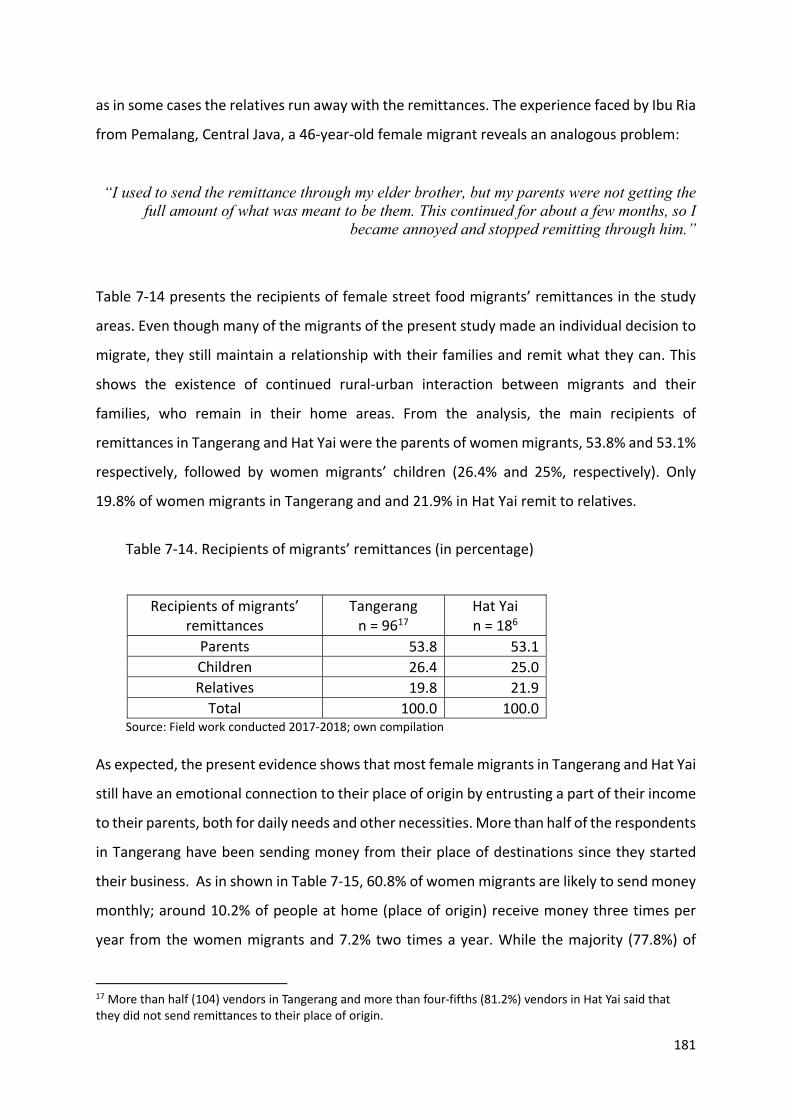
181
as in some cases the relatives run away with the remittances. The experience faced by Ibu Ria
from Pemalang, Central Java, a 46‐year‐old female migrant reveals an analogous problem:
“I used to send the remittance through my elder brother, but my parents were not getting the full amount of what was meant to be them. This continued for about a few months, so I
became annoyed and stopped remitting through him.”
Table 7‐14 presents the recipients of female street food migrants’ remittances in the study
areas. Even though many of the migrants of the present study made an individual decision to
migrate, they still maintain a relationship with their families and remit what they can. This
shows the existence of continued rural‐urban interaction between migrants and their
families, who remain in their home areas. From the analysis, the main recipients of
remittances in Tangerang and Hat Yai were the parents of women migrants, 53.8% and 53.1%
respectively, followed by women migrants’ children (26.4% and 25%, respectively). Only
19.8% of women migrants in Tangerang and and 21.9% in Hat Yai remit to relatives.
Table 7‐14. Recipients of migrants’ remittances (in percentage)
Recipients of migrants’ remittances
Tangerang n = 9617
Hat Yai n = 186
Parents 53.8 53.1
Children 26.4 25.0
Relatives 19.8 21.9
Total 100.0 100.0 Source: Field work conducted 2017‐2018; own compilation
As expected, the present evidence shows that most female migrants in Tangerang and Hat Yai
still have an emotional connection to their place of origin by entrusting a part of their income
to their parents, both for daily needs and other necessities. More than half of the respondents
in Tangerang have been sending money from their place of destinations since they started
their business. As in shown in Table 7‐15, 60.8% of women migrants are likely to send money
monthly; around 10.2% of people at home (place of origin) receive money three times per
year from the women migrants and 7.2% two times a year. While the majority (77.8%) of
17 More than half (104) vendors in Tangerang and more than four‐fifths (81.2%) vendors in Hat Yai said that they did not send remittances to their place of origin.

182
women migrants in Hat Yai send their remittances home once a month and about 16.7% of
women migrants remit money six times a year. None of the women migrants in Hat Yai sends
money more than twelve times per year. The amount of money sent to home varies among
individuals.
Table 7‐15. Frequency of remittances (in percentage)
Frequency of remittances Tangerang n = 966
Hat Yai n = 186
> 12 times a year 5.2 0.0
Monthly 60.8 77.8
6 times a year 6.2 16.7
4 times a year 5.2 0.0
3 times a year 10.2 5.5
2 times a year 7.2 0.0
Once time a year 5.2 0.0
Total 100.0 100.0 Source: Field work conducted 2017‐2018; own compilation
In relation to remittances in Tangerang at the beginning of the food vending business and at
present can be divided into three groups – (i) between 100,000 ($7,2) to 499,999 Indonesian
Rupiah (IDR) ($35,7) per transfer, (ii) from 500,000 ($35,7) to 999,999 IDR ($71,4) per transfer,
and (iii) over one million IDR ($71,4) per transfer. The majority fall into group 1. As indicated
in Table 7‐16, the average amount of remittances per transfer at present is higher than when
the women migrants started the business, which accounts for the fact, that in the course of
the time the vendors’ ties to their place and family of origin stayed firm. Some of the
respondents, as revealed in the narratives, had left their children in their place of origin (or
sent them back), where they attended schools while the vendors’ parents were taking care of
them.

183
Table 7‐16. The amount of remittances by vendors in Tangerang (in percentage)
The amount of remittances sent per transfer in Indonesian Rupiah (IDR)
When the vendors started the business
n = 9318
At present n = 96
100,000 – 499,999 ($7,2 ‐ $35,7) 58.1 62.5
500,000 – 999,999 ($35,7 ‐ $ 71,4) 8.6 3.1
> 1,000,000 ($71,4) 33.3 34.4
Total 100.0 100.0
Mean ± SD 800,250 ($57,2) ± 668,250 ($47,7)
839,850 ($60,0) ± 696,300 ($49,7)
Source: Field work conducted 2017‐2018; own compilation
With respect to the amount of remittances sent, nearly forty per cent (38.9%) of the women
street food vendors in Hat Yai said that they sent between 1,000 ($33,3) to 2,999 ($100,0)
THB per transfer as remittance when they started the business and at present. On the other
hand, the majority (44.4%) of the vendors in Hat Yai remitted 2,500 ($83,3) to 4,999 ($166,7)
Thai Baht per transfer when they started the business and only 16.7% sent remittances over
5,000 ($166,7) Thai Baht per transfer (Table 7‐17). At present, one‐third of the vendors in Hat
Yai frequently send 5,000 ($166,7) and above Thai Baht per transfer. The average amount of
remittances of Hat Yai vendors when they started the business was 4,080 ($136,0) Thai Baht,
with a standard deviation of 3,170 ($105,7) Thai Baht. At present, the mean amount of
remittances is 4,195 ($139,8) THB, with a standard deviation of 3,168 ($105,6) THB. It can be
concluded that the average amount of remittances when the vendors started the business
was lower than remittances sent at present, which – as in Tangerang ‐ testifies the stability of
original family ties.
18 3 out of 96 respondents in Tangerang who sent remittances to their place of origin did not answer the question about the amount of remittances when they started the business.
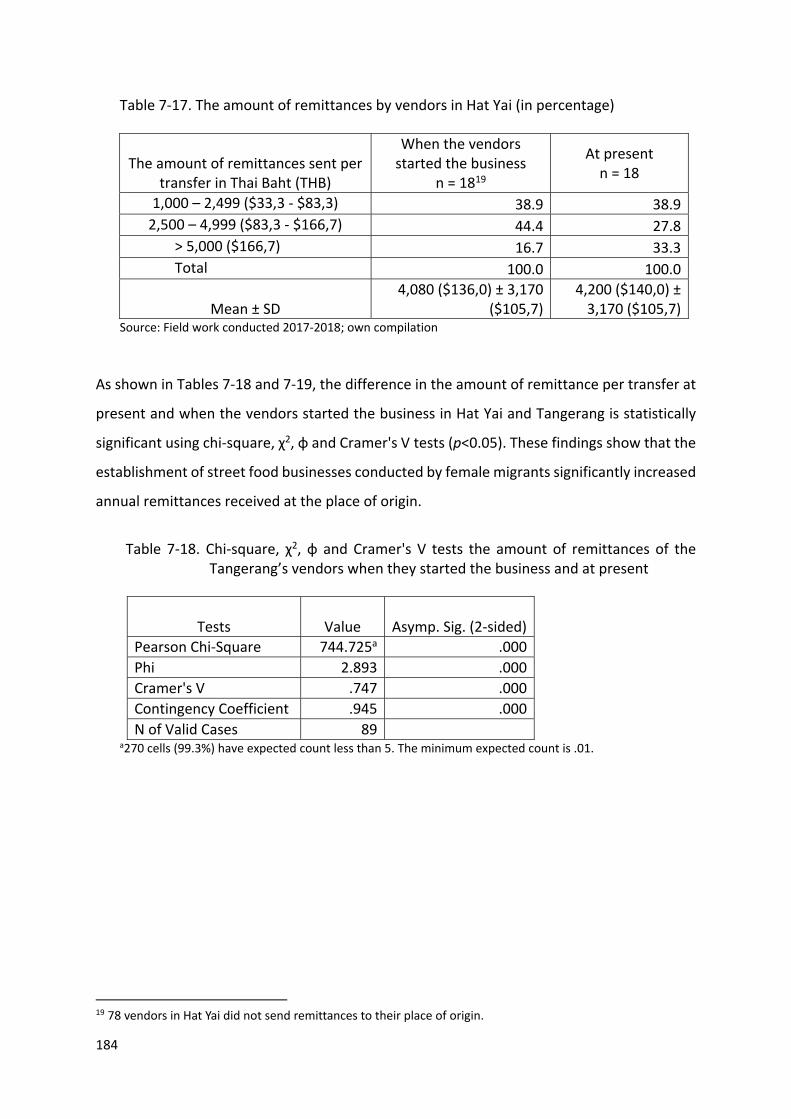
184
Table 7‐17. The amount of remittances by vendors in Hat Yai (in percentage)
The amount of remittances sent per transfer in Thai Baht (THB)
When the vendors started the business
n = 1819
At present n = 18
1,000 – 2,499 ($33,3 ‐ $83,3) 38.9 38.9
2,500 – 4,999 ($83,3 ‐ $166,7) 44.4 27.8
> 5,000 ($166,7) 16.7 33.3
Total 100.0 100.0
Mean ± SD 4,080 ($136,0) ± 3,170
($105,7) 4,200 ($140,0) ±
3,170 ($105,7)
Source: Field work conducted 2017‐2018; own compilation
As shown in Tables 7‐18 and 7‐19, the difference in the amount of remittance per transfer at
present and when the vendors started the business in Hat Yai and Tangerang is statistically
significant using chi‐square, χ2, ɸ and Cramer's V tests (p<0.05). These findings show that the
establishment of street food businesses conducted by female migrants significantly increased
annual remittances received at the place of origin.
Table 7‐18. Chi‐square, χ2, ɸ and Cramer's V tests the amount of remittances of the Tangerang’s vendors when they started the business and at present
Tests Value Asymp. Sig. (2‐sided)
Pearson Chi‐Square 744.725a .000
Phi 2.893 .000
Cramer's V .747 .000
Contingency Coefficient .945 .000
N of Valid Cases 89 a270 cells (99.3%) have expected count less than 5. The minimum expected count is .01.
19 78 vendors in Hat Yai did not send remittances to their place of origin.
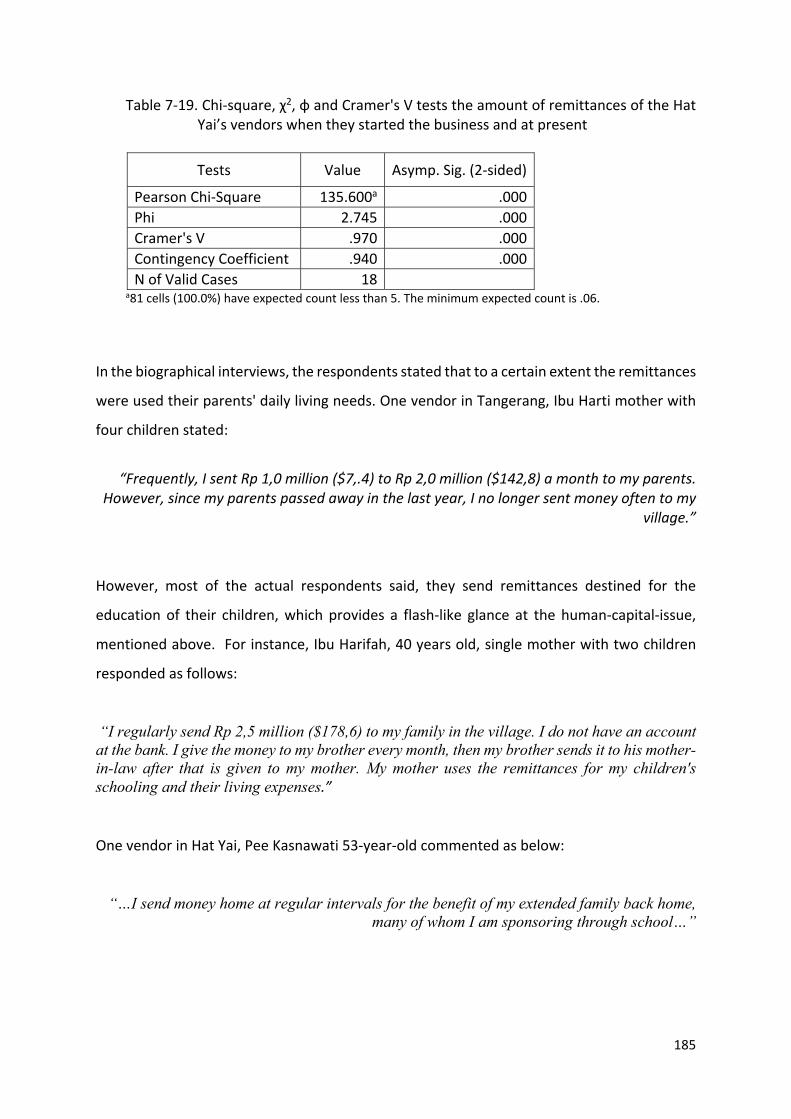
185
Table 7‐19. Chi‐square, χ2, ɸ and Cramer's V tests the amount of remittances of the Hat Yai’s vendors when they started the business and at present
Tests Value Asymp. Sig. (2‐sided)
Pearson Chi‐Square 135.600a .000
Phi 2.745 .000
Cramer's V .970 .000
Contingency Coefficient .940 .000
N of Valid Cases 18 a81 cells (100.0%) have expected count less than 5. The minimum expected count is .06.
In the biographical interviews, the respondents stated that to a certain extent the remittances
were used their parents' daily living needs. One vendor in Tangerang, Ibu Harti mother with
four children stated:
“Frequently, I sent Rp 1,0 million ($7,.4) to Rp 2,0 million ($142,8) a month to my parents.
However, since my parents passed away in the last year, I no longer sent money often to my village.”
However, most of the actual respondents said, they send remittances destined for the
education of their children, which provides a flash‐like glance at the human‐capital‐issue,
mentioned above. For instance, Ibu Harifah, 40 years old, single mother with two children
responded as follows:
“I regularly send Rp 2,5 million ($178,6) to my family in the village. I do not have an account at the bank. I give the money to my brother every month, then my brother sends it to his mother-in-law after that is given to my mother. My mother uses the remittances for my children's schooling and their living expenses.” One vendor in Hat Yai, Pee Kasnawati 53‐year‐old commented as below:
“…I send money home at regular intervals for the benefit of my extended family back home, many of whom I am sponsoring through school…”
186
2.2.3. Social Capital: Women’s Role as the Main Breadwinners
Social assets play an important role in the livelihood of households. They denote the
relationship of individuals with the society to which they belong. Human capital will be
enhanced, when this relationship is based on trust and mutual appreciation (Khatiwada et al.,
2017; Ellis, 2000). Even though social capital represents an intangible asset, it is to a certain
extent based on material conditions. This study observed, how, based on the successful
performance of new roles, women’s reputation in their social context has gradually been
growing, albeit not without frictions and contradictions.
In many instances, women have even become the main breadwinner in the family, in a
substantial number of cases even the sole breadwinner. To find out, in how many households
the latter was the case, it is necessary to recall Table 3‐6. In Tangerang 12.5% of the
households were female headed because of the absence of husbands (single, divorced,
widows), in Hat Yai it was 33.4%. The interviews reveal that many street food vendors have
been forced to enter non‐traditional roles as family breadwinners since their male partners
were no longer present. A street food vendor, Ibu Ida 35 years old with three children, original
from South Sumatera presented the story of her widowhood which forced her to take charge
of her family:
“Since my husband was no longer around, now, I have been the only one fending for the family. None of my husband family members is interested in our welfare. I sought whatever job was available to me because I had to look after my children. In the beginning, I had no
idea which job I could take on. After few months, my sister who lives in Tangerang called me to come here. She got a job for me in the factory. Working in the factory became my first job
after my husband was not around anymore. But it didn't last long because of insufficient income. I have to provide food and other needs for my children. This is the major issue giving
me concern. In the end, I decided to become a street food vendor. With my expertise, I ventured to start a business selling "Soto Tangkar".
Insecurity about their husbands’ employment was another main incentive for women’s
activities in the informal economy (Sukka, 2014). This study found that many women became
breadwinners when their husbands lost their jobs or got retrenched. For instance, a street

187
food vendor, Ibu Murni who sells breakfast street food near one of the markets in Tangerang
(aged 55 years) and mother of three said:
“I have become the breadwinner for the past six years when my husband lost his job six years ago. My husband owned a motorbike workshop, but six years ago, the workshop was closed because it was no longer profitable. Since then, my husband does not work anymore. Then I
tried to start the street food business, even though at first, I did not have the skills and experience of how to cook. At that time, I only think about how I could support and finance
my family.”
Similarly, another 53‐years‐old trader with three children in Hat Yai, revealed that her small
business contributes significantly to the wellbeing of her family:
“This business has existed for eight years. Before I opened this business, I was an employee at a clinic in Bangkok. First starting the business, I started and run by myself. My husband worked as a worker in one of the private companies. When there was an economic crisis in
2007, he was retrenched. Then, I asked him for help trading in our kiosk. It might look like a small business, but it has sustained our lives. With this business, I enabled to finance the
education of my children.”
Physical disability of their spouses was also one of the reasons that attributed to the increase
in the number of breadwinners in the study area. In this respect, one of the respondents in
Hat Yai, Pee Pauan, aged 64 years affirmed:
“I decided to continue to work in the selling “Som Tam”, because there is no other choice. If I stop working no one will take care of our lives. I have to come here every morning and walk
back in the evening to provide for my family. Sometimes my husband accompanied in his wheelchair. In this old age, I have to fight as a breadwinner for the family. I told you that I
have three children, but none of them can support our lives.” In general, for whatever reasons, out of 200 women street food vendors of Tangerang city,
53 identified that their husband was unemployed, in Hat Yai it was 9.

188
Adding the single households (12.5% of 200 in Tangerang and 33.4% of 96 in Hat Yai) to
married households with unemployed husbands (26.5% of 200 in Tangerang and 9.4% of 96
in Hat Yai), would result in the conclusion that in Tangerang 39.0% of the women were the
sole breadwinners, while in Hat Yai it was 42.8%. Without their efforts, the families would not
have survived.
According to the interviews, among those husbands who have a job, the majority are mostly
engaged in the informal sector with an insecure income, thereby earning a wage that fails to
sustain the life of the family. The occupational distribution of the male household members
shows that a majority of them are engaged as casual wage labourers such as construction
worker, security guard, petty trader and other activities. In the beginning, in the
questionnaire, a question about the husband's income was included. However, almost all the
respondents did not answer this question. Consequently, this question was withdrawn.
Notwithstanding, the conclusion may be appropriate that even in cases when husbands were
employed the women vendors were the main breadwinners and the burden of family upkeep
was heavily lying on their shoulders.
Unfortunately, it is impossible to exactly specify how many women are the main breadwinner
in these cases. To approach the answer on an indirect way, a correlation of economic
household patterns and business success according to the findings above can be displayed.

189
Table 7‐20: The income distribution (cf. Table 7‐3) of economic household patterns in Tangerang
Misery
Around the minimum wage
Middle class Far above the minimum wage
Total
Married + employed husbands 4.7% (5) 49.5% (53) 21.5% (23) 24.3% (26) 107
Married + unemployed 3.8% (2) 66.0% (35) 17.0% (9) 13.2% (7) 53
Singles 4.2% (1) 50.0% (12) 37.5% (9) 8.3% (2) 24
Total 8 100 40 36 184
Table 7‐21: The income distribution (cf. Table 7‐4) of economic household patterns in Hat Yai
Around the minimum wage
Middle class Far above the minimum wage
Total
Married + employed husbands 39.5% (15) 13.0% (5) 47.0% (18) 38
Married + unemployed 22.2% (2) 22.2% (2) 55.5% (5) 9
Singles 22.6% (7) 29% (9) 48.4% (15) 31
Total 24 16 38 78 The conclusion may be justified, that at least in the highest income groups the women
vendors are the main breadwinners even when their husbands are employed. Consequently,
the overwhelming majority of the women vendors of Tangerang and Hat Yai have become the
backbone of their families. While it is not new for the vendors to be involved in some
economic activities, the participants in the fieldwork indicate that the pressure on women to
secure livelihood is far stronger today, and reports from nearly all respondents narrate the
trend of increasing numbers of women entering into the informal sector and temporary wage
employment.
By contrast, traditionally, the Thai and Indonesian family structure is defined by family
hierarchy based on gender, generation and age (Kuwinpant, 2002; Mangundjaya, 2013).
Husbands are said to have authority over their wives. How would they react, when, as in the
cases of most street vendors, women assumed the role of a breadwinner? To assess the
immaterial impact of their new role performance, the street food vendors were asked two
questions. The first question is addressing the views of their husbands and family members
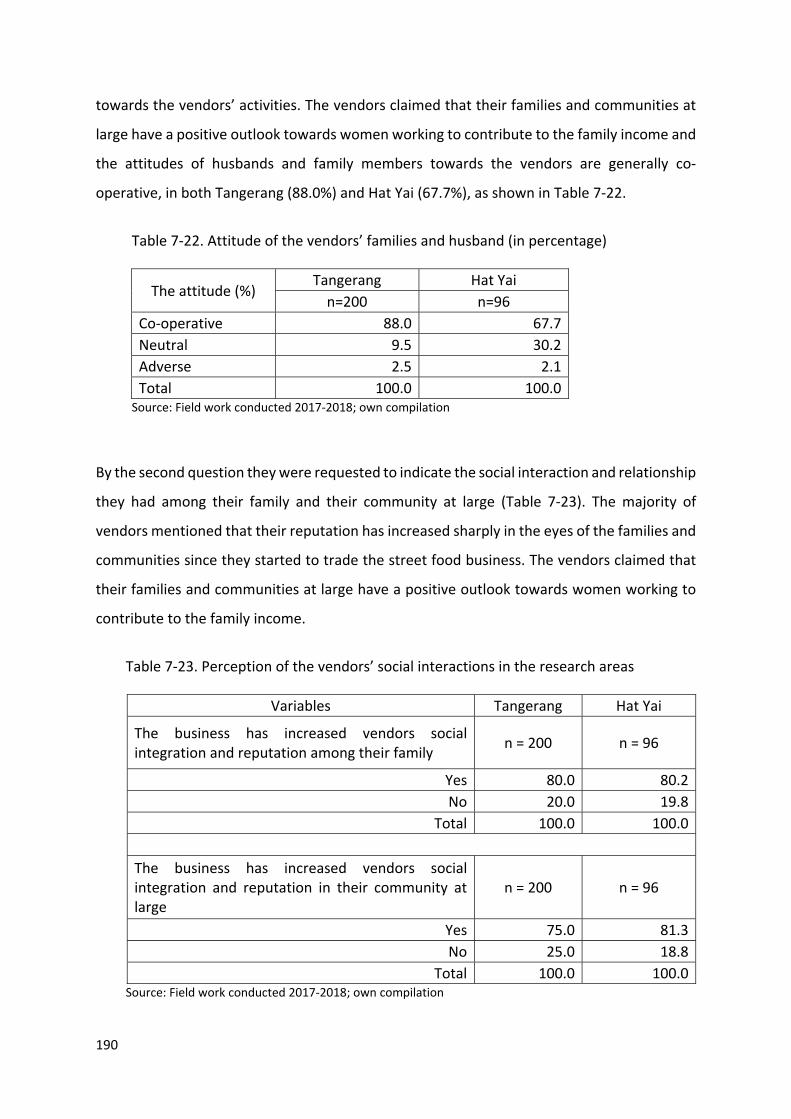
190
towards the vendors’ activities. The vendors claimed that their families and communities at
large have a positive outlook towards women working to contribute to the family income and
the attitudes of husbands and family members towards the vendors are generally co‐
operative, in both Tangerang (88.0%) and Hat Yai (67.7%), as shown in Table 7‐22.
Table 7‐22. Attitude of the vendors’ families and husband (in percentage)
The attitude (%) Tangerang Hat Yai
n=200 n=96
Co‐operative 88.0 67.7
Neutral 9.5 30.2
Adverse 2.5 2.1
Total 100.0 100.0 Source: Field work conducted 2017‐2018; own compilation
By the second question they were requested to indicate the social interaction and relationship
they had among their family and their community at large (Table 7‐23). The majority of
vendors mentioned that their reputation has increased sharply in the eyes of the families and
communities since they started to trade the street food business. The vendors claimed that
their families and communities at large have a positive outlook towards women working to
contribute to the family income.
Table 7‐23. Perception of the vendors’ social interactions in the research areas
Variables Tangerang Hat Yai
The business has increased vendors social integration and reputation among their family
n = 200 n = 96
Yes 80.0 80.2
No 20.0 19.8
Total 100.0 100.0
The business has increased vendors social integration and reputation in their community at large
n = 200 n = 96
Yes 75.0 81.3
No 25.0 18.8
Total 100.0 100.0 Source: Field work conducted 2017‐2018; own compilation
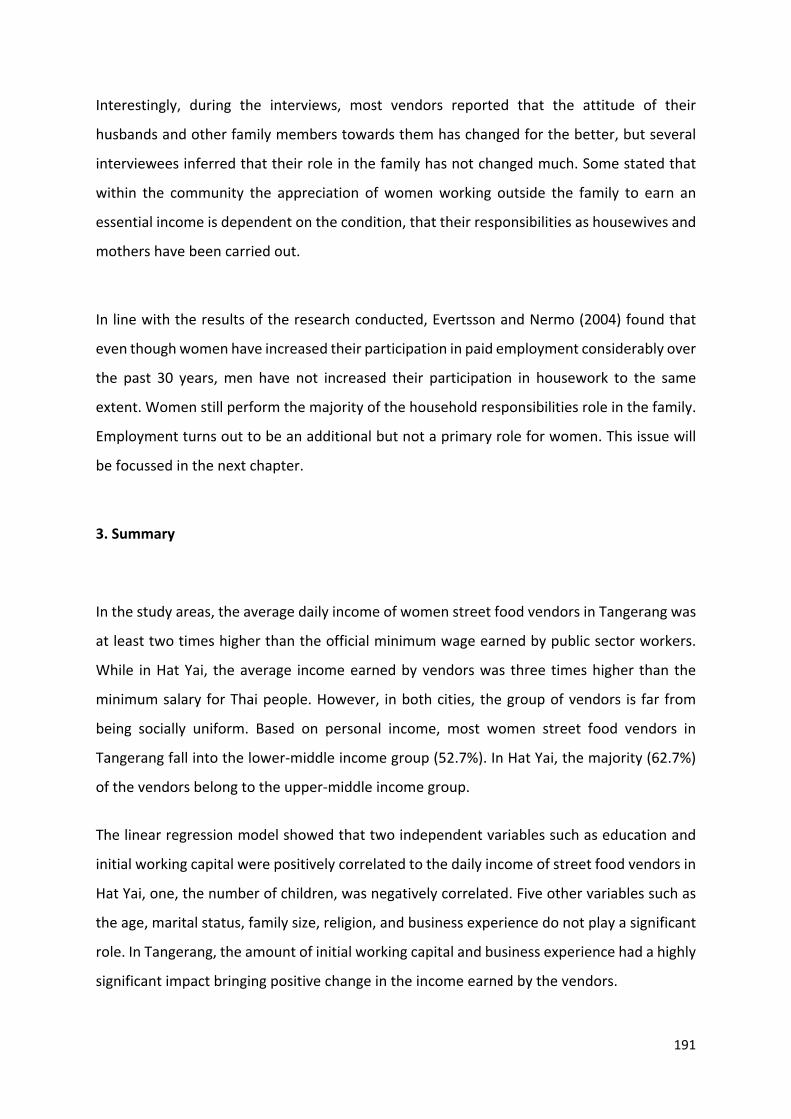
191
Interestingly, during the interviews, most vendors reported that the attitude of their
husbands and other family members towards them has changed for the better, but several
interviewees inferred that their role in the family has not changed much. Some stated that
within the community the appreciation of women working outside the family to earn an
essential income is dependent on the condition, that their responsibilities as housewives and
mothers have been carried out.
In line with the results of the research conducted, Evertsson and Nermo (2004) found that
even though women have increased their participation in paid employment considerably over
the past 30 years, men have not increased their participation in housework to the same
extent. Women still perform the majority of the household responsibilities role in the family.
Employment turns out to be an additional but not a primary role for women. This issue will
be focussed in the next chapter.
3. Summary In the study areas, the average daily income of women street food vendors in Tangerang was
at least two times higher than the official minimum wage earned by public sector workers.
While in Hat Yai, the average income earned by vendors was three times higher than the
minimum salary for Thai people. However, in both cities, the group of vendors is far from
being socially uniform. Based on personal income, most women street food vendors in
Tangerang fall into the lower‐middle income group (52.7%). In Hat Yai, the majority (62.7%)
of the vendors belong to the upper‐middle income group.
The linear regression model showed that two independent variables such as education and
initial working capital were positively correlated to the daily income of street food vendors in
Hat Yai, one, the number of children, was negatively correlated. Five other variables such as
the age, marital status, family size, religion, and business experience do not play a significant
role. In Tangerang, the amount of initial working capital and business experience had a highly
significant impact bringing positive change in the income earned by the vendors.
192
The livelihood analysis revealed that vendors in the study areas – especially in Tangerang – at
present, have significantly improved their physical, social and financial capital assets as
compared to when they started the street food business. It has been found that most of the
capital assets have increased in terms of access to assets after engaging in street food
vending. Based on these findings, it is clear that the livelihood of the vendors in Tangerang
currently operating in the street food sector has improved from poor to good. In Hat Yai this
change to the better was less visible, as the vendors in this city started their business from a
higher material level. The findings for the monthly savings have to be treated with caution, as
in both cities only half of the total respondents provided useful information. Nearly half of
the vendors in Tangerang send cash remittances to their place of origin, while in Hat Yai, due
to the proximity of their birthplaces, one fifth (19.1%) send remittances.
Finally, the study highlighted that the street food vendors in Hat Yai and Tangerang contribute
significantly to the household’s capacity to cope with basic needs. 39% of the vendors in
Tangerang and 42,8% of the vendors in Hat Yai were the sole breadwinners, an additional
number have become the main breadwinners due to low and volatile incomes of their
husbands. Accordingly, in terms of social capital, the study found out, that equally in the two
cities, the vendors’ reputation has sharply increased in the eyes of the families and
communities since they started to trade the street food business.

193
CHAPTER VIII
Gender (In)equality: Household Division of Labour in the Family
The street food sector has acquired great significance over the years as a source of
employment and livelihoods for an increasing number of people. As seen in the previous
chapter, in Tangerang as well as in Hat Yai, on average women vendors earn enough money
from this business to meet their families’ expenses. Ironically, in spite of the growing
involvement of women in the labour market, families and communities, as mentioned in the
previous chapter, are still expecting that, even in single‐income households, women should
spend more time on household chores, despite working the same hours as men or even more.
In other words, the division of roles within a family is being expected to remain unequal for
women. These expectations have been researched extensively in recent years, but there has
been a lack of focus on the reality of housework allocation and gender in(equality) in the
families, especially in those households whose members are participants of informal
economies. Therefore, this chapter examines the gendered distribution of housework and
childcare in Tangerang and Hat Yai, particularly in the street vendors’ households.
1. Types of Family Structures
The phrase ‘family’ can be defined differently, but families in Southeast Asia are generally
categorized into four types which include single, nuclear, extended and other families (Hsu,
2008). As the main objective of this chapter is to explore gender division of household labour
between married couples or co‐inhabitants, this section analyzes nuclear and extended
families of the women vendors. A nuclear family is defined by traditional family structure
which consists of two elders i.e. parents and their children. It is often referred to as the
‘immediate family’. Extended family structure consists of two or three generations of
relations living in the same home. This family includes many relatives living together and
working towards common goals, such as raising the children and keeping up with the

194
household duties. Many extended families include grandparents, husbands of sisters and
wives of brothers, aunts, uncles, nieces and nephews (Bilton et. al., 1996).
Table 8‐1. Distribution of nuclear and extended families in Tangerang and Hat Yai (in %)
Type of family Tangerang n=200
Hat Yai n=96
Single family 5.5 16.7
Nuclear family 80.5 52.2
Extended family 13.5 21.7
Other family 0.5 9.4
Total 100.0 100.0 Source: Field work conducted 2017‐2018; own compilation
In Tangerang, the study shows that nuclear family households comprise up to 80.0% of all
families. This variety is also the most common family type in Hat Yai (52.2%) (Table 8‐1).
Compared to Tangerang (13.5%), Hat Yai is the home to more extended families (21.7%). This
suggests that there are more Thai couples living with their parents or parents‐in‐law than
Indonesian couples. The results have indicated that more women in Tangerang leave their
parents' home in the village, particularly at the time of marriage or when entering the labour
market. In Hat Yai, many women do not necessarily leave their parents, even after marriage
because Songkhla city as the most vendors’ place of origin, is only 36 minutes away by car to
Hat Yai. This allows the vendors’ parents to commute frequently from their home to the place
of their daughters’ business.
2. Division of Household Chores
One of the most fundamental issues in society is the persistence of gender inequality, which
is further enhanced by gendered division of domestic work. Traditional societies in Asia
display a strict attitude towards the division of labour – men are the breadwinners and
women are housewives (Yeung, 2013). Similarly, Indonesian and Thai cultural norms dictate
that household chores and childcare are the domains of women whilst economic
responsibility falls upon men. Traditionally, Thai fathers have been expected to assume the

195
role of leader, protector and provider for the family, whereas Thai mothers are expected to
be housewives who are also responsible for child rearing (Yoddumnern‐Attig, 1992).
Culturally, in Indonesia, the gender ideology depicts women with more significant roles in
housework activities, such as serving their husbands, raising children and managing
households, while men are more dominant in economic or productive activities (Eddyono et
al., 2016; Herawati et al., 2019).
In general, the unequal distribution of domestic work is confirmed by the data of this study
locations. Table 8‐2 and Table 8‐3 indicate the percentage of division of labour among women
street food vendors in Tangerang and Hat Yai for each of the household activities, including
shopping, preparing meals, washing, cleaning, repairing clothing, taking care of and raising
children. These duties are often done in the scope of the nuclear family and by other family
members, who do not have an important role in financial contribution to family.
Table 8‐2. Management of different household responsibilities in Tangerang (in percentage, n=19020)
Responsibility by Child care Cooking Washing Cleaning Grocery shopping
Yourself (vendor) 81.6 90.5 84.7 81.1 80.5
Husband 39.5 14.2 16 23.2 35.5
Any member in house 5.8 3.2 4.2 6.3 3.2
Daughter/son 2.1 4.2 13.7 17.4 6.3
Mother 79 1.1 1.6 2.1 1.6
Sister 0.5 0.5 1.6 1.6 1.6
Other 5.8 4.7 5.3 3.2 1.6 Source: Field work conducted 2017‐2018; own compilation; multiple answer is possible
20 Single vendors (10 respondents) were excluded from this question. Multiples answers are possible.

196
Table 8‐3. Management of different household responsibilities in Hat Yai (in percentage, n=7421)
Responsibility by Child care Cooking Washing Cleaning Grocery shopping
Yourself (vendor) 94.1 93.2 89.2 89.2 89.2
Husband 64.7 39.2 48.6 52.7 51.4
Any member in house 2.7 5.4 10.8 9.5 1.4
Daughter/son 1.4 1.4 4.1 2.7 2.7
Mother 4.1 1.4 0.0 0.0 0.0
Sister 0.0 0.0 0.0 0.0 0.0
Other 0.0 0.0 0.0 0.0 0.0 Source: Field work conducted 2017‐2018; own compilation; multiple answer is possible
2.1. Nuclear Families
The data in Table 8‐2 shows that women street food vendors in Tangerang are performing the
majority of the household chores, despite them working outside the home. Household chores
include cooking (90.5%), washing (84.7%), child care (81.6%), cleaning (81.1%) and grocery
shopping (80.5%). Men (husbands) lend their wives a helping hand but the rate of men
carrying out these chores themselves is very low, for example, only 14.2% assist in cooking,
35.5% buy foodstuff, 16.0% help with laundry or washing clothes and 39.5% contribute to
child care. Similar to the household responsibilities of women street food vendors in
Tangerang, household chores division among dual earner couples in Hat Yai is segregated by
gender (Table 8‐3). However, male participation reaches a considerably higher degree than in
Tangerang.
In Tangerang, wives perform the routine and the more mundane and time‐consuming
household chores such as laundry, cooking and washing dishes, while their husbands carry
out chores which require less time and are more enjoyable such as childcare and grocery
shopping. One vendor aged 46 years, Ibu Ria, a mother of four children confirms: “My
husband helps me take care of our children, such as playing or doing activities with the kids
21 Single vendors (22 respondents) were excluded from this question. Multiple answers are possible.

197
when I do some laundry or clean of the house. He did that responsibility when he was at
home.” In Hat Yai, however, the husbands’ under‐performance in washing and cleaning is less
visible.
Before the presented results (Table 8‐2 and Table 8‐3), it is clear that women street food
vendors in Tangerang and Hat Yai perform more household chores than their male partners,
regardless of their working hours and the income they earn outside the household. These
findings are in line with previous studies conducted in many Asian countries. For instance, in
Japan, husbands’ participation in vendors’ households has been low and has not increased
much during recent years. The division of housework is rigidly gendered as wives undertake
the vast majority of housework, even when they work outside the household (Zuo and Bian,
2005; Iwai and Yasuda, 2011; Rengo‐Rials, 2009 as cited by Fuwa, 2015). Fuwa found that the
majority of married women in China performed two‐thirds of the housework. Husbands’
contribution to housework in Korea is also minimal by spending a mere 4.5 hours on
housework per week, while their wives contributed 15.7 hours per week. Similarly, women in
Taiwan report that they perform 72.0% of housework, while their husbands contribute only
28.0% (Hu and Kamo, 2007). Luke et al. (2014) conducted a study on Indian women
breadwinners working on tea plantations and found that when husbands earned less than
wives, men participated to a lesser extent in domestic chores. This is also consistent with
Hook (2006); Knudsen and Warness (2008); and Claffey and Mickelson (2009), that reported
that North American women are responsible for about two thirds of routine household tasks
with cooking and cleaning being two of the most time‐consuming tasks.
Interestingly, although most women street food vendors perform the majority of the
housework, many women in Tangerang and Hat Yai perceive their share of housework to be
fair, even when they assume a disproportionately larger share of work than their husbands.
Open disagreement over housework between husbands and wives rarely occurs. This
suggests that culturally prescribed roles of men as breadwinners and women as housekeepers
influence wives’ judgments on their own and their husbands’ responsibility for housework.
Ibu Wati, for instance, admitted that she was responsible for household chores and child care
at home and she feels that the responsibility is not a problem for her:

198
“As a wife and mother, I have to be able to take care of all household works. I therefore take care of the children, see to their homework, their extramural activities, I cook every day and
see to the dishes in the evenings.When the house help is not around, I clean the house with the help of my children. I do all household works and trading from morning to night nonstop.
I cannot expect husband's help for domestic works. He works outside the city. He comes home once a week. Although he was at home, he did not do household works. I never forced
him to help me.” By contrast, the Hat Yai vendor Pee Kasnawati reported that her husband is aware that she is
the backbone of the family in earning money for the family. Highlighting the ideal of an “equal
partnership” this Muslim wife explained in detail:
“My husband and I take turns in cooking, grocery shopping, cleaning the house and other
houseworks. When I’m busy, he takes over all household duties. When he is busy, I do likewise. We have an equal partnership. Even though I help him to make money for our
family, I am still aware of my position as a wive and housewive. I have never felt unfairly treated by him in matters of household work.”
In order to find out if there are any predictable patterns of husbands’ participation and non‐
participation, correlations with basic demographic data were tested. In the literature, some
of them, especially education, religion and sometimes ethnicity are assumed to play a decisive
role. Because of the differences in the ethnic and religious composition, the tests were
conducted for each city separately.

199
Table 8‐4. Correlation between religion, ethnic affiliation, age, education level, number of children with household works responsibility of vendors and their husband in Hat Yai
Variables
Shopping responsibility by
Childcare responsibility by
Cooking responsibility by
Washing responsibility by
Cleaning responsibility by
Vendor Husband Vendor Husband Vendor Husband Vendor Husband Vendor Husband
Education
Pearson Correlation .142 .109 .206 .285 .110 ‐.032 .103 .442 .065 .074
Sig. (2‐tailed) .229 .357 .092 .018** .353 .784 .382 .000** .585 .532
N 74 74 68 68 74 74 74 74 74 74
Ethnic Affiliation
Pearson Correlation ‐.029 ‐.146 ‐.027 .072 .141 ‐.220 .183 ‐.051 .077 ‐.028
Sig. (2‐tailed) .809 .216 .825 .562 .230 .060 .119 .663 .514 .810
N 74 74 68 68 74 74 74 74 74 74
Number of
children
Pearson Correlation .040 .143 .164 ‐.036 ‐.035 .005 ‐.158 ‐.164 ‐.092 ‐.083
Sig. (2‐tailed) .733 .223 .180 .769 .765 .969 .178 .163 .435 .480
N 74 74 68 68 74 74 74 74 74 74
Religion
Pearson Correlation ‐.087 ‐.188 .068 ‐.115 ‐.012 ‐.056 ‐.087 ‐.090 ‐.177 ‐.042
Sig. (2‐tailed) .459 .108 .581 .348 .919 .638 .459 .444 .131 .721
N 74 74 68 68 74 74 74 74 74 74
Age
Pearson Correlation .182 ‐.130 .069 .084 .018 .026 .043 ‐.074 ‐.015 ‐.096
Sig. (2‐tailed) .120 .269 .575 .496 .876 .825 .715 .532 .900 .415
N 74 74 68 68 74 74 74 74 74 74
**Correlation is significant at the 0.01 level (2‐tailed) Source: Field work conducted 2017‐2018; own compilation

200
Table 8‐5. Correlation between religion, ethnic affiliation, age, education level, number of children with household works responsibility of vendors and their husband in Tangerang
Variables
Shopping responsibility by
Childcare responsibility by
Cooking responsibility by
Washing responsibility by
Cleaning responsibility by
Vendor Husband Vendor Husband Vendor Husband Vendor Husband Vendor Husband
Education
Pearson Correlation ‐.110 .041 ‐.040 .134 ‐.111 .007 ‐.069 ‐.063 ‐.054 ‐.035
Sig. (2‐tailed) .131 .571 .582 .066 .127 .928 .345 .387 .456 .633
N 190 190 190 190 190 190 190 190 190 190
Ethnic Affiliation
Pearson Correlation .021 .102 .022 .016 .062 .052 .096 .115 .070 .059
Sig. (2‐tailed) .770 .161 .767 .824 .396 .475 .187 .115 .337 .417
N 190 190 190 190 190 190 190 190 190 190
Number of
children
Pearson Correlation .000 ‐.020 .025 ‐.189 ‐.009 ‐.206 .014 ‐.003 .018 .053
Sig. (2‐tailed) .995 .785 .734 .009** .900 .004** .848 .966 .808 .464
N 190 190 190 190 190 190 190 190 190 190
Religion
Pearson Correlation ‐.040 .116 ‐.072 ‐.004 ‐.084 ‐.004 .037 ‐.010 .014 .004
Sig. (2‐tailed) .584 .110 .327 .961 .249 .953 .610 .889 .843 .958
N 190 190 190 190 190 190 190 190 190 190
Age
Pearson Correlation ‐.058 ‐.087 .055 ‐.071 ‐.004 ‐.110 ‐.047 ‐.045 .010 .040
Sig. (2‐tailed) .430 .233 .453 .333 .953 .131 .520 .539 .893 .588
N 190 190 190 190 190 190 190 190 190 190
**. Correlation is significant at the 0.01 level (2‐tailed). Source: Field work conducted 2017‐2018; own compilation

201
Table 8‐4 shows that in Hat Yai, most demographic features, with the exception of the
education level, do not correlate with the distribution of domestic works among wives and
husbands. The correlation between the education level of the vendors (wives) and childcare
and washing responsibilities of the husbands’ gave Pearson Correlation Coefficient (r) values
of 0.285 and 0.442, respectively, which indicates a moderate positive association between
the variables. Also, the P value of the association were 0.018 and 0.000, thus indicating a
highly significant result. This positive correlation suggests that the vendors are able to discuss
sharing the duties of domestic work with their husbands, especially childcare and washing.
Not surprisingly, the Hat Yai vendor Pee Kasnawati, quoted above, holds a university degree.
According to UNFPA (2015), today, the family structure in Thailand is changing ‐ the average
number of children in families has declined and the number of people living alone is
increasing. With more women holding a university degree, this advantage may offer greater
efforts to support gender equality within families, in particular for sharing domestic work
between men and women. These findings are In line with previous studies in Vietnam
(Teerawichitchainan, 2013), Lusaka’s Libala, Zambia (Mutinta, 2015), Japan, South Korea, and
the United States (Tsuya et al., 2000), which found that educated women might be able to
negotiate with their partners to accomplish an equally shared workload.
From the bivariate analysis, as seen in the Table 8‐5, the husbands’ participation in the
domestic works in Tangerang did not display any correlation with the demographic variables
except of the number of children, which for Hat Yai is not significant. The Pearson’s r for the
correlation between the number of children and household responsibility of child care and
cooking of husband’s vendors in Tangerang in our observations are 0.09 and 0.04 (p < .001
for a two‐tailed test). It was found that when the number of children in the household
increases, the frequency of the fathers’ participation in childcare work and cooking chores
decreases.
202
These findings are supported by Presser (2003) and Killewald (2011), who reported that in the
United States households with one or more young children, the division of domestic labour is
particularly unequal. When there are older children in the household, especially girls, families
with many children due to the culture in Indonesia, traditionally impart some of the burden
of childcare of younger siblings upon the older siblings. In this study, it was seen that the more
children the vendors have, the participation of husbands in childcare and cooking was
reduced, especially when there are older children present to carry out household work.
However, even if there are adolescent girls in the family, many respondents reported that a
large share of the day‐to‐day parenting responsibilities still falls upon wives because they
have to teach the children how to perform household chores as they would be required to do
the same when they get married. Ibu Ria, a mother to four children, is completely aware of
this fatal shift: When it's a weekday, I almost do all the household works and childcare. When
there are older children, like my first son, who can take care of his younger siblings, my
husband slightly decreases his participation in domestic labor.”
In Table 8‐6, Chi‐square statistic was used to examine the relationship between the vendors’
husband’s employment status (employment – unemployment) and their participation in
domestic works. Not surprisingly, the results show that unemployed husbands in Tangerang
(53) and Hat Yai (9) tend to feel a greater degree of household responsibility than husbands
who have a job. However, Table 8‐6 presents that in Tangerang nothing but a higher
inclination to participate in childcare and cooking is statistically significant (p < .050), while in
Hat Yai unemployed husbands are even willing to do more “unpleasant” works like washing
and cleaning.
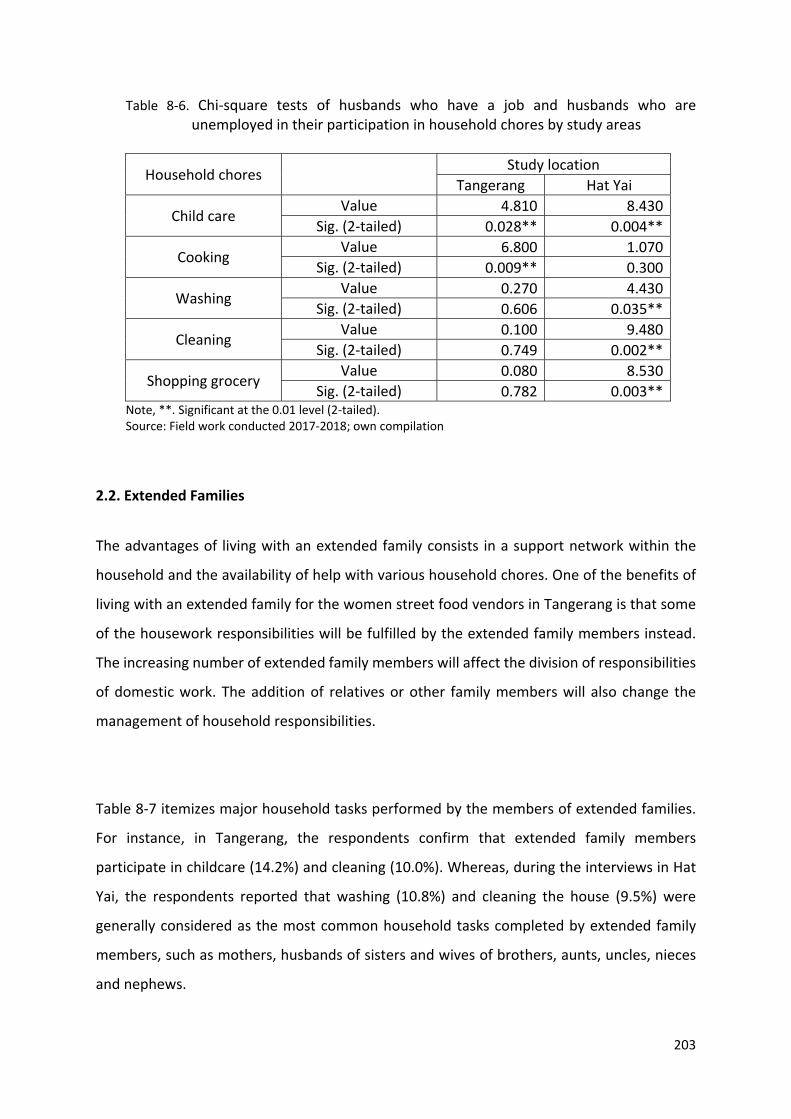
203
Table 8‐6. Chi‐square tests of husbands who have a job and husbands who are unemployed in their participation in household chores by study areas
Household chores Study location
Tangerang Hat Yai
Child care Value 4.810 8.430
Sig. (2‐tailed) 0.028** 0.004**
Cooking Value 6.800 1.070
Sig. (2‐tailed) 0.009** 0.300
Washing Value 0.270 4.430
Sig. (2‐tailed) 0.606 0.035**
Cleaning Value 0.100 9.480
Sig. (2‐tailed) 0.749 0.002**
Shopping grocery Value 0.080 8.530
Sig. (2‐tailed) 0.782 0.003** Note, **. Significant at the 0.01 level (2‐tailed). Source: Field work conducted 2017‐2018; own compilation
2.2. Extended Families
The advantages of living with an extended family consists in a support network within the
household and the availability of help with various household chores. One of the benefits of
living with an extended family for the women street food vendors in Tangerang is that some
of the housework responsibilities will be fulfilled by the extended family members instead.
The increasing number of extended family members will affect the division of responsibilities
of domestic work. The addition of relatives or other family members will also change the
management of household responsibilities.
Table 8‐7 itemizes major household tasks performed by the members of extended families.
For instance, in Tangerang, the respondents confirm that extended family members
participate in childcare (14.2%) and cleaning (10.0%). Whereas, during the interviews in Hat
Yai, the respondents reported that washing (10.8%) and cleaning the house (9.5%) were
generally considered as the most common household tasks completed by extended family
members, such as mothers, husbands of sisters and wives of brothers, aunts, uncles, nieces
and nephews.
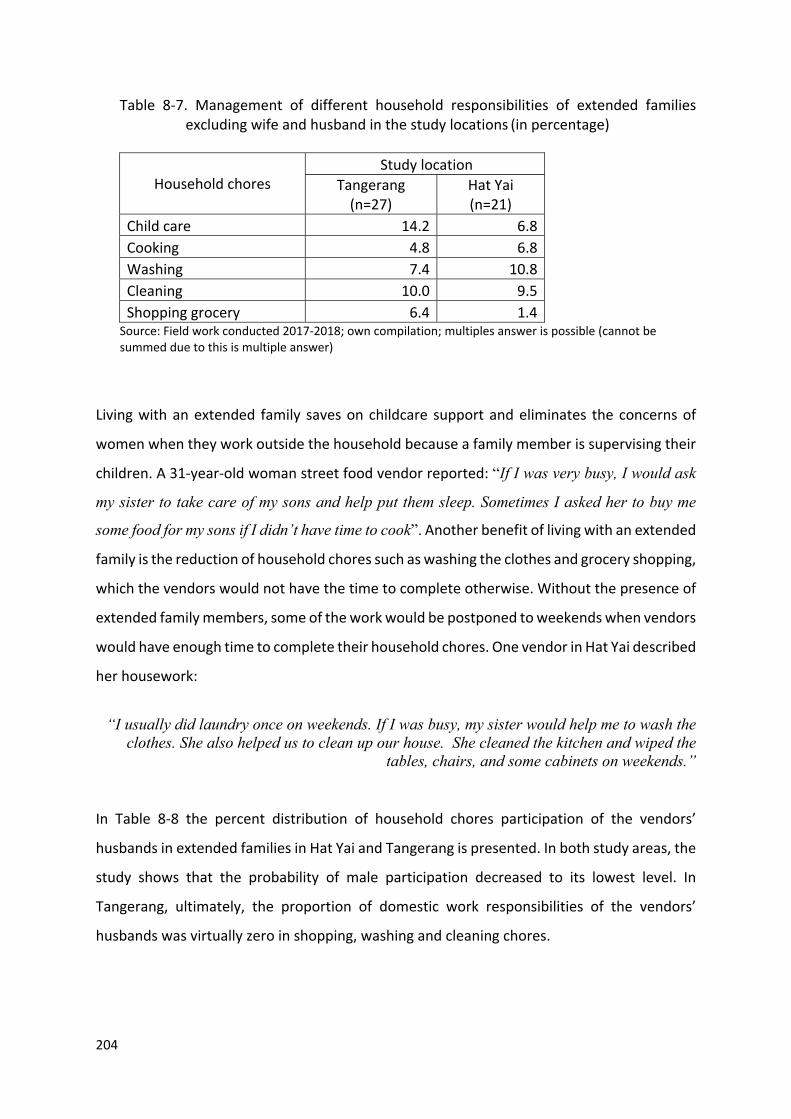
204
Table 8‐7. Management of different household responsibilities of extended families excluding wife and husband in the study locations (in percentage)
Household chores Study location
Tangerang (n=27)
Hat Yai (n=21)
Child care 14.2 6.8
Cooking 4.8 6.8
Washing 7.4 10.8
Cleaning 10.0 9.5
Shopping grocery 6.4 1.4 Source: Field work conducted 2017‐2018; own compilation; multiples answer is possible (cannot be summed due to this is multiple answer)
Living with an extended family saves on childcare support and eliminates the concerns of
women when they work outside the household because a family member is supervising their
children. A 31‐year‐old woman street food vendor reported: “If I was very busy, I would ask
my sister to take care of my sons and help put them sleep. Sometimes I asked her to buy me
some food for my sons if I didn’t have time to cook”. Another benefit of living with an extended
family is the reduction of household chores such as washing the clothes and grocery shopping,
which the vendors would not have the time to complete otherwise. Without the presence of
extended family members, some of the work would be postponed to weekends when vendors
would have enough time to complete their household chores. One vendor in Hat Yai described
her housework:
“I usually did laundry once on weekends. If I was busy, my sister would help me to wash the
clothes. She also helped us to clean up our house. She cleaned the kitchen and wiped the tables, chairs, and some cabinets on weekends.”
In Table 8‐8 the percent distribution of household chores participation of the vendors’
husbands in extended families in Hat Yai and Tangerang is presented. In both study areas, the
study shows that the probability of male participation decreased to its lowest level. In
Tangerang, ultimately, the proportion of domestic work responsibilities of the vendors’
husbands was virtually zero in shopping, washing and cleaning chores.

205
One of the respondents, Ibu Cawi, 49 years old with four children all of them married, is
completely aware of this fatal association and gives an explanation:
“My daughter-in-law stops my husband from performing household chores because there are a lot of people at home and she cannot just sit watching him perform household chores. It is
disrespectful, she said.”

206
Table 8‐8. Husband's participation in household chores in extended families (how many in HY and Ta) in the study locations (in percentage)
Study location
Husband involvement in household chores
Childcare Cooking Washing Cleaning Shopping
Not involved
Involved Not
involved Involved
Not involved
Involved Not
involved Involved
Not involved
Involved
Hat Yai
52.4
47.6
66.7
33.3 61.9 38.1 61.9 38.1 71.4 28.6
Tangerang
92.6
7.4
92.6
7.4 96.3 3.7 100.0 0.0 96.3 3.7 Source: Field work conducted 2017‐2018; own compilation
207
3. Methodological Reservations
Although the methods employed in this chapter are in complete accordance with those
proposed in the literature, readers will recall that the research questions asked wives to report
whether husbands ever "helped" in their households. The researcher did not do the cross‐
check with the husbands. Furthermore, to possibly counter‐balance husbands’ meagre
involvement in household chores, attention should be re‐attracted to the helpful role
husbands played in the business startup process. In Tangerang with a marriage rate of 87,5 %
exactly 58,6 % of the vendors claimed they got assistance from their husbands, while in Hat
Yai with a marriage rate of 66,7 % it was 44,2 % (see Chapter V, Table 5‐6). 21,5 % of the
women in Tangerang and 15,6% in Hat Yai received money from their husbands to start their
business (see Chapter VI, Table 6‐3).
Referring to their current business, most of the women reported that they have gained
enough self‐confidence to run their business without anyone’s help. However, many vendors
stated as well, that their husbands continued to provide support. Husband were often
reported to help in subordinate business activities, such as transporting equipment, pushing
food carts to the sales location, and cleaning up the location. According to the interviews, this
is mainly done by husbands who are unemployed. Unfortunately, systematic information
about husbands’ support in the current business was not obtained, since these questions were
not included in the questionnaire. At least, this study found out (cf. Tables 7‐20 and 7‐21) that
there is no significant difference in the economic performance of vendors with employed and
unemployed husbands. So, on average the contribution of the latter to the economic business
success may be deemed marginal.
4. Summary
The study shows that the participation of men in household chores is slightly increasing in
both Hat Yai and Tangerang, but women still continue to perform most of the household work.
Women street food vendors worked more than their husbands to complete all household
chores while their husbands’ level of involvement was very low, especially in routine chores

208
such as washing and cleaning. The results are perhaps not surprising due to the traditional
cultures of Indonesian and Thai people that view housework as the primary responsibility of
women.
However, the study revealed that in Hat Yai, the education levels of wives are an important
factor that may encourage husbands’ involvement in household labour, particularly in
childcare. Not surprisingly, in both cities, unemployed husbands tend to do more domestic
work than husbands with a job. In Hat Yai these husbands were inclined to be engaged in even
less enjoyable work such as cleaning and washing. In Tangerang, extended families and a
growing number of children were found to be a barrier to sharing housework and parenting
responsibilities equally with husbands. In these family types the distribution of labour for
shopping, cleaning and washing was least balanced.
The overall conclusion drawn for the management of housework responsibilities in Tangerang
and Hat Yai is that women are still more involved in carrying out domestic works and childcare
than their male partners, no matter if they have an endless working day and their income
generated from a job outside the household qualifies them as the main or even the sole
breadwinner.
209
CHAPTER IX
Conclusion and Recommendations
1. Hypotheses and Conclusions
This study investigates the role of women migrant street food vendors as breadwinners for
their families in their capacity to improve family livelihood. Tangerang in Indonesia (Banten
province) and Hat Yai in Thailand were selected as study locations because in these two cities
the numbers of street food vendors have been rapidly increasing since the last economic crisis
in 2007. The rising numbers of street vendors can be qualified as an ambivalent component
of a long‐lasting economic recovery, characteristic for both cities after the deep crisis. This
study has been based on the responses to a common questionnaire given by the study groups
in the two cities and on in‐depth interviews with 20 street food vendors selected according to
special criteria (see chapter II). Accordingly, in this study the "triangulation" research approach
was adapted in which survey questionnaires, personal interviews (biography interviews) and
observations of the researcher were used to collect data. In both study sites, street food
business is an important source of income for families. As the study confirmed, this business
contributes to the local and national economy, creates jobs, reduces unemployment rates and
offers convenience for customers to get food at affordable prices.
This study was conceived to analyse street food business with respect to the assumption, that
street food vending as an essential part of the informal economies has a certain capacity to
solve economic problems in a special group of persons representing a global trend in Less
Developed Countries (LDSs): the flow of rural‐urban migration. One of the reasons to select
Hat Yai and Tangerang as study locations, was the attraction, they have wielded on rural
dwellers because of the economic prosperity in both cities. Nowadays many migrant street
food vendors from different parts of the two countries – Indonesia and Thailand – are gaining
a living in these locations. The selection of respondents was based on the criteria that (i)

210
women migrants lived and worked as street food vendors in Tangerang and Hat Yai cities and
that (ii) they conducted their business as self‐employed persons. To conceptualize the study
aims, ten hypotheses were formulated in accordance with widespread studies on the street
food business in various parts of the world.
Hypothesis one: Economic factors are the main inducement for women street food vendors‘ migration.
This hypothesis has in general been supported by this study. More than 50.0% of the street
vendors in Hat Yai and Tangerang stated that they left their regions of origin because of
economic factors. Poverty and the inability to earn enough to support a herself/himself or a
family have been the main reasons behind the movement of migrants from their place of
origin (villages) to their destination (urban areas). On both study sites, interviewees
complained that labour demand in rural areas was confined to the agricultural sector. The
wages paid were too low to sustain a family and job insecurity was deemed high in this sector.
The vendors in the study sites who sought economic opportunities found that the street food
sector was an attractive alternative to pursue.
However, for most of the respondents, engagement in the street food business was not their
first option. Some succeeded in finding a job in the formal sector, others (especially young
migrants in Thailand) started their professional career as a housemaid, some of the migrants
(especially in Tangerang) found their first job in other street vending sectors. A smaller group
of vendors revealed that Hat Yai and Tangerang respectively was not the first station in their
migration biography. A strong minority, 27.5% and 15.8% of women street food vendors in
Tangerang and Hat Yai, respectively, reported that in the beginning they simply followed their
husbands, and they developed their own career plans only later. This may imply that economic
reasons were crucial even in this case. However, these cases, as mostly neglected in previous
studies, deserve further examination.
Hypothesis two: Women street food vendors are poorly educated and sometimes even illiterate.

211
This hypothesis has only partially been supported by this study. Admittedly, most of
respondents have been poorly educated and most of them were lacking special skills when
they entered street food business. However, cases of illiteracy are completely absent.
Admittedly, for people in the main working age (21‐50 years) as it is the majority of the
vendors who do not have certain skills, a job in the formal sector seems to be almost
unattainable. This problem has become predominantly visible in the Tangerang sample.
However, the majority of street food vendors in Tangerang found a way to cope with the
shortcomings of their low standard in formal education. Those who do not have high formal
education often only rely on previous work experience or learning by doing.
Most important, the study revealed large differences in education levels between street
vendors in the study sites (p <0.01). When comparing the study locations, women street food
vendors in Hat Yai showed a higher level of education than their counterpart in Tangerang (p
<0.01). The study found that 65.0% of the total street vendors in Tangerang have lower
secondary education, while 60.0% of traders in Hat Yai have high secondary education or even
college/university. This shows that in Thailand people with higher education did not consider
themselves to good for pursuing a business in the street food sector. These findings are not
completely in line with previous studies emphasizing the vendors’ low standard in formal
education or even illiteracy. Furthermore, the findings of this study are not irrelevant for the
recommendation of strategies aimed at the improvement of people’s situation in the street
food business.
Hypothesis three: Street food vendors regard their business not as a temporary makeshift,
but as a long‐term breadwinning strategy.
This hypothesis has fully been endorsed by this study. The street food sector offers temporary
and long‐term survival strategies for the persons and families involved. The study found that
most vendors in both areas have been in the street business for more than nine years. These
results indicate that street vendor business activities are no longer a side job. However, a
certain ambiguity remains: On the one hand, the long duration of being a street vendor may

212
underline that street vendors can provide sufficient income for their families, on the other
hand, it indicates that (at the moment) there are no better jobs available. Apparently,
however, most of the vendors are not searching for an alternative employment. In the
biographies of some of the vendors the reverse story was told. When asked for the reasons
why they opted for the street food business as their main occupation they reported that they
quitted their formal jobs and chose the business, because the appreciated the flexibility, the
independence and the income enjoyed in this business.
Hypothesis four: As an inherent part of the informal economy, street food business is exposed
to various elements of uncertainty and insecurity.
This hypothesis has fully been confirmed by this study. The main problem faced by the vendors
is related to location. Concerning the vending location, the study found that nearly half of the
vendors in Tangerang locate on pavements and pedestrian paths. In a majority of cases these
locations have not been legalised since the spaces were not available for trade and were not
allocated by the local authorities. Especially in Tangerang many spaces are considered
temporary and eviction occurs at the will of urban authorities. Local neighbourhood
committees fill the gap and offer “protection” in exchange for a “fee” to a local thug. However,
unlike Tangerang, 24.0% of Hat Yai’s vendors operate their business in government market
stores and they pay monthly rental fees to the local government.
Across the two cities, access to infrastructures, such as access to toilets, garbage collection,
electricity and running water was considered to be one of the pressing problems because the
vendors depend on electricity and water to prepare cooked foods. However, from the
observations, most street food vendors are relatively satisfied with infrastructure conditions.
This satisfaction, however, reflects a considerable unawareness of basic hygiene issues.

213
Hypothesis five: A lack of access to loans is the major obstacle in the start‐up process.
In accordance to hypothesis five, this study found out that many of the vendors in Tangerang
and Hat Yai failed to get loans from formal banking institutions. Street food vendors
experienced difficulties in applying for loans to formal banking institutions due to several
factors, such as high interest rates; complex application procedures; inability to meet
collateral requirements; and / or inadequate financial records. As a result, only 4.2% of the
vendors in Hat Yai and 3.5% of the vendors in Tangerang managed to gain loans from banks.
However, most of the vendors found alternative ways of reacting to this uncomfortable
situation (see following hypothesis). In line with the literature, it was found, that many
vendors used their savings as a startup capital. Insofar, hypothesis five may have been
falsified, as the lack of financial resources did not really stop the vendors from starting their
business. However, two major reservations have to be made: this study because of its special
layout did not reveal how many startup attempts may have failed in the very beginning
because of a lack of capital. Furthermore, as revealed in chapter VII (see hypothesis eight), the
lack of initial working capital due to a lack of access to formal banking institutions can have a
strong long‐term impact on the actual performance of the street food business.
Hypothesis six: Family support is pivotal for the decision to migrate, the start‐up process and
the continuation of the business.
This hypothesis has been fully approved by this study. When the vendors migrated to
Tangerang or Hat Yai, many of them relied on support by families and friends in the process
of migration. Family support to vendors continued to flow when they decided to become
entrepreneurs as street food vendors. 70.4% of the vendors in Tangerang and 62.4% of the
vendors in Hat Yai’s confirmed to have got support from their family members such as their
husbands, children and parents when they started the street food business. This support
included providing information and ideas how to run the business, how to find financial
resources and an adequate business location. Several husbands produced the first cart, when
their wives started their business. The support provided by family members can be considered
as a continuous encouragement for vendors to run their business. Accordingly, family support
214
has been a special item highlighted by previous studies. Moreover, in this study the vendors’
friends have also been identified as a source of inspiration, motivation and material support
when the women started the business. 18.3% of Hat Yai’s vendors, but only 9,3% of the
Tangerang vendors received this kind of support. As this group found less attention in previous
studies, further research should be encouraged.
Hypothesis seven: The income gained from street food business is on average above the
national Minimum Wages set in the formal economies.
This hypothesis has generally been approved by this study. In line with previous studies, most
respondents knew exactly how much they earned on average and they did not hesitate to
inform the researcher about their income. On this basis it has been calculated that enterprises
operating in Tangerang had an average net income of Rp 305,839 per day ($21,5) with a
median of Rp 200,000 per day ($14,3), while the daily average net income from food vending
activities in Hat Yai was 1,440 baht ($45,2) with a median of 1,000 baht ($33,3). The inequality
of the average income between vendors in Tangerang and Hat Yai presents the unequal level
of welfare among vendors in the study sites to be discussed in the following subchapter 2
(similarities and differences).
In both cities street food vendors operated on average 25 days per month. In Tangerang based
on the Governor’s of Banten Decree, the 2019 minimum wage has been set at Rp 3,841,368
($274,4) per month, on a 25‐days‐basis $10,98 accordingly. The average value as well as the
median are fairly above this mark. The same scenario has been found in Hat Yai city where
both values are considerably above the minimum wage based on Thailand’s Central Wage
Committee (2018), which amounts to 330 Thai Baht ($9,9} per day, on a 25‐days‐basis
accordingly $247,5. In other study areas, however, especially in some African countries, street
food vendors earn up to ten times above the minimum wage.
Although the income of a majority of vendors is located fairly above the minimum wage line,
the present study indicated that the street food sectors in both study locations have a strongly
disproportionate income distribution. In the literature, a comparable spread in the group of

215
the vendors is sometimes noted, however, a detailed examination is mostly missing. In this
study, the Gini coefficient was used to measure the amount of the disparities. On this scale,
vendors in Tangerang city have an income disparity of 0.442, while Hat Yai stands at 0.363.
The level of income disparity in Hat Yai is close to the average income disparity value of
Thailand's Gini index in 2018, which was 0.365, while the level of income disparity of street
food vendors in Tangerang is higher than the average value of Indonesia’s Gini index which is
placed at 0.381. This may have considerable consequences for future practical strategies (see
below).
Despite the income differences between the study sites, however, two third of Tangerang’s
vendors earn an income above the regional minimum wage. In Hat Yai, even 88.5% of the
vendors have a net income above the minimum wage. Unlike the business owners, paid
employees in Tangerang, according to the survey, receive a significantly lower wage than the
city’s minimum wage. Paid employees in Tangerang earn Rp 1,410,000 per month ($100.7).
While, presently, their counterpart in Hat Yai earn 8,629 baht per month (approximately
$275.6), which is almost exactly the city’s monthly minimum wage.
Hypothesis eight: The daily net income of the vendors is affected by age, marital status,
education level, number of children, religion, initial working capital and the duration of
running the business.
This hypothesis has only partially been supported by this study. As opposed to findings in
previous studies, most demographic data showed no measurable influence. For Hat Yai, linear
regression model analysis revealed that only two variables, education level and initial working
capital, have a significant influence on the vendors’ income. In the case of the Tangerang
street food vendors with lower formal education standards, initial working capital and work
experience are the factors that influence their income.
In both cities, with a larger initial capital, street food vendors can sell a variety of foods which
makes consumers more interested in buying and enhance the vendors’ income. This finding
216
retrospectively underscores the importance of credit accessibility in the initial phases of the
business (hypothesis five). The results for the sample of the Hat Yai vendors justify the
conclusion that the street food vendors with a higher level of education use to have more
effective strategies in managing, producing and marketing their products. In Tangerang,
business experience turned out to act as a kind of proxy for the factor education as it positively
affects management abilities. The regression coefficient shows that the duration of business
performance has a significant effect on the income of Tangerang food vendors. As observed
by the researcher, the vendors who have run their business for a long time are more familiar
with the taste and the behaviour of their consumers, which in turn will help increase their
income.
Hypothesis nine: The income earned in the business has a major impact on the livelihood improvement of the vendors‘ families and enables the families to accumulate money for savings and remittances.
The study showed that the vendors greatly help to improve family finances and welfare which
is completely in line with the results of previous studies. This can be seen by the increase in
asset ownership of Tangerang and Hat Yai vendor households, although the study revealed a
marked difference between the two cities. Regarding the ability of the street food vendors to
save money this study did not come to unequivocal conclusions, because in Tangerang the
number of responses to this question was slightly above the half of the sample, while in Hat
Yai it was even below. The propensity to send remittances was higher in Tangerang (nearly
half of the respondents). By contrast, in Hat Yai in the majority of cases because of the
proximity of birthplaces and actual residences the postal transfer of money was not necessary.
Hypothesis ten: According to their role as a breadwinner, the women’s position in families
and neighbourhoods has fundamentally changed.
This hypothesis has only partially been confirmed by this study. Basically, in all households’
women acted as a substantial breadwinner. 39% of the street food vendors in Tangerang and
42.8% in Hat Yai are even positioned as the sole breadwinners for their children, husbands
and sometimes extended family members living together with vendors in the same house. In

217
Tangerang 12.5% of the households were female headed because of the absence of husbands
(single, divorced, widows), in Hat Yai it was 33.4%. Furthermore, 9.4% of the Hat Yai vendors
and 26.5% of the Tangerang vendors have to cope with their husbands’ unemployment. For
the double‐headed households is was impossible to determine the exact share of the women’s
contribution to the household income. Almost all respondents both in Tangerang and Hat Yai
did not provide a response when asked about the income of their husbands. However,
according to the interviews, among those husbands who have a job, the majority are mostly
engaged in the informal sector with an insecure and low income. The conclusion seems to be
justified that most of them are earning a wage that fails to sustain the life of the family.
In the startup process, the majority of the women in the street food business experienced
almost no obstacles from their husbands, families (see hypothesis six) or the surrounding
community. Since they began running their street food business, their reputation has
increased sharply in the eyes of families and communities. Currently, the contribution of
women in the street food business activities receives appreciation from their families,
neighbours, and customers. They are completely aware that women street food vendors have
been able to improve family income and welfare. Accordingly, hypothesis ten seems to be
completely approved by the findings of this study.
However, a topic almost completely neglected by previous studies on the street food business,
sheds less comfortable light on this issue. Taking the involvement of wives and husbands in
domestic works as a reality‐test for the attitudes expressed, the results are disillusioning.
Women street food vendors use to work more than their husbands to complete all household
chores while their husbands’ level of involvement is very low, especially in routine chores such
as washing and cleaning. However, the study revealed that in Hat Yai, the education levels of
wives are an important factor that may encourage husbands’ involvement in household
labour, particularly in childcare. Not surprisingly, in both cities, unemployed husbands tend to
do a little bit more domestic work than husbands with a job. Concerning hypothesis ten as a
whole, this study comes to an ambivalent conclusion: In theory, the women’s appreciation by
families and neighbourhoods has fundamentally improved, in practice, however, the
household burdens are still heavily lying on the women’s shoulders.

218
2. Hat Yai and Tangerang: Similarities and Differences
Unsurprisingly, the street food sectors in Hat Yai and Tangerang, according to the underlying
samples, share a set of basic characteristics. The women vendors are constrained to perform
a never‐ending working day and face a high degree of uncertainty and insecurity. In the startup
process of their business they did not have access to formal bank loans. As migrants, they have
left their homes predominantly for economic reasons. As entrepreneurs they have started a
business that can no longer be regarded as a makeshift occupation, but as a long‐term option
to improve family income and welfare. Accordingly, on average, in both cities they earn net
incomes fairly above the minimum wage threshold in the formal economies of the two
countries which enables a substantial number of them to accumulate money to be saved
and/or to be sent home to the area of origin (remittances). As essential breadwinners, women
street food vendors enjoy acknowledgement and reputation in families, neighbourhoods and
among customers of the two cities. However, they are still held responsible to fulfill the lion’s
share of exhausting and tiring domestic works.
However, a closer look reveals substantial differences. In Hat Yai the vendors’ revenues are
twice as much as the revenues in Tangerang. Additionally, while in Tangerang, two third of the
vendors earn an income above the regional minimum wage, in Hat Yai it is 88.5%. In Hat Yai
even the paid workers earn slightly above the minimum wage, while in Tangerang they earn
markedly below. In Tangerang, however, the startup of the street food business contributed
much more to the improvement of family livelihoods and the enhancement of saving sums,
while in Hat Yai the gains were limited. By contrast, the husbands’ contributions to the
household chores were noticeably higher in Hat Yai than in Tangerang, especially when the
husbands were unemployed. One of the striking dissimilarities was a policy of licensing
practised by the local authorities in Hat Yai. 24.0% of the total street food vendors in the
sample very given the chance to operate in a government market store, which has greatly
contributed to an enhancement of certainty and security.

219
Can these dissimilarities be related to the basic differences of the two countries as highlighted
in the introduction chapter? It would be plausible to associate the higher income level of the
Hat Yai vendors with a generally higher income level in Thailand compared to Indonesia, as it
is known that the higher incomes correspond to an increased cost of living. Furthermore, it
would not be unlikely to roughly relate the higher degree of prosperity displayed in the Hat
Yai sample (with nearly ninety percent of the vendors above the minimum wage) to the
successes in the tourism business Thailand (including Hat Yasi) is enjoying.
Beyond such plausible, albeit rough estimates, the data generated by the questionnaire can
help to give further and more exact allocations. Hypothesis eight offers one suitable vantage
point. In both cities one economic factor significantly determined ongoing income success or
failure: the amount of startup working capital. The latter was noticeably higher in Hat Yai than
in Tangerang. That the Hat Yai vendors started from a higher level than their Tangerang
counterparts, had a negative impact on additional livelihood gains reaped for the duration of
their business (see above). However, higher sums of initial working capital were found to be
associated with ongoing higher business revenues.
Beyond this, among the factors, influencing the economic performance of the vendors,
demographic data are the most prominent. In the Hat Yai sample, for instance, economic
performance is significantly correlated with the degree of education. Therefore, the
assumption is justified that the differences to the Tangerang sample can be associated with
the basic differences in the education standard (see chapter III). However, as the Tangerang
sample shows, these differences can be offset by business experience, at least to a certain,
albeit unmeasurable degree.
Nevertheless, education turns out to be a decisive factor to explain another important
difference ‐ the higher propensity of Hat Yai husbands to contribute to the household chores.
In the economic sphere, another demographic factor may have played a role of comparable
relevance: For the Tangerang sample, the number of children was statistically (negatively)
220
significant for the income level. To recall, on average, vendors in Tangerang have 2.24 children
compared to 1.56 children in Hat Yai. In comparison, the lower number of children may also
contribute to the explanation of economic differences between the two samples. There is also
a correlation concerning the household chores: In both cities a rising number of children leads
to a growing abstinence of husbands from domestic works, therewith the drawbacks for the
Tangerang vendor wives find an additional explanation.
By contrast, on the basis of the questionnaire, the impact of political factors cannot be exactly
determined. The higher degree of certainty among the Hat Yai vendors supported by the local
authorities is in even sharp contradiction to Thailand’s ranking on the World Democracy Index
as well as on the World Corruption Index, where Thailand is placed worse compared to
Indonesia. In contrast to previous studies (Tinker, 2003; Otoo et al., 2011), religious factors
are not measurable, as well. In general, concerning the division of household chores, it would
be tempting to associate the differences between Hat Yai and Tangerang with the different
religious affiliations in the two study areas (Buddhism vs. Islam). However, in this field a
measurable outcome is produced only by a correlation with the education levels. Accordingly,
in this context, it may be less surprising that the person who argued most resolutely in favour
of an “equal partnership” model was a Muslim woman. The Hat Yai vendor Pee Kasnawati
explained in detail:
“My husband and I take turns in cooking, grocery shopping, cleaning the house and other
houseworks. When I’m busy, he takes over all household duties. When he is busy, I do likewise.
We have an equal partnership.”

221
3. Recommendations
Along with the economic development in Indonesia and Thailand, there has been a
transformation of the business sectors, shifting from agriculture to service and industry,
creating large migration flows from country to town. In this process, it is indisputable that the
street food business sector is one of the biggest absorbers of labor. The street food sector has
become the harbour for a large number of rural‐urban migrants, especially of women
migrants. Therefore, this sector deserves more serious attention from the governments in
both countries. However, it is a reality whose existence is often overlooked.
3.1. Create “Security through Partnership” on the Local Level
As this study found out in line with the international literature, the business, as part of the
informal sector, is characterized by major insecurities. Concerning the vending locations, the
study reported that nearly half of the vendors locate on pavements and pedestrian paths.
Especially in Tangerang many spaces are considered temporary and eviction occurs at the will
of urban authorities. Local neighbourhood committees fill the gap and offer “protection” in
exchange for a “fee” to a local thug. To avoid these charges, the majority of vendors in
Tangerang and Hat Yai do not have a permanent place to sell their food. These calamities will
not be overcome if there are no concrete steps taken by the authorities.
Often recommendations are directed towards the central state governments. This perception,
however, ignores major characteristics of the central state governments in most of the LEDCs.
A long‐standing experience with central state measures has shown that in many cases, central
state legislations have not been enforced in local circumstances. Certainly, it would not be
wrong to appeal to the central governments to take account of the informal sector.

222
However, it is by far more urgent to start with the immediate needs of the people involved.
So, one of the first steps to be made should be a kind of location management. But who
actually should start and take these measures? Not the central government, at least. This
study found out that in Hat Yai the local authorities have already made the first steps. Unlike
Tangerang, nearly a quarter of vendors in Hat Yai operate their business in a recently
established government market store as a kind of safe harbour. This kind of policy should be
continued in Hat Yai and immediately be started in Tangerang. It would imply a certain kind
of formalization of the informal sector. The expression used by the authorities is not
“formalizing” but “licensing”. Notably, these formalisation elements are not one‐sided, they
include a process of exchange. So, the vendors will have to pay rents to owners and fees or
even taxes to authorities in exchange of safety.
However, the establishment of a government market store in Hat Yai revealed that normally
these processes do not evolve without frictions, as in the beginning the Hat Yai vendors were
forced to leave their old vending places and were obliged to set up new ones. So, for the next
steps it would be crucial to change the atmosphere and – from the authorities’ side – to
acknowledge the vendors not as objects anymore, but as future partners. An attitude should
be generated for the future that in the past was almost absent: It is paramount to enhance or
even to create confidence between the vendors and the local authorities. This atmosphere of
confidence might be materialized by regular meetings between persons from the city council
and representatives of the vendors. Furthermore, to push back the influence of so‐called
market committees and local thugs, a plane of confidence between police units and the
vendors should be found. For instance, the police should delegate special deputies to
negotiate with the vendors’ representatives, to become their reference partners in special
situations of conflicts.
On all levels a dialogical relationship between the local governments as policymakers and
those working in the street food business should be intensified. Obviously, the activities
should not be confined to the authorities’ side. The vendors in turn, should build up union‐like
organisations to lobby their interests. A process of learning activating both sides should be
brought into action. As the study showed, hitherto, these kinds of activities have

223
fundamentally been neglected by the vendors. Admittedly, for the vendors this process of
organisation building will not be easy. There is a great deal of competition among them, and
a large number of vendors does not have a fixed place. However, a majority of them has gained
a certain level of stability in terms of finances and in terms of time of running the business.
The unions to be established should also have a look at the wages, the vendors are paying to
their employees.
3.2. Launch a Locally Based Fund to Improve Financing
Considering the limited capacity of the industrial sector and formal services in absorbing
workforce in the study sites, all sides, especially the local governments, would profit from new
economic strategies. The city representatives would have to formulate economic
development policies for the informal sector, especially for the street food sector, ideally not
as a top‐down‐process, but checked and balanced by the vendors’ representatives. One of the
major issues to be addressed by these strategies would the environmental aspects. For the
vendors, apart from a safe vending location, the access to public facilities such as current
water, electricity, garbage collection and sanitation schemes is most desirable and should be
provided by the authorities. Again, the liabilities are not just on the authorities’ side. Many
vendors claim they should have gratuitous access to these facilities or pay just a very low price.
In their virtual organization process they should learn that these claims are basically
questionable pretensions.
However, to a certain degree, the vendors’ claim to have free or low‐priced access is not totally
illegitimate. In both cities, the vendors’ group, as shown by this study almost for the first time,
is far from being socially uniform. For the high earners of them paying an adequate price for
fresh water and electricity should be no problem. For the vendors earning just the minimum
wage or even below special schemes of financial support should be envisaged. However, it
would be naïve to get these sums from the state’s budget. Alternatively, a fund should be
issued, on the local level financed partially by the big companies of the formal economy and
several institutions like colleges and universities, as their members and employees, for a lack

224
of regular canteens, profit from street food vending. Additionally, the fund could be financed
by the high‐earning members of the vendors’ community, too, which, again, would only be
achieved on the condition of successful self‐organizing processes on the vendors’ side.
As the study found out in line with the international literature, the lack of capital is one of the
main obstacles in the street food business. A larger amount of business capital is an important
factor to stabilize or even to increase the level of the vendors’ income. Loans at a low‐interest
rate allow informal businesses to develop and get higher profits, which in turn can create more
jobs and improve family welfare. Therefore, it is necessary to increase the commitment of
several parties (e.g. banks, cooperatives, and other financial institutions) to provide funding
for their business so they will be able to contribute to increasing street food vendors’ income.
As the sums in need are not very high, these claims have a realistic perspective. Possibly, the
fund mentioned above, could be used for this purpose, too. The loans should be granted
primarily to projects leading to improvements in the field of ecology and working security such
as the acquisition of a food trailer.
3.3. Provide Training Programs
Among the strategies formulated to overcome the current calamities, efforts concerning the
education level are paramount. Issues like workers with minimal educational qualifications
and limited skills, especially in Indonesia, must also be taken into account by the authorities.
On the other hand, the study showed that, especially in Hat Yai, there is a close connection
between the educational standard of the vendors and their economic success.
Notwithstanding, many women street food vendors, even the less educated, have brilliant
ideas but do not have the capital and facilities to work on them, so finally they improvise with
limited facilities and skills. Therefore, local authorities and the formal private sector in both
countries should provide various training programs that can be attended by female street food
vendors. Consequently, training facilities should be provided in various fields, such as business
organization, accounting and marketing. Schools and universities are called upon to help.

225
Training courses are particularly necessary in fields that would benefit the whole city's
economy and ecology. While the street food business is absorbing a large number of
otherwise unemployed persons, it has become a growing problem in the field of hygiene and
city ecology as a whole. Mandatory training courses addressing these problems are urgently
needed, in order to make the street food business more beneficial to the community, the
customers, and the vendors’ families. The question of payment for these courses should be
addressed according to the solution suggested above: the high earners will have to pay, the
poorer vendors would attend the courses for free. Enhancing the economic, social and
ecological knowledge could also be one way to a solution of problems in the household affairs.
For this purpose, the vendors’ husbands should be addressed and included in the training
courses, especially when they are unemployed.
In line with the growth of metropolises in Indonesia and Thailand, street food vendors’
business has become dynamic and continues to grow. Empirically, it is evident that the street
food business has promising prospects while the negative impact on the urban environment
and the vendors’ as well as the customers’ health is rising, too. Accordingly, especially on the
local level, the governments are expected to recognize the street food vendors as political
partners. Legal assurance is necessary for them so they can avoid abuse from many parties,
including government officials and thugs. To support the creativity of street food vendors,
policies should be formulated that favor the needs of the street food sector. Simultaneously,
processes of awareness‐raising and organizational management as a basic condition for a
partnership model should be launched and pursued on the vendors’ side.
4. Limitations of the Study
The main limitation of this study resides in the use of women street food vendors as the
primary source of information and the exclusion of male vendors. Furthermore, first‐hand
interviews with local government persons would have better addressed some of the report's
specific questions concerning the attitude of the local governments towards the informal
sector. Accordingly, for both cities, this topic requires further research.

226
More importantly, another limitation of note, consisted in the gender difference. In the
beginning the opposition of a male researcher and female respondents created an
atmosphere of uncertainty on both sides, which, however, could be overcome after a short
time. In the course of some interviews, however, situations of uncertainty frequently came
back, when for instance the interview was repeatedly interrupted by customers, by the
respondents’ husbands or relatives or friends when they appeared at the food stall. However,
these encounters gave the researcher the chance to observe how these persons behaved to
the vendors. The researcher himself in general tried to behave in a calm, polite and rational
manner when surveying or interviewing the vendors. However, one problem remained
unsolved: The in‐depth interviews were only conducted with the female vendors. Future
studies should include additional interviews with the vendors' husbands, children other
household members. This may create divergend results for instance concerning the effect of
the division of household chores.
An additional problem had to be faced in Hat Yai. The uncertainty of how to behave in a
country that is not the researcher’s home country was an undererstimated problem,
especially in the beginning. The problem was compounded by the fact that the researcher did
not speak the Thai language and was almost always seen as an outsider. The obstacles were
overcome when the researcher recruited research assistants to introduce the researcher in
Thai language, while they assisted in conducting and translating the interviews. In most cases,
after the initial introductions, the researcher began interacting with the vendors with ease.
The limitations of operating in a foreign country entailed a secondary problem: the imbalance
in the number of respondents in Hat Yai (96), compared to Tangerang (200) in the researcher’s
home country. This limitation, however, does not influence the statistical reliability of the
study. For the samples in both study locations the margin of error is below 10.0% and
therefore meets the widely accepted methodological criteria.

227
Bibliographies
Abuza, Z. (2011). The Ongoing Insurgency in Southern Thailand: Trends in Violence, Counterinsurgency Operations, and the Impact of National Politics. Center for Strategic Research Institute for National Strategic Studies National Défense University, Washington DC. Acho‐chi, C. (2002). The Mobile Street Food Service Practice in the Urban Economy of Kumba, Cameroon. Singapore Journal of Tropical Geography, 23, 131‐148. Adda, H. (2014). Rural Home‐Based Self‐Employment: Evidence from Central Sulawesi, Indonesia. (Unpublished doctoral thesis). Graduate School‐New Brunswick Rutgers, The State University of New Jersey, New Jersey. Adamtey, N. (2015). Informal Economy Budget Analysis: Accra Metropolis. WIEGO Working Paper No 33, Cambridge. Adger, W. N., Kelly, P. M., Winkels, A., Huy, L. Q., & Locke, C. (2002). Migration, Remittances, Livelihood Trajectories and Social Resilience. Journal of Ambio, 31, 358‐366. Adhikari, D.B. (2011). Income Generation in Informal Sector: A Case Study of the Street Vendors of Kathmandu Metropolitan City. Economic Journal of Development Issues, 13 & 14(1‐2), 1‐14. Adhikari, D.B. (2017). Informal Street Food Trade: A Source of Income Generation in Urban Nepal. Economic Journal of Development, 23 & 24(1‐2), 1‐17. Adusei, M. (2015). Bank Profitability: Insights from the Rural Banking Industry in Ghana. Journal of Cogent Economics & Finance, 3, 2‐15. Ahiadeke, C. (2008). Research Methodology, Theory and Practice in the Social Sciences. Sundel Services Accra. Alebachew, A. (2017). Street Vending and Local Authorities in Addis Ababa city: Challenges and the Way Forward. (Unpublished master thesis). Addis Ababa University, Addis Ababa. Alimi, B. (2016). Risk Factors in Street Food Practices in Developing Countries: A Review. Journal of Food Science and Human Wellness, 5(3), 141-148. Altintas, E. (2009). State‐of‐the‐art Report: Division of Domestic Labour. Equal Soc, Oxford. Alves da Silva, S., Cardoso, R. C. V., Góes, J. Â. W., Santos, J. N., Ramos, F. P., Bispo de Jesus, R., & Teles da Silva, P. S. (2014). Street Food on the Coast of Salvador, Bahia, Brazil: a study from the Socioeconomic and Food Safety Perspectives. Journal of Food Control, 40, 78–84. Amare, M., Hohfeld, L., Jitsuchon, S., & Waibel, H. (2012). Rural–Urban Migration and Employment Quality: A Case Study from Thailand. Asian Development Bank, Metro Manila. Ananta, A., & Arifin, E. N. (2014). Emerging patterns of Indonesia's international migration. Malaysian Journal of Economic Studies, 51(1), 29‐41. Anjaria, J.S. (2006). Street Hawkers and Public Space in Mumbai. Economic and political weekly, 41(21), 2140‐2146.
228
Anyidoho, N.A. (2013). Street vendors in Accra, Ghana. Informal Economy Monitoring Study, Accra. ASEAN. (2018). A Resilient and Innovative ASEAN Community: Annual Report 2017‐2018. The ASEAN Secretariat, Jakarta. ASEAN State of Education Report. (2013). ASEAN State of Education Report 2013. The ASEAN Secretariat, Jakarta. Asian Development Bank and BPS‐Statistics Indonesia. (2011). The Informal Sector and Informal Employment in Indonesia. Asian Development Bank and BPS‐Statistics Indonesia, Metro Manila. Ayadurai, S. (2004). Profile of Women Entrepreneurs in a War‐Torn Area: Case Study of North East Sri Lanka, 2005. Paper Presented at the 50th World Conference of the International Council for Small Business (ICSB), Washington DC. Ayeh, E. B., Sylvana, R., & Decardi‐Nelson, I. (2011). Street Vending and the Use of Urban Public Space in Kumasi, Ghana. The Ghana Surveyor, 4(1), 20‐31. Babbie, E. (2005). The Practice of Social Research. Wadsworth Publishing, Boston. Babi, M., Guogping, X., & Ladu, J. (2017). Causes and Consequences of Rural‐Urban Migration: The Case of Juba Metropolitan, Republic of South Sudan. IOP Conf. Series: Earth and Environmental Science, Bristol. Badawi, S., Rahman, W., El Jack, A., & Lorenzl, G. (2008). Women in Food and Beverages Business in Urban Markets of Khartoum State. Working Paper No. 88/2008, University of Humboldt, Berlin. Badr, H., & Acitelli, A.K. (2008). Attachment Insecurity and Perceptions of Housework: Associations with Marital Well‐Being. Journal of Family Psychology, 22(2), 313–319. Bamfo, B., & Asiedu‐Appiah, F. (2012). Investigating the Challenges and Prospects of Female Entrepreneurs in Ghana. International Journal of Business and Management Studies, 1(1), 43–54. Banten Governor’s Decree. (2018). Penetapan Upah Minimum Kabupaten/Kota di Provinsi Banten Tahun 2018. Pemda Provinsi Banten, Serang. Bates, T. (1990). Entrepreneur Human Capital Inputs and Small Business Longevity. The Review of Economics and Statistics, 1990, 72(4), 551‐59. Bazzi, S., Gaduh, A.,Rothenberg, A., & Wong, M. (2016). Skill Transferability, Migration, and Development: Evidence from Population Resettlement in Indonesia. The Center on Emerging and Pacific Economies at UC, San Diego. Bedford, L. (1995). The Self‐Employed Women’s Union Survey: Members and Their Situation. Independent Development Research, Durban. Begari, P. (2017). Education Level of Street Vendors and Its Impact on Performance of the Activity: A Case Study of Hyderabad, Telangana. International Journal of Research in Economics and Social Sciences, 7(7), 436‐443. Bell, J.A., & Loukaitou‐Sideris, A. (2014). A. Sidewalk Informality: An Examination of Street Vending Regulation in China. International Planning Studies, 19(3‐4), 221‐243.

229
Ben‐Galim, D., & Thompson, S. (2013). Who’s Breadwinning? Working Mothers and the New Face of Family Support. Institute for Public Policy Research, London. Bereda, T., Emeri, Y.M., Reta, M.A., & Asfaw, H.S. (2016). Microbiological Safety of Street Vended Foods in Jigjiga City, Eastern Ethiopia. Ethiopia Journal of Health Science, 26(2), 161‐170. Berg, B. L., & Howard, L. (2012). Qualitative Research Methods for the Social Sciences. (8th ed). Pearson Educational Inc, New Jersey. Bhat W. K. (2000). Profile of Street Foods Sold in Asian countries. World Review of Nutrition and Dietetics, 86, 53–99. Bhowmik, S.K. (2005). Street Vendors in Asia: A Review. Economic and Political Weekly, 40(22), 2256‐2264. Bianchi, S.M., Sayer, D., Milkie, M., & Robinson, J.P. (2000). Is Anyone Doing Housework? Trends in the Gender Division of Household Labor. Journal Social Forces, 79(1), 191‐228. Bilton, T., K. Bonnett, K, P. Jones, T. Lawson, D. Skinner, M. Stanworth, & A. Webster. (1996) Introductory Sociology. MacMillan, London. Boushey, H. (2011). Not Working: Unemployment Among Married Couples. Center for American Progress, Washington DC. BPJS Employment. (2017). Laporan Pengelolaan Program dan Laporan Keuangan Jaminan Sosial Kesehatan. BPJS, Jakarta. BPJS Health. (2019). Pemanfaatan Data JKN Untuk Perbaikan Sistem Kesehatan di Indonesia. BPJS Kesehatan, Jakarta. BPS Kota Tangerang (2019). Tangerang Municipality in Figures 2019. BPS Kota Tangerang, Tangerang. Brata, A. G. (2006). Relokasi Kaki Lima: Pemerintah, Tanpa PKL. Research Institute of Atma Jaya Yogyakarta University, Yogyakarta. Bray, R. (2003). Who Does the Housework? An Examination of South African Children’s Working Roles. CSSR Working Paper No. 45. The Centre for Social Science Research University of Cape Town, Cape Town. Bressers, H., Mohlakoana, N., Matinga, MN., de Groot, J., Batidzirai, B., Knox, A., & Van der Plas, R. (2016). Productive Uses of Energy: The Informal Food Sector in South Africa, Rwanda and Senegal. Scoping Study Report. University of Twente, Enschede. Bromley, R., & Mackie, P. (2009). Displacement and the New Spaces for Informal Trade in the Latin American City Centre. Urban Studies, 46(7), 1485‐1506. Brown, A., Lyons, M., & Dankoco, I. (2010). Street Traders and the Emerging Spaces for Urban Voice and Citizenship in African Cities. Urban Studies, 47, 666‐683. Brydon, L., & S. Chant. (1989). Women in the Third World: Gender Issues in Rural and Urban Areas. Edward Elgar Publishing Limited, New Brunswick.
230
Bryman, A. (2001). Social Research Methods. Oxford University Press., New York. Cali, M., & Menon, C. (2009). Does Urbanisation Affect Rural Poverty? Evidence from Indian Districts. SERC Discussion Papers 0014, Spatial Economics Research Centre. London School of Economics, London. Campbell, D.T., & Fiske, D.W. (1959) Convergent and Discriminant Validation by the Multitrait‐Multimethod Matrix. Psychological Bulletin, 56(2), 81‐105. Casale, D., & Posel, D. (2002). The Continued Feminisation of the Labor Force in South Africa. South African Journal of Economics, 70(1), 156‐184. Casey, D., & Murphy, K. (2009). Issues in Using Methodological Triangulation in Research. Journal Nurse Researcher, 16(4), 40‐55. Chalamwong, Y. (1998). Economic Crisis, International Migration and Labor Market in Thailand. TDRI Quarterly Review, 13(1), 12‐21. Chandra, A., & Jain, R. (2015). Property Rights of Street Vendors. Centre for Civil Society, New Delhi. Chen, M., Vanek, J., & Carr, M. (2004). Mainstreaming Informal Employment and Gender in Poverty Reduction. Commonwealth Secretariat, London. Chicho‐Matenge, N.C., & Ongori, H. (2013). An Assessment of Challenges faced by Microenterprises in Botswana: A case of Street Food Vendors in Gaborone. International Journal of Learning & Development, 3(5), 56‐73. Choudhury, M., Mahanta, L., Goswami, J., Mazumder, M., & Pegoo, B. (2011). Socio‐economic Profile and Food Safety Knowledge and Practice of Street Food Vendors in the City of Guwahati, Assam, India. Journal of Food Control, 22, 196‐203. Chukuezi, C.O. (2010). Food Safety and Hyienic Practices of Street Food Vendors in Owerri, Nigeria. Studies in Sociology of Science, 1(1), 50‐57. Chung, C., Ritoper, S., & Takemoto, S. (2010). Case Study: Bangkok and Access to Food for Low‐Income Residents. Department Urban and Planning, Massachusetts Institute of Technology, Massachusetts. Claffey, S., & Mickelson, K. (2009). Division of Household Labor and Distress: The Role of Perceived Fairness for Employed Mothers. Journal Sex Roles, 60, 819–831. Cohen, M. (1984). The Urban Street Food Trade. Equity Policy Center (EPC), Washington DC. Cohen, M., Bhatt, M., & Horn, P. (2000). Women Street Vendors: The road to Recognition (No. 20). Population Council, New York. Cohen, B.H., & Lea, R.B. (2004). Essentials of Statistics for the Social and Behavioral Sciences. Wiley and Sons, New Jersey. Collins, D., Morduch, J., Rutherford, S., & Ruthven, O. (2009). Portfolios of the Poor: How the World's Poor Live on $2 a Day. Princeton University Press, New Jersey.

231
Coltrane, S. (2000). Research on Household Labor: Modeling and Measuring the Social Embeddedness of Routine Family Work. Journal of Marriage and Family, 62(4), 1208‐1233. Connolly, P. (2007). Qualitative Data Analysis in Education: A critical introduction using SPSS. Routledge, London. Cooke, F. (2011). Women's Participation in Employment in Asia: A Comparative Analysis of China, India, Japan and South Korea. The International Journal of Human Resource Management, 21(12), 2249–2270. Creamer, E.G. (2018). Paradigms in Play: Using Case Studies to Explore the Value‐Added of Divergent Findings in Mixed Methods Research. International Journal of Multiple Research Approaches, 10(1), 30‐40. Creswell, J.W. (2014). Research Design: Qualitative, Quantitative and Mixed Methods Approaches. Sage Publications, Thousand Oaks, CA. Creswell, J. W., & Clark, V. L. (2007). Designing and Conducting Mixed Methods Research. Sage Publications, London. Creswell, J.W., Clark, V.L., Gutmann, M.L., & Hanson, W.E. (2003). Advance Mixed Methods Research Designs. In A. Tashakkori and C. Teddlie (Eds), Handbook on Mixed Methods in the Behavioral and Social Sciences (pp. 209‐240). Sage Publications, Thousand Oaks, CA. Daniel, J. (2012). Sampling Essentials: Practical Guidelines for Making Sampling Choices. Sage Publications, Thousand Oaks, CA. Dardano, C. (2003). Caribbean Regional Working Group on Street Food Vendors. FAO, PAHO and BNSI, St. Lucia. Darko‐Koomson, S. (2016). Dynamics and Growth of Street Food Enterprises in Kumasi Metropolis. (Unpublished master thesis). Department of Agricultural Economics, Agribusiness and Extension in the Faculty of Agriculture, College of Agriculture and Natural Resources, Kumasi. Dasgupta, S., Bhula‐or R., & Fakthong, T. (2015). Earnings Differentials Between Formal and Informal Employment in Thailand. ILO Asia‐Pacific, Bangkok. Daudi, Z. A. (2015). Challenges Facing Women Informal Sector Operators in Balancing Child Caring and Productive Roles: A Case of Women Food Vendors in Ilala Municipality. (Unpublished doctoral thesis), The Open University of Tanzania, Dar es Salaam. Dawson, C. (2002). Practical Research Methods: A User‐Friendly Guide to Mastering Research Techniques and Projects. How to Books, Oxford. Dawson, R., Liamrangsi, S., & Boccas, F. (1994). Bangkok's Street Food Project. FAO, Bangkok. DeGenova, M.K., & Philip, R.F. (2005). Intimate Relationships, Marriages & Families. 6th ed. McGraw Hill, New York. De Haas, H., Czaika, M., Flahaux, M.L., Mahendra, E., Natter, K., Vezolli, S., & Villares‐Varela, M. (2010). International Migration Trends, Determinants and Policy Effects. Population and Development Review, 45(4), 885‐922.

232
Department for International Development. (1999). Sustainable Livelihoods Guidance Sheets. DFID, London. Deshingkar, P. (2006). Internal Migration, Poverty and Development in Asia. Institute of Development Studies and Overseas Development Institute, London. DFID. (1999). Sustainable Livelihoods Guidance Sheets. DFID, London. Dhaliwal, S. (2000). Asian Female Entrepreneurs and Women in Business: An Exploratory Study. Enterprise and Innovation Management Studies, 1(2), 207‐216. Donkor, E.S., Kayang, B., Quaye, J., & Akyeh, M. (2009). Application of the WHO Keys of Safer Food to Improve Food Handling Practices of Food Vendors in a Poor Resource Community in Ghana. Int. J. Environ. Res. Public Health, 6, 2833‐2842. Draper, A. (1996). Street Foods in Developing Countries: The Potential for Micronutrient Fortification. London School of Hygiene and Tropical Medicine, London. Eddyono,S., Fanani, E., Sabaniah, D., & Ciciek, F. (2016). When and Why the State Responds to Women’s Demands: Understanding Gender Equality Policy Change in Indonesia. UNRISD, Geneva. Ellis, F. (2000). Rural Livelihoods and Diversity in Developing Countries: Evidence and Policy Implications. ODI Natural Resources Perspectives, London. Etzold, B., Hossain, Md., & Rahman, S. (2013). Street Food Vending in Dhaka: Livelihoods of the Urban Poor and the Encroachment of Public Space. Bangladesh Institute of Planners, Dhaka. Evertsson, M., & Nermo, M. (2004). Dependence Within Families and the Division of Labor: Comparing Sweden and the United States. Journal of Marriage and Family, 66, 1272–1286. FAO. (1986). Regional Workshop on Street Foods in Asia. Jakarta, Indonesia. FAO. (1989). Street Foods. Food and Nutrition Paper No. 46. FAO, Rome. FAO. (2007). Promises and Challenges of the Informal Food Sector in Developing Countries. Communication Division. FAO, Rome. FAO. (2012.) Social Protection for Food Security. A Report by The High‐Level Panel of Experts on Food Security and Nutrition: June 2012. HLPE Report 4. FAO, Rome. FAO. (2016). Street Food in Urban Ghana. FAO, Accra. Fellows, P., & Hilmi, M. (2011). Selling street and snack foods. Diversification Booklet Number 18, FAO, Rome. Fixy, F. (2004). The Contribution of the Informal Sector to Development: A Study of Street Food Vendors in Jakarta Indonesia. (Unpublished master thesis). Massey University, Wellington. Flick, U. (2004). A Companion to Qualitative Research. Sage Publications, Thousand Oaks, CA. Flick, U. (2018). Handbook of Qualitative Data Collection. SAGE Publications, Thousand Oaks, CA.

233
Franck, A.K. (2012). Factors Motivating Women's Informal Micro‐Entrepreneurship: Experiences from Penang, Malaysia. International Journal of Gender and Entrepreneurship, 4(1), 65‐78. Frankenberg, E., Duncan, T., & Beegie, K. (1999). The Real Costs of Indonesia's Economic Crisis: Preliminary Findings from the Indonesia Family Life Survey. RAND, Santa Monica. Fuwa, M. (2004). Macro‐level Gender Inequality and the Division of Household Labor in 22 countries. American Sociological Review, 69(6), 751‐767. Fuwa, M. (2015). Division of Housework among Dual‐earner Couples in East Asian Countries: A Comparison of Chinese, Japanese, Korean, and Taiwanese Couples. Journal of Humanities, 497, 1‐20. Gadaga, T.H., Ntsike, M.M., & Ntuli, V. (2014). Socio‐economic and Hygienic Aspects of Street Food Vending in Maseru City, Lesotho. USWA Research Journal of Agriculture, Science and Technology, 15, 28‐39. Gatere, M. (2016). Factors Influencing Performance of Business Run by Women Street Vendors in Ngara Ward, Starehe Sub‐County, Kenya. University of Nairobi, Kenya. Gengaiah, U., Li, J., Hanvatananukul, H., Prontadavit, N., & Pilz, M. (2018). Skill Development in the Informal Sector in China, Thailand and India – A Case Study of Street Food Vendors. Journal of TVET@Asia, 10, 1‐21. Gërxhani, K. (2003). The Informal Sector in Developed and Less Developed Countries. Journal of Public Choice, 120, 267‐300. Ghatak, I., & Chatterjee, S. (2018). Urban Street Vending Practices: An Investigation of Ethnic Food Safety Knowledge, Attitudes, and Risks among Untrained Chinese Vendors in Chinatown, Kolkata. Journal of Ethnic Food, 5(4), 311‐316. Ginneken, W. (2003). Social Protection for Workers in the Informal Economy: New Challenges for Asia and the Pacific, in Towards More Effective Social Security in Asia and the Pacific. ADB, Manila. Glynn, S.J. (2014). Breadwinning Mothers, Then and Now. Centre for American Progress, Washington, DC. Gorard, S. (2001). Quantitative Methods in Educational Research: The role of numbers made easy. The Tower Building, London. Gray, D.E. (2009). Doing Research in the Real World. Sage, London. Gupta, N. (2014). Legal and Policy Framework for Rights of Street Vendors in India: A Ray of Hope. Journal of Development Management and Communication, 1(2), 190‐201. Habib, K.R. (2016). Understanding Challenges Faced by Street Food Vendors to Maintain Street Food Hygiene in Dhaka City. Journal of Food and Nutrition Sciences, 4(4), 78‐85. Handiyatmo, D. (2010.) Migrasi Internal Penduduk Indonesia: Hasil Sensus Penduduk 2010. Subdirektorat Statistik Demografi, Badan Pusat Statistik, Jakarta. Halcomb, E. and Andrew, S. (2005). Triangulation as a Method for Contemporary Nursing Research. Journal Nurse Researcher, 13 (2), 71‐82.

234
Handayani, E., Gondodiputro, S., & Saefullah, A. (2013). Faktor‐faktor yang Memengaruhi Kemauan Masyarkat Membayar Iuran Jaminan Kesehatan di Kabupaten Hulu Sungai Selatan. Pustaka Universitas Padjajaran, Bandung. Hanson, W.E., Creswell, J.W., Petska, K.S., & Creswell, J.D. (2005). Mixed Methods Research Designs in Counselling Psychology. Journal of Counselling Psychology, 52(2), 224–235. Harahap, E. (2017). Analysis of Determinants of Income and Efforts to Improve the Welfare of Street Vendors in Padang City. European Journal of Business and Management, 9(3), 118‐123. Hart, K. (1973). Informal Income Opportunities and Urban Employment in Ghana. The Journal of Modern African Studies, 11(1), 61–89. Herawati, T., Rohadi, D., Rahmat, M., & Winarno, B. (2019). An Exploration of Gender Equity in Household: A Case from a Peatland‐based Community in Riau, Indonesia. Journal Biodiversitas, 20(3), 853‐861. Hermawati, R., & Runiawati, N. (2017). Socio‐Economic Dynamics of Street Vendors in Bandung. Proceedings of the International Conference on Administrative Science (ICAS 2017), 195‐199. Hook, J.L. (2006). Care in Context: Men's Unpaid Work in 20 countries, 1965‐2003. American Sociological Review, 71(4), 639‐660. Hossain, M.Z. (2001). Rural‐Urban Migration in Bangladesh: A Micro‐Level Study. Presentation in a Poster Session on Internal Migration at the Brazil IUSSP Conference, August 20‐24, 2001. Hsu, P. (2008). Gender Inequality and the Division of Household Labor: Comparisons Among China, Japan, South Korea and Taiwan. (Unpublished doctoral thesis). Cornell University, New York. Hu, C.Y., & Kamo, Y. (2007). The Division Household Labour in Taiwan. Journal of Comparative Family Studies, 8(1), 105‐124. Hugo, G. (2000). The Crisis and International Population Movement in Indonesia. Asian and Pacific Migration Journal, 9(1), 115‐138. ICEDR. (2018). Millennial Women: ICEDR Survey. QUEST, Lexington. ILO. (1972). Employment, Incomes and Equality: A Strategy for Increasing Productive Employment in Kenya. ILO, Geneva. ILO. (1993). Statistics of Employment in the Informal Sector. XVI Conference of Labor Statisticians. ILO, Geneva. ILO. (2000). World Labour Report 2000: Income Security and Social Protection in a Changing World. ILO, Geneva. ILO. (2002). Decent work and the informal economy, Report VI. ILO, Geneva. ILO. (2016). Women at Work: Trends 2016. ILO, Geneva. ILO. (2018). Women and Men in the Informal Economy: A Statistical Picture. Third edition. International Labour Office, Geneva.

235
ILO Department of Statistics. (2011). Statistical Update on Employment in the Informal Economy. ILO, Geneva. Irianto, A. M. (2014). Strategi Adaptasi PKL Kota Semarang: Kajian Tentang Tindakan Sosial. International Journal of Indonesian Society and Culture, 6(1), 70‐90. Iwai, N., & Yasuda, T. (2011). Family Values in East Asia: A Comparison Among Japan, South Korea, China, and Taiwan Based on East Asian Social Survey 2006. JSGG Research Center, Kyoto. Iyenda, G. (2001). Street Food and Income Generation for Poor Households in Kinshasa. Journal of Environment and Urbanisation, 13, 233‐241. James, S. (1998.) The Self‐Employed Women’s Union: 1997 Membership Survey. SEWU, Durban. Jampaklay, A., Ford, K., & Chamratrithirong, A. (2017). How does Unrest Affect Migration? Evidence from the Three Southernmost Provinces of Thailand. Demographic Research, 37(3), 25‐52. Janaki, N., & Jeyakumar, D. (2017). A Study on Socio‐economic Conditions and Financial Problems Faced by the Women Hawkers in Tuticorin District. International Journal of Science Technology and Management, 6(2), 226‐233. Jayadi, A., & Azis, H.A. (2017). Comparative Advantage Analysis and Products Mapping of Indonesia, Malaysia, Philippines, Singapore, Thailand and Vietnam Export Products. Journal of Developing Economies, 2(1), 12‐27. Jick, T.D. (2006). Mixing Qualitative and Quantitative Methods: Triangulation in Action. Administrative Science Quarterly, 24(4), 602‐611. Jones, G.W. (2006). The “Flight from Marriage” in South‐East and East Asia. Journal of Comparative Family Studies, 36(1), 93‐119. Jores, D., Taha, Mohamad, A., & Rahman, M.D. (2018). Factors Associated with Food Hygiene Practices Among Street Food Vendors in Padawan, Sarawak. Borneo Journal of Resource Science and Technology (2018), 8(1), 56‐65. Kamala, S. (2007). Street Vendor in India. Law Project on the informal Economy. WIEGO, New Delhi. Kantachote, K. (2013). Educational Stratification in Thailand: Gender and Residency Effects. (Unpublished master thesis). Lehigh University, Pennsylvania. Kartika, DM. (2015). Does Indonesian National Health Insurance serve a potential for Improving Health Equity in Favour of Workers in Informal Economy? The London School of Economics and Political Science, London. Kebede, G.F. (2015). Social Capital and the Urban Informal Economy: The Case of Street Vendors in Addis Ababa, Ethiopia. (Unpublished doctoral thesis). Universita’ degli Studi di Trento, Trento. Khatiwada, S.P., Deng, W., Paudel, B., Khatiwada, J.R., Zhang, J., & Su, Y. (2017). Household Livelihood Strategies and Implication for Poverty Reduction in Rural Areas of Central Nepal. Journal of Sustainability, 9, 1‐20.

236
Killewald, A. (2011). Unemployment in Families: The Case of Housework. Journal of Marriage and Family, 73(5), 1085‐1100. Knudsen, K., & Warness, K. (2008). National Context and Spouses’ Housework in 34 Countries. European Sociological Review, 24(1), 97–113. Kothari, C.R. (2004). Research Methodology: Methods and Techniques. New Age International Limited, New Delhi. Kuadamah, R. (2017). Consequences of Rural‐Urban Migration of Street Vendors in the Accra Metropolitan Area and the Lankwantanang‐Madina Municipality. (Unpublished doctoral thesis). The University of Ghana, Accra. Kumar, P. (2015). Socio ‐ Economic Features of Street Vending Enterprises in Kerala. International Journal of Management and Commerce Innovations, 3(1), 750‐756. Kumar, S., & Pillai, N. (2017). Problems of Street Vendors in Kollam District. International Journal of Informative & Futuristic Research (IJIFR), 4(9), 77‐91. Kumari, S., & Singh, A.K. (2016). Working Women in Informal Sector: Geographical Perspective. Journal of the Anthropological Survey of India, 65(2), 185‐199. Kusakabe, K. (2006). Policy Issues on Street Vending: An Overview of Studies in Thailand, Cambodia and Mongolia. International Labour Organization, Rome. Kusakabe, K. (2010). Street vendors in Phnom Penh, Cambodia. In S. K. Bhowmik (Ed.), Street Vendors in the Global Urban Economy. Routledge, New Delhi. Kusakabe, K. (2015). Feeding the Urban Poor: Fresh and Prepared Food Street Vendors in Bangkok and Phnom Penh. Paper for Presentation at the 2015 Annual Meeting of American Anthropological Association, 18‐22 November 2015. Kuwinpant, P. (2002). Thai Society and Culture. Graduate School of International Development (GSID), Nagoya University. Lachance‐Grzela, M., & Bouchard, G. (2010). Why Do Women Do the Lion's Share of Housework? A Decade of Research. Journal Sex Roles, 63(11‐12), 767‐780. Lall, S., Timmins, C., & Yu, S. (2006). Connecting Lagging and Leading Regions: The Role of Labor Mobility. The World Bank Finance Economics and Urban Development Department, Washington DC. Leedy, P. D., & Ormrod, J. E. (2015). Practical Research. Planning and Design (11th ed.). Pearson, Boston. Legatum Institute. (2015). The Legatum Prosperity Index 2015. Legatum Institute, London. Lincoln, A. E. (2008). Gender, Productivity, and the Marital Wage Premium. Journal of Marriage and Family, 70, 806–814. Lin, E.Y., & Yamao. M. (2014). Street Foods Safety in Yangon: A Case Study on Street Food Vendors’ Socio‐Economic and Production Aspects. International Review of Research in Emerging Markets and the Global Economy Journal, 5(1), 206‐216.

237
Lu, Y. (2008). Test of the ‘‘Healthy Migrant Hypothesis’’: A Longitudinal Analysis of Health Selectivity of Internal Migration in Indonesia. Journal of Social Science & Medicine, 67, 1331–1339. Lu, Y. (2010). Rural‐urban Migration and Health: Evidence from Longitudinal Data in Indonesia. Journal of Social Science and Medicine, 70(3), 412‐419. Luke, N., Xu, H., & Thampi, B. (2014). Husbands’ Participation in Housework and Child Care in India. Journal of Marriage and Family, 76(3), 620–637. Lund, F. (1998). Women Street Traders in Urban South Africa: A Synthesis of Selected Research Findings. School of Development Studies, University of Natal Durban, Durban. Lund, F. (2009). Social Protection and the Informal Economy: Linkages and Good Practices for Poverty Reduction and Empowerment. WIEGO Social Protection Programme, University of KwaZulu‐Natal, Durban. Mabilo, M. (2018). Women in the Informal Economy: Precarious Labour in South Africa. (Unpublished master thesis). The Faculty of Arts and Social Sciences, Stellenbosch University, Stellenbosch. Malhotra, N.K., & Birks, D.F (2008). Marketing Research: an applied Approach. 3rd European Edition. Prentice Hall, New Jersey. Malik, M. (2017). Street Vendors and Their Everyday Struggle for Survival: A Case Study of Mumbai. International Journal of Current Trends in Science and Technology, 7(2), 20486‐ 20494. Maneepong, J., & Walsh, C. (2013). A New Generation of Bangkok Street vendors: Economic Crisis as Opportunity and Threat. Journal of Cities, 34, 37‐43. Magehema, F (2014). Local Government Authority Support to Informal Sector and Performance of the Sector in Tanzania: A Case of Food Vending in Songea Rural and Urban Districts. (Unpublished doctoral thesis). Sokoine University of Agriculture Morogoro, Morogoro. Mangundjaya, W. (2013). Is There Cultural Change in The National Cultures of Indonesia? The 2010 Congress of the International Association for Cross Cultural Psychology, July 2010. Manyanhaire, O.I., Murenje. T., D. Munasirei, D., & Svotwa, E. (2007). Investigating Gender Dimensions in Vending Activities in the City of Mutare, Zimbabwe. Journal of Sustainable Development in Africa, 9(4), 169‐186. Marobhe, N.J., & Sabai, S.T. (2016). Assessment of Food Safety Practices and Microbiological Quality of Street Vended Rice and Beans in Mlalakuwa Ward, Dar es Salem. Journal of Chemical, Biological and Physical Sciences, 6(2), 297‐312. Marras, S. (2018). Street Food in Tanzania: A literature Review. FAO, Rome. Marras, S., & Agbendech, M. (2016). Street Food in Urban Ghana. FAO, Rome. Martins, J.H. (2006). Socio‐economic and hygiene features of street food vending in Gauteng. South African Journal of Clinical Nutrition, 19(1), 18‐25. Mazhambe, A. (2017). Assessment of the Contribution of Street Vending to the Zimbabwe Economy. A Case of Street Vendors in Harare CBD. IOSR Journal of Business and Management, 19(9), 91‐100.

238
McDonald, P. (2000). Gender Equity, Social Institutions and the Future of Fertility. Journal of Population Research, 17(1), 1‐16. McGinnity, F., & Russell, H. (2008). Gender Inequalities in Time Use the Distribution of Caring, Housework and Employment Among Women and Men in Ireland. The Equality Authority or The Economic and Social Research Institute, Dublin. Mehrass, A., Ahmed, I., Ali, A., & Al‐Adhroey, A. (2017). Early Marriage and Less Education as Independent Predictors for High Fertility in Yemen. Annals of Medical and Health Sciences Research, 7(4), 251‐255. Mertler, C.A., & Charles, C.M. (2008). Introduction to Educational Research (7th Edition). Sage Publications, Thousand Oaks, CA. Milanzi, A.H. (2011). The Contribution of Mama Lishe Activities Towards Household Poverty in Morogoro Municipality, Tanzania. (Unpublished master thesis). Rural Development, Sokoine University, Sokoine. Mitullah, W. (2003). Street Vending in African Cities: A Synthesis of Empirical Findings from Kenya, Cote D'Ivoire, Ghana, Zimbabwe, Uganda and South Africa. Paper for the 2005 World Development Report, Nairobi. Mramba, N.R. (2015). The Conception of Street Vending Business (SVB) in Income Poverty Reduction in Tanzania. International Business Research, 8(5), 120‐129. Murrugarra, E., Larrison, J., & Sasin, M. (2011). Migration and Poverty Toward Better Opportunities for the Poor. The World Bank, Washington DC. Mutinta, H.E. (2015). Factors Influencing Husbands’ Involvement in Household Chores Among Dual Couples in Lusaka’s Libala Township. (Unpublished master thesis). University of Zambia, Lusaka. Muyanja, C, Nayiga, L., Brenda, N., & Nasinyam, G. (2011). Practices, Knowledge and Risk Factors of Street Food Vendors in Uganda. Journal of Food Control, 22(10), 1551‐1558. Muzaffar, A.T., Huq, I., & Mallik, B.A. (2009). Entrepreneurs of the Streets: An Analytical Work on the Street Food Vendors of Dhaka City. International Journal of Business and Management, 4(2), 80‐88. Myrick, R. (2018). Running a Food Truck for Dummies. John Wiley & Sons, Etobicoke. Nashrul, W. (2017). Interregional Migration in Indonesia: Macro, Micro, and Agent‐based Modelling Approaches. (Unpublished doctoral thesis). University of Groningen, Nederland. National Statistical Office of Thailand. (1997). Report of the Labor Force Survey. NSO, Bangkok. National Statistical Office of Thailand. (2000). Report of the Labor Force Survey. NSO, Bangkok. National Statistical Office of Thailand. (2010). Thailand ‐ Population and Housing Census 2010. NSO, Bangkok. National Statistical Office of Thailand. (2012). Statistical Tables for the 2012 Migration Survey. NSO, Bangkok.

239
National Statistical Office of Thailand. (2015). Summary the Labor Force Survey in Thailand. NSO, Bangkok. National Statistical Office of Thailand. (2017). The Population and Housing Census – Preliminary Report. NSO, Bangkok. Natural Resources Institute (NRI). (2015). Street Foods and Informally Vended Food in Africa. NRI, Johannesburg. Nazara, S. (2010). Interregional Equity as the Challenge on Structural Transformation of Indonesian Economic Development. Jurnal Ekonomi dan Pembangunan Indonesia, 9(1), 83‐98. Neelapaijit, P. (2009). Enforced or Involuntary disappearance Situations in Thailand: Challenges and Hopes. In. We Need the Truth: Enforced Disappearances in Asia. ECAP, Bangkok. Nilvarangkul, K., Phajan, T., Inmuong, U., Smith, JF., & Rithmark, P. (2016). Exploring Challenges to Primary Occupational Health Care Service for Informal Sector Workers. Journal Primary Health Care, 6(4), 1‐4. Nirathron, M. (2006). Fighting Poverty from the Street: A Survey of Street Food Vendors in Bangkok. International Labour Office, Bangkok. Njaya, T. (2014). Nature, Operations and Socio‐Economic Features of Street Food Entrepreneurs of Harare, Zimbabwe. IOSR Journal of Humanities and Social Science, 9(4), 49‐58. Noritake, A. (2008). Negotiating Space and Gender: Female Street Entrepreneurs in Seoul. Intersections: Gender and Sexuality in Asia and the Pacific, issue 17, 2008. Nyaruhucha, C., Kinabo, J., Kulwa, K., John, J., George, V., & Sillo, L. (2007). Improving the Nutritional Quality of Street Foods to Better Meet the Micronutrient Needs of Schoolchildren in Urban Areas. FAO, Rome. OECD. (2014). Education at a Glance 2014. OECD Indicators. OECD Publishing, Paris. OECD. (2018). Education at a Glance 2018. OECD Indicators. OECD Publishing, Paris. Oluwoyo, J.T., & Enemali, O. (2016). An Evaluation of Saving Culture among Street Food Vendors in Informal Sector of Kogi State, Nigeria. International Journal of Innovation and Applied Studies, 18(1), 252‐261. Omemu, A.M., & Aderoja, S.T. (2008). Food Safety Knowledge and Practices of Street Food Vendors in the City of Abeokuta, Nigeria. Journal of Food Control, 19, 396‐402. Osei‐Boateng, C. and Ampratwum, E. (2011). The Informal Sector in Ghana. Friedrich Ebert Stiftung, Accra. Otoo, M., Fulton, J., Ibro, G., & Lowenberg‐DeBoer, J. (2011). Women Entrepreneurship in West Africa: The Cowpea Street Food Sector in Niger and Ghana. Journal of Developmental Entrepreneurship, 16(1), 37‐63. Parajuli, A. (2013). Livelihood Opportunities of Street Vendors: Study of Ason, Indrachowk and Khullamunch of Kathmandu Metropolitan City. Project Work, Kathmandu.
240
Patton, M. Q. (2001). Qualitative Evaluation and Research Methods. (3rd ed). Sage Publications, Thousand Oaks, CA. Pemerintah Kota Tangerang. (2018). Statistik Daerah Kota Tangerang. BPS, Tangerang. Perry, G.E., Maloney, W.F., Arias, O., Fajnzylber, P., Mason, A., & Saavedra‐Chanduvi, J. (2007). Informality Exit and Exclusion. The World Bank, Washington DC. Pew Research Center for Religion and Public Life. (2013). The World’s Muslims: Religion, Politics and Society. Pew Research Center, Washington, DC. Pew Research Center for Religion and Public Life. (2019). The Global Religious Landscape. Pew Research Center, Washington DC. Pholpirul, P. (2010). Does AFTA Create More Trade for Thailand? An Investigation of Some Key Trade Indicators. Journal of Current Southeast Asian Affairs, 29(1), 51‐78. Phuyuthanon, I., & Kumjim, P. (2018). Video Art: Everyday Fear within the Three Southern Thai Provinces. Chulalongkorn University, Bangkok. Pignatti, N. (2016). Encouraging Women’s Labor Force Participation in Transition Countries. Institute for the Study of Labor (IZA), Bonn. Potts, D. (2004). Urbanization and Urban Livelihood in The Context of Globalisation. in Potts, D. and T. Bowyer‐Bower (eds) Eastern and Southern Africa: Development Challenges in a Volatile Region, Harlow, 328‐368. Pearson, London. Powell, G. N., & Eddleston, K. A. (2013). Linking Family‐to‐Business Enrichment and Support to Entrepreneurial Success: Do Female and Male Entrepreneurs Experience Different Outcomes? Journal of Business Venturing, 28(2), 261‐280. Pratomo, D. (2017). The Employability and Welfare of Female Labor Migrants in Indonesian Cities. Regional Science Inquiry, 9(2), 109‐117. Presser, H.B. (2003). Working in a 24/7 Economy: Challenges for American Families. Russel Sage Foundation, New York. Quartey, P., & Blankson, T. (2004). Do Migrant Remittances Minimize the Impact of Macro‐volatility on the Poor in Ghana? Institute of Statistical, Social and Economic Research (ISSER) University of Ghana, Accra. Ouédraogo, S.Y., Sisawo, E.J., & Huang, Song‐Lih. (2017). Sexual Abuse and Risky Sexual Behaviors Among Young Female Hawkers in Burkina Faso: A Mixed Method Study. BioMed Central International Health and Human Rights (2017), 17(1), 1‐9. Rahman, M., Arif, M.T., Bakar, K., & Tambi, Z. (2012). Food Safety Knowledge, Attitude and Hygiene Practices Among the Street Food Vendors in Northern Kuching City, Sarawak. Journal of Borneo Science, 31, 95‐103. Rahman, R. (2019). Indonesia Welcomed 15.8 Million Foreign Tourists Last Year: BPS. The Jakarta Post. February 01, 2019.
241
Rakodi, C., & Llyod‐Jones, T. (2002). Urban Livelihoods: A People‐Centred Approach to Reducing Poverty. Routledge, London. Ratha, D., & Mohapatra, M. (2007). Increasing the Macroeconomic Impact of Remittances on Development. The World Bank, Washington DC. Ray, C.N., & Mishra, A. (2011). Vendors and Informal Sector A Case‐Study of Street Vendors of Surat City. WIEGO, New Delhi. Rengo‐Rials, R. (2009). International Comparison of Time Use ‐ Couple Studies of Japan, US, France, Korea. Rengo‐Rials, Tokyo. Remi, A., Adegoke, A., & Opoala, N.A. (2010). Impact of Socio‐Economic Factors on the Performance of Small‐Scale Enterprises in Osun State, Nigeria. International Business Research, 3(2), 92‐99. Rhee, C. (2019). Thailand Tourism Highlights for 2018. Thailand Business News. January 21, 2019. Roberts, B. (2002). Biographical Research. Open University Press, Buckingham. Roever, S. (2014). Informal Economy Monitoring Study Sector Report: Street Vendors. WIEGO, Cambridge. Roever, S., & Skinner, C. (2016). Street Vendors and Cities. Journal Environment & Urbanization, 28(2), 359–374. Romanow, L. (2012). The Women of Thailand. Global Majority E‐Journal, 3(1), 44‐60. Roseneil, S. (2012). Using Biographical Narrative and Life Story Methods to Research Women's Movements: FEMCIT. Women’s Studies International Forum, 35(3), 129‐131. Roy, A., & Alsayyad, N. (2003). Urban Informality: Transnational Perspectives from the Middle East, Latin America, and South Asia. Lexington Books, Lanham. Rukmana, D. (2007). Growth of Jakarta and Suburbanization in Jakarta’s Peripheral Areas. The Jakarta Post. March 27, 2007. Saide Yacine, Y.A., Ebrima, O., Sisawo, J., & Huang, S. (2017). Sexual Abuse and Risky Sexual Behaviors Among Young Female Hawkers in Burkina Faso: A Mixed Method Study. International Health and Human Rights, 17:1, 1‐9. Samah, M., Abdullah, R., & Ferdousi, N. (2017). Muslim Family Law in Southern Thailand: A Historical Overview. Journal of Muslim Minority Affairs, 37(3), 357‐370. Sariffuddin, S., Wahyono, H., & Brotosunaryo, B. (2017). Street Vendors Hypergrowth: Consequence of Uncontrolled Urbanization in Semarang City. International Journal of Indonesian Society and Culture, 9(1), 81‐91. Sawadee Public Company. (2019). Province and Town Centre Map. Sawadee, Bangkok. Sayer, L.C., England, P., Bittmann, M., & Bianchi, S.M. (2009). How Long Is the Second (Plus First) Shift? Gender Differences in Paid, Unpaid, and Total Work Time in Australia and the United States. Paper presented at the Annual Meeting of the Population Association of America, Boston.

242
Schneider, F., & Enste, D. (2000). Informal Economies: Size, Causes, and Consequences, The Journal of Economic Literature, 38(1), 77‐114. Sclama, G., & Aguiari, S. (2017). Empowering Women in West African Markets Case Study of Street Food Vendors in Maiduguri, Nigeria. VAM Gender and Markets Study #9. World Food Programme Bureau Regional Dakar. Serrano‐Cinca, C., & Gutierrez‐Nieto, B. (2014). Microfinance, the Long Tail and Mission Drift. Journal International Business Review, 23(1), 181‐194. Setia, R. (2008). Ekonomi Informal Perkotaan. Sebuah Kasus Tentang Pedagang Kaki Lima di Kota Bandung. Laporan Penelitian Akatiga, Bandung. Shinder, L. (1998). Zimbabwe’s Informal Sector. Monthly Labor Review, Harare. Siddiqui, T. (2003). Migration as a Livelihood Strategy of the Poor: the Bangladesh Case. Paper at Regional Conference on Migration, Development and Pro‐Poor Policy Choices in Asia, 22‐24 June 2003. Sparrow, R., Suryahadi, A., & Widyanti, W. (2013). Social Health Insurance for the Poor: Targeting and Impact of Indonesia’s Askeskin Programme.” Journal of Social Science and Medicine, 264‐271. Statistics Indonesia. (2010). Sensus Penduduk 2010: Penduduk Menurut Wilayah dan Agama yang Dianut. Badan Pusat Statistik, Jakarta. Strauss, A., & Corbin, J. (1998). Basics of Qualitative Research: Techniques and Procedures for Developing Grounded Theory. Sage Publications, Thousand Oaks, CA. Suharto, E. (2004). Accommodating the Urban Informal Sector in the Public Policy Process: A Case Study of Street Enterprises in Bandung Metropolitan Region (BMR), Indonesia. Research Paper International Policy Fellow, Jakarta. Sukamdi, S., & Mujahid, G. (2015). UNFPA Indonesia Monograph Series: No.3, Internal Migration in Indonesia. UNFPA, Jakarta. Sukka, V. (2014). Gender, Women’s Livelihood in Conflict Area: A Case Study of Pattani Province, Deep South of Thailand. Mekong Institute Research, Bangkok. SUPAS. (2010). Indonesia ‐ Intercensal Population Survey 1995. BPS, Jakarta. Suryahadi, A., & Sumarto, S. (2003). Poverty and Vulnerability in Indonesia Before and After the Economic Crisis. Asian Economic Journal, 2003, 17(1), 45‐64. Susanti, H., & Damayanti, A. (2015). Internal Migration in Indonesia: Duration and Factors. Working Paper in Economics and Business Volume V No.5/2015. Department of Economics, Faculty of Economics and Business University of Indonesia, Jakarta. Tacoli, C. (2012). Urbanization, Gender and Urban Poverty: Paid Work and Unpaid Carework in the City. Urbanization and Emerging Population Issues Working Paper 7. UNFPA, London. Tambunan, T. (2004). Urban Poverty, Informal Sector and Poverty Alleviation Policies in Indonesia. Paper presented at the EDGI and UNU‐WIDER Conference Unlocking Human Potential: Linking Informal and Formal Sectors, 17‐18 September 2004.

243
Tanga, P. T. (2009). Informal Sector and Poverty: The Case of Street Vendors in Lesotho. Organisation for Social Science Research in Eastern and Southern Africa, Addis Ababa, Ethiopia. Teerawichitchainan, B. (2013). Gender and Health Status among Older Adults in Vietnam. Gender and Ageing: Southeast Asian perspectives, Singapore. Temtime, Z.T., & Pansiri, J. (2005). Managerial Competency and Organizational Flexibility in Small and Medium Enterprises in Botswana. Journal of Problems and Perspectives in Management, 1, 25‐36. Thanh, T.N. (2015). Food Safety Behavior, Attitudes and Practices of Street Food Vendors and Consumers in Vietnam. (Unpublished master thesis), Ghent University, Gent. The Central Wage Committee. (2018). New Minimum Wages Ranges Between B308 and B330. Bangkok Post, January 18, 2018. The Deloitte Southeast Asia. (2015). Deloitte Consumer Insights: Capturing Indonesia’s Latent Markets. Deloitte Southeast Asia, Singapore. The Economist Intelligence Unit. (2019). Democratic advances, and a long way to go Asia in The EIU's 2018 Democracy Index. January 9, 2019. The World Bank. (2011). Thailand Now an Upper Middle‐Income Economy. The World Bank, Washington DC. The World Bank. (2018). Education in Indonesia. World Education News. The World Bank, Washington DC. The World Bank. (2019a). Global Economic Prospects. The World Bank, Washington DC. The World Bank. (2019b). GINI index (World Bank estimate) ‐ Country Ranking. The World Bank, Washington DC. The World Bank Development Economics Department & Africa Region. (2007). Remittances, Consumption and Investment in Ghana. Policy Research Working Paper. The World Bank, Washington DC. Thorsen, D. (2017). Migration, Marriage and Intra‐Household Dynamics: Lessons from Bangladesh, Ghana and Indonesia. Migrating out of Poverty, London. Tirtosudarmo, R. (2009). Mobility and Human Development in Indonesia. United Nations Development Programme. Human Development Reports Research Paper 2009/19, Jakarta. Tissington, K. (2009). The Business of Survival: Informal Trading in the City of Johannesburg. Centre for Applied Legal Studies. University of the Witwatersrand, Johannesburg. Tinker, I. (1997). Street Foods: Urban Food and Employment in Developing Countries. Oxford. Tinker, I. (2003). Street Foods: Traditional Microenterprise in a Modernizing World. International Journal of Politics, Culture and Society, 16(3), 331‐349. Transparency International. (2019). Corruption Perceptions Index. Transparency International, Berlin.

244
Tsuya, N., Bumpass, L., & Kim, C.M. (2000). Gender, Employment, and Housework in Japan, South Korea, and the United States. Review of Population and Social Policy, 9, 195–220. Tsai, Yu‐Hsien and Yang, Chich‐Hai. (2018). Does Human Capital Matter to Vendor Profitability: Evidence from Taiwan. Journal of Economics and Management, 14(1), 83‐106. United Nations. (2018). World Urbanization Prospects The 2018 Revision. United Nations, New York. UN Comtrade. (2017). 2017 International Trade Statistics Yearbook. UN, New York. UN DESA. (2014). World Urbanization Prospects The 2014 Revision. United Nations, New York. UN DESA. (2017). World Population Prospects The 2017 Revision Key Findings and Advance Tables. United Nations, New York. UNFPA. (2007). State of world population 2007: Unleashing the Potential of Urban Growth. United Nations Population Fund, New York. UNFPA. (2015). The State of Thailand’s Population 2015: Features of Thai Families in the Era of Low Fertility and Longevity Produced. the United Nations Population Fund Thailand and the Office of the National Economic and Social Development Board. United Nations Population Fund, New York. UNFPA Indonesia. (2015). Women and Girls in Indonesia: Progress and Challenges. UNFPA Indonesia Monograph Series: 5. UNFPA, Jakarta. UN‐HABITAT. (2012). Annual Report 2012. United Nations Human Settlement Programme, Nairobi. UNESCO. (2018). Policy Briefs on Internal Migration in Southeast Asia. UNESCO Bangkok Asia and Pacific Regional Bureau for Education, Bangkok. UNESCO Institute of Statistics. (2018). UIS Education Data Release: September 2018. The United Nations, Washington DC. Uwitije, C. (2016). Contributions of Street Vending on Livelihood of Urban Low‐Income Households in the City of Kigali, Rwanda. (Unpublished master thesis), University of Nairobi, Nairobi. Valodia, I., & Devey, R. (2010). Formal‐Informal Economy Linkages: What Implications for Poverty in South Africa?’ Law, Democracy and Development, 14, 1‐26. Van der Loop, T., & Andadari, R.K. (2010). Social Security for Informal Economy Workers in Indonesia: Looking for Flexible and Highly Targeted Programmes. ILO and Jamsostek, Jakarta. Vyavahare, K. (2016). Street Food Vending in the Food Provisioning System of Mumbai. (Unpublished doctoral thesis). University of Hyderabab, India. Wadji, N., Mulder, C., & Adioetomo, S. (2017). Inter‐regional Migration in Indonesia: A Micro Approach. Journal of Population Research, 34(3), 253–277. Warunsiri, S. (2011). The Role of Informal Sector in Thailand. 2011 International Conference on Economics and Finance Research IPEDR, Singapore.

245
WHO. (1996). Essential Safety Requirement for Street‐Vended Foods. Food Safety Unit Division of Food and Nutrition World Health Organization, Geneva. Winarno, F.G. (2017). Street Food in Asia: An Industry that is Much Better Than Its Reputation. Heinrich Böll Stiftung, March 27, 2017. Winarno, F.G., & A. Allain, 1991. Street Foods in Developing Countries: Lessons from Asia. FAO, Rome. Wipper, M., & Dittrich, C. (2007). Urban Street Food Vendors in the Food Provisioning System of Hyderabad. Institute of Culture Geography, University of Freiburg, Germany. Wongchai, A., Yu‐Chen, Y., & Ke‐Chung, P. (2012). Factors Affecting Rural‐Urban Migration of Northern Thai Farmers. Journal of International Cooperation, 7(1), 91‐106. World Development Report. (2009). Reshaping Economy Geography. The World Bank, Washington DC. WFP. (2017). Empowering Women in West African Markets Case Study of Street Food Vendors in Maiduguri, Nigeria. World Food Programme Bureau Regional, Dakar. WTO and ILO. (2009). Trade and Employment Challenges for Policy Research. WTO and ILO, Geneva. Xia, R. (2015). Building a Bridge between Work‐family Issues and Growth Intentions of Female Entrepreneurs. (Unpublished master thesis). Telfer School of Management University of Ottawa, Canada. Yankson, P. (2000). Land Markets in African Cities: The Case of Peri‐urban Accra. Journal of Urban Studies, 37(13), 2485‐2500. Yeung, W. (2013). Asian Fatherhood. Journal Family Studies, 34, 141–158. Yoddumnern‐Attig, B. (1992). Changing Roles and Statuses of Women in Thailand: A Documentary Assessment. Institute for Population and Social Research, Mahidol University, Bangkok. Zanakis, S., Newburry, W, & Taras, V. (2016). Global Social Tolerance Index and Multi‐method Country Rankings Sensitivity. Journal of International Business Studies, 47(4), 480‐497. Zeleke, B. (2011). Push and Pull Factors of Rural‐Urban Migration and Its Implication on the Place of Origin: The Case of Ankesha Wereda Migrant Street Vendors and Daily Laborers in Addis Ababa. (Unpublished master thesis), Addis Ababa University, Addis Ababa. Zuo, J., & Bian, Y. (2005). Beyond Resources and Patriarchy: Marital Construction of Family Decision‐making Power in Post‐Mao Urban China. Journal of Comparative Family Studies, 36, 601‐622.

246
Appendix
Standardised Questionnaire
Instruction Please put (X) on the box for the answers you choose or fill your answer on space provided.
A. General Information
1. Location/sub district :
2. What time of the day do you start for selling? : a. Noon b. Afternoon c. Evening
3. Name of vendor :
4. Religion : a. Buddha b. Islam c. Catholic
d. Christian e. Hindu f. Other, ________
5. Ethnic group : a. Sunda b. Jawa c. Batak
d. Padang e. Chinese f. Madura
g. Betawi h. Lainnya______________
6. Age :
7. Marital status : a. Single b. Married c. Engaged
d. Separated e. Widowed f. Divorced
8. Number of children :
9. Education Level : a. Illiterate b. Primary school c. Secondary
school
d. Senior high school e. Academic / university
10. Place of birth : a. Banten b. Jawa Barat c. Jakarta
d. Jateng e. Jatim f. ogyakarta
g. Kalimantan h. Sumatera i. Others___
11. Where did you live five years ago:
a. Tangerang b. Banten c. Jawa Barat
d. Jakarta e. Jateng f. Jatim
g. Yogyakarta h. Sumatera i. Others

247
12. With whom do you live?
a. Children b. Husband c. Husband and children
d. Husband, parents and children e. Husband, children and relatives.
f. Friends g. Alone h. Spouse
13. How many persons does your household consist of (including yourself)?
B. Causes and consequences of migration
1. When did you migrate to Hat Yai/Tangerang__________________________________
2. Who made the decision to migrate to Tangerang/Hat Yai?
a. No one (self‐desire) b. Relatives c. Parents
d. Friends e. Husband f. Spouse
3. What was your main source of information to migrate?
a. Friends and Relatives b. Mass media c. Previous visit
d. Family members e. Others
4. Before you moved, you were:
a. Vendor b. Wage labor c. Housewife d. Unemployed
e. Student f. Others
5. What was/were the main reason(s) for you to come to Hat Yai/Tangerang? (You can choose
more than one)
a. Poverty and unemployment
b. Better prospects
c. To create job and migration opportunities for additional family members
d. Insufficient farming income
e. Lack of regular work in the place of origin
g. Other (specify) ________________________________________
6. In Hat Yai/Tangerang, is there a community of people from your previous place of residence?
a. Yes b. No
If your answer is “yes”, what is the name of the community?
_____________________________
7. Do you have plan to move to another place?
a. Yes b. No

248
C. Labour: Working conditions and Pre‐Conditions
1. When did you start your business ____________________________
2. Have you had previous job in the host area?
a. Yes b. No
If “yes”, what your main job before starting with your current business?
a. Permanent employment
b. Paid government employment
c. Housemaid
e. Student
f. Own business g. Others____________________
3. Do you have previous business experience before this one?
a. Yes b. No
If “yes”, where and when? _____________________________________
4. At the time of business planning, did people support you in obtaining business ideas and
identifying profitable activities, advices and moral support?
a. Yes b. No
If “yes”, would you please tell me the persons who gave your business advice, information
and moral support?
a. Husband b. Children c. Parents d. Friends
e. Relatives f. Spouse g. Others
5. Employment of Wage Labour
a. Are there family members who are working in this business? a. Yes b. No
b. Are you paying wages for family members who are working with you? a. Yes b. No
c. How much is the mean monthly wage per employee?
6. Means of transportation used to carry these products:
a. Public transport b. My own motorcycle c. My own car d. Walking
e. Others____________________
7. How is the attitude of your customers towards you?
a. Co‐operative b. Neutral c. Adverse
8. Did you and your family members have access to public/private medical services when you
started the business? a. Yes b. No
9. Did you and your family members have access to public/private medical services at present?
a. Yes b. No

249
D. Access to Basic Resources: Startup‐Capital, Location, Facilities
1. What were the difficulties you faced when you started the business? (You can answer more
than one)
a. Lack of capital + credit
b. Harassment by police
c. Eviction by private shop guardians
e. Lack of working place
f. High price of commodities
g. To gain the customers
h. Others (specify) ________________________________
2. Initial working business capital
Variables Initial Working
Capital
Present Working Capital
Notes
Business Capital
Food cart/food stall/kiosk
Kitchen supplies
Daily stock (food, ingredients, etc.)
3. Source of initial capital for business
a. Borrowing from Banks b. Relatives c. Borrowing from friends
d. Spouse e. Husband f. Parents
g. Savings h. Moneylender
4. The location of street food vendor’s trading activities
a. Street side b. Sidewalks c. In front of the store
d. Empty lot e. Government market store f. Parking lots
g. In front of the house h. Other _________________
5. How did you obtain access to your trading site/premises?
a. From informal leaders b. Given from family
c. Saw an empty space and used d. From the government e. Others
6. Whilst selling, do you have access to the following services?
Free access Paid access Not required
Clean Running Water
Toilet
Electricity & Gas
Garbage collection & solid waste disposal
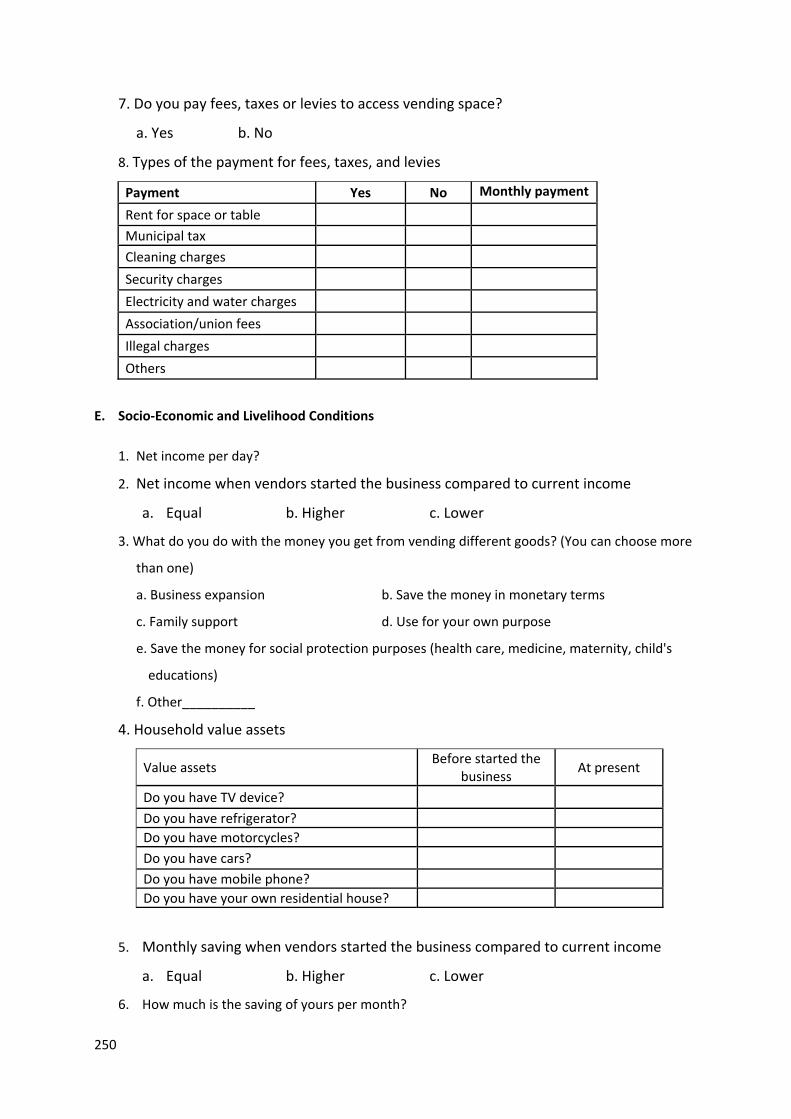
250
7. Do you pay fees, taxes or levies to access vending space?
a. Yes b. No
8. Types of the payment for fees, taxes, and levies
Payment Yes No Monthly payment
Rent for space or table
Municipal tax
Cleaning charges
Security charges
Electricity and water charges
Association/union fees
Illegal charges
Others
E. Socio‐Economic and Livelihood Conditions
1. Net income per day?
2. Net income when vendors started the business compared to current income
a. Equal b. Higher c. Lower
3. What do you do with the money you get from vending different goods? (You can choose more
than one)
a. Business expansion b. Save the money in monetary terms
c. Family support d. Use for your own purpose
e. Save the money for social protection purposes (health care, medicine, maternity, child's
educations)
f. Other__________
4. Household value assets
Value assets Before started the
business At present
Do you have TV device?
Do you have refrigerator?
Do you have motorcycles?
Do you have cars?
Do you have mobile phone?
Do you have your own residential house?
5. Monthly saving when vendors started the business compared to current income
a. Equal b. Higher c. Lower
6. How much is the saving of yours per month?
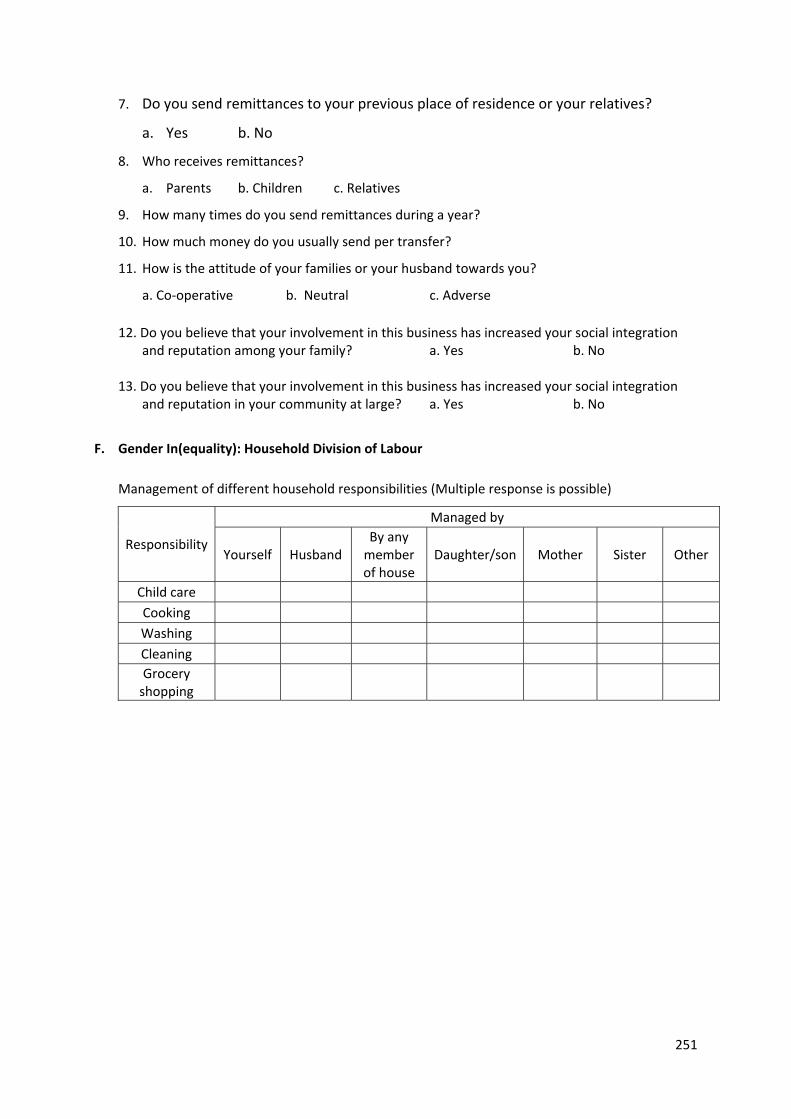
251
7. Do you send remittances to your previous place of residence or your relatives?
a. Yes b. No
8. Who receives remittances?
a. Parents b. Children c. Relatives
9. How many times do you send remittances during a year?
10. How much money do you usually send per transfer?
11. How is the attitude of your families or your husband towards you?
a. Co‐operative b. Neutral c. Adverse
12. Do you believe that your involvement in this business has increased your social integration and reputation among your family? a. Yes b. No
13. Do you believe that your involvement in this business has increased your social integration
and reputation in your community at large? a. Yes b. No
F. Gender In(equality): Household Division of Labour
Management of different household responsibilities (Multiple response is possible)
Responsibility
Managed by
Yourself Husband By any member of house
Daughter/son Mother Sister Other
Child care
Cooking
Washing
Cleaning
Grocery shopping

9 783737 608930
ISBN 978-3-7376-0893-0


