Page 1
WOOD PLASTIC COMPOSITE SILL PLATE FOR CONTINUOUS ANCHORAGE
OF SHEAR WALLS IN LIGHT-FRAME WOOD STRUCTURES
By
JASON O’DELL
A thesis submitted in partial fulfillment of
the requirements for the degree of
MASTER OF SCIENCE IN CIVIL ENGINEERING
WASHINGTON STATE UNIVERSITY
Department of Civil and Environmental Engineering
AUGUST 2008
Page 2
ii
To the Faculty of Washington State University:
The Members of the Committee appointed to examine the thesis of JASON
O’DELL find it satisfactory and recommend that it be accepted.
___________________________
Chair
___________________________
___________________________
Page 3
iii
ACKNOWLEDGEMENT
First, I would like to thank the Office of Naval Research for funding this project
(under contract N00014-06-1-0874) and allowing me to take on this endeavor. It has
been a valuable learning experience.
Next, I would like to thank my colleagues at Washington State University for
their support and guidance throughout this project. In particular, I would like to thank
Dr. J. Daniel Dolan for his guidance on the direction of this project and sharing his vast
knowledge of shear wall behavior; Dr. William Cofer for his guidance on the finite
element method and computer modeling; Dr. Karl Englund for his guidance on the
properties and behavior of wood plastic composites; and Scott Lewis for his technical
advice and assistance in conducting the testing needed to accomplish the goals of this
research.
Finally, I would like to thank my family; my wife, Teresa, for her support and
understanding through the long hours of schoolwork and my parents for instilling in me
the determination and work ethics that have allowed me to accomplish anything that I
have ever set my mind to.
Page 4
iv
WOOD PLASTIC COMPOSITE SILL PLATE FOR CONTINUOUS ANCHORAGE
OF SHEAR WALLS IN LIGHT-FRAME WOOD STRUCTURES
Abstract
By Jason O’Dell, M.S.
Washington State University
August 2008
Chair: J. Daniel Dolan
Past research and post-disaster investigations have exposed a few shortcomings in
the use of wood sill plates in light-frame wood shear walls. The first is the fact that uplift
forces, caused by overturning resistance, induce cross-grain bending in sill plates due to
forces from the sheathing-to-sill plate connectors lifting the edge of the sill plate. This
bending along the line of anchor bolts often times results in splitting of the sill plate and
loss of lateral resistance. The second is wood’s inherent property to decay when exposed
to moisture and a sill plate’s highly exposed nature to moisture. Past studies have also
shown that wood plastic composites (WPCs) can be utilized to reduce these problems and
are a viable substitution for typical wood sill plates.
In this thesis, a concept of continuous anchorage of a WPC sill plate to improve
the performance of light-frame wood shear walls is pursued. This was accomplished by
the modeling of a WPC sill plate which included a fin along the bottom edge that can be
embedded in a concrete foundation instead of the use of anchor bolts. This embedment
into the foundation of a structure will provide continuous anchorage of the shear wall.
Page 5
v
This thesis contains the development of a finite element model that is useful for
investigating the behavior of a WPC sill plate that has been designed for continuous
anchorage of light-frame wood shear walls. The model was verified using a slightly
modified cross-section that was easily manufactured and tested.
The resulting model indicates that the continuous anchorage concept is viable.
Shear walls with continuous anchorage showed a doubling in strength over unrestrained
shear walls built by current prescriptive methods, and are comparable in strength to shear
walls with traditional overturning restraint.
Page 6
vi
TABLE OF CONTENTS
ACKNOWLEDGEMENT ................................................................................................. iii
ABSTRACT ....................................................................................................................... iv
TABLE OF CONTENTS ................................................................................................... vi
TABLE OF FIGURES ..................................................................................................... viii
TABLE OF TABLES ....................................................................................................... xii
CHAPTER 1: INTRODUCTION ....................................................................................... 1
1.1 Problem Overview .................................................................................................... 1
1.2 Background ............................................................................................................... 3
1.2.1 Shear Walls ........................................................................................................ 3
1.2.2 Shear Wall Finite Element Models .................................................................... 6
1.2.3 Wood Plastic Composite Sill Plates ................................................................... 8
1.3 Motivation ............................................................................................................... 10
1.4 Objectives ............................................................................................................... 10
CHAPTER 2: MODEL DEVELOPMENT ...................................................................... 12
2.1 Sill Plate Model....................................................................................................... 12
2.2 Wall Framing Model ............................................................................................... 19
2.2.1 Original Concept Wall Framing Model ........................................................... 19
2.2.2 Verification Wall Framing Model.................................................................... 24
CHAPTER 3: CONNECTION PERFORMANCE EVALUATION ................................ 27
3.1 Materials and Methods ............................................................................................ 27
3.2 Results ..................................................................................................................... 33
Page 7
vii
CHAPTER 4: VERIFICATION AND SIMULATIONS ................................................. 35
4.1 Evaluation Parameters ............................................................................................ 35
4.2 Model Verification .................................................................................................. 36
4.2.1 Verification Testing Results ............................................................................ 36
4.2.2 Verification Model Results .............................................................................. 37
4.2.3 Comparison of Verification Model to Testing Results .................................... 38
4.3 Continuous Anchorage Shear Wall Simulation ...................................................... 40
4.3.1 Original Concept Model Results ...................................................................... 40
4.3.2 Comparison of Original Concept Model with Other Wall Configurations ...... 42
CHAPTER 5: CONCLUSIONS AND RECOMMENDATIONS .................................... 46
5.1 Conclusions ............................................................................................................. 46
5.2 Recommendations and Future Research ................................................................. 47
5.2.1 Connection Tests .............................................................................................. 47
5.2.2 Finite Element Model ...................................................................................... 48
5.2.3 General Recommendations .............................................................................. 48
5.3 Closing Comments .................................................................................................. 49
REFERENCES ................................................................................................................. 50
APPENDIX A: CONNECTION TEST RESULTS .......................................................... 53
Page 8
viii
TABLE OF FIGURES
Figure 1. 1: Cross-Grain Bending of a Traditional Wood Sill Plate ................................... 3
Figure 1. 2: Load Path of Lateral Loads Through a Common Light-Frame Lateral Force
Resisting System ................................................................................................................. 4
Figure 1. 3: Typical light-frame wood Shear Wall ............................................................. 5
Figure 2. 1: Original Concept WPC Sill Plate .................................................................. 13
Figure 2. 2: Cross-Sectional View of Verification Sill Plate Specimen ........................... 14
Figure 2. 3: Boundary Conditions on Sill Plate Model ..................................................... 17
Figure 2. 4: Sill Plate Finite Element Model .................................................................... 18
Figure 2. 5: Side View Representation of Finite Element Model ..................................... 22
Figure 2. 6: Changes Made to the Original Concept Wall Model .................................... 25
Figure 2. 7: Side View Representation of Verification Finite Element Model ................ 26
Figure 3. 1: Schematic of Testing Configuration.............................................................. 28
Figure 3. 2: Test Setup ...................................................................................................... 29
Figure 3. 3: Testing Fixture .............................................................................................. 30
Figure 3. 4: OSB Connected to WPC With an 8d Nail ..................................................... 31
Figure 3. 5: WPC Connected to Lumber With a 16d Nail ................................................ 31
Figure 3. 6: Sheet Metal Connected to Lumber With an 8d Nail ..................................... 32
Figure 3. 7: OSB Connected to Lumber With an 8d Nail Through Sheet Metal .............. 32
Figure 4. 1: Verification Test Results ............................................................................... 37
Figure 4. 2: Verification Wall Framing Model Results .................................................... 38
Figure 4. 3: Model Results Superimposed with Verification Test Data ........................... 38
Figure 4. 4: Manufacture of Verification Sill Plates ......................................................... 39
Page 9
ix
Figure 4. 5: 3-D Stress Analysis Results .......................................................................... 41
Figure 4. 6: 2-D Plane Stress Analysis Results................................................................. 41
Figure 4. 7: Model Results Superimposed with Duchateau's WPC Sill Plate Test Data .. 44
Figure A. 1: Testing Results - 8d (0.131” diameter by 2 .5” long) Nail Connecting OSB
to WPC Run 1 ................................................................................................................... 55
Figure A. 2: Testing Results - 8d (0.131” diameter by 2 .5” long) Nail Connecting OSB
to WPC Run 2 ................................................................................................................... 56
Figure A. 3: Testing Results - 8d (0.131” diameter by 2 .5” long) Nail Connecting OSB
to WPC Run 3 ................................................................................................................... 56
Figure A. 4: Testing Results - 8d (0.131” diameter by 2 .5” long) Nail Connecting OSB
to WPC Run 4 ................................................................................................................... 57
Figure A. 5: Testing Results - 8d (0.131” diameter by 2 .5” long) Nail Connecting OSB
to WPC Run 5 ................................................................................................................... 57
Figure A. 6: Testing Results - 8d (0.131” diameter by 2 .5” long) Nail Connecting OSB
to WPC Run 6 ................................................................................................................... 58
Figure A. 7: Testing Results - (2) 16d (0.162” diameter by 3.5” long) Nails Connecting
WPC to Lumber Run 2 ..................................................................................................... 58
Figure A. 8: Testing Results - (2) 16d (0.162” diameter by 3.5” long) Nails Connecting
WPC to Lumber Run 3 ..................................................................................................... 59
Figure A. 9: Testing Results - (2) 16d (0.162” diameter by 3.5” long) Nails Connecting
WPC to Lumber Run 4 ..................................................................................................... 59
Figure A. 10: Testing Results - (2) 16d (0.162” diameter by 3.5” long) Nails Connecting
WPC to Lumber Run 5 ..................................................................................................... 60
Page 10
x
Figure A. 11: Testing Results - (2) 16d (0.162” diameter by 3.5” long) Nails Connecting
WPC to Lumber Run 6 ..................................................................................................... 60
Figure A. 12: Testing Results - 8d (0.131” diameter by 2 .5” long) Nail Connecting
Sheet Metal to Lumber Run 1 ........................................................................................... 61
Figure A. 13: Testing Results - 8d (0.131” diameter by 2 .5” long) Nail Connecting
Sheet Metal to Lumber Run 2 ........................................................................................... 61
Figure A. 14: Testing Results - 8d (0.131” diameter by 2 .5” long) Nail Connecting
Sheet Metal to Lumber Run 3 ........................................................................................... 62
Figure A. 15: Testing Results - 8d (0.131” diameter by 2 .5” long) Nail Connecting
Sheet Metal to Lumber Run 4 ........................................................................................... 62
Figure A. 16: Testing Results - 8d (0.131” diameter by 2 .5” long) Nail Connecting
Sheet Metal to Lumber Run 5 ........................................................................................... 63
Figure A. 17: Testing Results - 8d (0.131” diameter by 2 .5” long) Nail Connecting
Sheet Metal to Lumber Run 6 ........................................................................................... 63
Figure A. 18: Testing Results - 8d (0.131” diameter by 2 .5” long) Nail Connecting
Sheet Metal to Lumber Run 7 ........................................................................................... 64
Figure A. 19: Testing Results - 8d (0.131” diameter by 2 .5” long) Nail Connecting OSB
to Lumber Sandwiching Sheet Metal Run 1 ..................................................................... 64
Figure A. 20: Testing Results - 8d (0.131” diameter by 2 .5” long) Nail Connecting OSB
to Lumber Sandwiching Sheet Metal Run 2 ..................................................................... 65
Figure A. 21: Testing Results - 8d (0.131” diameter by 2 .5” long) Nail Connecting OSB
to Lumber Sandwiching Sheet Metal Run 3 ..................................................................... 65
Page 11
xi
Figure A. 22: Testing Results - 8d (0.131” diameter by 2 .5” long) Nail Connecting OSB
to Lumber Sandwiching Sheet Metal Run 4 ..................................................................... 66
Figure A. 23: Testing Results - 8d (0.131” diameter by 2 .5” long) Nail Connecting OSB
to Lumber Sandwiching Sheet Metal Run 5 ..................................................................... 66
Figure A. 24: Testing Results - 8d (0.131” diameter by 2 .5” long) Nail Connecting OSB
to Lumber Sandwiching Sheet Metal Run 6 ..................................................................... 67
Figure A. 25: Testing Results - 8d (0.131” diameter by 2 .5” long) Nail Connecting OSB
to Lumber Sandwiching Sheet Metal Run 7 ..................................................................... 67
Page 12
xii
TABLE OF TABLES
Table 3. 1: Connection Specimens.................................................................................... 30
Table 3. 2: Average Hysteretic Parameters Determined From Connection Test Data ..... 33
Table 4. 1: Shear Wall Capacities of Various Configurations........... ................................43
Table A. 1: Tabulated Parameters for 8d (0.131” diameter by 2 .5” long) OSB to WPC
Connections.......................................................................................................................53
Table A. 2: Tabulated Parameters for 16d (0.162” diameter by 3.5” long) WPC to
Lumber Connections ......................................................................................................... 53
Table A. 3: Tabulated Parameters for (2) 16d (0.162” diameter by 3.5” long) WPC to
Lumber Connections ......................................................................................................... 54
Table A. 4: Tabulated Parameters for 8d (0.131” diameter by 2 .5” long) Sheet Metal to
Lumber Connections ......................................................................................................... 54
Table A. 5: Tabulated Parameters for 8d (0.131” diameter by 2 .5” long) OSB to Lumber
Sandwiching Sheet Metal Connections ............................................................................ 55
Page 13
J. O’Dell Chapter 1: Introduction 1
CHAPTER 1: INTRODUCTION
1.1 Problem Overview
Historically, light-frame wood structures were thought to perform quite well
during seismic activity due to their low mass and high redundancy. The 1994 Northridge
Earthquake corrected this perception by leaving 25,000 dwellings uninhabitable, 7,000
buildings red-tagged, 22,000 buildings yellow-tagged, and 9 hospitals closed, making it
the most costly natural disaster up to the time of its occurrence (DIS 2007).
The investigations following the disaster showed that in many instances a
significant amount of moisture had made its way up between the foundation and the
external cladding, significantly reducing the strength of shear walls in light-frame wood
structures. With a main component of the lateral force resisting system damaged by
decay, an entire structure becomes dangerous. Adding to the hazard of this situation is
the fact that shear wall damage is concealed within the walls, and is often not discovered
until it is too late (i.e., post-disaster investigations).
Structural damage resulting from moisture infiltration is also quite costly
monetarily. A few of the more significant cases in the last decade are, “leaky
condominiums of Vancouver [British Columbia] that involved over CDN $1 Billion in
damages, decay in sheathing in North Carolina that involved the class action settlement
of US $20 million in 1998, decay in framing and sheathing in leaky condominiums in
Seattle with damage over US $100 million” (CRD 2007). The extent of this problem was
well stated by Kubal (2000) when he said that moisture problems “damage or completely
destroy more buildings and structures than war or natural disaster”.
Page 14
J. O’Dell Chapter 1: Introduction 2
In the United States, 80-90% of all structures are of wood-frame construction. In
Los Angeles County alone (where the Northridge Earthquake struck), 81% of structures
and 99% of residences are of wood-frame construction (Mahaney and Kehoe 2002).
With such a large percentage of the population living and working in wood-frame
structures, it is apparent that something needs to be done to reduce this moisture damage
problem.
The results of the Northridge Earthquake sparked massive changes in the
engineering world. One of these changes has been to take a closer look at the behavior of
shear walls and their components under cyclic loading. In 2002, the Consortium of
Universities for Research in Earthquake Engineering (CUREE), conducted tests on
wood-frame shear wall assemblies. Out of the sixty-three valid tests, thirty-four of them
failed at the sill plate (Mahaney and Kehoe 2002). Sill plate failures are often a result of
the eccentricity of the sheathing-to-sill plate connectors pulling up on one side of the sill
plate cross-section while anchor bolts hold the sill plate down to the foundation of floor
platform along the centerline. This results in a tension failure on the bottom side of the
sill plate and runs parallel to the grain as can be seen in Figure 1.1. These tests did not
take into account the loss of strength that occurs when wood members have been affected
by decay.
One thing that several building codes have done to decrease moisture damage to
this critical, yet highly exposed, element is to require treated lumber for structural
elements in contact with concrete foundations. But because of environmental and
fastener corrosion issues, treated lumber is becoming increasingly costly and more
difficult to work with.
Page 15
J. O’Dell Chapter 1: Introduction 3
Figure 1. 1: Cross-Grain Bending of a Traditional Wood Sill Plate
1.2 Background
1.2.1 Shear Walls
Shear wall are primarily used to resist lateral forces, such as those induced on a
structure by wind and earthquakes. In addition to this, shear walls also transfer gravity
loads. A light-frame wood shear wall is typically composed of three components; 1)
framing, 2) sheathing, and 3) framing-to-sheathing connectors. Also important to bottom
story shear wall performance, but technically not a component of the shear wall itself, is
the foundation-to-framing connection. This study focused on a combined
framing/foundation-to-framing connection member by investigating a sill plate that will
be embedded in the concrete foundation. This is discussed further in Section 1.2.3.
The load path of a common lateral force resisting system is depicted in Figure 1.2.
Horizontal loads are transferred to the floor diaphragm through out-of-plane bending of
Page 16
J. O’Dell Chapter 1: Introduction 4
the walls transverse to the load. From the diaphragm, the load is transferred to the walls
parallel to the load. These are the shear walls. The shear walls then transfers the load to
the foundation and earth through the foundation-to-framing connectors.
Figure 1. 2: Load Path of Lateral Loads Through a Common Light-Frame Lateral Force Resisting
System
Typical framing for a light-frame wood shear wall is composed of either 2X4 or
2X6 nominal lumber. The species of wood used depends on what is available in the
location of construction. Studies have shown that the framing does not add significantly
to the in-plane stiffness of a shear wall (Dolan 1989). Sheathing is typically a panel-type
wood product such as plywood or oriented strand board (OSB). It is the sheathing that
transfers the lateral forces of a typical shear wall system (Bredel 2003). The typical
framing-to-sheathing connector elements are dowel-type fasteners such as nails or
Page 17
J. O’Dell Chapter 1: Introduction 5
staples. It has been long understood that the framing-to-sheathing connector elements are
the most important factor in determining the strength and stiffness of shear walls (Foschi
1977; McCutcheon 1985; Dowrick 1986; Stewart 1987; Dolan 1989; Dolan and Madsen
1992; Heine 1997). A typical assembled shear wall is shown in Figure 1.3.
Figure 1. 3: Typical light-frame wood Shear Wall
It was in the 1940’s when panel-type sheathing began its rise to popularity. In
1949, design guidelines were published for panel-type sheathing, bringing the modern
shear wall into common construction practices. Because the mechanics of panel-type
sheathing and shear walls was not well understood, design guidelines were primarily
based on experience and testing. Because of the high cost associated with dynamic
testing, shear wall research has focused on monotonic performance.
Dolan (1989) did some of the earliest cyclic and shake table testing of shear walls
and found that the cyclic response envelope correlated well with the monotonic
performance curve. Since then, other researchers have come to the same conclusion.
Page 18
J. O’Dell Chapter 1: Introduction 6
Because of this, traditionally, shear walls have been designed for earthquake performance
(cyclic loading) based on monotonic tests (Salenikovich 1997; Rose 1998).
The investigations following the Northridge Earthquake in 1994 found that shear
walls designed based on monotonic performance did not perform as well under cyclic
loading as previously thought. In 1995, the City of Los Angles Department of Building
and Safety issued an emergency code change that reduced the shear design strength of
code-recognized allowable design values for shear walls that were based on monotonic
testing by 25% (Rose 1998).
The last decade has seen numerous investigations into various aspects of shear
wall performance under cyclic loading.
1.2.2 Shear Wall Finite Element Models
In the last half century, the method of finite elements (FE) has proven to be a
superb solution technique to many investigations. Starting in the aeronautics industry in
the 1940’s, the method rapidly spread to other disciplines. The method has been used for
analyzing shear walls since the 1960’s (Salenikovich 2000). Because of its versatility
and accuracy, the finite element method’s popularity soared, and in the 1970’s
researchers started to use the method to predict stresses, deflections, and ultimate load
capacities of walls (Polensek 1976). Around this same time, researchers began to look at
the nonlinear behavior of shear wall connections (Foschi 1977). It wasn’t until computer
technology made some major advances in the 1980’s that the finite element method
became practical to look at dynamic, pseudo-dynamic, and cyclic shear wall behavior.
As the price of computers decreased, finite element analysis became more cost effective
Page 19
J. O’Dell Chapter 1: Introduction 7
in comparison with physical testing for many research concepts (or at least a cost
effective way to start some research).
One of the first shear wall finite element models was put together by Foschi
(1977). This model was modified by various researchers. Some of those that proposed
new models were Itani and Cheung (1984), Gutkowski and Castillo (1988) and Falk and
Itani (1989). However, none of these models accounted for dynamic or cyclic response
of shear walls. In 1989, Dolan proposed a model that was capable of looking at the
dynamic and cyclic response of shear walls. He also made the model general so that
various aspects could be easily investigated. After verification testing, Dolan determined
that his model could be simplified to reduce the number of degrees of freedom (DOFs)
and reduce computer effort. Then in 1995, White and Dolan simplified Dolan’s model.
In addition to the reduced number of DOFs that Dolan suggested, this model was also
capable of computing a time history of forces and stresses in the framing and sheathing
elements.
Commercially available, general use finite element programs have also been
evolving over the years. These packages are used by placing points in space, connecting
them with the desired type of elements (beam, shell, etc.) which will behave in a certain
way, assigning properties to the elements (strength, stiffness, etc.), and applying loading
and boundary conditions. These programs are capable of a huge array of applications.
This is why these packages were chosen to accomplish the research contained in this
thesis.
Over the years, the sheathing-to-framing connectors have been shown to be the
controlling factor in most shear wall failures. This has initiated many investigations into
Page 20
J. O’Dell Chapter 1: Introduction 8
connection behavior (Toothman 2003). Some investigations have shown that the
nonlinear, hysteretic response of connections can be described with ten parameters
(Foliente 1995; Anderson 2006).
The cost associated with connection tests is drastically lower than the cost of
conducting full scale shear wall tests. If the parameters that describe the hysteretic
behavior of connectors can be obtained from connection tests, then a finite element model
of the shear wall can be created using these parameters and reducing research costs.
In 2006, Xu published results of creating a user defined element type for a finite
element program, ABAQUS, which reflects the hysteretic response of framing-to-
sheathing connectors. He was able to model the hysteretic behavior of dowel-type
connectors with 13 parameters that can be obtained from cyclic connection tests. The
research contained in this thesis will make use of this element type in an attempt to create
the most accurate finite element model possible.
1.2.3 Wood Plastic Composite Sill Plates
Since the U.S. Navy has such a large inventory of waterfront structures, The
Office of Naval Research has been funding research in durable building materials for
quite some time.
In 2001, Adcock et al showed that, in Wood Plastic Composite (WPC)
formulations, polymers have a negative influence on stiffness and a positive influence on
strength, while wood has a positive influence on stiffness and a negative influence on
strength. This means that the two materials complement each other well, and with proper
engineering an ideal material can be formulated for a wide variety of applications.
Page 21
J. O’Dell Chapter 1: Introduction 9
Because of this, WPCs are a good candidate for structural applications, venturing out of
their traditional use. One year later in 2002, research conducted by Pendleton et al,
showed that when formulated properly, WPCs are resistant to fungal related decay. This
quality shows that WPCs are an exceptional candidate for use in the construction industry
as a means to significantly reduce moisture related failures in wood-frame structures.
In 2005, The Office of Naval Research funded another study at Washington State
University, this time conducted by Kristen Duchateau (2005), to investigate the potential
of WPCs for use as structural sill plates of shear walls. The results of Duchateau’s
research showed that straight substitution with WPCs result in racking performance
comparable to current prescriptive construction methods in regards to strength. However,
the WPC sill plate reduced the ductility of the shear wall. Deformation gives both some
warning of imminent failure and less energy release upon fracture (because more energy
is dissipated in deforming the material there will be less available to be release when
members breaks). This is why engineers always design for ductile behavior. Because of
this goal, improvements are needed in the material and/or the cross-section of the
member before it can be utilized as a structural member in the construction industry.
In typical slab on grade construction practices, anchor bolts hold the sill plate to
the foundation with the studs in between the anchor bolts lifting the sill plate away from
the foundation. This type of construction can induce severe bending stresses in sill
plates. To reduce this problem, Duchateau recommended that the sill plate be extruded
with a fin on the bottom. The fin could be set into the concrete foundation at time of
casting. By doing this, continuous anchorage of the sill plate is provided; in turn
effectively eliminating the effects of bending stresses. To further increase the strength of
Page 22
J. O’Dell Chapter 1: Introduction 10
the shear wall system, Duchateau also recommended that the sheathing be connected
directly to the sill plate by nailing. This would allow the members of the structural wall
to work more as a system than individual components.
The research presented in this paper is a continuation of Duchateau’s (2005)
research, based on her above two recommendations.
1.3 Motivation
Due to the wide use of light-frame wood structures and the utilization of shear
walls as their primary lateral force resisting system, along with wood’s inherent property
to decay and lose strength when exposed to moisture, the design of shear wall members
exposed to moisture (i.e. sill plates) warrants an investigation.
By utilizing WPCs as sill plates for light-frame wood shear walls, the benefits are
two-fold. First, WPCs can be extruded in almost any shape desired and can be tailored to
the task at hand. Second, when formulated properly, WPCs are not susceptible to
moisture related decay.
1.4 Objectives
The purpose of this study was to develop a finite element model to investigate the
behavior of a WPC sill plate that provides continuous anchorage and the associated
influence on the overall strength and stiffness of light-frame wood shear walls. This
study was conducted with the main goal being to increase the performance of light-frame
Page 23
J. O’Dell Chapter 1: Introduction 11
wood shear walls. This was accomplished by satisfying the following objectives:
Develop an accurate finite element model that will predict the loads transferred to
the conceptual sill plate under cyclic loading.
Develop a detailed finite element model of the conceptual sill plate to look at
stress values and stress distribution over the member.
Verify the accuracy of the model with physical testing.
Compare the results of the finite element model to design values and to cyclic
testing result of light-frame wood shear walls that are built using common
construction practices.
Page 24
J. O’Dell Chapter 2: Model Development 12
CHAPTER 2: MODEL DEVELOPMENT
For this research, two finite element models were developed. The first was the
sill plate model. This was a detailed model of the sill plate alone and was used to
investigate the behavior of the sill plate. This model can be used in the future to fine tune
the sill plate cross section. The second model was the wall framing model. This was a
model of the entire shear wall excluding the sill plate. This model was used to predict the
forces expected to be transferred to the sill plate through the nailed connections.
Two models were used in the investigation because a single model would have
taken an unreasonably long time to converge to a solution. This is primarily due to the
fact that this investigation was concerned with the performance of a conceptual sill plate
that has complicated geometry. In order to get a good idea of how the sill plate performs,
a fine mesh was required of the model. This fine mesh created a need for considerable
computer power. By modeling the sill plate separately, only the steps that produced the
highest load transfer between the wall framing and the sill plate (via the framing-to-sill
plate connectors and the sheathing-to-sill plate connectors) need to be applied to the sill
plate. This reduced the computational run time by orders of magnitude.
2.1 Sill Plate Model
The original concept of the sill plate cross-section is shown in Figure 2.1. This
cross-sectional shape was arrived at after a stress concentration analysis. The shape has
been idealized using three criteria; 1) efficient use of material, 2) a shape that can be
Page 25
J. O’Dell Chapter 2: Model Development 13
effectively extruded, and 3) a shape that can accommodate typical construction practices,
such as attaching interior cladding and using readily available pre-cut studs.
Figure 2. 1: Original Concept WPC Sill Plate
The fin on the bottom of the sill plate was the main feature of this cross-section
under investigation, with hopes being that embedment of this fin into concrete would
reduce bending demand on the sill plate and increase the overall strength of the shear
wall. In addition to this fin, other features incorporated into the sill plate are the
sheathing lip at the top and the stud pockets along the length of the sill plate. The section
will be extruded as a single shape and the stud pockets will have to be routed out after
cooling. The sill plate can be shipped from the manufacturer with stud pockets cut at
standard 16 and 24 inch on center spacing. Non-standard spaced pockets (door and
window locations, etc.) can be routed out on the job-site. The sheathing lip at the top is
for attachment of the sheathing, which will act as blocking and also hold the sheathing
flush with the outside to accommodate siding. The height of the section serves two
purposes, first to act as flashing and protect the studs and sheathing from moisture
Page 26
J. O’Dell Chapter 2: Model Development 14
damage, and second, it will allow for the stud pockets which allow for side grain nailing
of the studs to the sill plate eliminating a weak link in typical light-frame wood walls.
The cross-section shown in Figure 2.1 is for use with 2X6 nominal lumber. If
2X4 nominal lumber is to be used, either the section can be extruded without the flat
portion at the front of the section or this portion can be cut off at the job-site.
Due to the expense associated with WPC extrusion dies, verification of the
continuous anchorage concept was in order before production of the idealized sill plate
was to be undertaken. Therefore, a proof of concept sill plate was manufactured and
tested. The sill plate configuration tested was constructed using standard rectangular
deck board cross-sections and hot-melt bonding technologies. Testing of this alternate
configuration was conducted by Ross (2008), and the results are discussed in Chapter 4.
The configuration tested by Ross is shown in Figure 2.2.
Figure 2. 2: Cross-Sectional View of Verification Sill Plate Specimen
Page 27
J. O’Dell Chapter 2: Model Development 15
This section was constructed by melt-bonding 1”X5.5” WPC deck boards to build
up the section and then machining it to provide the fin to be embedded in concrete. The
sheet metal was used to simulate the stud pockets in the original concept section.
The finite element model for both the idealized and the verification sill plates
were constructed in ADINA. The verification sill plate model was comprised solely of
the WPC material, the sheet metal was not included. This was done because the stress in
the sheet metal is not of interest in this investigation. This project is concerned with the
strength of WPC sill plates. The sheet metal is only present because it simulates the stud
pockets in the verification testing as discussed above. Instead, the sheet metal is included
in the wall framing model and the forces in the sheet metal-to-sill plate connectors were
used to link the two models together. Also, the model does not include the hot-melt
adhesion interfaces in the sill plate. The adhesion interfaces were not included in the
model because the performance of hot-melt bonded WPCs was not anticipated as a
failure mechanism interest in this investigation. Past research has also shown that there is
a minimal drop in shear properties of hot-melt bonded WPCs (Adcock 2001b). Also, the
major stress component on the melt-bonded surfaces in Ross’s experimental
configuration was tension perpendicular to the bond surface due to uplift forces
associated with overturning action of the shear walls. Bonding of deck boards was used
because a solid section of the size needed for verification sill plate manufacture was not
available. In addition, the testing and inclusion of such interface properties would not
have been cost-effective for the purposes of this investigation. The verification sill plate
Page 28
J. O’Dell Chapter 2: Model Development 16
model only serves the purpose of validating the original concept sill plate model because
it can be compared against physical testing results.
As can be seen in Figure 2.2, there is a row of nails and a row of screws that
attach the sheet metal to the WPC. These points were used as the load application points
in the sill plate model. Similarly, loads were applied at points of nailed connections in
the idealized sill plate model. The values of these loads are from the wall framing model
discussed in Section 2.2.
Because only the WPC is modeled, the boundary conditions in this model
simulate the interaction between the sill plate and the foundation. It was assumed that
concrete foundations have enough stiffness that they will only deform a negligible
amount under the loads expected to be transferred by the shear wall. Because the focus
of this investigation is on the WPC, it was also assumed (and forced) that failure would
occur in the sill plate, not the foundation. Because of the bulbous shape (upside-down
triangular shape on the verification model) of the fin, the fin will provide bearing on the
concrete in uplift. This assumption was justified by noting that the amount of material
used in the cross section of the sill plate is small and therefore the horizontal strain
without failure would not be sufficient to compress the sill plate enough to slide out of
the concrete. By this reasoning, it was decided to model the boundary conditions of the
sill plate model as bearing on a rigid body. A visual representation of this boundary
condition is shown in Figure 2.3. In ADINA, the arrows pointing into the sill plate
indicate the sill plate bearing on the rigid body (i.e., concrete). The arrows pointing away
from the sill plate indicate the rigid body bearing on the sill plate.
Page 29
J. O’Dell Chapter 2: Model Development 17
Figure 2. 3: Boundary Conditions on Sill Plate Model
To model the WPC material, 3D solid elements were utilized. The choice of
using solid elements over a beam element was due to the fact that since forces will be
transferred through the sill plate by means of shear and tension/compression the
assumptions with which beam elements are derived do not hold up for this application
(primarily the assumptions of no shear deformation and no stress perpendicular to the
beam axis). Solid elements allow for all deformations/stresses to be accounted for.
WPCs are manufactured by extrusion of a molten mixture through a die. Because
of this, WPC products tend to display an orthotropic material behavior due to the flow
characteristics within the extruder and the cooling process (Lu 2002). To have an
idealized orthotropic WPC, the material must be stranded during manufacture. Since the
actual WPC material to be utilized for the idealized sill plate was unknown, it was chosen
to define the material properties as being orthotropic. For the 2D model, an orthotropic
material definition is not necessary because the properties in the plane of the cross-
Page 30
J. O’Dell Chapter 2: Model Development 18
section are the same regardless of direction. It is the out-of-plane material properties that
require an alternate definition. The FE program will simply treat the 2D case as an
isotropic material since the 2D case was analyzed as plane stress and the out-of-plane
Poisson ratio has no effect on the in-plane results. The values of elastic modulus, and
shear modulus used in the material definition of this model were obtained from
Hermanson (2001a). The value used for Poisson’s ratio was taken from Englund (2007).
A visual representation of the model is shown in Figure 2.4. The arrows along the
length of the sill plate represent the load definitions. The block represents the foundation
that is modeled as a rigid body for boundary condition purposes. Visual representation of
boundary conditions have been omitted for clarity as rigid body bearing fills the image
with arrows and obstructs view of most everything else.
Figure 2. 4: Sill Plate Finite Element Model
The results of this analysis are presented in Chapter 4.
Page 31
J. O’Dell Chapter 2: Model Development 19
2.2 Wall Framing Model
2.2.1 Original Concept Wall Framing Model
The purpose of the wall framing model is to evaluate a wall under cyclic loading
and predict the forces in the framing-to-sill plate and sheathing-to-sill plate connectors so
that accurate loads can be applied to the sill plate model. The basis of this model is the
finite element model created by Xu (2006) to test his hysteretic connector element. Xu’s
model was altered in the following respects:
1) The wall was extended to be eight feet long instead of four feet.
2) Because two sheathing components will be needed for an eight-foot wall,
bearing in between sheets was added.
3) The sill plate was removed and all sheathing-to-sill plate connectors and stud-
to-sill plate connectors were instead attached to fixed nodes that represent
specific locations on the sill plate.
4) The hold-downs at the lower corners of the wall were removed.
The purpose of each change is discussed below.
The wall was made longer because most cyclic shear wall tests are done utilizing
8’X8’ specimens. To check the validity of using the WPC sill plate embedded in
concrete, these are the tests against which this analysis needs to be compared.
The extra sheathing component was added because OSB products are most
readily available in 4’X8’ sheets, and this is what is used in common construction
practice. Thus, two sheets were used for an eight-foot long wall.
The sill plate was removed and modeled separately in order to be more detailed.
A detailed sill plate in the framing model required more memory and processing power
Page 32
J. O’Dell Chapter 2: Model Development 20
than the average personal computer typically has, and the sill plate is the focus of this
research and must be looked at in detail. Instead the sill plate was represented by fixed
nodes that the wall framing model was attached to through the different types of
connector elements discussed below. This boundary condition was justified with two
assumptions: 1) because the sill plate cross section is small, strains are assumed small and
2) because the fin of the sill plate is embedded in concrete, the shear wall has continuous
anchorage and bending is eliminated. These two assumptions remove the flexibility from
the sill plate, allowing the sill plate to transfer forces by means of shear and
tension/compression only. In addition, forces are transferred between the wall and sill
plate strictly through the nail connectors. This allows the wall framing model to be
attached to fixed points rather than a flexible sill plate because the sill plate will simply
transfer the forces from the connectors to the foundation with only negligible
deformations.
The hold-downs were removed from the wall because one of the goals of the use
of a WPC sill plate embedded in concrete is to reduce the amount of hardware that need
be installed.
The model was composed of 4 types of elements: beam, shell, spring, and user
defined. The user defined element was developed by Xu (2006) to simulate the hysteretic
connections of shear walls. The lumber was modeled with six-degree-of-freedom beam
elements. The OSB was modeled with shell elements. Spring elements were utilized for
the lumber-to-lumber connectors and sheathing-to-sheathing bearing elements. All other
connectors were modeled with the user defined hysteretic connector element developed
by Xu (2006) and modified by the author to allow different connection types in the same
Page 33
J. O’Dell Chapter 2: Model Development 21
model (ex. OSB-to-lumber, OSB-to-WPC, etc.). This was necessary because each type
of connection behaves differently and is uniquely described by the 13 parameters which
come from testing of single connections as mentioned in Section 1.2.2 (this will be
discussed further in Chapter 3).
Figure 2.5 shows a side view of the model. In this figure, framing is denoted by
the color brown and sheathing is denoted by the color yellow. The different types of
connectors are denoted by various colors. The green connectors are non-linear springs
that model the nails connecting the studs to the top plate. The red connectors are
hysteretic springs that model the nails connecting the sheathing to the studs. The blue
connectors are hysteretic springs that model the nails connecting the sheathing to the sill
plate. The orange connectors are hysteretic springs that model the nails connecting the
studs to the sill plate. Not shown are non-linear springs that model the bearing between
component surfaces (i.e, between the two sheets of OSB). Hysteretic springs act in both
the vertical plane and the plane into the page. All other springs only act in the direction
shown. The top of the studs and the bottom of the studs were coupled to the top plate and
the sill plate nodes respectively in the horizontal plane and the plane into the page.
The largest obstacle that had to be overcome with this model was the highly non-
linear response of the hysteretic connectors. Non-linear problems require significantly
more computer power to solve and are less likely to reach convergence. Because of the
hysteretic connection behavior, the wall framing model analysis became a non-linear
problem. As the simulation approached the failure load, the solution of the mathematical
equations became unstable and singular, which is similar to what happens when finite
elements are used to predict buckling instabilities.
Page 34
J. O’Dell Chapter 2: Model Development 22
Figure 2. 5: Side View Representation of Finite Element Model
As discussed in Section 1.2.1, connector behavior is the factor that contributes
most to overall shear wall performance. Each connector element affects the stiffness of
the shear wall, which affects the distribution of load to all the other connectors, which in
turn affects the behavior of each connector, and this circle continues. The model
converges when each connector agrees on a solution and the cycle is stopped. But,
because each connector is so dependent on the behavior of other connectors in this circle,
and each connector has such a highly non-linear response, convergence is slow. When
the hold-downs were removed from Xu’s model, convergence became impossible within
a reasonable amount of modeling and computer effort. After some diagnostic work, it
was discovered that under the deflections that were expected, as long as only a couple of
Page 35
J. O’Dell Chapter 2: Model Development 23
connectors were used, the model would converge. But, with the number of connectors
needed for a shear wall built to building code minimum, the solution would not converge
due to the connector element’s highly non-linear behavior causing endless looping of the
solution in the region of large connector stiffness changes. Other methods had to be
utilized to achieve a solution.
Convergence was achieved through two methods; artificial damping for most
cases and a line search algorithm for cases where convergence was reached too slowly.
Artificial damping is the addition of a small viscous damping effect to the hysteretic
springs. The use of viscous forces works well in this model because the analysis was
quasi-static. Since viscous damping is based on velocity, the damping does not affect the
overall model significantly. But when a local instability occurs, the velocity increases in
that region only. This allows the viscous damping forces to increase at the local
instability only, keeping the model from diverging because of one connector. By adding
these damping forces, the interaction of one connector with another was reduced in each
step of the solution in order that the collection of connectors was capable of reaching
convergence.
A line search algorithm was used when the solution diverges in early iterations
using the Newton method of solution that ABAQUS uses by default. The line search
algorithm makes the Newton method more robust by scaling down the residual vectors so
that the correction vectors do not overshoot the solution, allowing convergence to be
reached faster.
Failure of the wall framing was assumed to occur when the model could not
converge on a solution for a particular step. The cause of this inability to converge was
Page 36
J. O’Dell Chapter 2: Model Development 24
due to negative Eigen values in the stiffness matrix. Negative Eigen values indicate a
negative stiffness. Negative stiffness indicates free body motion (i.e., an unstable
structure).
2.2.2 Verification Wall Framing Model
Once the original concept wall framing model was able to converge, it was altered
to depict the shear wall construction utilized for the verification sill plate discussed
above.
The finite element model was modified to match these verification tests by
making the following changes.
1) Shell elements were added to model the sheet metal between the sheathing and
framing.
2) A connection element, modeled after the bending stiffness of the cantilever
portion of the sill plate cross section, was used to attach the sheet metal to the
sill plate nodes.
3) Stud to sill plate connection elements were removed and replaced with bearing
elements.
These changes are illustrated in Figure 2.6. The purpose of each change is discussed
below.
As discussed in Section 2.1, the sheet metal elements were added because the
verification tests used sheet metal instead of the originally intended stud pockets.
The purpose of the connection modeled after the bending stiffness of the
cantilever portion of the cross section was an attempt to more accurately model the
Page 37
J. O’Dell Chapter 2: Model Development 25
Figure 2. 6: Changes Made to the Original Concept Wall Model
to Simulate the Verification Wall Configuration
specimens. Since all loads transferred to the WPC sill plate must pass through the sheet
metal, the bending stiffness of the short segment between the fin embedded in the
concrete and the edge where the sheathing is attached to the sill plate will play a role in
distribution of forces and the performance of the shear wall. The idealized wall framing
model does not incorporate this bending stiffness because the idealized sill plate is much
taller and will not act as a cantilever, but the verification sill plate is short and will act as
a cantilever.
Page 38
J. O’Dell Chapter 2: Model Development 26
The stud-to-sill plate connection elements were removed because the construction
of the verification tests did not allow for a direct connection of the studs to the sill plate.
However, the studs will still bear on the sill plate when compression is induced in the
studs.
A side view of the verification model is shown in Figure 2.7. The purple element
is the sheet metal that was added to simulate the stud pockets. The gray and turquoise
connectors are hysteretic springs that model the nail behavior between the OSB and sheet
metal and between the sheet metal and studs respectively. The dark brown connectors
are hysteretic springs that model the bending behavior of the cantilever section of the sill
plate. In this model, the orange connectors are now non-linear springs that model bearing
of the studs.
Figure 2. 7: Side View Representation of Verification Finite Element Model
Page 39
J. O’Dell Chapter3: Connection Performance Evaluation 27
CHAPTER 3: CONNECTION PERFORMANCE EVALUATION
Because the use of WPCs in conjunction with wood lumber in structural
applications is a fairly new practice, the behavior of the two materials acting together is
not well studied. Therefore, to develop an accurate finite element model it is necessary to
first investigate the hysteretic behavior of the connections that are intended to be utilized
in this application.
There are two types of connections that will be used at wood/WPC interfaces in
the application being considered in this research. The first will be the connection of the
WPC sill plate to the studs, the second will be the connection of the sheathing to the
WPC sill plate. In addition to these, two additional connections were investigated for
purposes of the verification testing, Sheet metal to lumber and OSB to lumber with sheet
metal sandwiched in between.
3.1 Materials and Methods
A high density poly-ethylene (HDPE) material was used for the composite
material in this research. It was chosen for two reasons; 1) it is an economical mixture in
regards to price and availability and 2) it is one of the more ductile of the economical
options. The higher ductility is advantageous because it reduces brittle failures and
splitting due to nailing.
The sheathing used was 7/16” oriented strand board (OSB) because it is one of the
most common sheathing types used in light-frame construction.
Page 40
J. O’Dell Chapter3: Connection Performance Evaluation 28
The nails used were 8d (0.131” diameter by 2 .5” long) bright box to attached
sheathing to framing and 16d (0.162” diameter by 3.5” long) bright box to connect
framing members. Box nails were used because they have the smallest diameter of the
readily available nails and thus are assumed to be the weakest-case-scenario. Box nails
are also the most common nail type used in pneumatic nailing tools.
The connection tests were conducted by attaching two pieces of material together
with a nail and subjecting the assembly to cyclic loading. This was accomplished by
clamping one member to the base of the testing frame while the other member is clamped
to a hydraulic actuator. The actuator was driven with a cyclic displacement protocol. A
schematic of the test configuration is shown in Figure 3.1.
Figure 3. 1: Schematic of Testing Configuration
Page 41
J. O’Dell Chapter3: Connection Performance Evaluation 29
The testing setup is shown in Figures 3.2 and 3.3. An 11 kip actuator, MTS
Model Number 244.21, was used to provide the displacement for the testing. A 3 kip
force transducer type load cell, Interface Model Number SSM-AF-3000, was used to
measure the load data. Displacement data was taken from the actuator displacement
transducer. The testing control and data collection was accomplished using an MTS Flex
Test SE controller, running Version 4.0C software. The cyclic protocol used was the
CUREE basic load protocol as outlined in ASTM E2126-05.
Figure 3. 2: Test Setup
Page 42
J. O’Dell Chapter3: Connection Performance Evaluation 30
Figure 3. 3: Testing Fixture
Five types of specimens were fabricated for investigation, two of which were
solely for the purposes of the proof of concept testing. The different specimen
configurations are presented out in Table 3.1 and are shown in Figures 3.5 to 3.7. After
assembly, the specimens were conditioned at 70 ºF and 65% relative humidity for two
weeks.
Table 3. 1: Connection Specimens
Member 1 Member 2 Nail Size Number of
Nails
7/16” OSB WPC 8d 1
3/8” WPC #2 DF(N) wood lumber 16d 1
3/8” WPC #2 DF(N) wood lumber 16d 2
Sheet Metal #2 DF(N) wood lumber 8d 1
7/16” OSB Sheet Metal 8d 1
Page 43
J. O’Dell Chapter3: Connection Performance Evaluation 31
Figure 3. 4: OSB Connected to WPC With an 8d Nail
Figure 3. 5: WPC Connected to Lumber With a 16d Nail
Page 44
J. O’Dell Chapter3: Connection Performance Evaluation 32
Figure 3. 6: Sheet Metal Connected to Lumber With an 8d Nail
Figure 3. 7: OSB Connected to Lumber With an 8d Nail Through Sheet Metal
Page 45
J. O’Dell Chapter3: Connection Performance Evaluation 33
3.2 Results
Since the goal of this research was to develop a finite element model in order to
investigate the performance of WPC sill plate configurations, the results sought were the
necessary parameters to model the hysteretic behavior of the nailed connections. It has
been shown that hysteretic nail behavior can be modeled accurately using 13 parameters
that can be obtained from cyclic connection tests (Xu 2006). These 13 parameters
describe such things as stiffness, hardening, degradation rate, rate of change of
force/displacement curve, etc. and are discussed further by Xu (2006). The parameters
obtained from fitting the hysteretic model to the test data are presented in Table 3.2.
Table 3. 2: Average Hysteretic Parameters Determined From Connection Test Data
Parameter 8d OSB to
WPC
16d WPC to
Lumber
(2) 16d
WPC to
Lumber
8d Sheet
Metal to
Lumber
8d OSB to
Lumber
Sandwiching
Sheet Metal
α 0.027840 0.020025 0.058145 0.021070 0.021420
β 2.166664 1.794860 1.685328 1.800845 2.019187
ω 1.197318 1.177060 1.199904 1.193378 1.149249
δ0 0.955104 0.969288 0.968549 0.965943 0.960158
n 1.208475 1.052120 1.002695 1.015015 1.030783
ψ 0.193183 0.331871 0.115241 0.163206 0.249759
δψ 0.082974 0.035277 0.058654 0.089015 0.072605
δν 0.001445 0.007939 0.000008 0.006970 0.003092
ξ 0.000014 0.000015 0.000013 0.000014 0.000013
γ -1.186347 -1.258440 -1.185000 -1.274032 -1.267470
δε 0.007693 0.009902 0.002843 0.007988 0.006978
p 1.438957 1.050055 0.939987 1.570365 1.413761
q 0.132933 0.143762 0.196777 0.083840 0.113750
Page 46
J. O’Dell Chapter3: Connection Performance Evaluation 34
The values in the table above were obtained by processing the test data using the
genetic algorithm described by Heine (2001). In short, the genetic algorithm
starts with an assumed value for each parameter, changes the value by a small percentage
and checks the fit of each set of parameters to the data. The set of parameters that most
closely produces a force/displacement curve resembling that obtained from the test data is
considered “more fit” for the job. Next, the values are modified in such a way that
imitates genetic refinement seen in biological organisms (i.e., genetic mutation and
natural selection). The process is repeated until the parameters yield results within a
specified accuracy using a least value of the square root of the sum of the squares of error
approach. Each test’s data was run through the algorithm to obtain the 13 parameters for
individual tests. The values used in the FE model (those in the table above) are the
average of values for tests of a particular connection configuration. The parameters
obtained have coefficients of variation ranging from 1% to 30% typically, with a few
outliers as high as 59%.
Page 47
J. O’Dell Chapter4: Verification and Simulations 35
CHAPTER 4: VERIFICATION AND SIMULATIONS
4.1 Evaluation Parameters
There are several parameters that must be considered when evaluating shear wall
performance under cyclic loading.
The first of these parameters is the shear strength. This is the value that is
typically published in design manuals and is the structural engineer’s primary deciding
factor when designing a shear wall. The shear strength is calculated as the peak load
distributed over the length of the shear wall (i.e., strength per unit length).
Mathematically, the shear strength is defined as:
v = Ppeak
L (4.1)
where Ppeak is the maximum absolute load that the shear wall experienced during testing
and L is the length of the shear wall.
To estimate of shear wall stiffness when subjected to multiple loading cycles, the
elastic shear stiffness is used. The elastic shear stiffness is defined as the slope of the
equivalent energy elastic-plastic (EEEP) curve. The EEEP curve is an idealized elastic-
plastic curve in which the area under the curve is equal to the area under the hysteretic
backbone curve. Development of an EEEP curve is outlined in ASTM E 2126-05 (2005).
The elastic shear stiffness is expressed as:
Ke = 0.40 Ppeak
e
(4.2)
where e is the displacement along the EEEP curve at 40% of the peak load.
Page 48
J. O’Dell Chapter4: Verification and Simulations 36
Ductility is a measure of inelastic deformation before failure. Ductility is
important in a structure because it gives some warning before failure, allowing people to
safely exit the structure before it collapses. Also, the more ductile a component is the
less force it will attract and less chance that failure loads will be reached. Ductility is
expressed as:
D = u
y
(4.3)
where u and y are displacements at ultimate load and yield respectively. The yield
displacement is taken from the EEEP curve.
Another important factor in shear wall evaluation under cyclic loading is the
amount of seismic energy that can be dissipated by the shear wall. Dissipated energy is
the area enclosed by the hysteretic loops of the force-displacement curve.
4.2 Model Verification
To verify the accuracy of the continuous anchorage finite element model
developed in this thesis, verification tests of a similar sill plate configuration were
conducted and the model modified to match the parameters of those tests. This section
contains the results of those tests.
4.2.1 Verification Testing Results
The results in this section are from shear wall tests conducted by Ross (2008).
Ross conducted shear wall tests utilizing the verification sill plate configuration discussed
in Chapter 2. However, due to problems that occurred during data acquisition, the results
Page 49
J. O’Dell Chapter4: Verification and Simulations 37
cannot be used for a meaningful numerical analysis. The discussion in this chapter
concerning the verification testing will be strictly of a qualitative nature.
Only one specimen from the verification testing was chosen to consider as a
comparison for the model because it was the only specimen that yielded usable data. The
results of this test are shown in Figure 4.1. This test had a peak load of 34.96kN (7860lb)
which occurred at a displacement of 22.1mm (0.871 in). As can be seen in the figure, the
data is very “choppy”. This choppiness was caused by a data recording frequency that
was too slow. The wall had a maximum displacement of 36.7mm (1.44 in) before failure.
Verification Testing Results
-40
-30
-20
-10
0
10
20
30
40
-40 -30 -20 -10 0 10 20 30 40
Displacement (mm)
Lo
ad
(kN
)
Figure 4. 1: Verification Test Results
4.2.2 Verification Model Results
The wall framing model was run using the same CUREE basic loading protocol
that was used in the verification tests. The model yielded a peak load of 30.87kN
(6940lb) at a displacement of 17.8mm (0.701in). The model results are shown in Figure
4.2.
Page 50
J. O’Dell Chapter4: Verification and Simulations 38
Model Results
-40
-30
-20
-10
0
10
20
30
40
-30 -20 -10 0 10 20 30
Displacement (mm)
Lo
ad
(kN
)
Figure 4. 2: Verification Wall Framing Model Results
4.2.3 Comparison of Verification Model to Testing Results
The finite element model outputs and the verification testing data are plotted
together in Figure 4.3.
Model/Testing Comparison
-40
-30
-20
-10
0
10
20
30
40
-40 -20 0 20 40
Displacement (mm)
Lo
ad
(kN
)
FE Model
Test Run1
Figure 4. 3: Model Results Superimposed with Verification Test Data
Page 51
J. O’Dell Chapter4: Verification and Simulations 39
As can be seen in the figure above, the model results follow the test data
backbone curve fairly accurately in the early stages of the testing. However, the model
does predict an earlier failure of the wall than that which occurred during testing. This
was due to problems that occurred during manufacture of the verification sill plate which
resulted in a sill plate that displayed a more ductile behavior than that which was
modeled. The main cause of the increased ductility in the test wall was due to a weak
melt-bond adhesion at the critical section of the sill plate. Melt-bonding is accomplished
by heating up two pieces of WPC and pressing them together, infusing the two soft
surfaces. During specimen manufacture for the verification testing, deck boards were
positioned under heat lamps as shown in Figure 4.4. Because there is such a narrow
range of temperatures that are effective in melt-bonding WPCs, only the area directly
under the heat lamps adhered properly. The critical sections of the sill plate are at the
ends of the member, and did not adhere properly. This reduced the capacity of the wall
to resist overturning moment, resulting in a greater deflection of the wall. In regards to
overturning restraint, the lack of proper adhesion at the ends could be likened to reducing
the length of the shear wall. Although the verification test did have an increase in
deflection, the peak load remained similar to that predicted by the model.
Figure 4. 4: Manufacture of Verification Sill Plates
Page 52
J. O’Dell Chapter4: Verification and Simulations 40
4.3 Continuous Anchorage Shear Wall Simulation
The sill plate model was analyzed as both a 3-D solid model and a 2-D plane
stress model. Plane stress was chosen over plane strain because the critical sections of
the sill plate are at the ends of the member (this was verified by the 3-D model), where
plane stress would be a more accurate representation than plane strain. Principal stress
was chosen as the rupture criterion because the mode of failure for a WPC material under
these circumstances is tension perpendicular to extrusion. At the same time, WPCs
exhibit a somewhat brittle failure tendency, which makes principal stresses a good failure
criterion for the material. The wall framing model was run as a 3-D model fixed against
out-of-plane motion.
4.3.1 Original Concept Model Results
The idealized wall framing model predicts a maximum load of 24.1kN (5418 lb)
at a displacement of 62.3mm (2.45 in). When this peak load occurred, the idealized sill
plate model predicted a principal stress of 6.9MPa (1000psi). This is under the rupture
strength perpendicular to extrusion of HDPE, which is 10.3MPa (1500psi) (Hermanson
2001a). Since the peak load from the wall framing model does not cause the sill plate to
reach failure, failure is predicted to occur in the framing (i.e., sheathing-to-framing
connections) before the sill plate fails.
The results of the sill plate 3-D and 2-D analyses were within 10% of each other
and can be seen in Figure 4.5 and 4.6 respectively. At first glance of these figures, it
appears that there are some stresses that are higher than where the peak stress is indicated
Page 53
J. O’Dell Chapter4: Verification and Simulations 41
(i.e., the red areas). These are actually due to computer interpretation and can be ignored.
These areas appear to have higher stress than they actually do because these are the
points of load application (the red arrows indicate points of load application). Because
loads were applied to the model as point loads, the computer interprets them as
concentrated at a single point on the specimen. Because a single point has essentially no
area, the stresses are depicted a lot higher than they actually are at these locations.
Figure 4. 5: 3-D Stress Analysis Results
Figure 4. 6: 2-D Plane Stress Analysis Results
Page 54
J. O’Dell Chapter4: Verification and Simulations 42
4.3.2 Comparison of Original Concept Model with Other Wall Configurations
The results of the idealized model were compared to four past cyclic shear wall
tests in order to assess the performance of the continuous anchorage WPC sill plate in
relation to other configurations. To compare with shear walls built using typical
construction practices, the model results were compared against shear wall results
utilizing 2X4 (from Salenikovich 2000) and 2X6 (from Duchateau 2005) nominal wood
sill plates. To compare with a straight substitution WPC sill plate configuration, the
model results were compared against the WPC sill plate tested by Duchateau (2005) that
had pockets for the studs and provided stud rotational resistance. This was the
configuration that exhibited the best performance of all her specimens. The results of
these tests and the model are summarized in Table 4.1.
From Table 4.1, it can be noted that, in terms of strength, the performance of a
shear wall utilizing a continuous anchorage sill plate is more than twice that of a typical
unanchored shear wall and slightly better than a typical fully anchored shear wall.
When compared to Duchateau’s 2005 shear wall test incorporating the WPC sill
plate with stud rotational resistance, the results are a slight decrease in strength and
energy dissipation. However, the continuously anchored shear wall did show an increase
in ductility over the straight substitution WPC sill plate. The increase in ductility was
caused by the increase in stiffness shifting the yield displacement to a lower value. The
increased stiffness is due to both the continuous anchorage and the direct sheathing-to-sill
plate connections incorporated in the continuously anchored shear wall.
Page 55
J. O’Dell Chapter4: Verification and Simulations 43
Table 4. 1: Shear Wall Capacities of Various Configurations
Peak
Load
(kN)
Ultimate
Displacement
(mm)
Shear
Strength
(kN/m)
Stiffness
(kN/mm) Ductility
Energy
Dissipationc
(kN-mm)
2X4 Nominal Wood
Sill Plate with No
Anchoragea
(Salenikovich 2000)
10.8 36 4.4 1.4 5.4 3,584
2X6 Nominal Wood
Sill Plate with No
Anchorageb
(Duchateau 2005)
10.8 45 4.4 1.8 8.1 2,420
2X4 Nominal Wood
Sill Plate with Full
Anchoragea
(Salenikovich 2000)
19.4 73 8.0 1.9 7.6 15,079
WPC Sill Plate With
Stud Rotational
Resistance Tested
by Duchateaub
(2005)
28.6 77 11.7 1.2 3.6 6,398
WPC Sill Plate with
Continuous
Anchorageb (model)
24.1 64 9.9 1.5 4.7 6,059
a values derived from testing using Sequential Phase Displacement (SPD) Protocol
b values derived from testing using CUREE basic load protocol
c energy dissipation cannot be directly compared between SPD and CUREE protocols
Since one of the goals in this study is to investigate the effects of continuous
anchorage, a closer comparison of the two configurations utilizing a WPC sill plate is
warranted. The wall framing model results are superimposed with Duchateau’s 2005 test
results in Figure 4.7.
The shear wall with continuous anchorage and the shear wall without continuous
anchorage follow a similar backbone curve trend. However, the continuously anchored
shear wall loses stiffness faster and does not reach as high of a load as Duchateau’s shear
wall. This was due to the fact that with continuous anchorage there is no bending in the
sill plate. All racking motion is accommodated by bending of the fasteners and/or
Page 56
J. O’Dell Chapter4: Verification and Simulations 44
Model/Testing Comparision
-40
-30
-20
-10
0
10
20
30
40
-100 -50 0 50 100
Displacement (mm)
Lo
ad
(k
N)
FE Model
Duchateau's WPCPlate
Figure 4. 7: Model Results Superimposed with Duchateau's WPC Sill Plate Test Data
deformations of the structural members. This leads to a faster rate of strength
degradation, earlier fatigue of the connectors and subsequently an earlier wall failure.
Also Duchateau’s sill plate cross-section had twice the area of the continuous anchorage
sill plate. This resulted in more restraint on the motion of the studs and subsequently a
higher load capacity as the studs were capable of transferring horizontal forces through
bearing and in-plane bending of the studs on the sides of the stud pockets.
To evaluate the performance of the continuous anchorage shear wall concept in
the field, the model results were compared to current design codes.
The Building Seismic Safety Counsel TS-7 suggests a maximum value of
2.6kN/m (180plf) nominal when designing unrestrained light-frame wood shear walls
(Dolan 2008). The FE model presented in this thesis gives a nominal value of 9.8kN/m
(672plf).
Page 57
J. O’Dell Chapter4: Verification and Simulations 45
From the National Design Specification (2005), the allowable shear strength of an
engineered shear wall of similar nailing schedule and sheathing type to that modeled is
3.50kN/m (240plf). Taking into account a factor of safety of 2.8 for seismic, the value
associated with ASD unit shear capacity for shear walls and diaphragms, the results of
the FE model yield an allowable shear strength of 3.53kN/m (242plf).
The continuously anchored shear wall model was shown to be reasonably
accurate. The model was used to predict the performance of a shear wall utilizing an
idealized WPC sill plate. The results of the analysis were encouraging.
Page 58
J. O’Dell Chapter 5: Conclusions and Recommendations 46
CHAPTER 5: CONCLUSIONS AND RECOMMENDATIONS
5.1 Conclusions
This thesis has shown that in light-frame wood shear walls, sill plate performance
calls for some investigation. Past research involving investigation into light-frame wood
sill plates was reviewed. This thesis contains the next step in this ongoing investigation
by considering a WPC sill plate configuration that provides continuous anchorage for
light-frame wood shear walls.
This thesis utilized finite element modeling to investigate the performance of a
continuous anchorage WPC sill plate. The model incorporates hysteretic connection
behavior at its core to accurately predict shear wall behavior. This hysteretic connection
behavior was derived from testing of single connections.
Based on the finite element model developed in this thesis, continuously anchored
light-frame wood shear walls show increased performance over typical shear walls in
regards to capacity. The continuously anchored shear wall has an increased capacity over
typical unrestrained shear walls of 230% and over typical overturning restrained shear
walls of 24%.
In comparison to WPC sill plates with stud rotational resistance secured to a
foundation with anchor bolts (i.e., intermittent anchorage), the continuous anchorage sill
plate experienced stiffness degradation sooner resulting in a slightly lower capacity, but
an increase in ductility. The capacity issue can be addressed by considering the material
stiffness of the continuous anchorage sill plate.
Page 59
J. O’Dell Chapter 5: Conclusions and Recommendations 47
The continuously anchored shear wall demonstrated a negligible difference
(0.9%) in unit shear strength when compared alongside engineered shear walls and an
increase of 277% in relation to prescriptive shear walls.
The shear wall configuration proposed in this thesis has the potential of replacing
shear walls with overturning restraint and a 6/12 nailing schedule as the two are
comparable in strength, but the WPC does provides additional benefits in regards to
moisture related decay. The addition of the continuous anchorage reduced sill plate
bending, eliminating one major mode of failure from shear walls.
5.2 Recommendations and Future Research
5.2.1 Connection Tests
Since overall shear wall performance is controlled by connector behavior, this
research utilized testing of single connections in order to accurately predict shear wall
behavior. The following is recommended based on the results of that testing.
The use of equipment capable of recording velocity and acceleration of the
connection test data would increase the accuracy of the 13 parameters used to
model the hysteretic behavior of the connections.
A closer look at the effects of direction of connector loading with respect to WPC
extrusion direction and lumber grain direction would increase the accuracy of the
hysteretic parameters.
Page 60
J. O’Dell Chapter 5: Conclusions and Recommendations 48
5.2.2 Finite Element Model
To improve the accuracy of the finite element model, the following
recommendations are made.
A detailed investigation into the orthotropic properties of a chosen
formulation of WPCs for the sole purpose of providing modeling data will
yield a more accurate model.
Combining the wall framing model and the sill plate model into one model
will yield more accurate results. This can be accomplished in two ways.
o If a high powered computer can be obtained, the sill plate can be
modeled directly in the wall framing model.
o More realistically, a model of the sill plate can be used to calculate the
mechanical properties of the sill plate and these properties can be
assigned to a general element type that can be included in the wall
framing model.
5.2.3 General Recommendations
In addition to the recommendations above, a few additional items that could be
investigated on their own which will further develop the usefulness and understanding
gained from this thesis are:
An investigation into basic mechanical properties of different types of WPC
materials would allow for a more accurate finite element model and lead to a
better choice of WPC formulation for different application. In particular,
Page 61
J. O’Dell Chapter 5: Conclusions and Recommendations 49
nailability was an issue during verification testing and could be considered
with an investigation into mechanical properties of WPCs.
Investigation into the shape and size of the anchorage bulb, while taking into
account the concrete strength and common construction practices, would help
to maximize the effects of the continuous anchorage concept.
An investigation into the effects of adding reinforcement to weak areas of the
continuous anchorage sill plate (like the sheathing lip) would further increase
the usefulness of the idealized sill plate considered in this thesis.
5.3 Closing Comments
A WPC sill plate designed to provide continuous anchorage of light-frame wood
shear walls was investigated in this thesis. WPCs have been shown to be a viable
alternative to the typical wood sill plate in light-frame wood shear walls. With this
alternate sill plate configuration, strengths similar to those found in typical overturning
restrained shear walls can be achieved without the use of added hardware, but with the
added benefit of resistance to moisture related decay that WPCs can provide.
Page 62
O’Dell References 50
REFERENCES
Adcock, Timothy, Wolcott, Michael P., and Hermanson, John C. (2001a). “ The
Influence of Wood Plastic Composite Formulation: Studies on Mechanical and
Physical Properties.” Project End Report. Engineered Wood Composites for Navy
Waterfronts. Task 1D-1 Evaluate Extruded Materials. Washington State
University. Pullman, Washington.
Adcock, Timothy, Wolcott, Michael P., and Dostal, David. (2001b). “ Co-Extrusion of
Wood Plastic Composites: The Flexural Behavior of Capped/Foamed/Fiber
Reinforced Wood Plastic Composite.” Project End Report. Engineered Wood
Composites for Navy Waterfronts. Task 2H Evaluate Extruded Materials.
Washington State University. Pullman, Washington.
Anderson, Erin, Leichti, Robert, Sutt, Edward, and Rosowsky, David. (2006). “Sheathing
Nail Bending-Yield Stress: Effect on Cyclic Performance of Wood Shear Walls.”
Wood and Fiber Science, 39(4), 536-547.
ASTM E 2126-05. (2005). “Standard Test Methods for Cyclic (Reversed) Load Test for
Shear Resistance of Vertical-Elements of the Lateral-Force Resisting Systems for
Buildings.” American Society of Testing Materials. Vol. 04.12.
Bredel, Daniel. (2003). “Performance Capabilities of Light-Frame Shear Walls Sheathed
with Long OSB Panels.” Master’s Thesis, Virginia Polytechnic Institute and State
University, Blacksburg, VA.
CRD. (2007). “Conceptualized Reference Database for Building Envelope Research.”
Building Envelope Performance Laboratory, Centre for Building Studies.
Department of Building civil and Environmental Engineering. Concordia
University. <http://alcor.concordia.ca/~raojw/crd/index.html>
DIS. (2007). “Fact on the January 17, 1994 Northridge Earthquake.” DIS, inc. Sparks
Nevada. <http://www.dis-inc.com/northrid.htm>
Dolan, J. Daniel. (2008). Washington State University, Department of Civil and
Environmental Engineering and member of the Building Seismic Safety Council
TS-7. (personal correspondence)
Dolan, J.D. (1989). “The Dynamic Response of Timber Shear Walls.” PhD Dissertation,
The University of British Columbia.
Dolan, J.D., and Madsen, B. (1992). “Monotonic and Cyclic Nail Connection Tests.”
Canadian Journal of Civil Engineering, 19, 97-104.
Dowrick, D.J. (1986). “Hysteretic Loops for Timber Structures.” Bulletin of the New
Zealand National Society of Earthquake Engineering, 19(20), 143-152.
Page 63
O’Dell References 51
Duchateau, Kristin A. (2005). “Structural Design and Performance of Composite Wall-
Foundation Connector Elements.” Master Thesis, Washington State University.
Englund, Karl. (2007). Washington State University, Wood Materials and Engineering
Laboratory. (personal correspondence)
Falk, R.H. and Itani, R.Y. (1989). “Finite Element Modeling of Wood Diaphragms.”
Journal of Structural Engineering, 115(3), 543-559.
Foliente, G.C. (1995). “Hysteresis Modeling of Wood Joints and Structural Systems.”
Journal of Structural Engineering, 121(6), 1013-1022.
Foschi, R.O. (1977). “Analysis of Wood Diaphragms and Trusses, Part One:
Diaphragms.” Canadian Journal of Civil Engineering, 4(3), 345-352.
Gutkowski, R.M. , and Castillo A.L. (1988). “Single- and Double- Sheathed Wood
Shear Wall Study.” Journal of Structural Engineering, 114(6), 1268-1284.
Heine, Christopher P. (1997). “Effects of Overturning on the Performance of Fully
Sheathed and Perforated Timber Framed Shear Walls.” Master’s Thesis, Virginia
Polytechnic Institute and State University.
Heine, Christopher P. (2001). “Simulated Response of Degrading Hysteretic Joints With
Slack Behavior.” PhD Dissertation, Virginia Polytechnic Institute and State
University.
Hermanson, John C., Adcock, Timothy, Wolcott, and Michael P. (2001). “Evaluation of
Extruded Materials: Materials Development.” Project End Report. Engineered
Wood Composites for Navy Waterfronts. Task 1F Evaluate Reinforced Materials
and Task 1G Model Material Performance . Washington State University.
Pullman, Washington.
Itani, R.Y., and Cheung, C.K. (1984). “Nonlinear Analysis of Sheathed Wood
Diaphragms.” Journal of Structural Engineering, 110(9), 2137-2147.
Kubal, Michael T. (2000). “Construction Waterproofing Handbook.” McGraw Hill. New
York, New York.
Lu, Guibin. (2002). “HDPE Wood-Plastic Composite Material Model Subject to
Damage.” Master Thesis, Washington State University.
Mahaney, James A., and Kehoe, Brian E. (2002). “Anchorage of Wood-frame Buildings:
Laboratory Testing Report (CUREE Publication No. W-14).” CUREE,
Richmond, CA.
Page 64
O’Dell References 52
McCutcheon, W.J. (1985). “Racking Deformations in Wood Sher Walls.” Journal of
Structural Engineering, 111(2), 257-269
National Design Specification (NDS). (2005). American Forest and Paper Association.
AF&PA, Washington, D.C.
Pendleton, David E., Hofford, Theresa A., Adcock, Tim, and Wolcott, Michael P. (2002).
“Durability of an extruded HDPE/wood composite.” Forest Products Journal.
Forest Products Society, 52(6), 21-27.
Polensek, A. (1976). “Finite Element Analysis of Wood-Stud Walls.” Journal of
Structural Engineering, 102(7), 1317-1335.
Rose, John D. (1998). “Preliminary Testing of Wood Structural Panel Shear Walls Under
Cyclic (Reversed) Loading.” APA Research Report 158. APA – The Engineered
Wood Association, Tacoma, Washington.
Ross, Loren. (2008). “Performance of Wood Plastic Composite Foundation Elements in
Post-Frame and Light-Frame Shear Walls.” Master Thesis, Washington State
University.
Salenikovich, Alexander. (2000). “The Racking Performance of Light-Frame Shear
Walls.” PhD Dissertation, Virginia Polytechnic Institute and State University.
Stewart, W.G. (1987). “The Seismic Design of Plywood Sheathed Shear Walls.” PhD
Dissertation, University of Canterbury.
Toothman, Adam. (2003). “Monotonic and Cyclic Performance of Light-Frame Shear
Walls with Various Sheathing Materials.” Master’s Thesis, Virginia Polytechnic
Institute and State University.
White, Maurice, Dolan, J. Daniel. (1995). “Nonlinear Shear-Wall Analysis.” Journal of
Structural Engineering, 21(11), 1629-1635.
Xu, Jian. (2006). “Development of a General Dynamic Hysteretic Light-frame Structure
Model and Study on the Torsional Behavior of Open-front Light-frame
structures.” PhD Dissertation, Washington State University.
Page 65
O’Dell Appendix 53
APPENDIX A: CONNECTION TEST RESULTS
Table A. 1: Tabulated Parameters for 8d (0.131” diameter by 2 .5” long) OSB to WPC Connections
Parameter Test Run
1 2 3 4 5 6
α 0.022333 0.039312 0.020434 0.027304 0.031232 0.026427
β 1.934092 2.074452 2.419028 2.214796 2.182850 2.174768
ω 1.188793 1.198872 1.199768 1.197412 1.199942 1.199123
δ0 0.964965 0.958849 0.959353 0.947558 0.946536 0.953363
n 1.300810 1.306868 1.032825 1.274944 1.207652 1.127748
ψ 0.340566 0.107242 0.338610 0.135855 0.103322 0.133505
δψ 0.056645 0.094341 0.050149 0.099179 0.097858 0.099672
δν 0.002684 0.002539 0.000227 0.000000 0.001439 0.001782
ξ 0.000011 0.000014 0.000014 0.000014 0.000015 0.000013
γ -0.881459 -1.179010 -1.228343 -1.300000 -1.257506 -1.271765
δε 0.004101 0.009019 0.009014 0.007704 0.009390 0.006929
p 1.153258 1.564985 1.242124 1.581370 1.517753 1.574254
q 0.141454 0.153282 0.094072 0.162405 0.118745 0.127638
Table A. 2: Tabulated Parameters for 16d (0.162” diameter by 3.5” long) WPC to Lumber
Connections
Parameter Test Run
1 2 3 4 5 6 7
α 0.020047 0.020048 0.020063 0.020018 0.020000 0.020000 0.020000
β 1.817002 1.812859 1.724236 1.760874 1.810166 1.822605 1.816276
ω 1.182421 1.126112 1.188200 1.152213 1.199392 1.194715 1.196366
δ0 0.966941 0.969919 0.969927 0.969984 0.969971 0.969657 0.968619
n 1.022177 1.074021 1.065294 1.139849 1.018084 1.019210 1.026206
ψ 0.408174 0.464251 0.365334 0.430477 0.278300 0.201800 0.174759
δψ 0.027668 0.020351 0.031363 0.026778 0.038266 0.046406 0.056106
δν 0.009345 0.005577 0.009625 0.009152 0.008358 0.004965 0.008549
ξ 0.000010 0.000019 0.000014 0.000019 0.000016 0.000015 0.000015
γ -1.300000 -1.298811 -1.163236 -1.192233 -1.294551 -1.296004 -1.264257
δε 0.009996 0.009982 0.009908 0.009984 0.009975 0.009791 0.009678
p 0.872852 0.835976 0.954061 0.851628 1.101173 1.267972 1.466726
q 0.146307 0.172207 0.157213 0.156613 0.126482 0.132410 0.115100
Page 66
O’Dell Appendix 54
Table A. 3: Tabulated Parameters for (2) 16d (0.162” diameter by 3.5” long) WPC to Lumber
Connections
Parameter Test Run
1 2 3 4 5
α 0.058827 0.060000 0.059953 0.052228 0.059719
β 1.599171 1.764572 1.730684 1.758026 1.574186
ω 1.199874 1.199880 1.199993 1.199916 1.199855
δ0 0.967446 0.968954 0.969577 0.967402 0.969367
n 1.003487 1.002244 1.006005 1.001643 1.000097
ψ 0.102910 0.102121 0.170730 0.100419 0.100023
δψ 0.062869 0.057824 0.039730 0.066095 0.066754
δν 0.000007 0.000003 0.000012 0.000020 0.000000
ξ 0.000010 0.000018 0.000012 0.000011 0.000013
γ -1.099082 -1.264214 -1.230550 -1.257034 -1.074098
δε 0.002571 0.002895 0.004508 0.002198 0.002044
p 0.986853 1.022988 0.832433 1.013921 0.843740
q 0.178293 0.190149 0.221987 0.198838 0.194618
Table A. 4: Tabulated Parameters for 8d (0.131” diameter by 2 .5” long) Sheet Metal to Lumber
Connections
Parameter Test Run
1 2 3 4 5 6 7
α 0.023560 0.020934 0.020351 0.020254 0.021916 0.020447 0.020026
β 1.711528 1.831357 1.827785 1.795242 1.787754 1.846765 1.805485
ω 1.196346 1.185740 1.197991 1.189049 1.198626 1.189564 1.196332
δ0 0.969250 0.959418 0.965678 0.966942 0.968659 0.968492 0.963164
n 1.021135 1.043976 1.002213 1.000000 1.026367 1.004034 1.007378
ψ 0.100302 0.166388 0.174121 0.193741 0.186232 0.196172 0.125484
δψ 0.099631 0.098494 0.090440 0.081338 0.079639 0.076879 0.096686
δν 0.003269 0.002714 0.006641 0.009433 0.007917 0.009198 0.009619
ξ 0.000015 0.000012 0.000014 0.000010 0.000019 0.000012 0.000013
γ -1.198402 -1.283105 -1.295910 -1.288645 -1.284958 -1.275240 -1.291964
δε 0.006664 0.008532 0.006410 0.008721 0.008558 0.008326 0.008703
p 1.518350 1.587532 1.600000 1.567537 1.534066 1.586805 1.598266
q 0.090826 0.080928 0.089997 0.076439 0.064810 0.086192 0.097688
Page 67
O’Dell Appendix 55
Table A. 5: Tabulated Parameters for 8d (0.131” diameter by 2 .5” long) OSB to Lumber
Sandwiching Sheet Metal Connections
Parameter Test Run
1 2 3 4 5 6 7
α 0.022841 0.020225 0.020085 0.020713 0.021428 0.022120 0.022531
β 1.877573 2.086095 1.978399 2.375731 2.017914 1.989585 1.809009
ω 1.059934 1.199622 1.080479 1.173014 1.171841 1.159852 1.200000
δ0 0.967450 0.948018 0.962979 0.969285 0.961718 0.948387 0.963270
n 1.020037 1.036934 1.004670 1.020336 1.001642 1.088424 1.043440
ψ 0.327074 0.190203 0.267578 0.404326 0.186922 0.234675 0.137534
δψ 0.052442 0.092970 0.073251 0.024341 0.080723 0.084656 0.099850
δν 0.002196 0.001887 0.003564 0.003688 0.001651 0.000699 0.007959
ξ 0.000014 0.000015 0.000016 0.000011 0.000014 0.000011 0.000012
γ -1.247796 -1.296026 -1.257564 -1.250262 -1.260170 -1.262369 -1.298105
δε 0.005304 0.009059 0.005987 0.009591 0.006598 0.008599 0.003709
p 1.322585 1.566619 1.289644 1.216896 1.596237 1.497250 1.407093
q 0.095380 0.102376 0.114846 0.137877 0.110164 0.084023 0.151581
-2
-1.5
-1
-0.5
0
0.5
1
1.5
2
-10 -5 0 5 10
displacement(mm)
loa
d(k
N)
test data
GA data
GA parameters
averaged
Figure A. 1: Testing Results - 8d (0.131” diameter by 2 .5” long) Nail Connecting OSB to WPC Run
1
Page 68
O’Dell Appendix 56
-2
-1.5
-1
-0.5
0
0.5
1
1.5
2
2.5
-10 -5 0 5 10
displacement(mm)
load
(kN
)
test data
GA data
GA parametersaveraged
Figure A. 2: Testing Results - 8d (0.131” diameter by 2 .5” long) Nail Connecting OSB to WPC Run
2
-2
-1.5
-1
-0.5
0
0.5
1
1.5
2
-10 -5 0 5 10
displacement(mm)
load
(kN
)
test data
GA data
GA parametersaveraged
Figure A. 3: Testing Results - 8d (0.131” diameter by 2 .5” long) Nail Connecting OSB to WPC Run
3
Page 69
O’Dell Appendix 57
-2
-1.5
-1
-0.5
0
0.5
1
1.5
2
2.5
-10 -5 0 5 10
displacement(mm)
load
(kN
)
test data
GA data
GA parametersaveraged
Figure A. 4: Testing Results - 8d (0.131” diameter by 2 .5” long) Nail Connecting OSB to WPC Run
4
-2
-1.5
-1
-0.5
0
0.5
1
1.5
2
2.5
-10 -5 0 5 10
displacement(mm)
load
(kN
)
test data
GA data
GA parametersaveraged
Figure A. 5: Testing Results - 8d (0.131” diameter by 2 .5” long) Nail Connecting OSB to WPC Run
5
Page 70
O’Dell Appendix 58
-2
-1.5
-1
-0.5
0
0.5
1
1.5
2
2.5
-10 -5 0 5 10
displacement(mm)
load
(kN
)
test data
GA data
GA parametersaveraged
Figure A. 6: Testing Results - 8d (0.131” diameter by 2 .5” long) Nail Connecting OSB to WPC Run
6
-5
-4
-3
-2
-1
0
1
2
3
4
5
-40 -20 0 20 40
displacement(mm)
load
(kN
)
test date
GA data
GA parametersaveraged
Figure A. 7: Testing Results - (2) 16d (0.162” diameter by 3.5” long) Nails Connecting WPC to
Lumber Run 2
Page 71
O’Dell Appendix 59
-4
-3
-2
-1
0
1
2
3
4
5
-40 -20 0 20 40
displacement(mm)
load
(kN
)
test data
GA data
GA parametersaveraged
Figure A. 8: Testing Results - (2) 16d (0.162” diameter by 3.5” long) Nails Connecting WPC to
Lumber Run 3
-4
-3
-2
-1
0
1
2
3
4
-40 -20 0 20 40
displacement(mm)
load
(kN
)
test data
GA data
GA parametersaveraged
Figure A. 9: Testing Results - (2) 16d (0.162” diameter by 3.5” long) Nails Connecting WPC to
Lumber Run 4
Page 72
O’Dell Appendix 60
-4
-3
-2
-1
0
1
2
3
4
-40 -20 0 20 40
displacement(mm)
load
(kN
)
test data
GA data
GA parametersaveraged
Figure A. 10: Testing Results - (2) 16d (0.162” diameter by 3.5” long) Nails Connecting WPC to
Lumber Run 5
-5
-4
-3
-2
-1
0
1
2
3
4
5
-40 -20 0 20 40
displacement(mm)
load
(kN
)
test data
GA data
GA parametersaveraged
Figure A. 11: Testing Results - (2) 16d (0.162” diameter by 3.5” long) Nails Connecting WPC to
Lumber Run 6
Page 73
O’Dell Appendix 61
-3
-2.5
-2
-1.5
-1
-0.5
0
0.5
1
1.5
2
2.5
-10 -5 0 5 10
displacement(mm)
load
(kN
)
test data
GA data
GA parametersaveraged
Figure A. 12: Testing Results - 8d (0.131” diameter by 2 .5” long) Nail Connecting Sheet Metal to
Lumber Run 1
-2.5
-2
-1.5
-1
-0.5
0
0.5
1
1.5
2
2.5
-10 -5 0 5 10
displacement(mm)
load
(kN
)
test data
GA data
GA parametersaveraged
Figure A. 13: Testing Results - 8d (0.131” diameter by 2 .5” long) Nail Connecting Sheet Metal to
Lumber Run 2
Page 74
O’Dell Appendix 62
-2.5
-2
-1.5
-1
-0.5
0
0.5
1
1.5
2
2.5
-10 -5 0 5 10
displacement(mm)
load
(kN
)
test data
GA data
GA parametersaveraged
Figure A. 14: Testing Results - 8d (0.131” diameter by 2 .5” long) Nail Connecting Sheet Metal to
Lumber Run 3
-2.5
-2
-1.5
-1
-0.5
0
0.5
1
1.5
2
2.5
-10 -5 0 5 10
displacement(mm)
load
(kN
)
test data
GA data
GA parametersaveraged
Figure A. 15: Testing Results - 8d (0.131” diameter by 2 .5” long) Nail Connecting Sheet Metal to
Lumber Run 4
Page 75
O’Dell Appendix 63
-2.5
-2
-1.5
-1
-0.5
0
0.5
1
1.5
2
2.5
-10 -5 0 5 10
displacement(mm)
load
(kN
)
test data
GA data
GA parametersaveraged
Figure A. 16: Testing Results - 8d (0.131” diameter by 2 .5” long) Nail Connecting Sheet Metal to
Lumber Run 5
-2.5
-2
-1.5
-1
-0.5
0
0.5
1
1.5
2
2.5
-10 -5 0 5 10
displacement(mm)
load
(kN
)
test data
GA data
GA parametersaveraged
Figure A. 17: Testing Results - 8d (0.131” diameter by 2 .5” long) Nail Connecting Sheet Metal to
Lumber Run 6
Page 76
O’Dell Appendix 64
-2.5
-2
-1.5
-1
-0.5
0
0.5
1
1.5
2
2.5
-10 -5 0 5 10
displacement(mm)
load
(kN
)
test data
GA data
GA parametersaveraged
Figure A. 18: Testing Results - 8d (0.131” diameter by 2 .5” long) Nail Connecting Sheet Metal to
Lumber Run 7
-2
-1.5
-1
-0.5
0
0.5
1
1.5
-6 -4 -2 0 2 4 6
displacement(mm)
loa
d(k
N)
test data
GA data
GA parameters
averaged
Figure A. 19: Testing Results - 8d (0.131” diameter by 2 .5” long) Nail Connecting OSB to Lumber
Sandwiching Sheet Metal Run 1
Page 77
O’Dell Appendix 65
-2
-1.5
-1
-0.5
0
0.5
1
1.5
2
-6 -4 -2 0 2 4 6
displacement(mm)
load
(kN
)
test data
GA data
GA parametersaveraged
Figure A. 20: Testing Results - 8d (0.131” diameter by 2 .5” long) Nail Connecting OSB to Lumber
Sandwiching Sheet Metal Run 2
-2
-1.5
-1
-0.5
0
0.5
1
1.5
-6 -4 -2 0 2 4 6
displacement(mm)
load
(kN
)
test data
GA data
GA parametersaveraged
Figure A. 21: Testing Results - 8d (0.131” diameter by 2 .5” long) Nail Connecting OSB to Lumber
Sandwiching Sheet Metal Run 3
Page 78
O’Dell Appendix 66
-2
-1.5
-1
-0.5
0
0.5
1
1.5
-6 -4 -2 0 2 4 6
displacement(mm)
load
(kN
)
test data
GA data
GA parametersaveraged
Figure A. 22: Testing Results - 8d (0.131” diameter by 2 .5” long) Nail Connecting OSB to Lumber
Sandwiching Sheet Metal Run 4
-2
-1.5
-1
-0.5
0
0.5
1
1.5
2
-6 -4 -2 0 2 4 6
displacement(mm)
load
(kN
)
test data
GA data
GA parametersaveraged
Figure A. 23: Testing Results - 8d (0.131” diameter by 2 .5” long) Nail Connecting OSB to Lumber
Sandwiching Sheet Metal Run 5
Page 79
O’Dell Appendix 67
-2
-1.5
-1
-0.5
0
0.5
1
1.5
2
-6 -4 -2 0 2 4 6
displacement(mm)
load
(kN
)
test data
GA data
GA parametersaveraged
Figure A. 24: Testing Results - 8d (0.131” diameter by 2 .5” long) Nail Connecting OSB to Lumber
Sandwiching Sheet Metal Run 6
-2.5
-2
-1.5
-1
-0.5
0
0.5
1
1.5
2
-6 -4 -2 0 2 4 6
displacement(mm)
load
(kN
)
test data
GA data
GA parametersaveraged
Figure A. 25: Testing Results - 8d (0.131” diameter by 2 .5” long) Nail Connecting OSB to Lumber
Sandwiching Sheet Metal Run 7


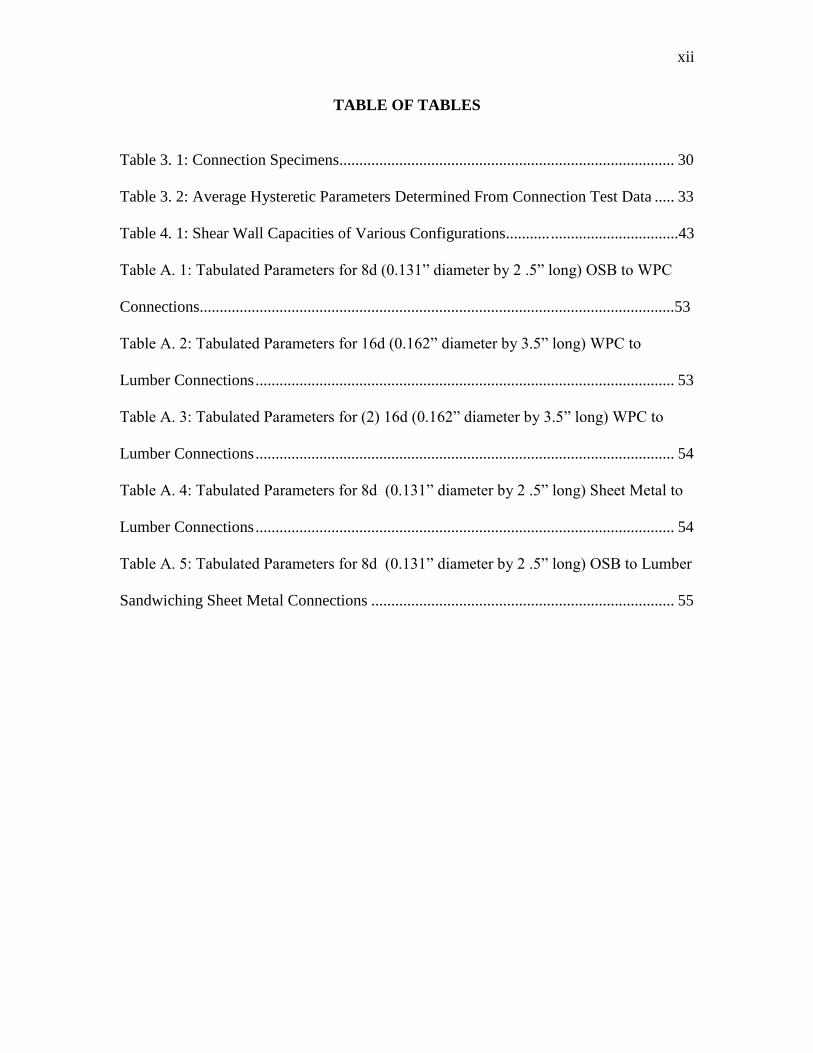

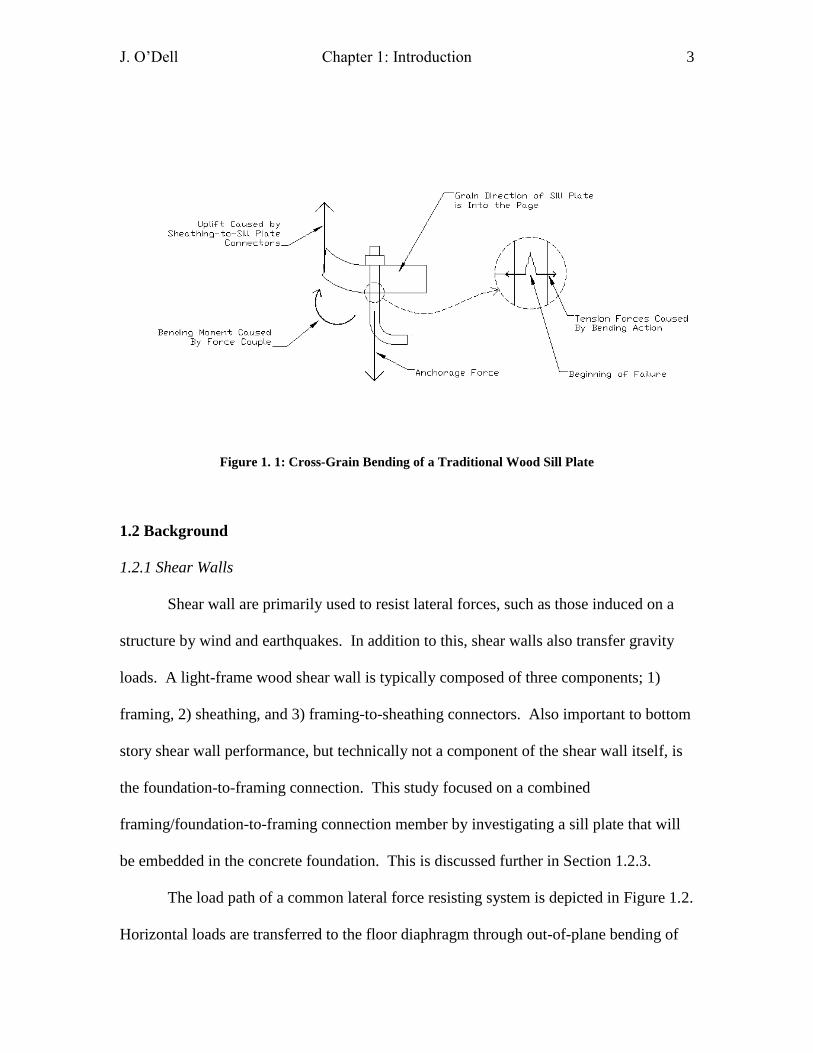
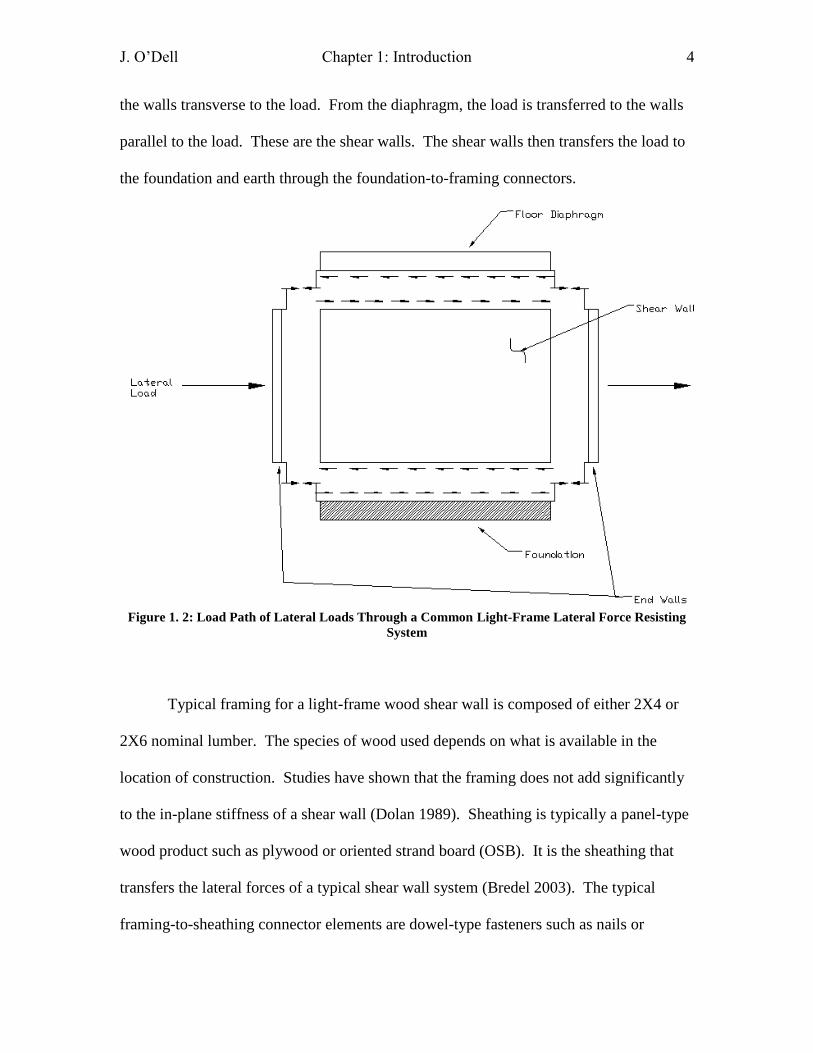

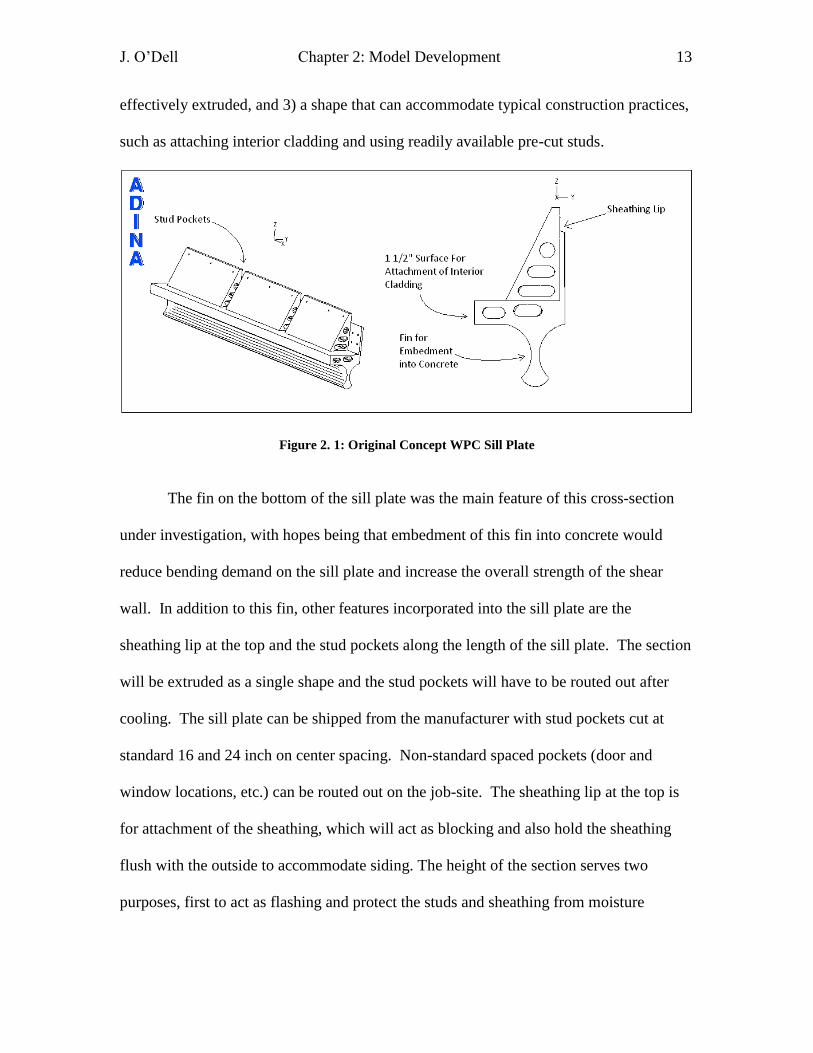


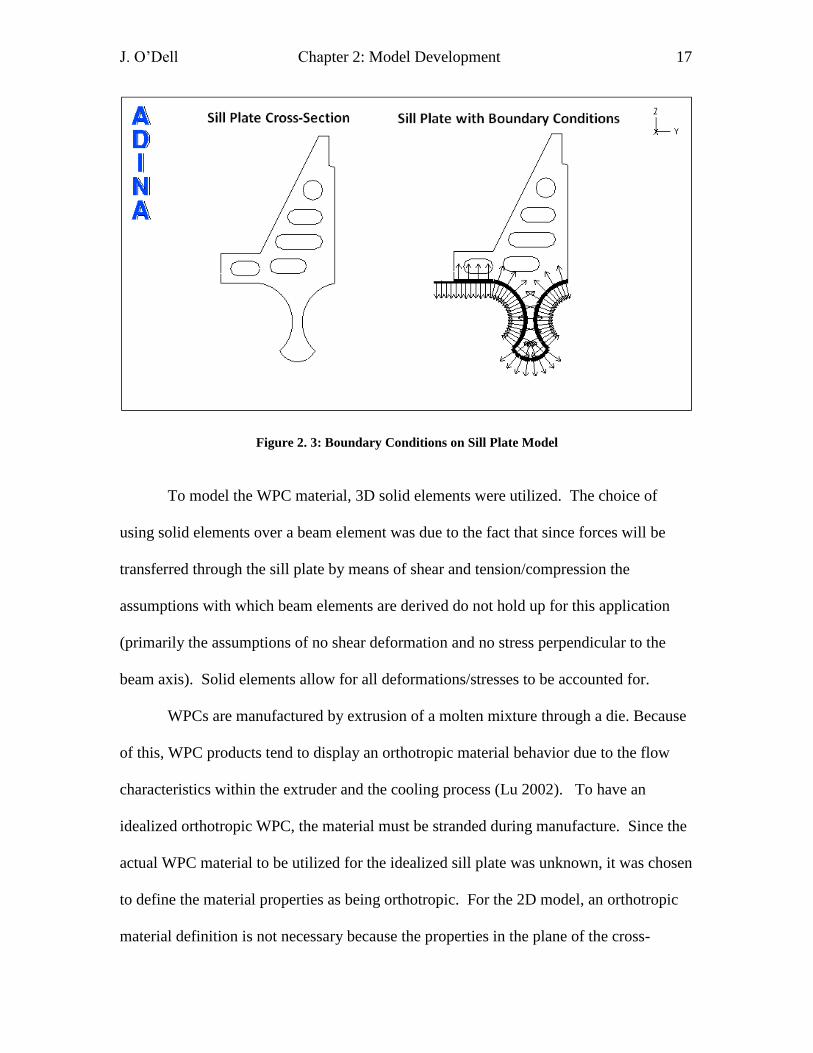


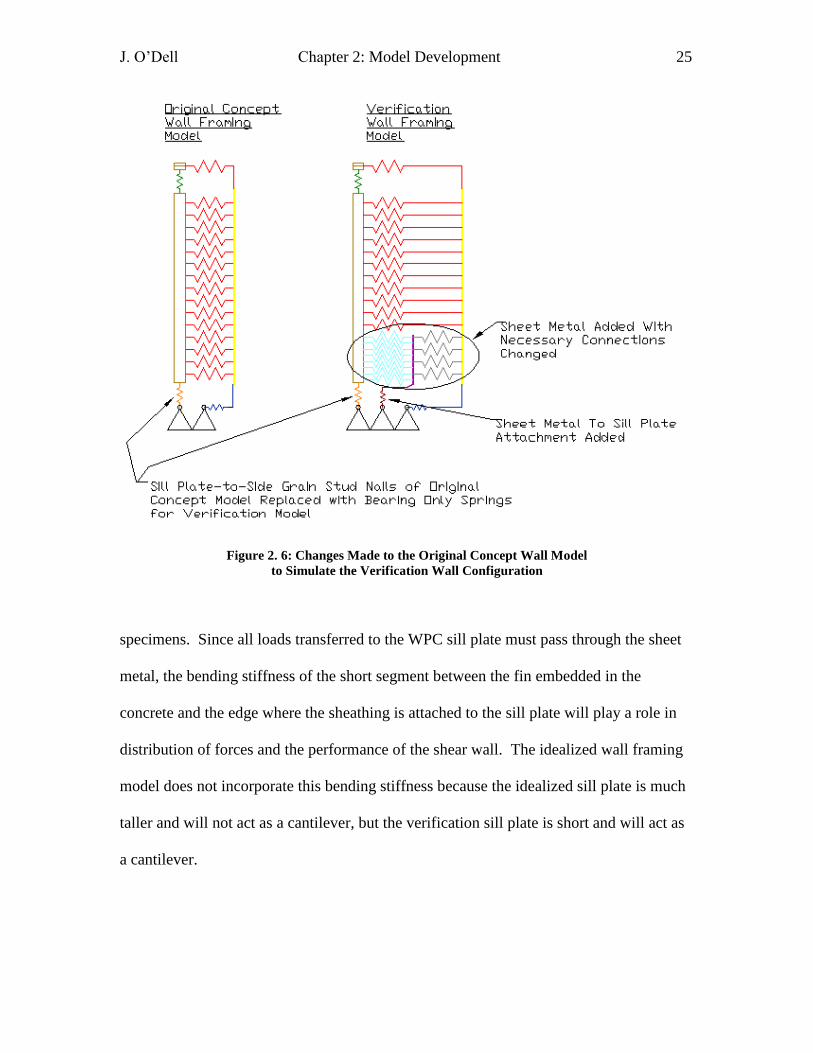
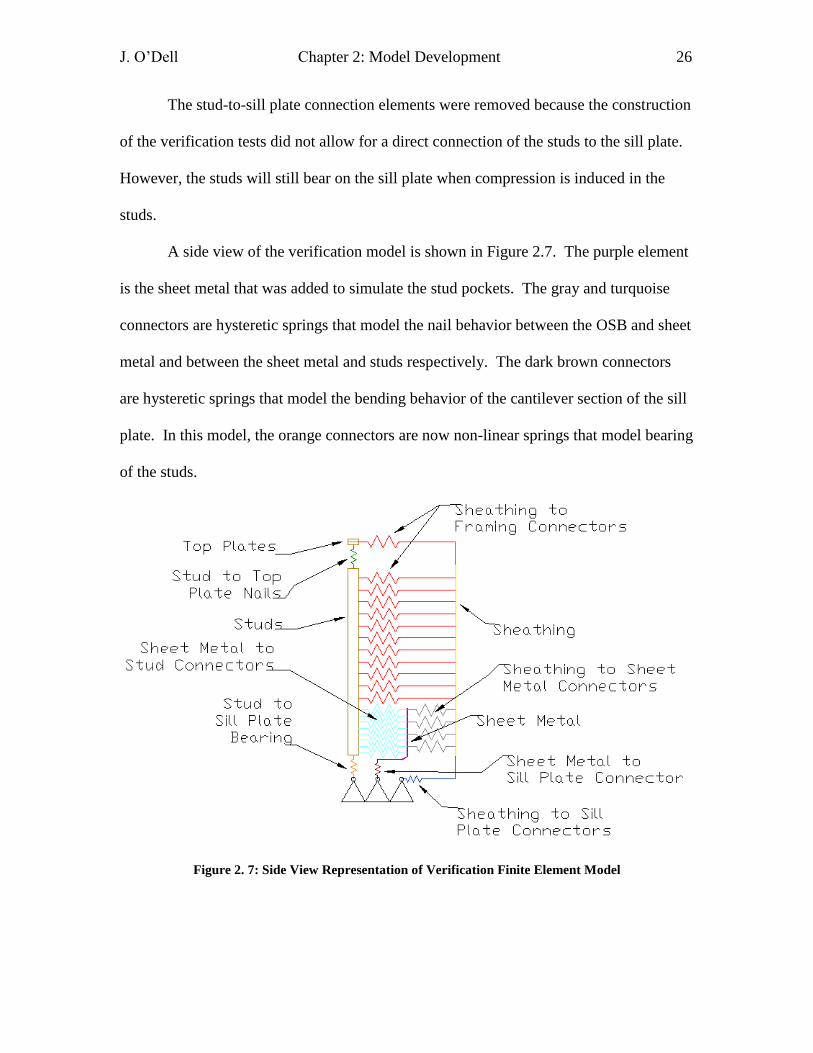

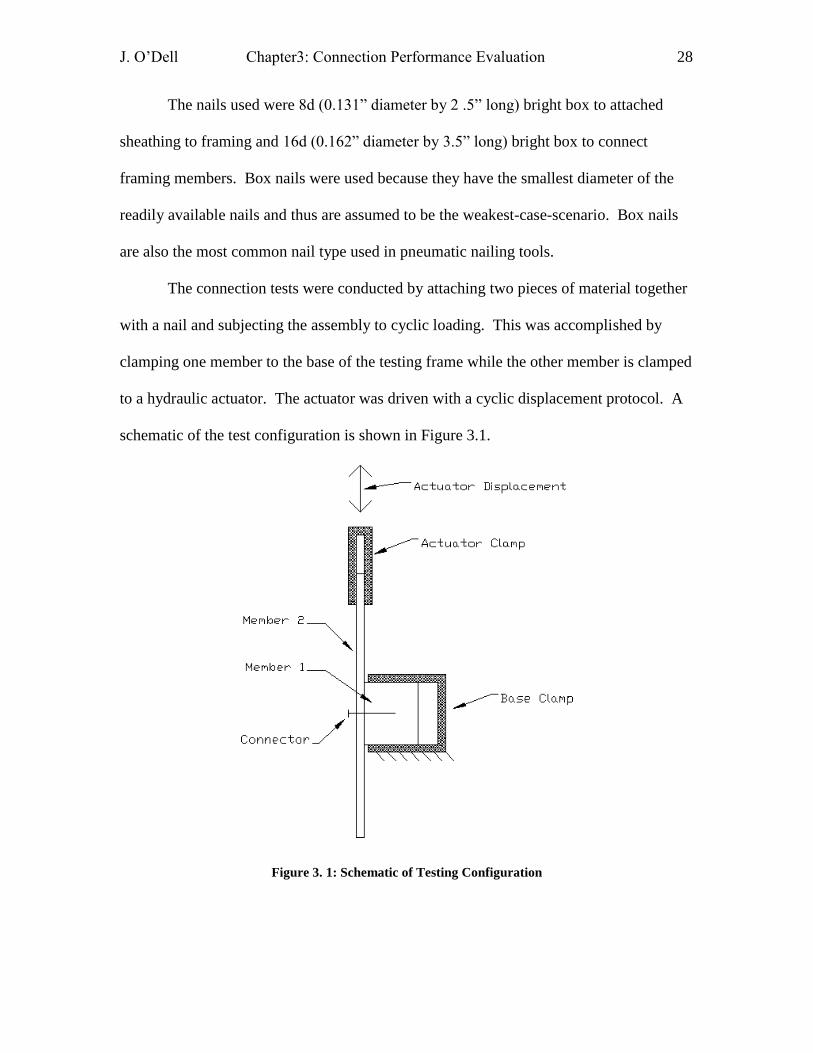
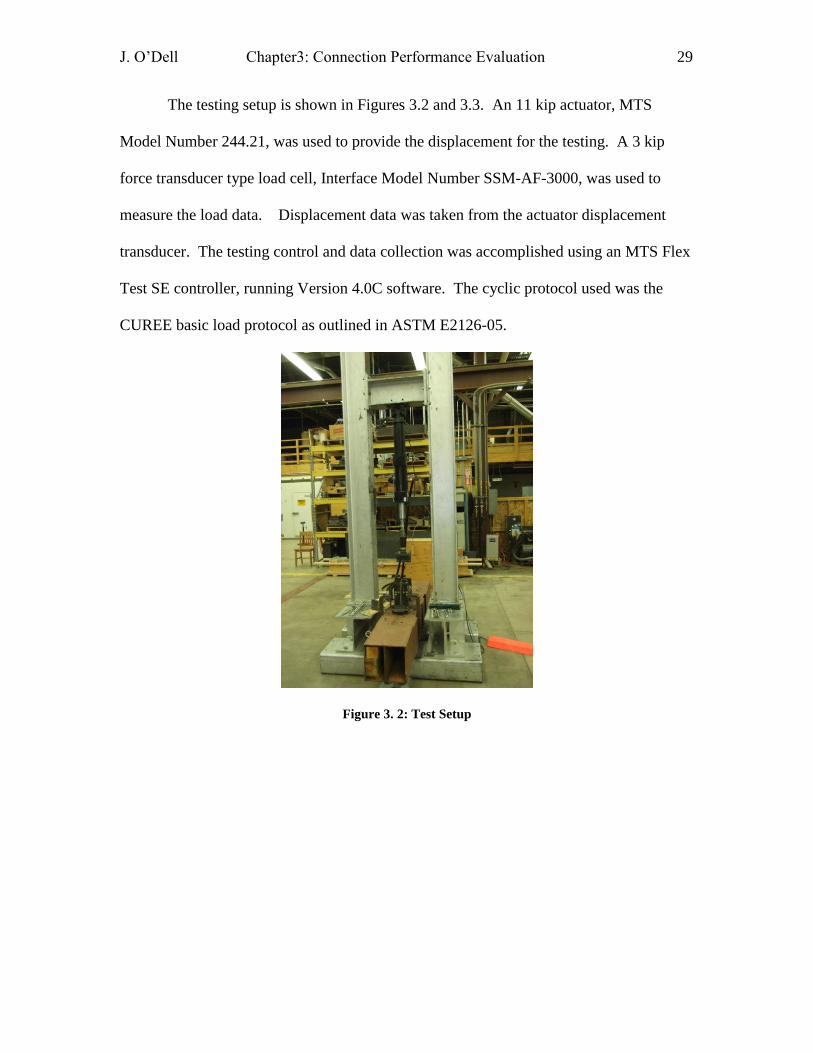
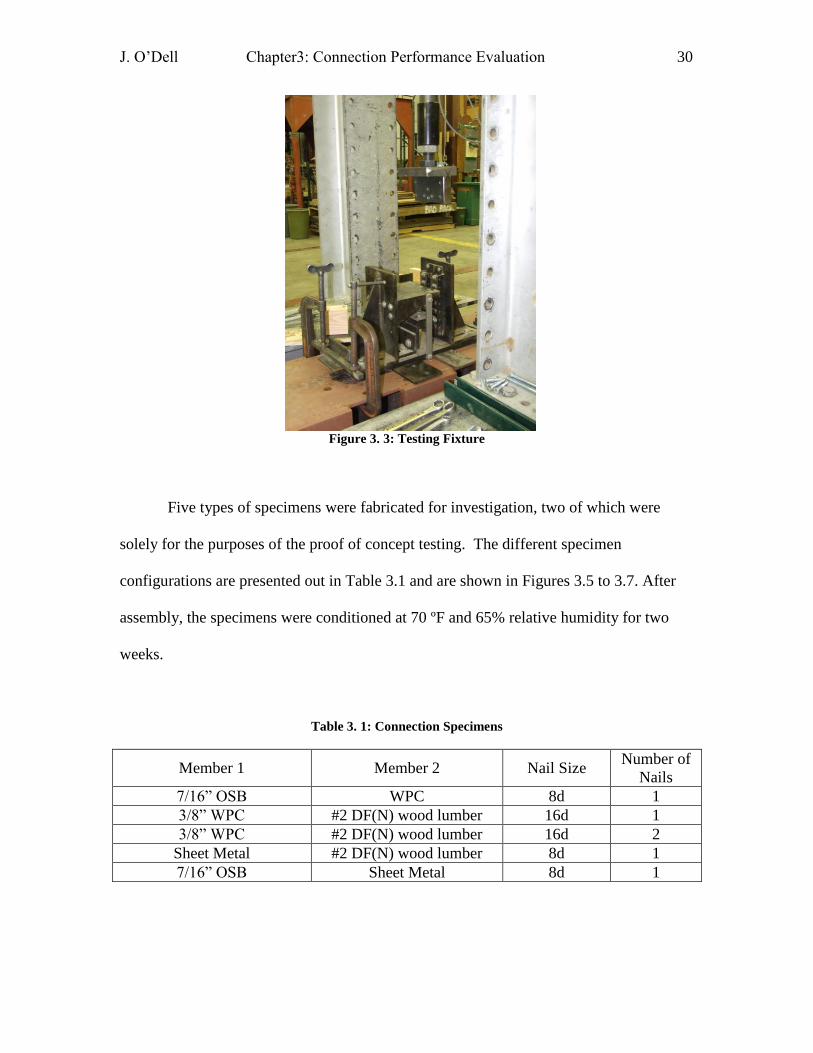

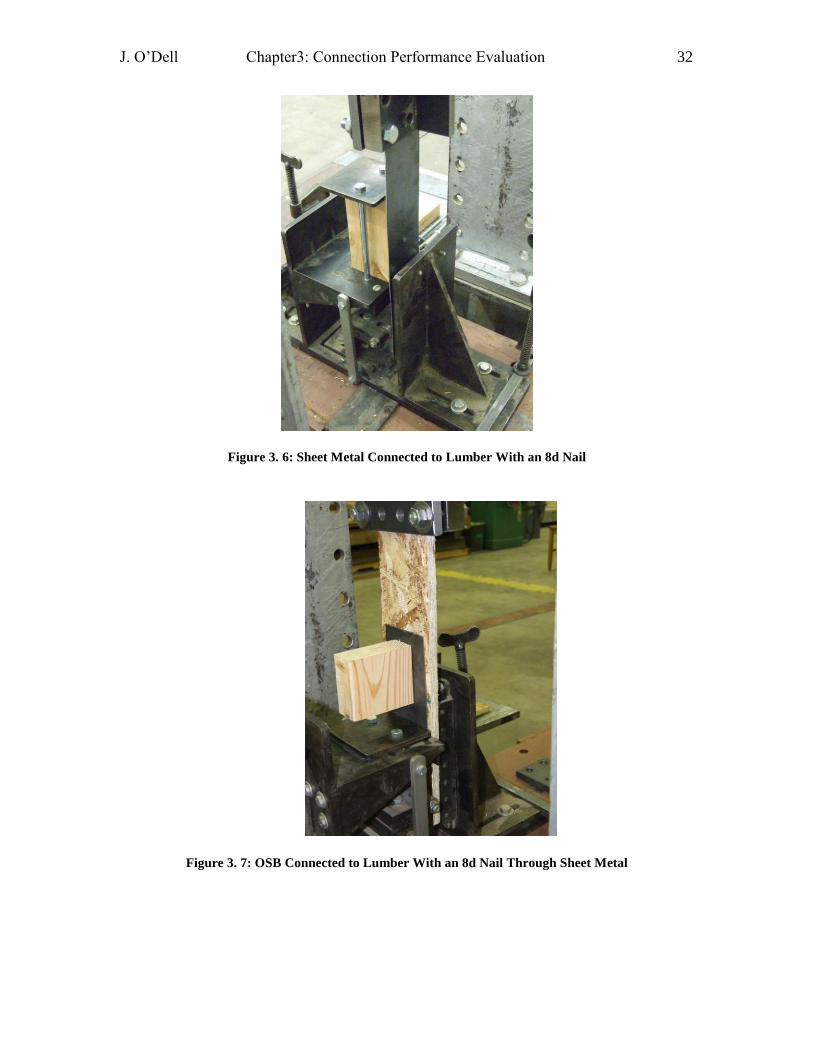
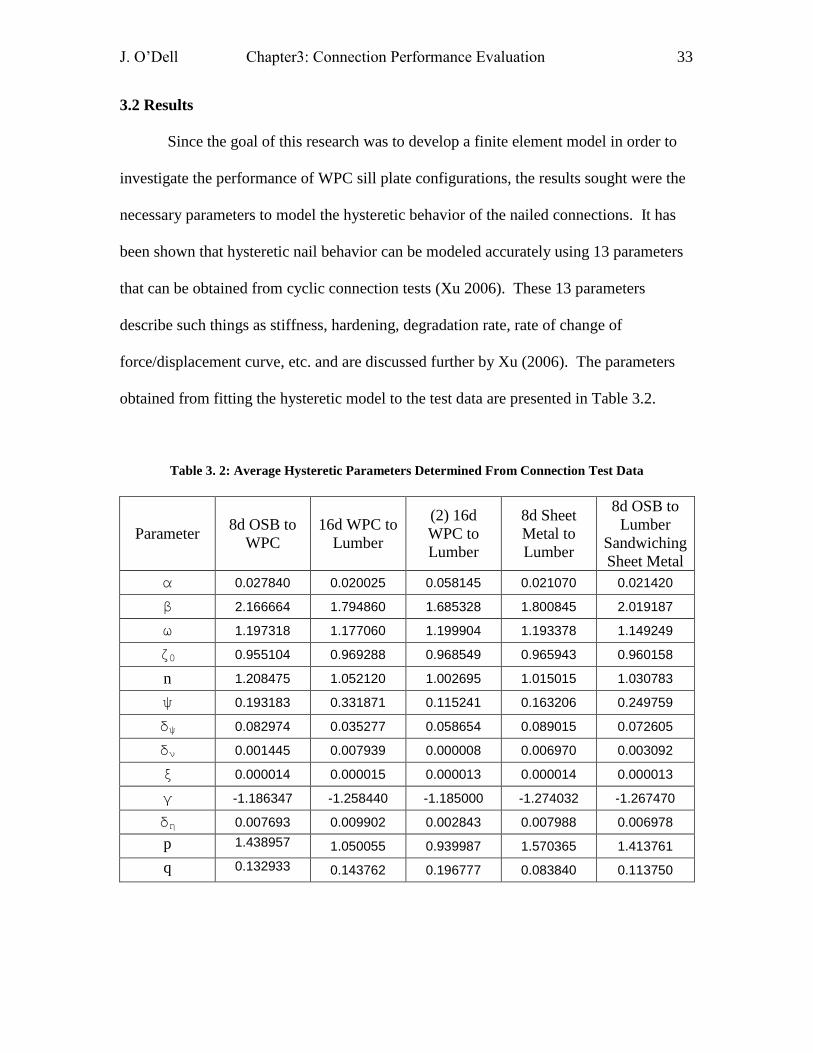

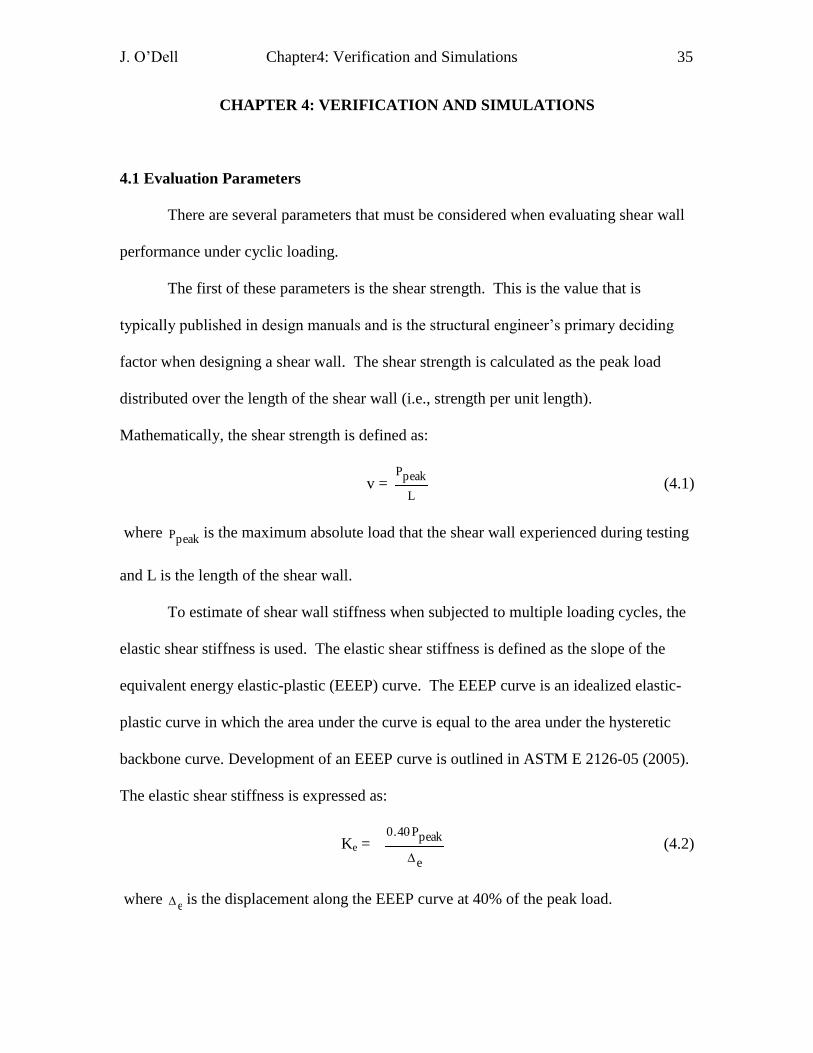
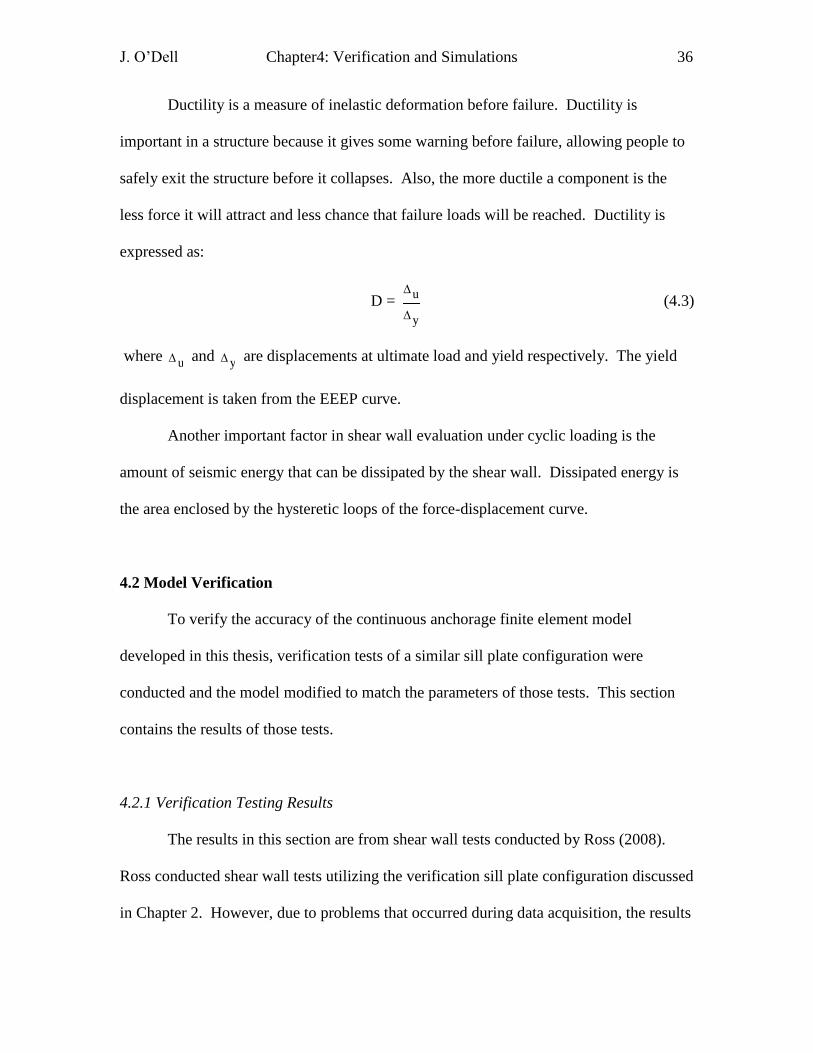
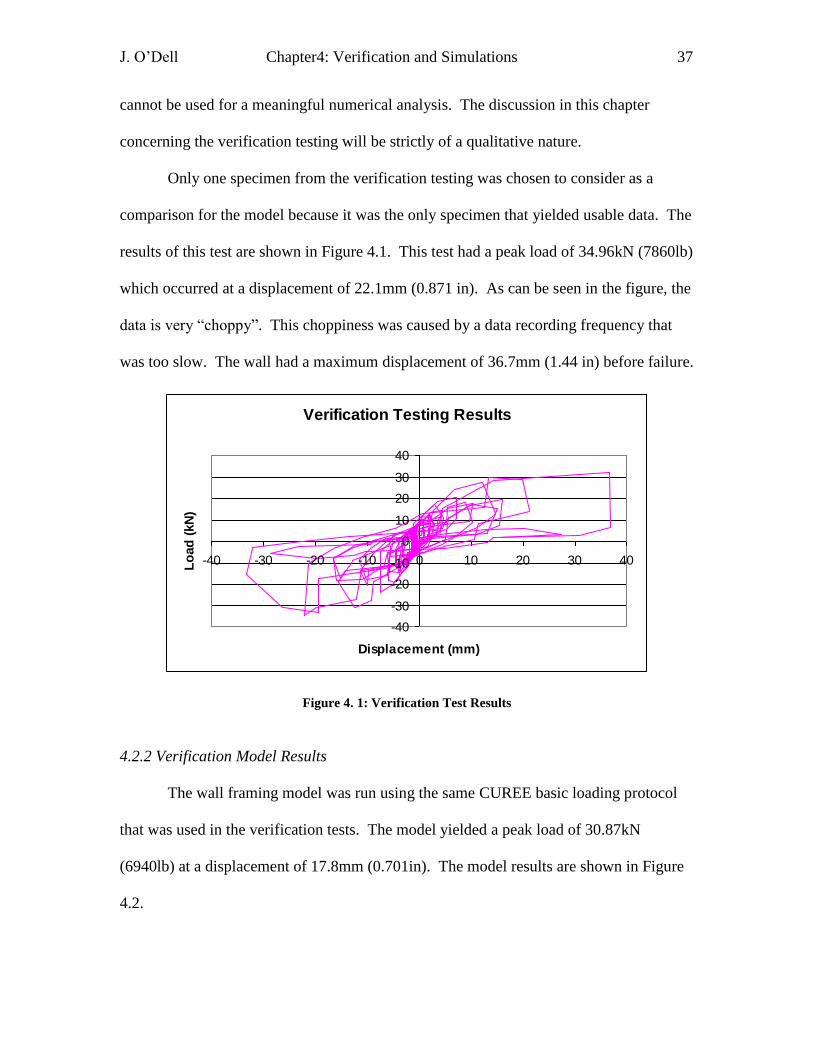
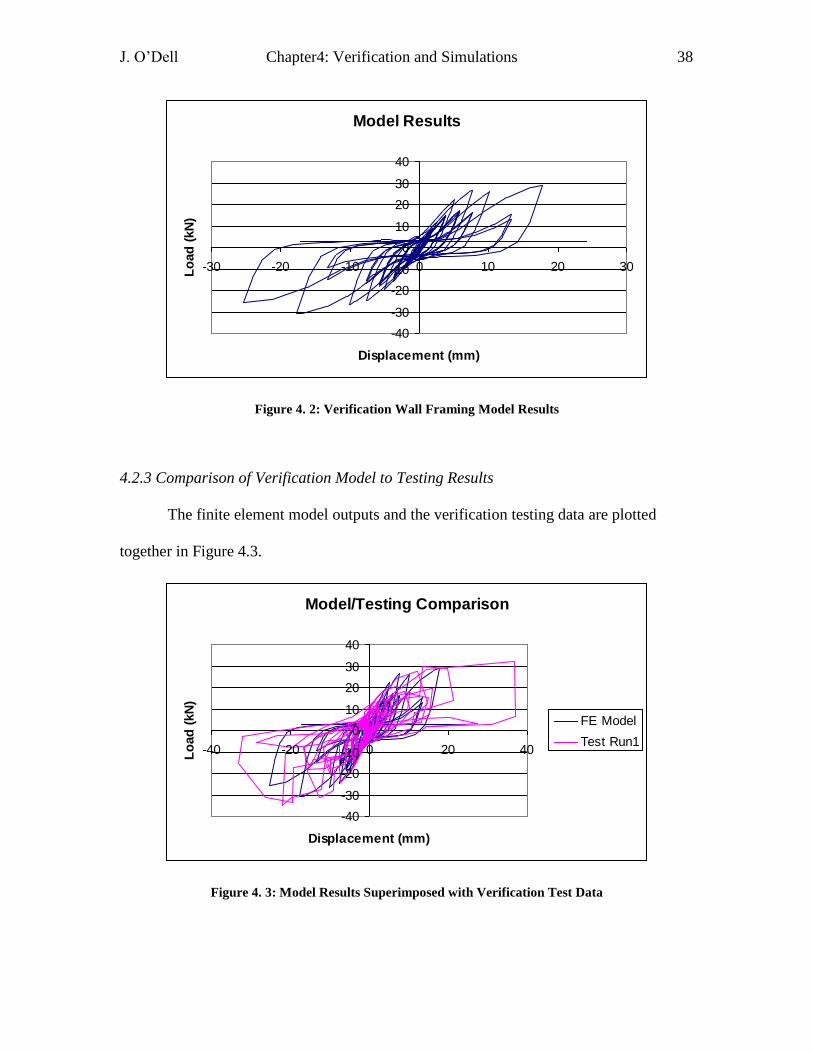


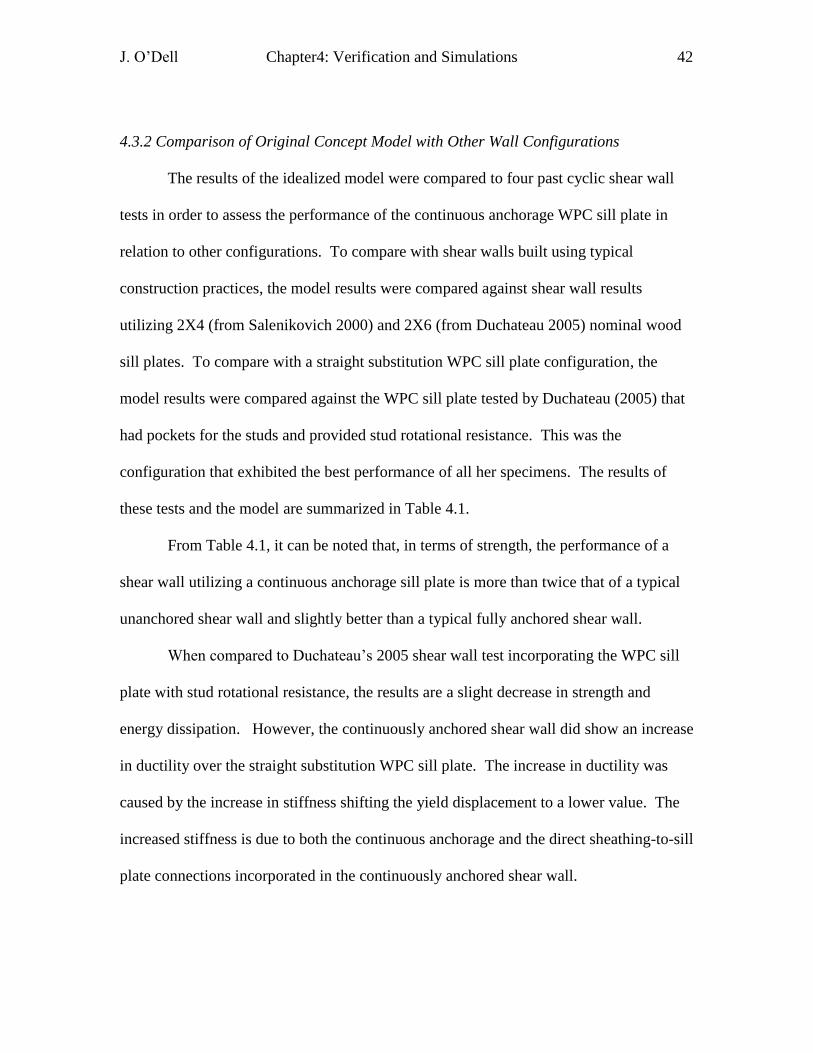
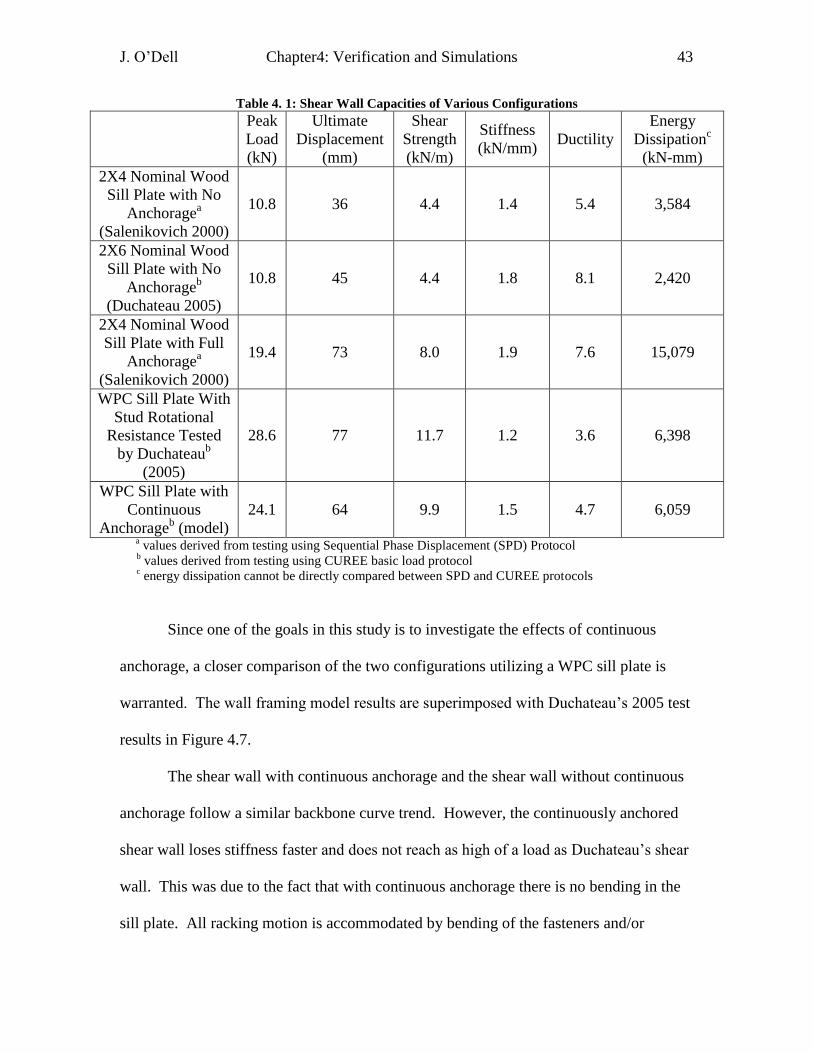


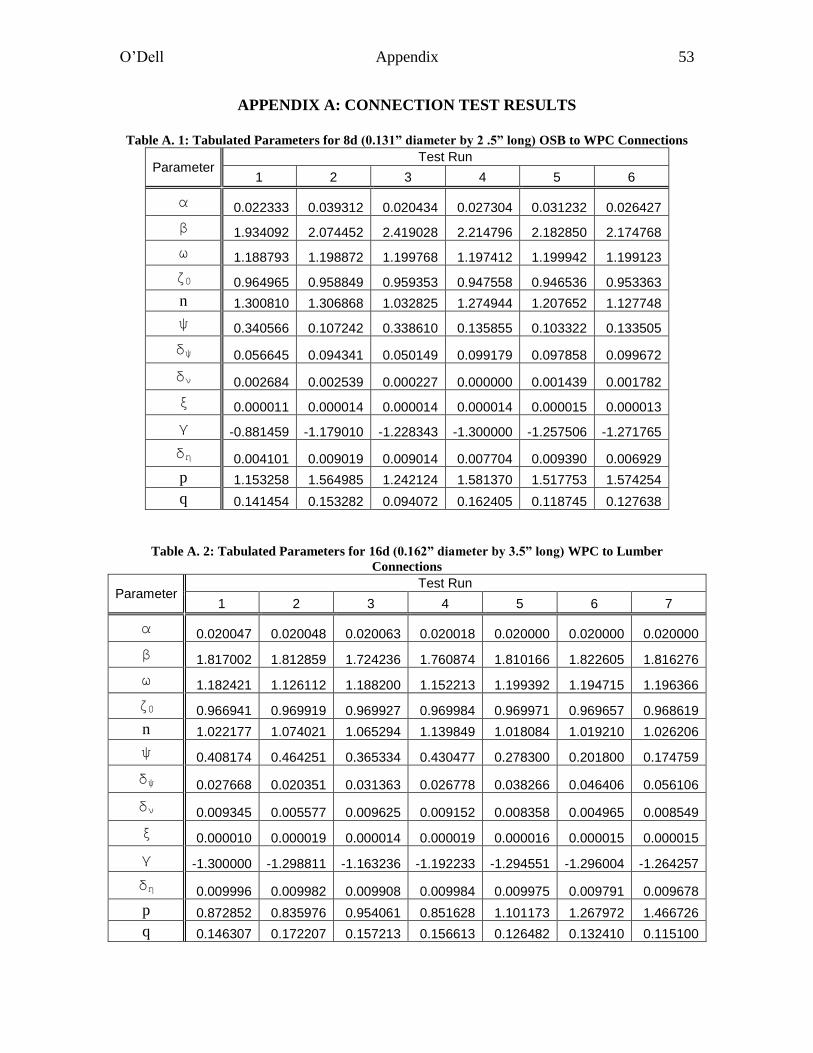
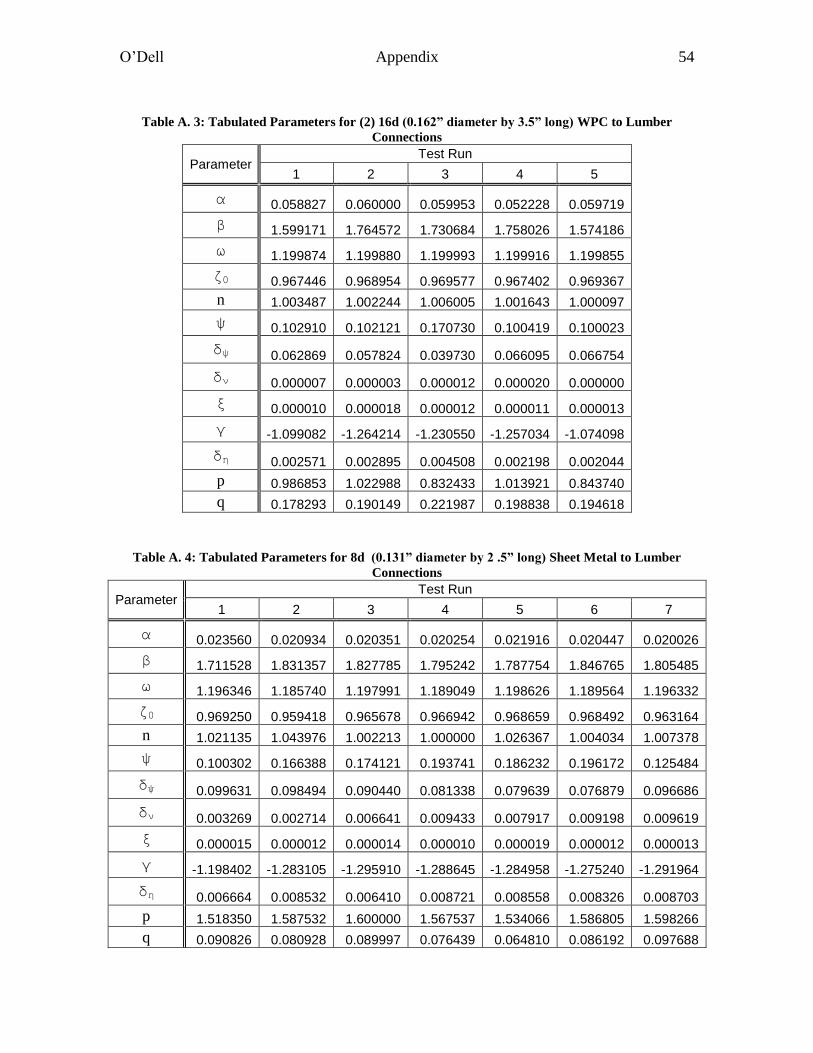
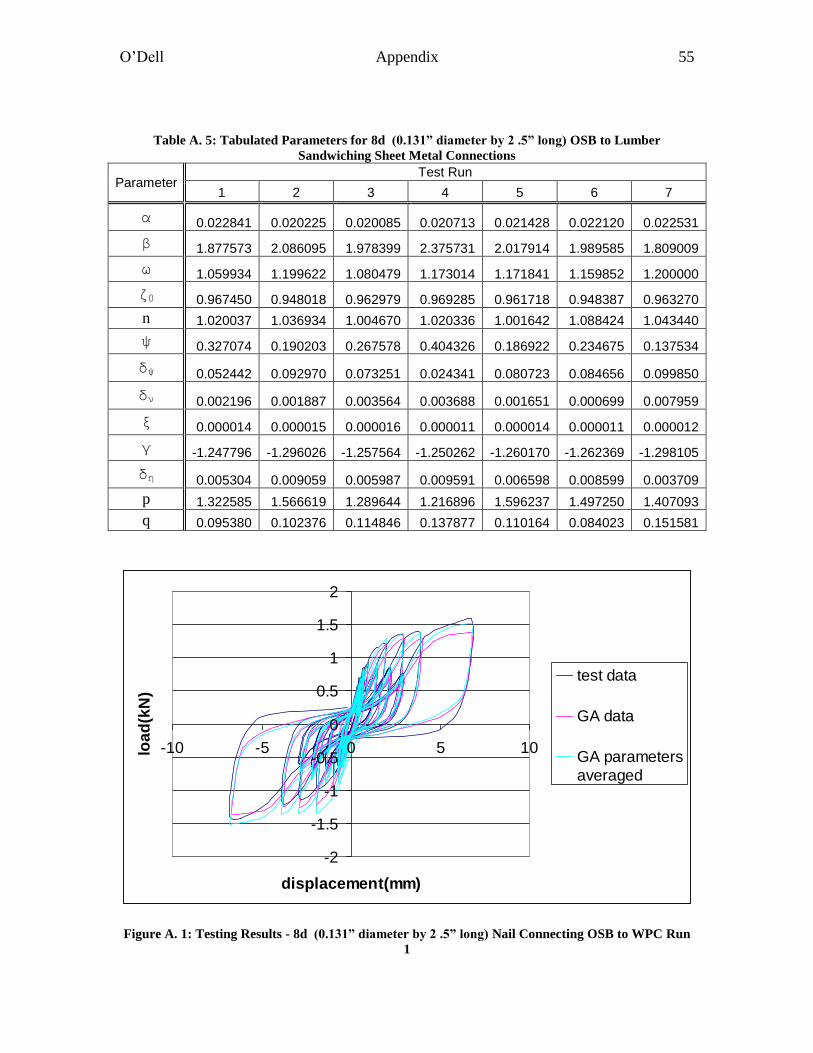
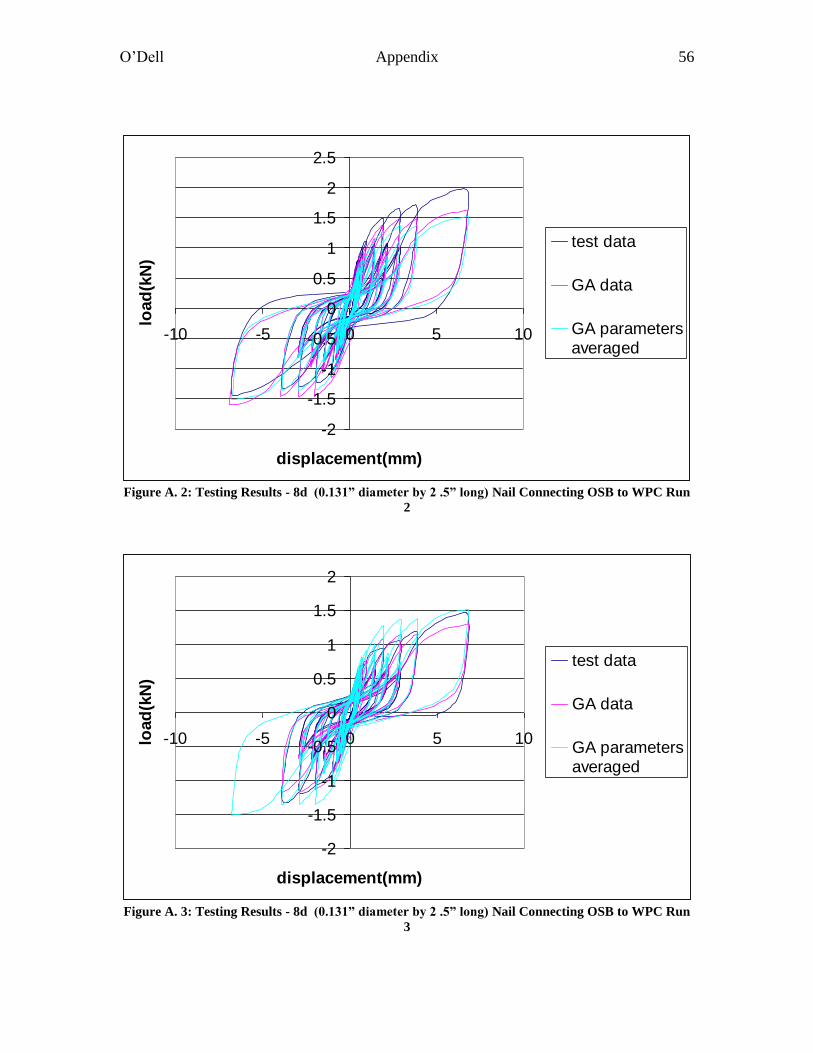

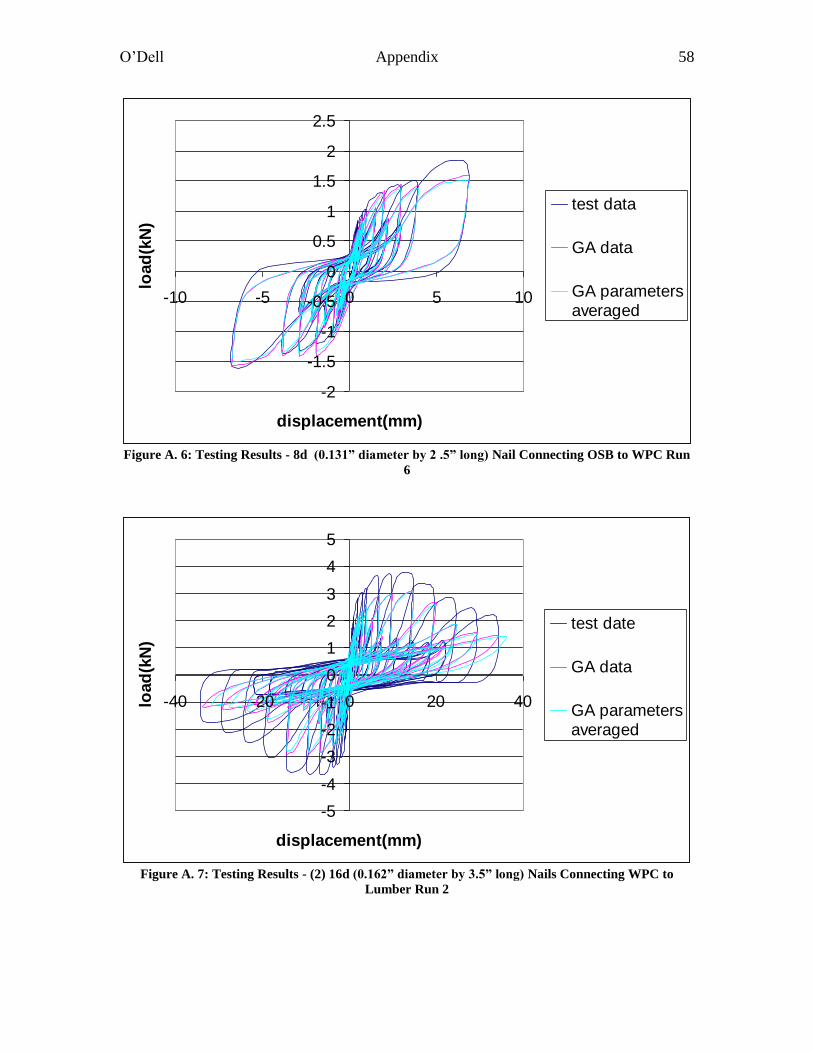


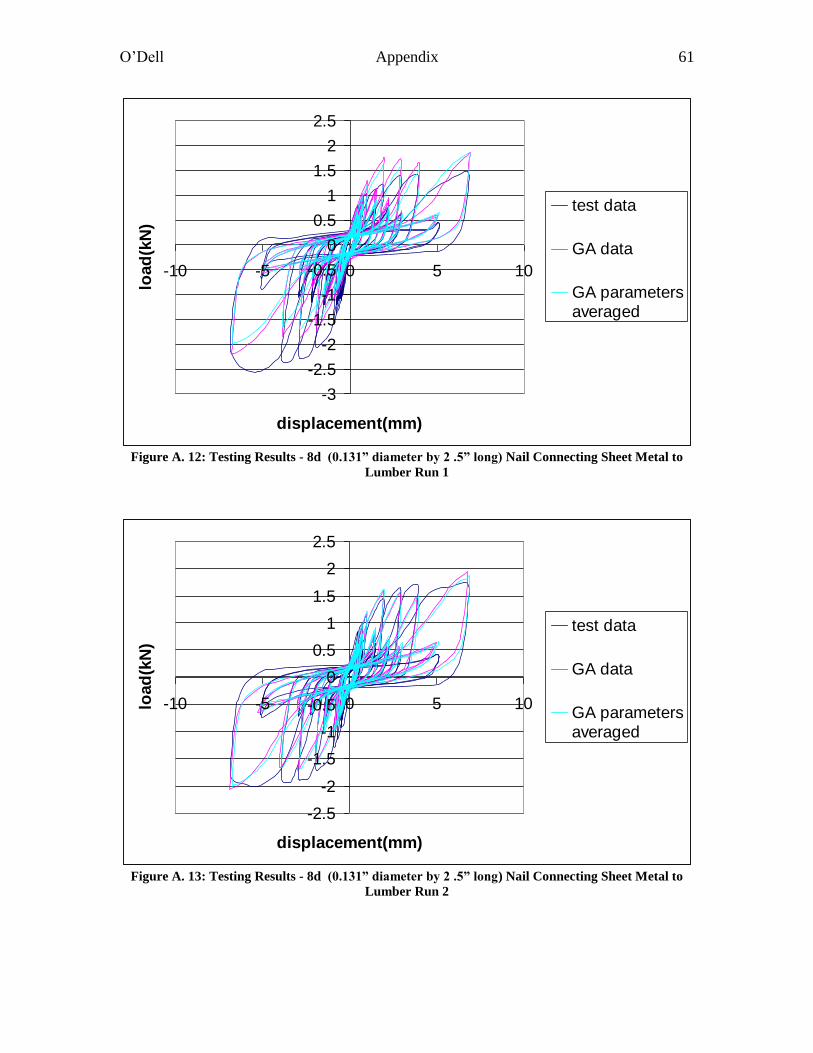
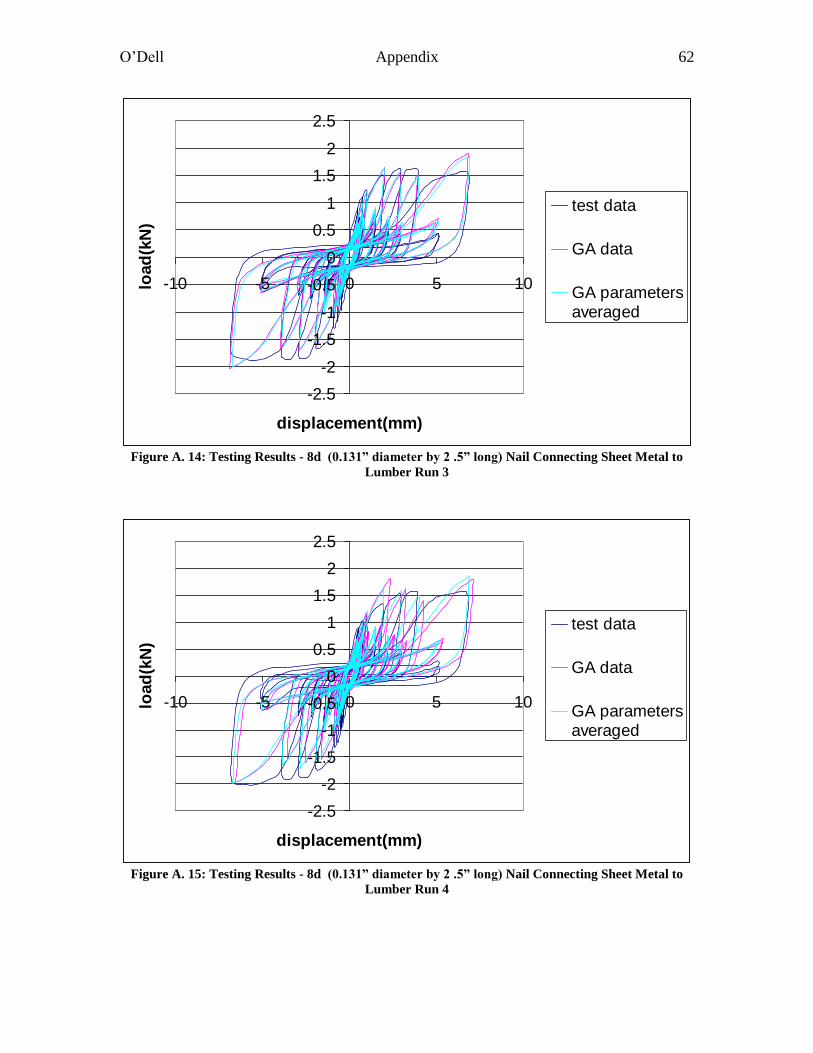
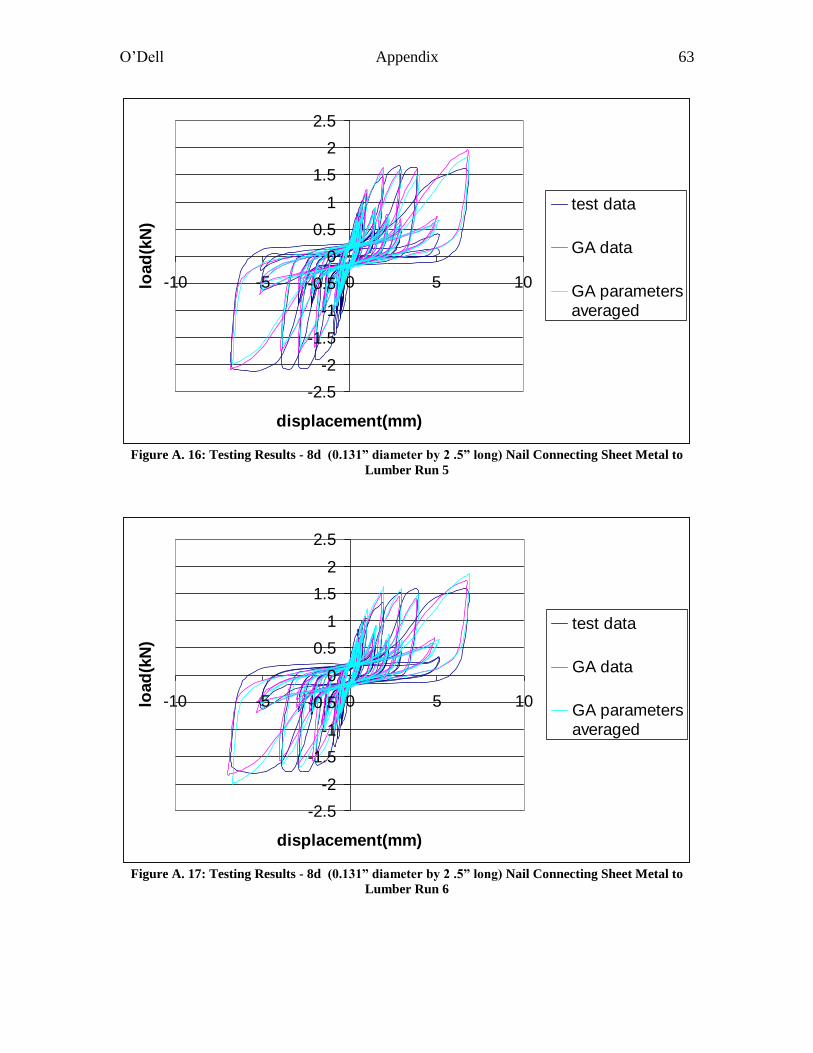

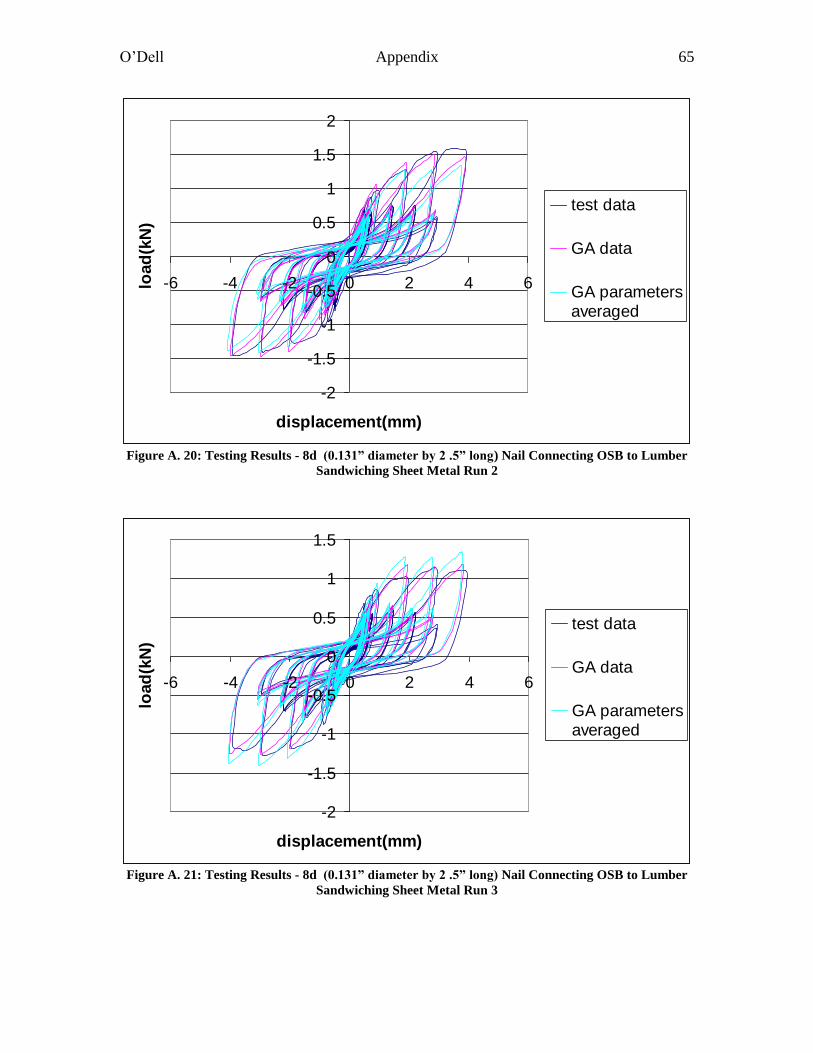

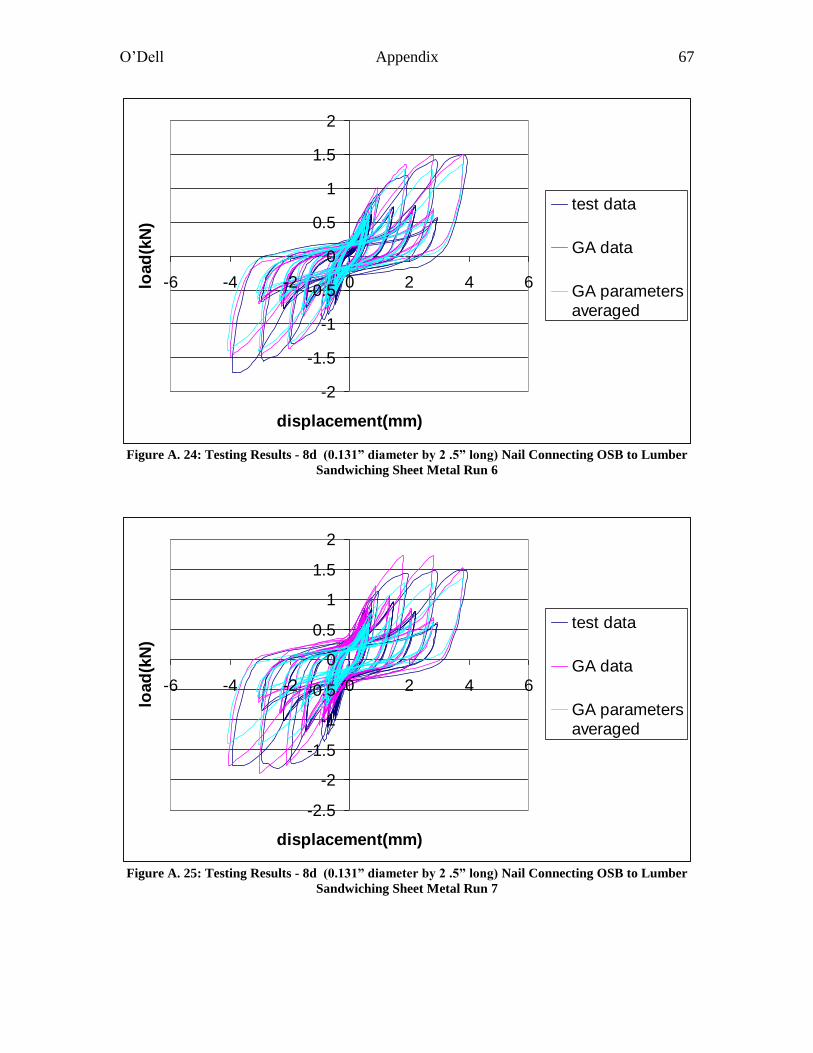


![CSP00014[CIVIL-Tutorial]Composite Plate Girder Design-EC4](https://static.documents.pub/doc/80x56/55cf9353550346f57b9d4962/csp00014civil-tutorialcomposite-plate-girder-design-ec4.jpg)


