Wor King Papers Economics Working Papers 2016-11 The Spillover Effects of Affirmative Action on Competitiveness and Unethical Behavior Ritwik Banerjee, Nabanita Datta Gupta and Marie Claire Villeval
Transcript
Wor
King
Papers
Economics Working Papers
2016-11
The Spillover Effects of Affirmative Action on Competitiveness and
Unethical Behavior
Ritwik Banerjee, Nabanita Datta Gupta and Marie Claire Villeval
The Spillover Effects of Affirmative Action
on Competitiveness and Unethical Behavior
Ritwik Banerjeea
Nabanita Datta Guptab
Marie Claire Villevalc
Abstract: We conduct an artefactual field experiment to examine various spillover effects of Affirmative Action policies in the context of castes in India. We test a) if individuals who compete in the presence of Affirmative Action policies remain competitive in the same proportion after the policy has been removed, and b) whether having been exposed to the policy generates unethical behavior and spite against subjects from the category who has benefited from the policy. We find that these policies increase substantially the confidence of the lower caste members and motivate them to choose significantly more frequently a tournament payment scheme. However, we find no spillover effect on confidence and competitiveness once Affirmative Action is withdrawn: any lower caste’s gain in competitiveness due to the policy is then entirely wiped out. Furthermore, the strong existing bias of the dominant caste against the lower caste is not significantly aggravated by Affirmative Action.
JEL codes: C70, C91, J16, J24, J31, M52
Keywords: Affirmative Action, castes, competitiveness, unethical behavior, field experiment
a Indian Institute of Management Bangalore, Bannerghatta Main Road, Bilekahalli, Bengaluru, Karnataka 560076 India. E-mail: [email protected] b Department of Economics and Business Economics, Aarhus University and IZA, Bonn. Fuglesangs Allé 4, 8210 Aarhus V, Denmark. E-mail: [email protected] c Univ Lyon, CNRS, GATE, 93 Chemin des Mouilles, F-69130, Ecully, France. IZA, Bonn, Germany. Department of Public Finance, University of Innsbruck. E-mail: [email protected]
This research has primarily been funded by the Danish Council for Independent Research | Social Sciences, Grant no. DFF-4091-00026. It has also benefited from the support of the INCLUDE program funded by the Danish Council for Independent Research | Social Sciences, Grant no. DFF-1327 00037. On Villeval’s side, this research was performed within the framework of the LABEX CORTEX (ANR-11-LABX-0042) of Université de Lyon, within the program Investissements d’Avenir (ANR-11-IDEX-007) operated by the French National Research Agency (ANR).
2
1. Introduction
Affirmative Action policies have developed in various contexts to facilitate the access to more
rewarding positions of groups of the population that suffer from lower status in society, most
of the time by means of quotas. Many aim at reducing the gender gap in the access to the boards
of large companies or to parliaments,1 but examples can be found also in the context of highly
segmented societies, as in India where the objective is to reduce the gap between castes in the
access to higher education and jobs (e.g., Deshpande, 2011).
These policies have pros and cons. On the one hand, they help fight the
underrepresentation of some categories whose ability does not differ on average from that of
the more represented categories (OECD, 2012), and they reduce stereotypes (Beaman et al.,
2009). They can also possibly improve the confidence of beneficiaries in the longer run. On the
other hand, they may generate efficiency losses and resentment if they lead to more able
employees being passed over for less able but more protected employees (Holzer and Neumark,
2000) or if no able person can be found (Ahern and Dittmar, 2012). Despite an emerging
literature on this topic (Pande, 2003; Besley et al, 2004; Fryer and Loury, 2005; Duflo, 2005;
Bertrand et al., 2014), little is known about the causal effects of reservation policies and their
spillover effects. Laboratory experiments have shown that in a setting where high-performing
females shy away from competition (Niederle and Vesterlund, 2007; Datta Gupta et al., 2013),
introducing quotas substantially increases females’ competitiveness (Nierdele et al., 2013). The
surge in the supply of high-performing individuals to the competitive pool more than outweighs
the costs of the program. Balafoutas and Sutter (2012) confirm that Affirmative Action reduces
the gender gap without harming male competitors. However, except in the last study showing
that post-tournament cooperativeness is not affected and in Leibrandt et al. (2015) who, on the
contrary, found a strong backlash against females when quotas are in use, we know very little
1 See for example, http://www.bloomberg.com/news/articles/2015-07-01/can-gender-quotas-get-more-women-into-boardrooms-, and European Commission (2015).
3
about the spillover effects of Affirmative Action policies. This is an important question,
however, since this illustrates how institutions can influence the evolution of preferences (e.g.,
Fehr and Hoff, 2011).
Our main objective is investigating two types of spillover effects of Affirmative Action
with an application to the context of castes in India, using natural group identities. First, we
study whether such policies, if effective when implemented, keep having an impact on the
beneficiaries once they are withdrawn. If they encourage able people who were initially shying
away from competition to compete, are these people willing to compete in the same proportion
when they no longer benefit from the support of the policy? Do the winners from the supported
category learn from their success and revise their beliefs about their relative ability?
The second spillover effect investigated is the possible spiteful behavior by people from
the category who did not benefit from Affirmative Action towards people from the other
category. Indeed, if Affirmative Action is perceived by this category as unfair (for example
because they fear that more able individuals from their own group are passed over in
competitions by less able individuals from the other group), it may generate spite against the
members of the category benefiting from the policy. Indeed, feelings of injustice have been
shown to lead to sabotage (e.g., Ambrose et al., 2002; Leibrandt et al., 2015). The policy may
also lead some subjects to take an opportunity to cheat to compensate for the possible
disadvantage introduced by Affirmative Action. On the beneficiary category’s side, two
opposite effects may be observed. If Affirmative Action interventions reinforce
competitiveness, a feeling of entitlement may increase moral flexibility.2 If it also reinforces
group identity (e.g., Akerlof and Kranton, 2000; Chen and Li, 2009), it may increase hostility
against out-groups. On the other hand, the policy may weaken the initial group identity and lead
the beneficiary category to feel more like people from the other category.
2 For example, Schurr and Ritov (2016) show that winning a competition leads to more subsequent dishonest reporting in a standard die-under-cup task, probably because of a higher feeling of entitlement.
4
To study these spillover effects, we have designed an artefactual field experiment (Harrison
and List, 2004) with castes in India. Despite the early introduction of Affirmative Action in this
country, with the aim of facilitating the access of lower castes members to jobs in the public
sector, there are still large caste discrepancies in the access to upper tier jobs.3 We recruited 672
participants in 30 villages from South 24 Parganas district of West Bengal. About half of them
were from the General category and the other half were from the Scheduled Castes.4
Our experiment consists of four treatments. The structure of the Baseline is close to that of
Niederle and Vesterlund (2007). In the first part, subjects had to perform a real-effort task under
an individual piece rate payment scheme. In the second part, they performed the same task
under a tournament scheme in groups of six performers with two winners. After experimenting
with both schemes, in the third part subjects were given the opportunity to choose the payment
scheme to be applied to their performance in this part. As in the previous literature, we consider
that choosing the tournament indicates the participants’ competitiveness. In the fourth part,
subjects chose the payment scheme to be applied to their performance in the first part, giving
us an additional measure of competitiveness. Treatment 1 is similar to the Baseline, except that
subjects were informed that their group consists of subjects from both castes in equal
proportions. This allows us to test whether performance and competitiveness are affected by
making the caste composition of the group common information. Indeed, previous studies have
found that when caste identity is made public, a gap in performance favoring the high caste
3 Largely due to the British colonial regime who made the caste system the central organization of the administration in India, jobs in public administration and senior appointments were allotted based on castes, leading to the over-representation of employees from the upper castes (e.g., de Zwart, 2000). To curb this stratification and occupational endogamy, a percentage of jobs in the administration has been reserved for employees from lower castes, a policy starting already after the ’20s. After independence, lists of Scheduled Castes (“Dalit” or Untouchables), based on heredity, have been established for caste-based job reservations. In 1989 the parliament adopted the Scheduled Castes and Scheduled Tribes Act. In the two lowest of the four categories of jobs in public administration, the share of employees from the Scheduled Castes is similar to their share in the population, but there is a high discrepancy for the two highest categories of jobs. Discrimination remains also important in the private sector (e.g., Thorat and Attewell, 2010; Siddique, 2011). 4 The Scheduled Castes represent 16.6% of the general population in India and the General category about 34% (the rest belong to Scheduled tribes, 8.6%, and Other Backward categories, 41%) (Census 2011).
5
emerges and learning by the low caste is impaired (Hoff and Pandey, 2006; 2014). This accords
with the notions of stereotype threat (i.e., being reminded of their low status decreases the self-
confidence of the low-caste individuals and make them conform to the stereotype formed about
their social group) and stereotype boost (i.e., high-caste individuals feel encouraged because
they are reminded of their high status) (Steele and Aronson, 1995; Shi et al., 2011).
Treatments 2 and 3 introduce Affirmative Action: in parts 2 to 4 of treatment 2, a quota
imposes that one of the two winners in the tournament is the best performer of the Scheduled
Caste. In treatment 3, a preferential treatment increases the score of the Scheduled Caste
subjects in the tournament by a fixed amount. To measure the spillover effect of Affirmative
Action on future competitiveness, part 4 includes two successive choices between submitting
performance in part 1 to either a piece rate or a tournament, the first one in the presence of the
quota or the preferential treatment and the second one without these policies. The spillover is
identified through the evolution of beliefs about one’s performance rank and the comparison
between the choice of the tournament in the two decisions.
To measure the spillover of Affirmative Action on spite and ethical behavior, in all
treatments we added a fifth part in which subjects could earn additional money by rolling a die
under-the-cup (Fischbacher and Föllmi-Heusi, 2013, and Shalvi et al., 2011). Earnings were
proportional to the reported side of the die that faced up. By misreporting the random outcome,
subjects could increase their payoff at no risk of detection. An originality of our design is that
we introduced either positive or negative externalities.5 Indeed, the subjects’ reports determined
both their earnings and that of another subject. We manipulated within-subjects whether the
matched partner was from own or the other caste. We manipulated between-subjects whether
the interests of the two players were or not aligned, allowing for respectively, Pareto-white lies
5 We also differ from Leibrandt et al. (2015) because in their experiment subjects could misreport others’ performance. Here, subjects can misreport a random outcome with no interference with another player’s action.
6
or selfish black lies. 6 , 7 We test whether people are more (less) willing to lie to benefit
themselves and an in-group (an out-group) when payoffs are aligned, and whether they are less
(more) willing to lie to avoid harming an in-group (to harm an out-group) when payoffs are
unaligned. The comparison of reports between treatment 1 and treatments 2 and 3 indicates
whether introducing Affirmative Action in previous parts affects a possible out-group bias.
Our main findings show that without Affirmative Action, the revelation of castes does not
affect performance but it generates a significant caste gap in both absolute and relative self-
confidence. Directionally, it increases the competitiveness of the General category subjects and
decreases that of the Scheduled Castes subjects but the caste gap in competitiveness is not
significant. The introduction of Affirmative Action slightly increases the perceived chance of
the Scheduled Castes subjects of being the winner. It discourages the entry of General category
subjects and encourages that of the Scheduled Castes subjects. As a result, the caste gap in
competitiveness becomes significant to the advantage of the Scheduled Caste subjects.
Regarding the first spillover, we find that as soon as Affirmative Action is removed, the
percentage of the Scheduled Castes subjects entering the tournament decreases sharply while
that of the General category subjects increases. As a result, the caste gap in competitiveness
that had previously opened in favor of the Scheduled Castes subjects is closed or even reversed.
If the objective is to change self-confidence and create a habit of competing, these policies need
to probably be in place more durably. To measure the second spillover we estimate the mean
6 By analyzing how group identity influences lying, we also make a contribution to this literature because so far, the role of group identity in lying has been little explored. Studying the contagion of dishonesty among peers, both Gino et al. (2009) and Dimant (2016) have shown that contagion is more likely among in-groups than when social identification with peers is lower. Focusing on individual behavior in a game in which the die roller receives a fixed payoff, Jiang (2015) found that people with a strong in-group bias do not cheat more to benefit an in-group than another subject. Cadsby et al. (2016) show evidence of dishonesty to benefit oneself and in-groups against out-groups, but they have no condition in which reporting determines the payoff of both the die roller and an in-group. Hruschka et al. (2014) compare a condition in which the die roller can benefit an in-group or an out-group, and a condition in which the self is opposed to an out-group, showing that in societies with stronger institutions, people are more likely to follow an impartial rule instead of favoring in-groups or themselves. In contrast, our active player is always matched either with an out-group or an in-group and payoffs are aligned or not, which offers a more complete picture. 7 On the terminology of white vs. black lies, see e.g., Erat and Gneezy (2012).
7
lying rate when matched with out-groups vs. in-groups, conditional on whether payoffs are
aligned or not. The General category subjects express a strong bias against the Scheduled Castes
members.8 The previous implementation of Affirmative Action tends to increase it slightly, but
not significantly so. Overall, the spillover effects of Affirmative Action are limited: they do not
generate the bias against the protected caste but they do not help reducing it either.
The remainder of this paper is as follows. Section 2 develops the experimental design and
procedures. Section 3 presents our findings. Section 4 discusses these results and concludes.
2. Experimental design, procedures and predictions
We first present our experimental design, then our procedures. Finally, we develop our
behavioral predictions.
2.1. Experimental design
The experimental design comprises of four treatments that vary information about the caste
composition of the group and the rules for determining the winners in a tournament. Each
treatment has multiple parts. One part is randomly selected for payment to prevent hedging. In
each of the first three parts of each treatment, subjects are asked to perform a real-effort task.
We first describe the task, then the Baseline treatment and finally, each of the other treatments.
The task
The task consists of a memory test. Indeed, stereotype threat has been shown to reduce working
memory, in particular the phonological (sound of language) loop (Beilock et al., 2007).
Recalling a series of numbers that are dictated is a suitable test of stereotype threat. 15 randomly
selected numbers between 0 and 100 are called out, one at a time. The subject has to recall and
write down as many numbers as possible in the allotted 3 minutes after all the numbers have
8 This is consistent with Piff et al. (2012) who found that high status in society predicts higher unethical behavior, and with Fehr et al. (2008) who show that spitefulness is more prevalent among people belonging to high castes in India than among those from low castes (see also Hoff et al., 2011).
8
been called out. The score is given by the number of correctly recalled numbers. No feedback
is provided on absolute or relative performance in any part before the end of the session.
Baseline treatment
The sequence of the Baseline treatment (T0, henceforth) is quite similar to that of Niederle and
Vesterlund (2007). Subjects are informed that they are part of a group of six that remains fixed
throughout most parts of the experiment, but they are not informed about the caste composition
of this group. In fact, each session comprises of 12 subjects with six from the Scheduled Castes
(SC, hereafter) and six from General category (GC, hereafter). In each group, there are three
SC and three GC subjects. The content of parts and the compensation schemes are as follows.
Part 1 – Piece Rate: Payoff depends exclusively on the individual absolute performance.
Subjects are paid INR 10 for every correctly recalled number in the allotted three minutes
(minimum payoff =INR 0, maximum=INR 150).9
Part 2 – Tournament: The top two performers in each group of six players are declared
“winners”. Each winner is paid a piece rate of INR 30 for every correctly recalled number. The
non-winners are not paid anything. In case of a tie, the winners are chosen randomly.
Part 3 - Choice of compensation scheme for future performance: Before participating again in
the memory game, subjects have to choose whether they want to be paid by piece rate or
tournament. Part 3 tournament winners are decided by comparing the score of competitors in
part 3 relative to the part 2 score of the group members (to avoid the effect of self-selection that
occurs in part 3). Presenting subjects both compensation schemes in the first two parts before
letting them choose allows them to experience first-hand what the otherwise abstract
compensation schemes mean. It also helps us map performance metric to choice of competition.
Part 4 - Choice of compensation scheme for past performance: Contrary to the previous parts,
subjects do not perform the memory test henceforth but are asked to choose the compensation
9 100 Indian Rupee = 1.5 U.S. Dollar. They correspond to 5.6 U.S. Dollars in 2015 Purchasing Power Parity.
9
scheme they want to be applied to their performance in part 1. Part 4 helps us disentangle
whether observed effects arise because of taste for competition or from instrumental value of
competition (i.e., possibly higher monetary reward) since here subjects do not perform the task.
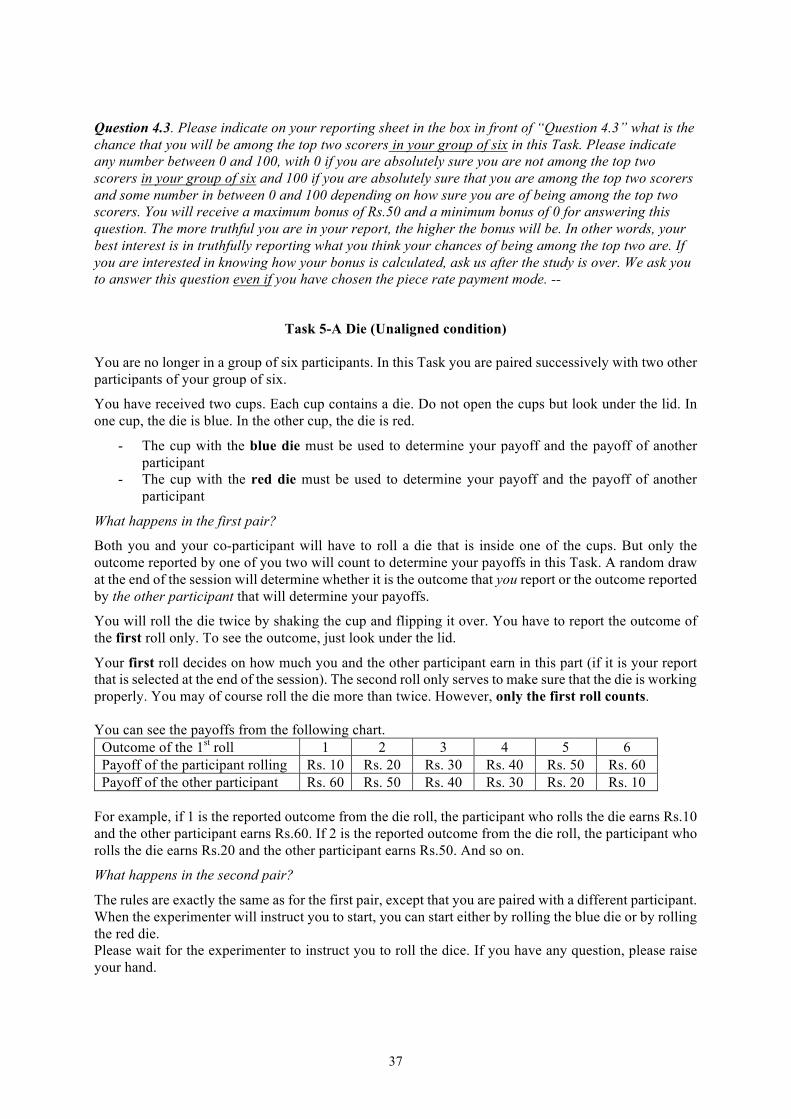
Part 5 – Die Roll: This task is inspired by the die-under-the-cup task of Fischbacher and Föllmi-
Heusi (2013) and Shalvi et al. (2011). Each subject has to roll two dice successively, one red
and one blue, and report the outcomes. Each outcome can potentially determine an additional
payoff for themselves and for another participant in the session. Each die is put in a cup closed
with a lid. A hole in the lid allows only the subject see the outcome of a die roll, which should
remove any possible feeling of scrutiny by anyone. Before each report, subjects are instructed
to roll the die twice (to check that the die is fair) but only report the first outcome. A random
draw at the end of the session determines which decision in each pair counts for payment.
For part 5, we use two conditions across sessions. Condition 5A allows for black lies.
Indeed, the payoffs of the subject who rolls the die and his matched partner are unaligned, as
indicated in Table 1: the roller cannot increase his payoff by lying without reducing the payoff
of his partner. In contrast, condition 5B allows for Pareto-improving lies. Here, payoffs are
aligned: the payoffs of both players increase with the number reported. In the two conditions
the subject always earns more the higher the number he reports, which gives him an incentive
to inflate the reported number. However, social preferences may affect behavior, as a subject
who misreports helps or harms another player, depending on the condition. Thus, these
conditions indicate the sensitivity of lying to the consequence of a lie on others. If the task does
not allow us to identify cheating at the individual level, we can measure it at the caste level.
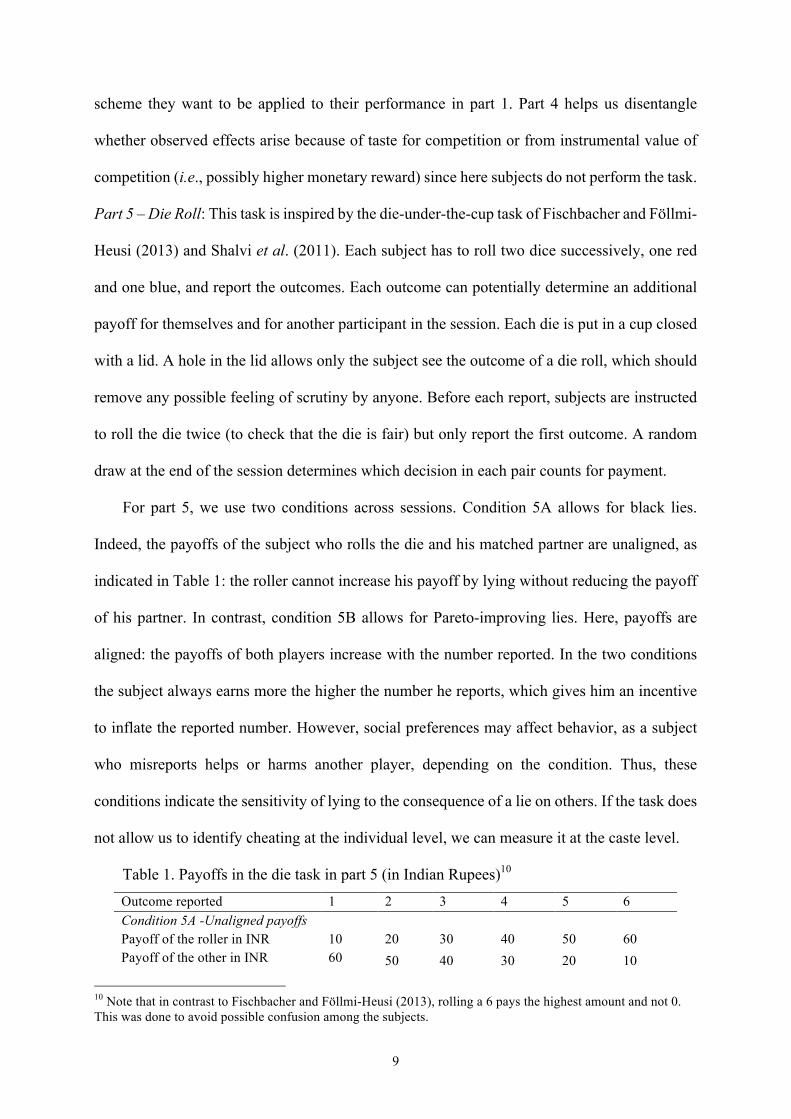
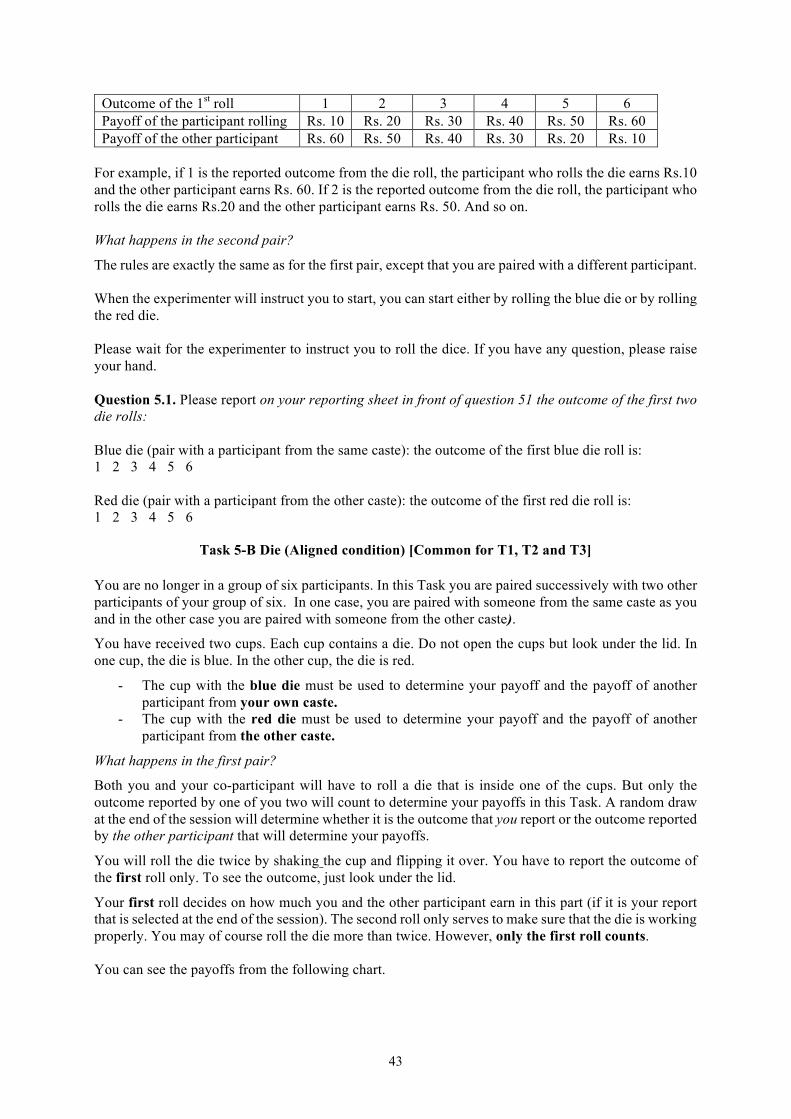
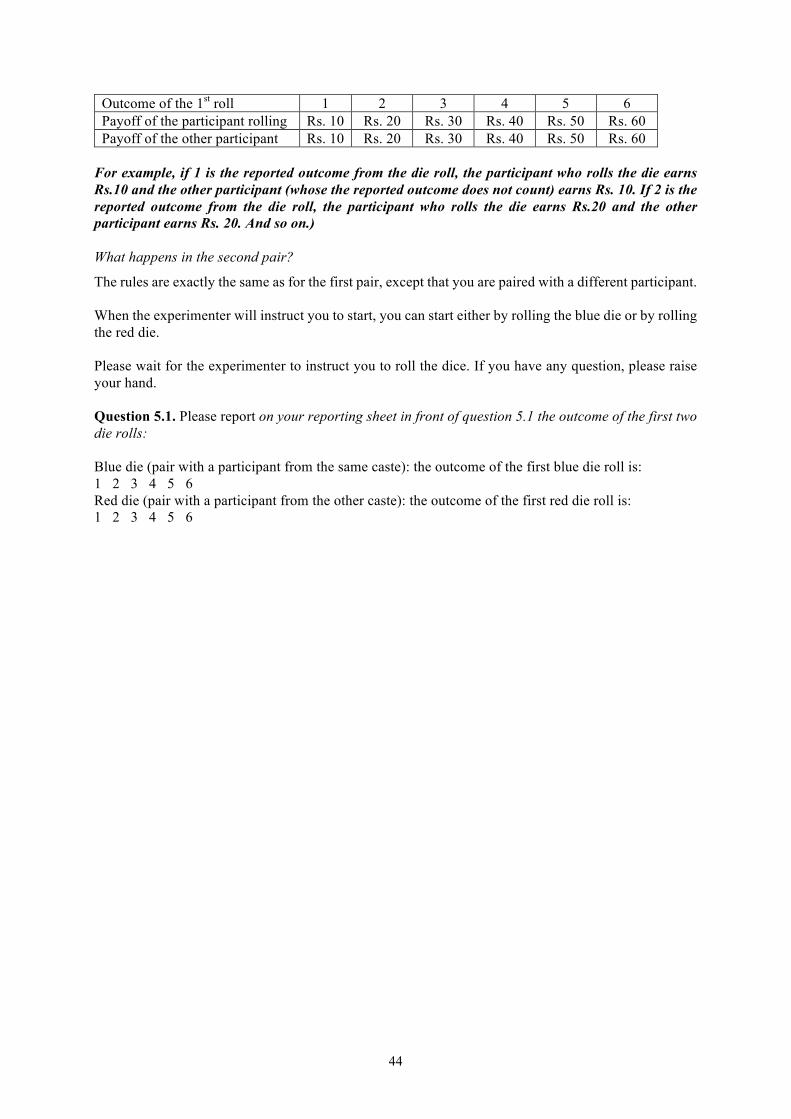
Table 1. Payoffs in the die task in part 5 (in Indian Rupees)10 Outcome reported 1 2 3 4 5 6 Condition 5A -Unaligned payoffs Payoff of the roller in INR Payoff of the other in INR
10 60
20
30
40
50
60
50 40 30 20 10
10 Note that in contrast to Fischbacher and Föllmi-Heusi (2013), rolling a 6 pays the highest amount and not 0. This was done to avoid possible confusion among the subjects.
10
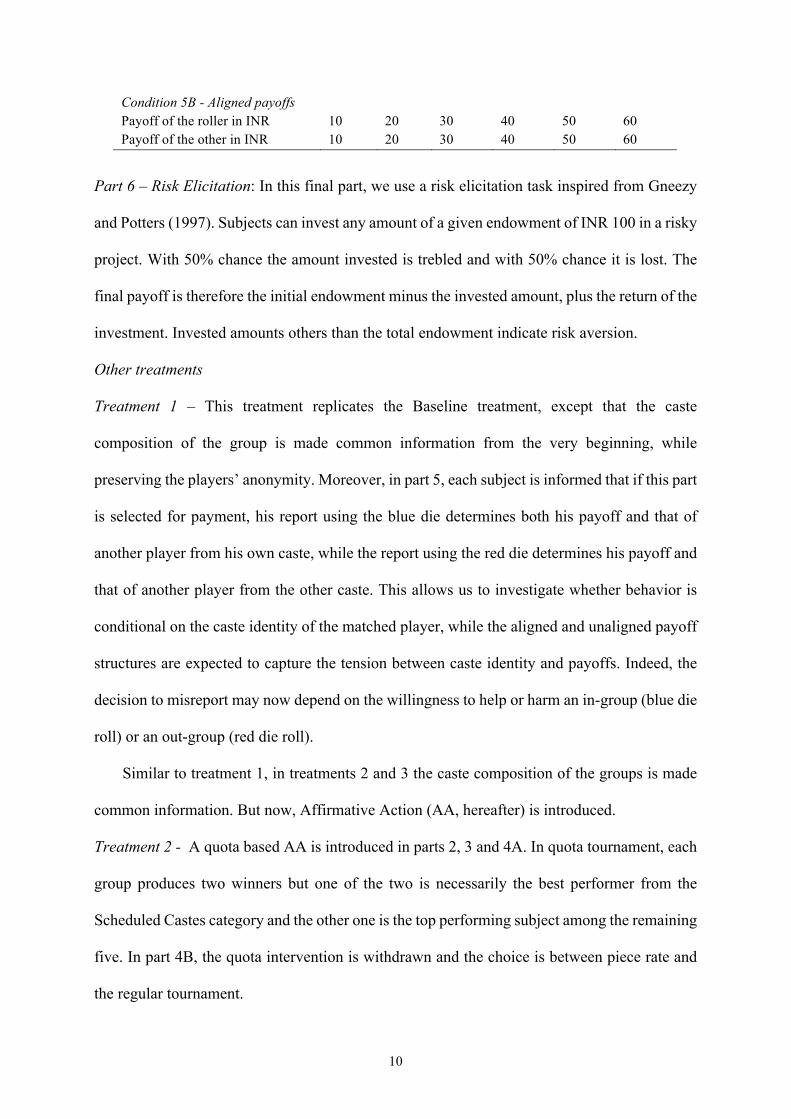
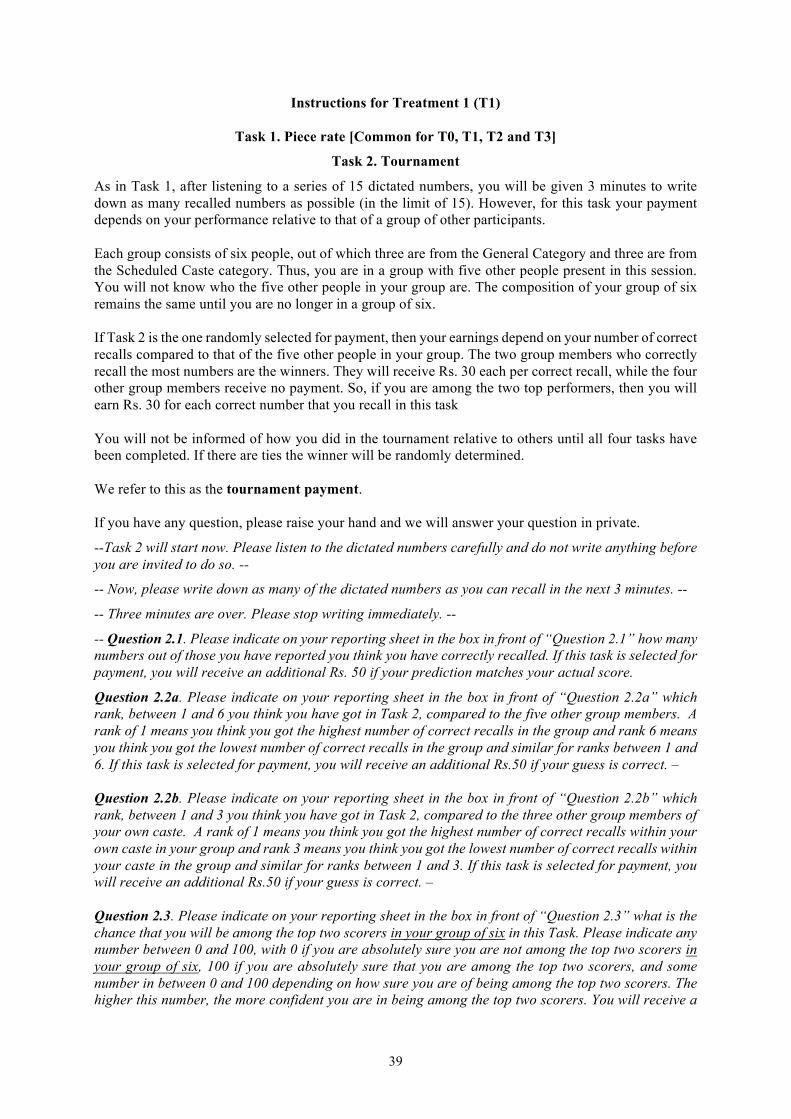
Condition 5B - Aligned payoffs Payoff of the roller in INR
10
20
30
40
50
60
Payoff of the other in INR 10 20 30 40 50 60 Part 6 – Risk Elicitation: In this final part, we use a risk elicitation task inspired from Gneezy
and Potters (1997). Subjects can invest any amount of a given endowment of INR 100 in a risky
project. With 50% chance the amount invested is trebled and with 50% chance it is lost. The
final payoff is therefore the initial endowment minus the invested amount, plus the return of the
investment. Invested amounts others than the total endowment indicate risk aversion.
Other treatments
Treatment 1 – This treatment replicates the Baseline treatment, except that the caste
composition of the group is made common information from the very beginning, while
preserving the players’ anonymity. Moreover, in part 5, each subject is informed that if this part
is selected for payment, his report using the blue die determines both his payoff and that of
another player from his own caste, while the report using the red die determines his payoff and
that of another player from the other caste. This allows us to investigate whether behavior is
conditional on the caste identity of the matched player, while the aligned and unaligned payoff
structures are expected to capture the tension between caste identity and payoffs. Indeed, the
decision to misreport may now depend on the willingness to help or harm an in-group (blue die
roll) or an out-group (red die roll).
Similar to treatment 1, in treatments 2 and 3 the caste composition of the groups is made
common information. But now, Affirmative Action (AA, hereafter) is introduced.
Treatment 2 - A quota based AA is introduced in parts 2, 3 and 4A. In quota tournament, each
group produces two winners but one of the two is necessarily the best performer from the
Scheduled Castes category and the other one is the top performing subject among the remaining
five. In part 4B, the quota intervention is withdrawn and the choice is between piece rate and
the regular tournament.
11
Treatment 3 - Here, we introduce a Preferential Treatment (PT) based AA in parts 2, 3 and 4A.
In PT tournament, a SC subject is awarded 2 bonus points and her final score is her actual score
+2. A GC subject is not awarded any bonus point and thus, her final score is her actual score.
Those with the top two final scores are the two winners in PT tournament. In part 4B, the
intervention is withdrawn.
In treatments 2 and 3, the withdrawal of the AA policy in part 4B aims to elicit spillover
effects of these policies on self-confidence and competitiveness. In part 5 we can observe
whether the reporting of the die outcomes is affected by the previous implementation of AA.
Table 2 summarizes the main characteristics of our experimental design.
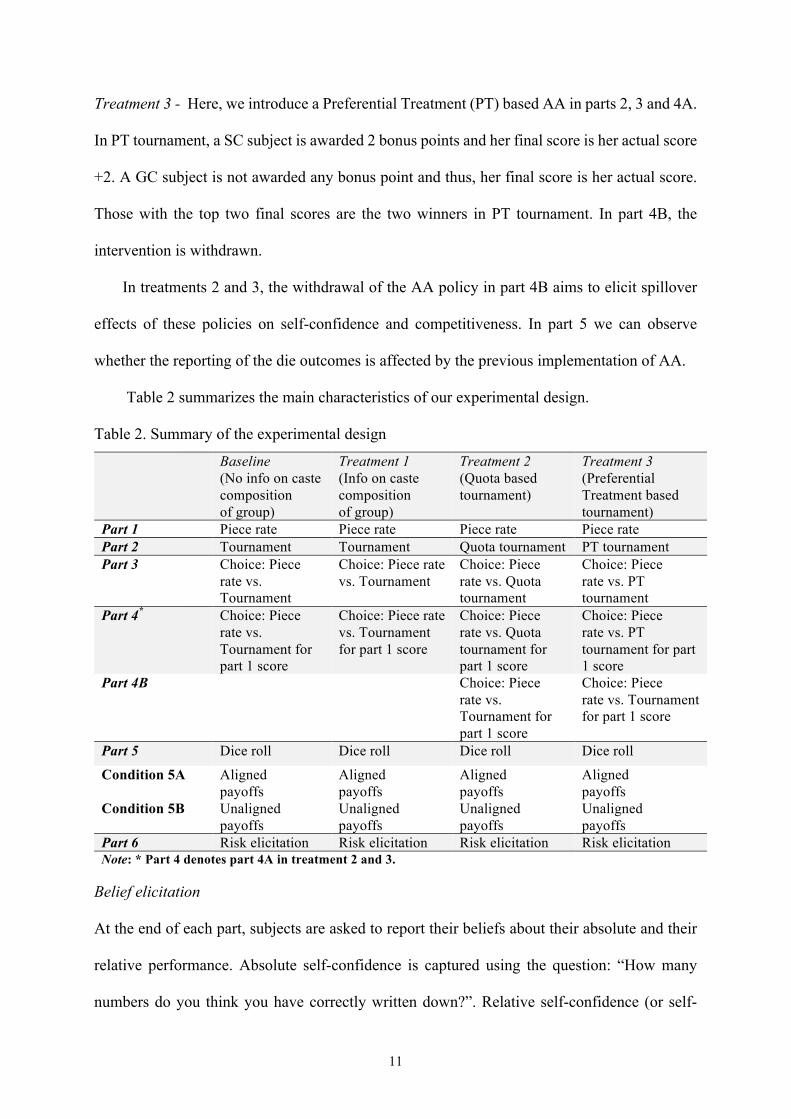
Table 2. Summary of the experimental design
Baseline (No info on caste composition of group)
Treatment 1 (Info on caste composition of group)
Treatment 2 (Quota based tournament)
Treatment 3 (Preferential Treatment based tournament)
Part 1 Piece rate Piece rate Piece rate Piece rate Part 2 Tournament Tournament Quota tournament PT tournament Part 3 Choice: Piece
rate vs. Tournament
Choice: Piece rate vs. Tournament
Choice: Piece rate vs. Quota tournament
Choice: Piece rate vs. PT tournament
Part 4* Choice: Piece rate vs. Tournament for part 1 score
Choice: Piece rate vs. Tournament for part 1 score
Choice: Piece rate vs. Quota tournament for part 1 score
Choice: Piece rate vs. PT tournament for part 1 score
Part 4B Choice: Piece rate vs. Tournament for part 1 score
Choice: Piece rate vs. Tournament for part 1 score
Part 5 Dice roll Dice roll Dice roll Dice roll
Condition 5A Condition 5B
Aligned payoffs Unaligned payoffs
Aligned payoffs Unaligned payoffs
Aligned payoffs Unaligned payoffs
Aligned payoffs Unaligned payoffs
Part 6 Risk elicitation Risk elicitation Risk elicitation Risk elicitation Note: * Part 4 denotes part 4A in treatment 2 and 3.
Belief elicitation
At the end of each part, subjects are asked to report their beliefs about their absolute and their
relative performance. Absolute self-confidence is captured using the question: “How many
numbers do you think you have correctly written down?”. Relative self-confidence (or self-
12
placement) is captured using two questions: “Between 1 and 6, which rank do you think you
have got, compared to the five other group members?” and “What is the chance, in percent, that
you will be among the winners of your group?”. In treatment 2 subjects also report their
perceived rank within their caste. In treatment 3 they have to indicate their perceived rank based
on the final score (including the 2 points bonus given to the SC subjects).
A small incentive encouraged subjects to report their beliefs truthfully without introducing
hedging problems. The incentivizing procedure has been kept as simple as possible to make
them comprehensible to the subject pool.11 Since subjects received no feedback in any part and
treatment about their score or the score of others, eliciting beliefs gives us rich data on the
evolution of self-confidence across parts (in particular before, during, and after the AA
interventions) and helps us map self-confidence to competitive attitudes.
2.2.Experimental procedures
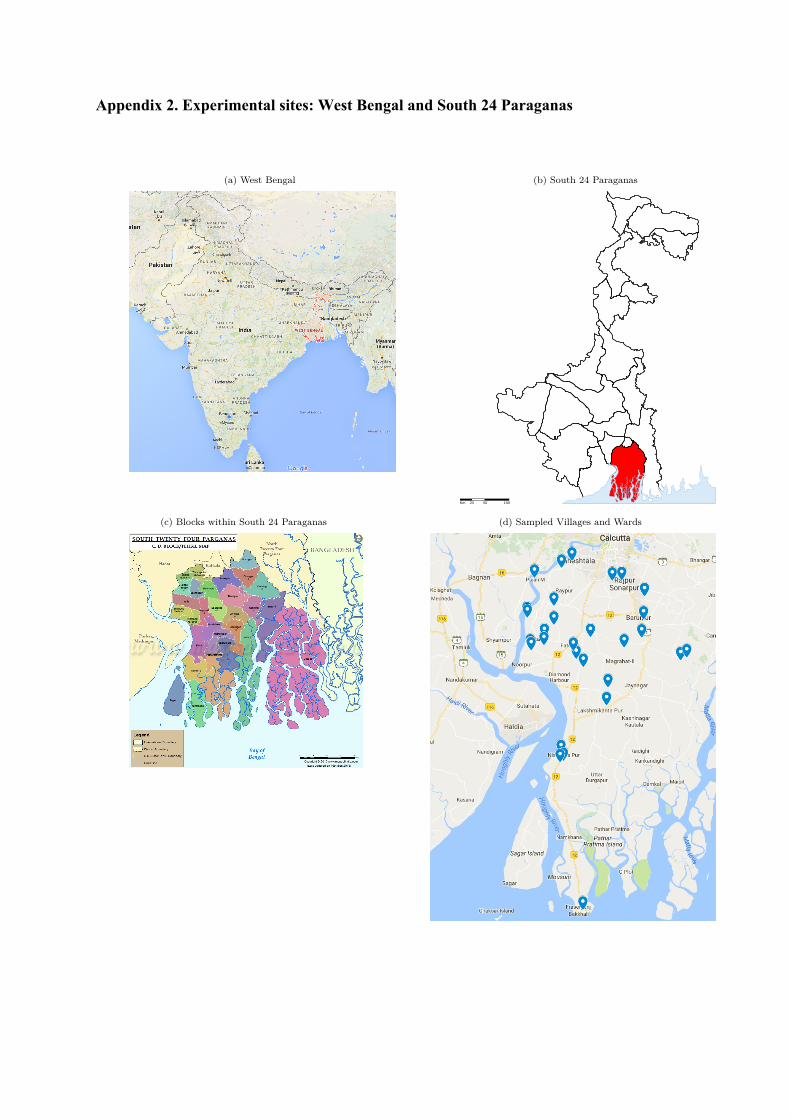
We recruited subjects from South 24 Parganas district of West Bengal. One third of the total
number of blocks in the district were randomly chosen. A stratified sample of 3% of
village/ward was chosen from each block 12 The maps of the sampled blocks and the
villages/wards are given in Appendix 2. From each sampled unit 12 to 24 subjects were
recruited using convenience sampling. Local intelligence helped us strike a balance between
the number of GC and SC subjects. In total, we had 30 villages and 672 subjects in our study.
This includes 341 GC, 318 SC and 13 subjects from other castes (Other Backward Caste or
Schedule Tribes) that we pool with the SC subjects in the data analysis.
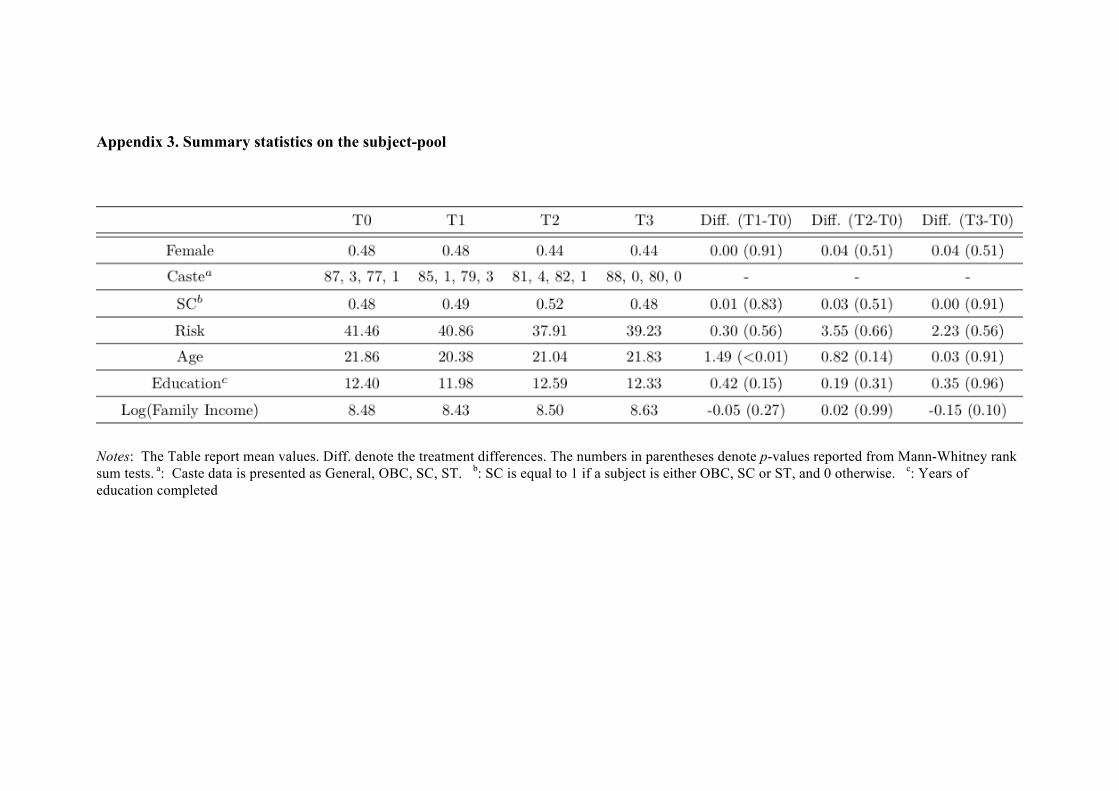
Brief descriptive statistics of the subject pool across the four treatments are reported in
Table A1 in Appendix 3. The subject composition is balanced across treatments. 44-48% are
females. About 48-52% belong to the SC category. Subjects are willing to invest between INR
39-42 in the risk elicitation game, which denotes a relatively high degree of risk aversion. Mean
11 See instructions in Appendix 1. 12 The census data which was used for sampling purposes identifies at the village or ward-of-a-town level.
13
age is 20.4-21.9 years. Two-tailed non-parametric tests indicate that no pairwise treatment
comparison is significant (p>0.10).
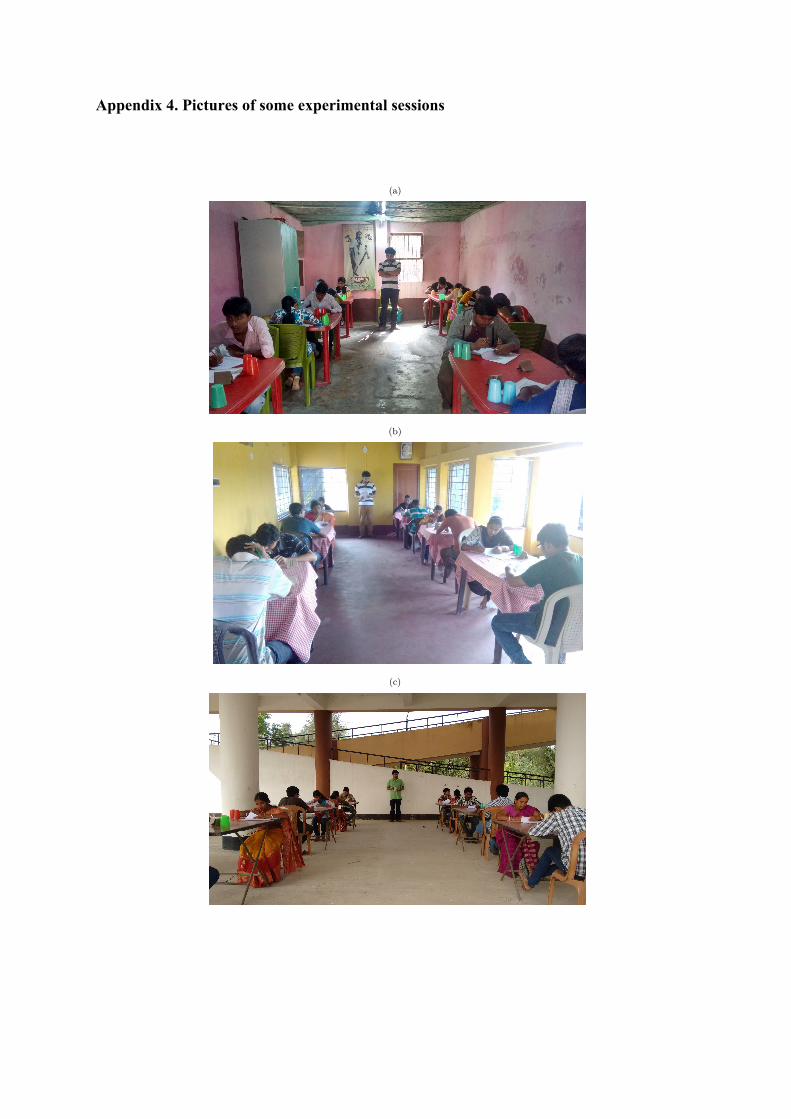
Each session comprised of 12 subjects and was randomly assigned to one of the four
treatments and one of the two part 5 conditions. Upon arrival, subjects were randomly assigned
to a desk in public facilities (schools, open spaces, …) where they received a set of instructions
and two cups with the blue and red dice. Instructions for the next part were distributed after
completion of the previous part. All questions were answered in private. Appendix 4 displays
pictures of some sessions. Each session lasted between 75 and 90 minutes. Subjects were given
a show up fee of INR 100. Earnings from the game ranged from INR 100 to INR 550 with an
average of INR 287 (~$16 in 2015 PPP terms).
2.3. Behavioral conjectures
We now present four main behavioral conjectures.
Our first conjecture is that SC subjects may suffer from a stereotype threat when their group
identity is made common information, compared to a setting where castes are kept silent. This
stereotype threat has already been identified in the literature, especially in highly segmented
societies. We expect to observe it through a lower mean score in the memory task and a lower
confidence in absolute and relative performance levels for the SC subjects when caste is made
salient compared to when it is not. We can also test for the stereotype boost in the GC subjects.
Our second conjecture is that AA interventions boost the self-confidence of the subjects
who are eligible to the policy and increase their competitiveness. Indeed, the prospect of
benefiting from a quota or from a score bonus when choosing the tournament should counteract
the effect of the stereotype threat, if any. This has been observed in studies where the same
types of intervention increased the competitiveness of the most able females and reduced the
gender gap in competitiveness (Niederle and Vesterlund, 2007; Balafoutas and Sutter, 2012).
14
Our third conjecture is that the subjects from the category that previously benefited from
AA increase on average their confidence about their chance to win a tournament and hence,
they stay more competitive even after the AA interventions have been withdrawn. We expect
that having experienced the tournament payment scheme with the support of AA policies should
help subjects from the protected caste to revise upwards their beliefs about their ability to win
a competition. If so, this should encourage them to compete more after than before the
introduction of these measures.
Our last conjecture is that the subjects from the category that did not previously benefit
from AA interventions increase their bias against the subjects from the other caste, compared
to a setting without AA, and they may forego benefits from misreporting the die outcome when
lying also increases the payoff of a partner from the other caste. Based on the literature on
dishonesty (Fischbacher and Föllmi-Heusi, 2013; Abeler et al., 2016), we expect that not all
subjects lie and not in full. If lying is conditional on the institutional environment, some subjects
who did not benefit from the AA advantage and find this unfair may refrain from lying (lie
more, respectively) when such a lie would increase (decrease) the payoff of an out-group.
3. Results
First, we present our results on the existence of a stereotype threat/boost, on the willingness of
subjects from different castes to compete, and on the impact of AA on the decision to enter the
tournament across castes. Next, we study the spillover effects of AA on confidence and
competitiveness once the intervention is removed. Finally, we focus on the spillover effects of
AA on unethical behavior and on the in-group/out-group bias.
3.1. Stereotype threat, competitiveness, and the impact of AA
Our first result can be stated as follows.
Result 1. Caste-related stereotype threat and boost work via beliefs, not via performance. This is consistent with our first conjecture.
15
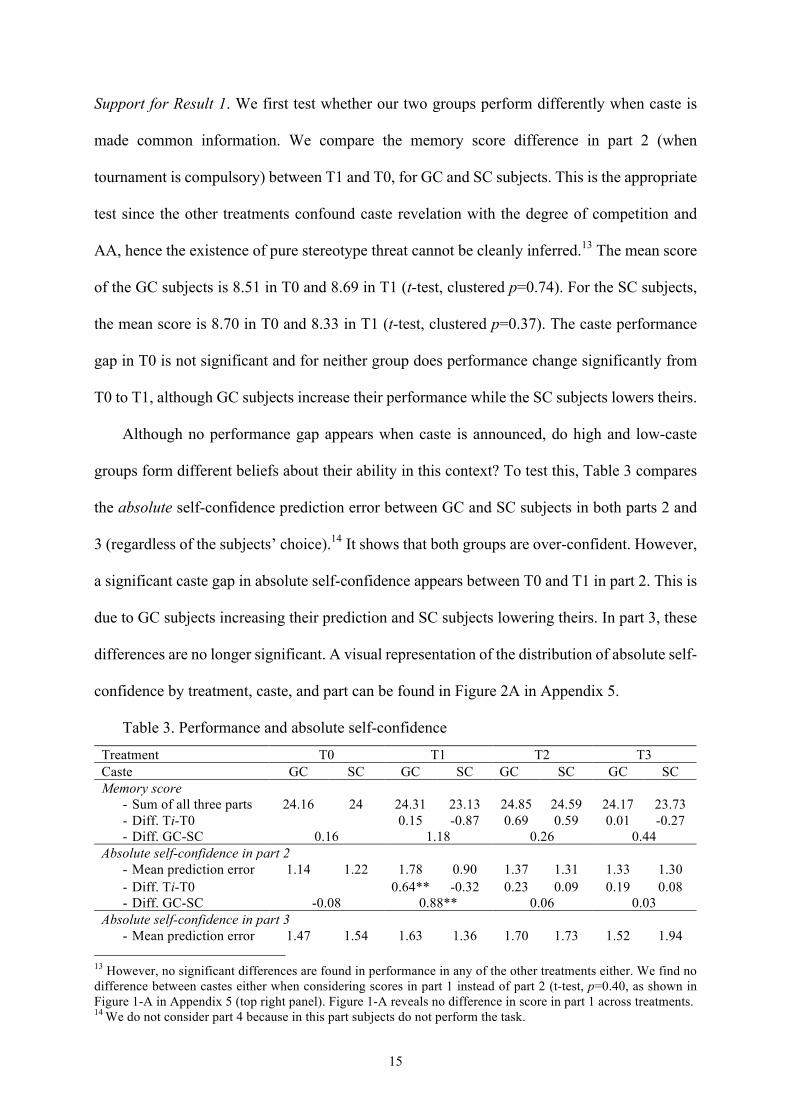
Support for Result 1. We first test whether our two groups perform differently when caste is
made common information. We compare the memory score difference in part 2 (when
tournament is compulsory) between T1 and T0, for GC and SC subjects. This is the appropriate
test since the other treatments confound caste revelation with the degree of competition and
AA, hence the existence of pure stereotype threat cannot be cleanly inferred.13 The mean score
of the GC subjects is 8.51 in T0 and 8.69 in T1 (t-test, clustered p=0.74). For the SC subjects,
the mean score is 8.70 in T0 and 8.33 in T1 (t-test, clustered p=0.37). The caste performance
gap in T0 is not significant and for neither group does performance change significantly from
T0 to T1, although GC subjects increase their performance while the SC subjects lowers theirs.
Although no performance gap appears when caste is announced, do high and low-caste
groups form different beliefs about their ability in this context? To test this, Table 3 compares
the absolute self-confidence prediction error between GC and SC subjects in both parts 2 and
3 (regardless of the subjects’ choice).14 It shows that both groups are over-confident. However,
a significant caste gap in absolute self-confidence appears between T0 and T1 in part 2. This is
due to GC subjects increasing their prediction and SC subjects lowering theirs. In part 3, these
differences are no longer significant. A visual representation of the distribution of absolute self-
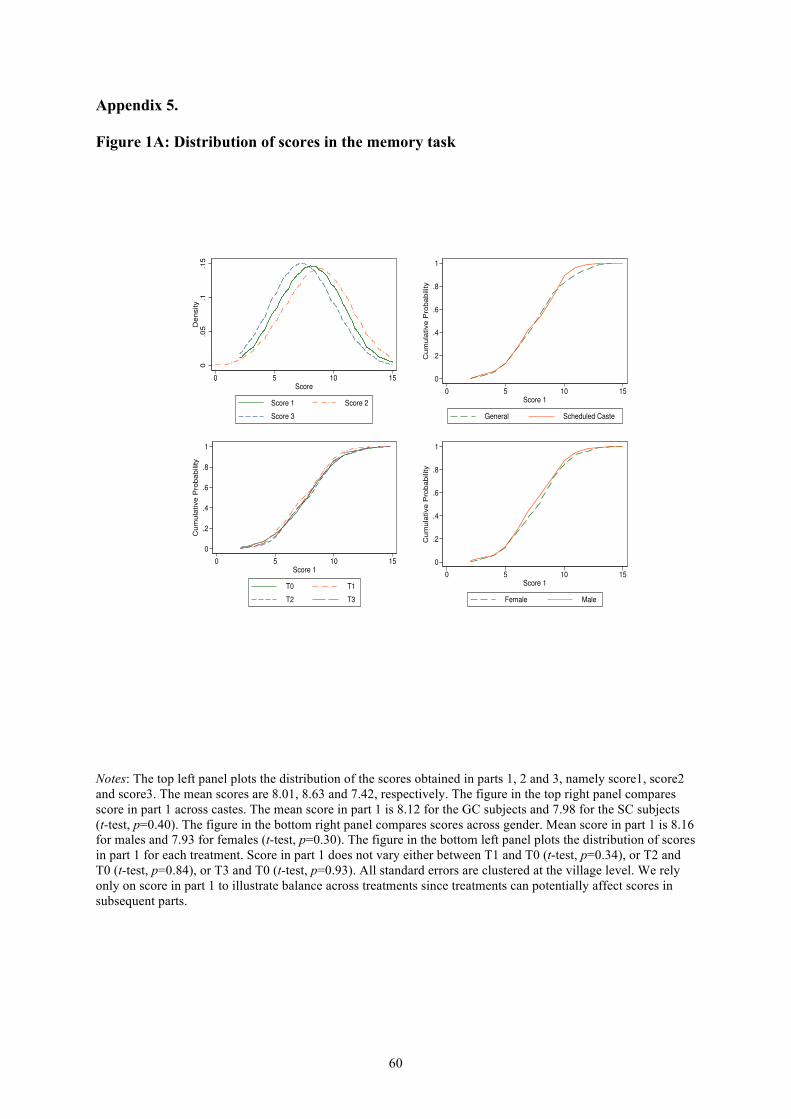
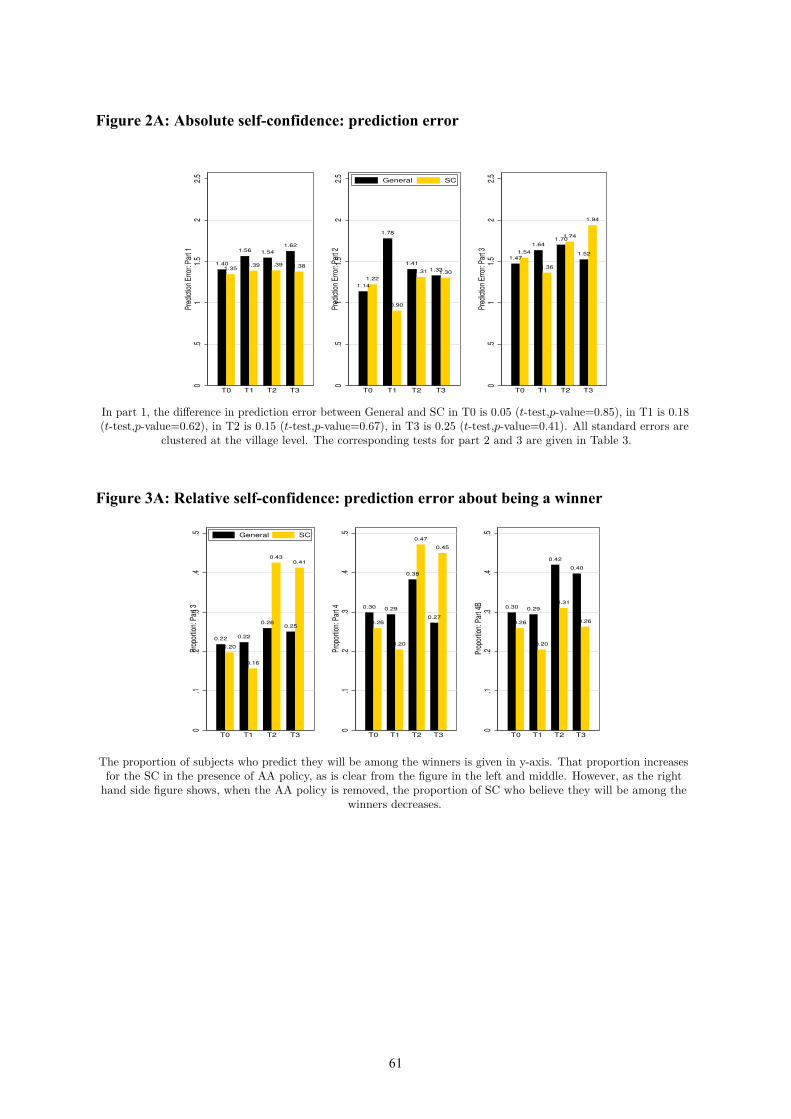
confidence by treatment, caste, and part can be found in Figure 2A in Appendix 5.
Table 3. Performance and absolute self-confidence
Treatment T0 T1 T2 T3 Caste GC SC GC SC GC SC GC SC Memory score
Absolute self-confidence in part 3 - Mean prediction error 1.47 1.54 1.63 1.36 1.70 1.73 1.52 1.94
13 However, no significant differences are found in performance in any of the other treatments either. We find no difference between castes either when considering scores in part 1 instead of part 2 (t-test, p=0.40, as shown in Figure 1-A in Appendix 5 (top right panel). Figure 1-A reveals no difference in score in part 1 across treatments. 14 We do not consider part 4 because in this part subjects do not perform the task.
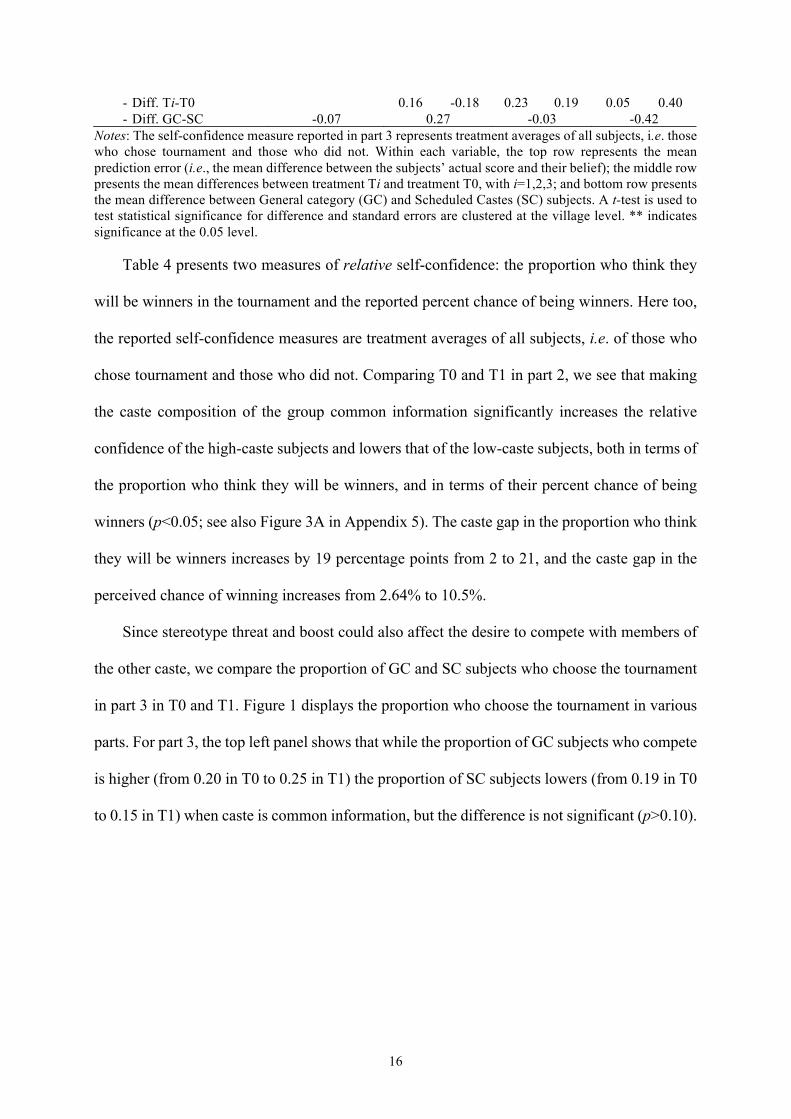
Notes: The self-confidence measure reported in part 3 represents treatment averages of all subjects, i.e. those who chose tournament and those who did not. Within each variable, the top row represents the mean prediction error (i.e., the mean difference between the subjects’ actual score and their belief); the middle row presents the mean differences between treatment Ti and treatment T0, with i=1,2,3; and bottom row presents the mean difference between General category (GC) and Scheduled Castes (SC) subjects. A t-test is used to test statistical significance for difference and standard errors are clustered at the village level. ** indicates significance at the 0.05 level.
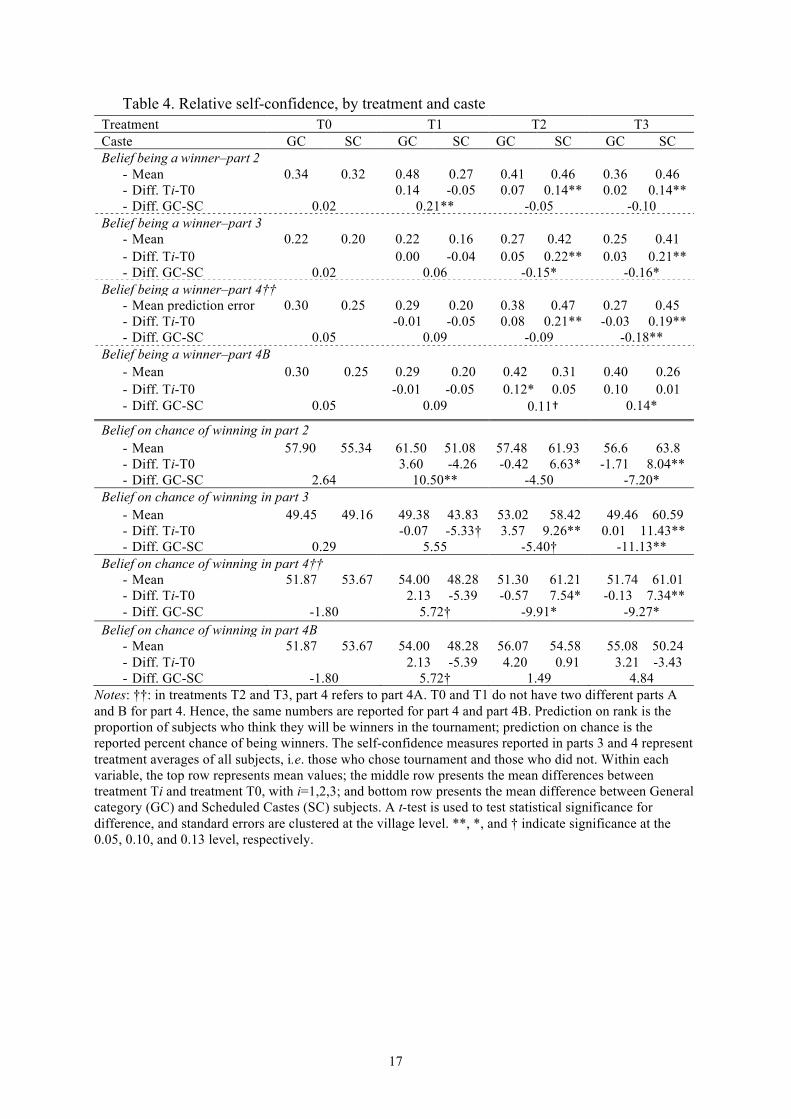
Table 4 presents two measures of relative self-confidence: the proportion who think they
will be winners in the tournament and the reported percent chance of being winners. Here too,
the reported self-confidence measures are treatment averages of all subjects, i.e. of those who
chose tournament and those who did not. Comparing T0 and T1 in part 2, we see that making
the caste composition of the group common information significantly increases the relative
confidence of the high-caste subjects and lowers that of the low-caste subjects, both in terms of
the proportion who think they will be winners, and in terms of their percent chance of being
winners (p<0.05; see also Figure 3A in Appendix 5). The caste gap in the proportion who think
they will be winners increases by 19 percentage points from 2 to 21, and the caste gap in the
perceived chance of winning increases from 2.64% to 10.5%.
Since stereotype threat and boost could also affect the desire to compete with members of
the other caste, we compare the proportion of GC and SC subjects who choose the tournament
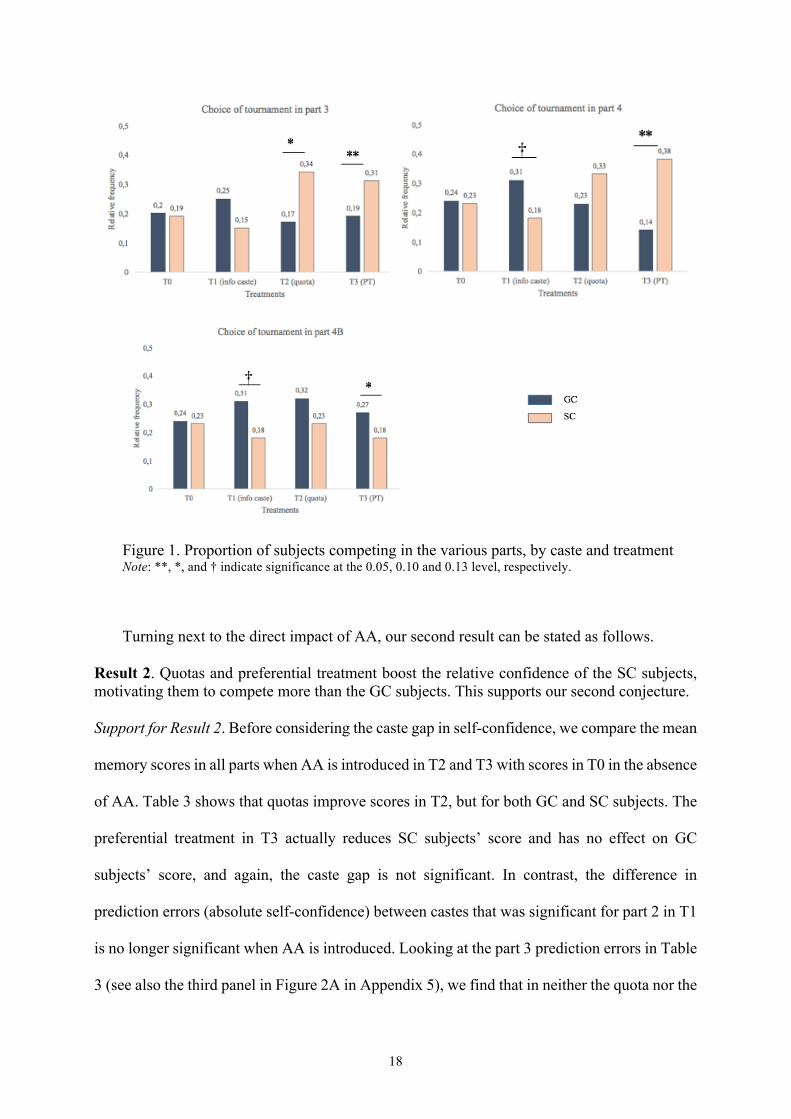
in part 3 in T0 and T1. Figure 1 displays the proportion who choose the tournament in various
parts. For part 3, the top left panel shows that while the proportion of GC subjects who compete
is higher (from 0.20 in T0 to 0.25 in T1) the proportion of SC subjects lowers (from 0.19 in T0
to 0.15 in T1) when caste is common information, but the difference is not significant (p>0.10).
17
Table 4. Relative self-confidence, by treatment and caste Treatment T0 T1 T2 T3 Caste GC SC GC SC GC SC GC SC Belief being a winner–part 2
Belief on chance of winning in part 2 - Mean 57.90 55.34 61.50 51.08 57.48 61.93 56.6 63.8 - Diff. Ti-T0 3.60 -4.26 -0.42 6.63* -1.71 8.04** - Diff. GC-SC 2.64 10.50** -4.50 -7.20*
Belief on chance of winning in part 3 - Mean 49.45 49.16 49.38 43.83 53.02 58.42 49.46 60.59 - Diff. Ti-T0 -0.07 -5.33† 3.57 9.26** 0.01 11.43** - Diff. GC-SC 0.29 5.55 -5.40† -11.13**
Belief on chance of winning in part 4†† - Mean 51.87 53.67 54.00 48.28 51.30 61.21 51.74 61.01 - Diff. Ti-T0 2.13 -5.39 -0.57 7.54* -0.13 7.34** - Diff. GC-SC -1.80 5.72† -9.91* -9.27*
Belief on chance of winning in part 4B - Mean 51.87 53.67 54.00 48.28 56.07 54.58 55.08 50.24 - Diff. Ti-T0 2.13 -5.39 4.20 0.91 3.21 -3.43 - Diff. GC-SC -1.80 5.72† 1.49 4.84
Notes: ††: in treatments T2 and T3, part 4 refers to part 4A. T0 and T1 do not have two different parts A and B for part 4. Hence, the same numbers are reported for part 4 and part 4B. Prediction on rank is the proportion of subjects who think they will be winners in the tournament; prediction on chance is the reported percent chance of being winners. The self-confidence measures reported in parts 3 and 4 represent treatment averages of all subjects, i.e. those who chose tournament and those who did not. Within each variable, the top row represents mean values; the middle row presents the mean differences between treatment Ti and treatment T0, with i=1,2,3; and bottom row presents the mean difference between General category (GC) and Scheduled Castes (SC) subjects. A t-test is used to test statistical significance for difference, and standard errors are clustered at the village level. **, *, and † indicate significance at the 0.05, 0.10, and 0.13 level, respectively.
18
Figure 1. Proportion of subjects competing in the various parts, by caste and treatment Note: **, *, and † indicate significance at the 0.05, 0.10 and 0.13 level, respectively.
Turning next to the direct impact of AA, our second result can be stated as follows.
Result 2. Quotas and preferential treatment boost the relative confidence of the SC subjects, motivating them to compete more than the GC subjects. This supports our second conjecture. Support for Result 2. Before considering the caste gap in self-confidence, we compare the mean
memory scores in all parts when AA is introduced in T2 and T3 with scores in T0 in the absence
of AA. Table 3 shows that quotas improve scores in T2, but for both GC and SC subjects. The
preferential treatment in T3 actually reduces SC subjects’ score and has no effect on GC
subjects’ score, and again, the caste gap is not significant. In contrast, the difference in
prediction errors (absolute self-confidence) between castes that was significant for part 2 in T1
is no longer significant when AA is introduced. Looking at the part 3 prediction errors in Table
3 (see also the third panel in Figure 2A in Appendix 5), we find that in neither the quota nor the
19
preferential treatment case is the absolute prediction error significantly different between GC
and SC subjects (t-test clustered, p>0.10).
In relative terms, Table 4 shows that introducing quotas or preferential treatment
significantly increases the proportion of the SC subjects who think they will be winners in part
2 (by 14 percentage points) and in part 3 (by 22 and 21 percentage points, respectively)
compared to T0 (see also the third panel in Figure 3A in Appendix 5). The caste gap is not
significant in part 2 but it is 15 and 16 percentage points, respectively, in favor of SC subjects
in part 3 (p<0.10) (regardless of the payment scheme chosen). Introducing AA significantly
increases the SC subjects’ perceived chance of winning in T2 and T3 in both parts 2 and 3. The
caste gap again is in favor of SC subjects by 4 and 7 percentage points in part 2 and by 5 and
11 percentage points in part 3 –only significant in T3.
As a result, Figure 1 shows that introducing quotas induces more SC individuals to enter
the tournament in part 3 compared to T0 (the proportion is 0.34 instead of 0.19, p=0.06), while
the proportion of GC subjects remains stable (0.17 vs. 0.20 in T0, p=0.76). The preferential
treatment also increases the entry rate of SC subjects to 0.31, but not significantly so (p=0.13);
the rate for GC subjects is stable at 0.19 (p=0.82). Therefore, the entry rate of the SC subjects
now exceeds significantly that of GC subjects: the caste gap is 17 percentage points in T2
(p=0.08) and 12 points in T3 (p=0.02) in favor of the SC subjects. The p-values correspond to
t-tests where standard errors are clustered at the village level. The above results hold for non-
parametric rank-sum tests.
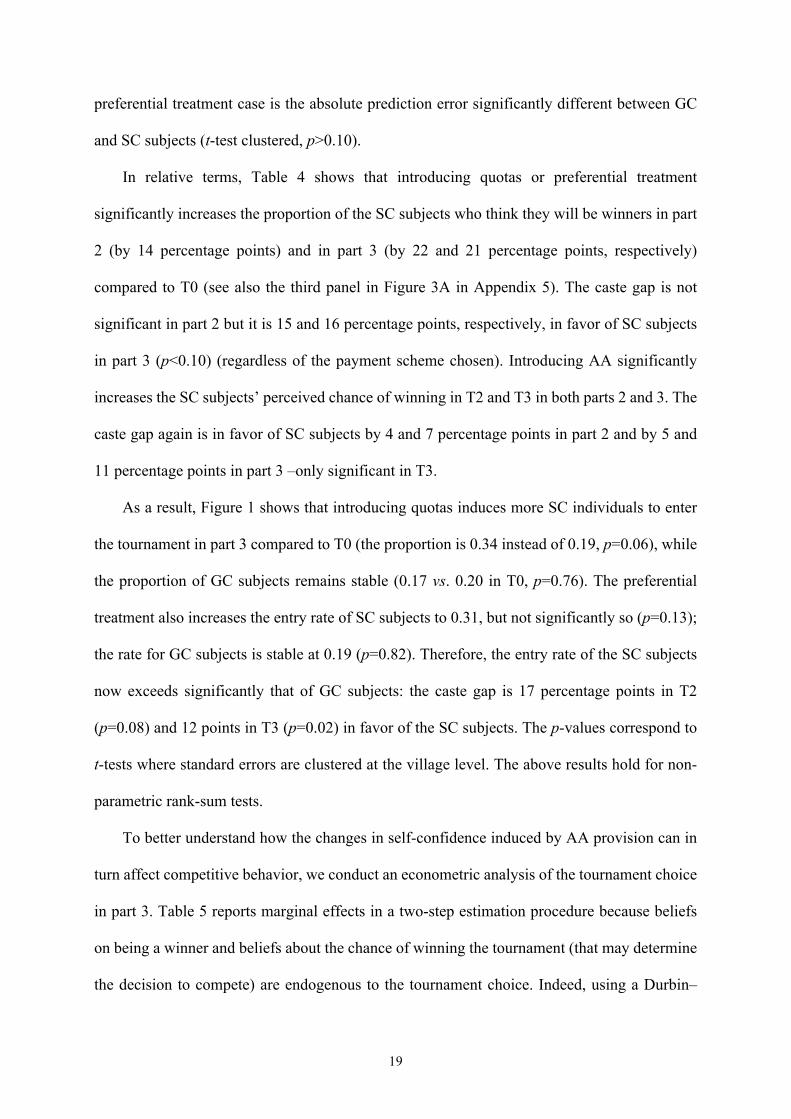
To better understand how the changes in self-confidence induced by AA provision can in
turn affect competitive behavior, we conduct an econometric analysis of the tournament choice
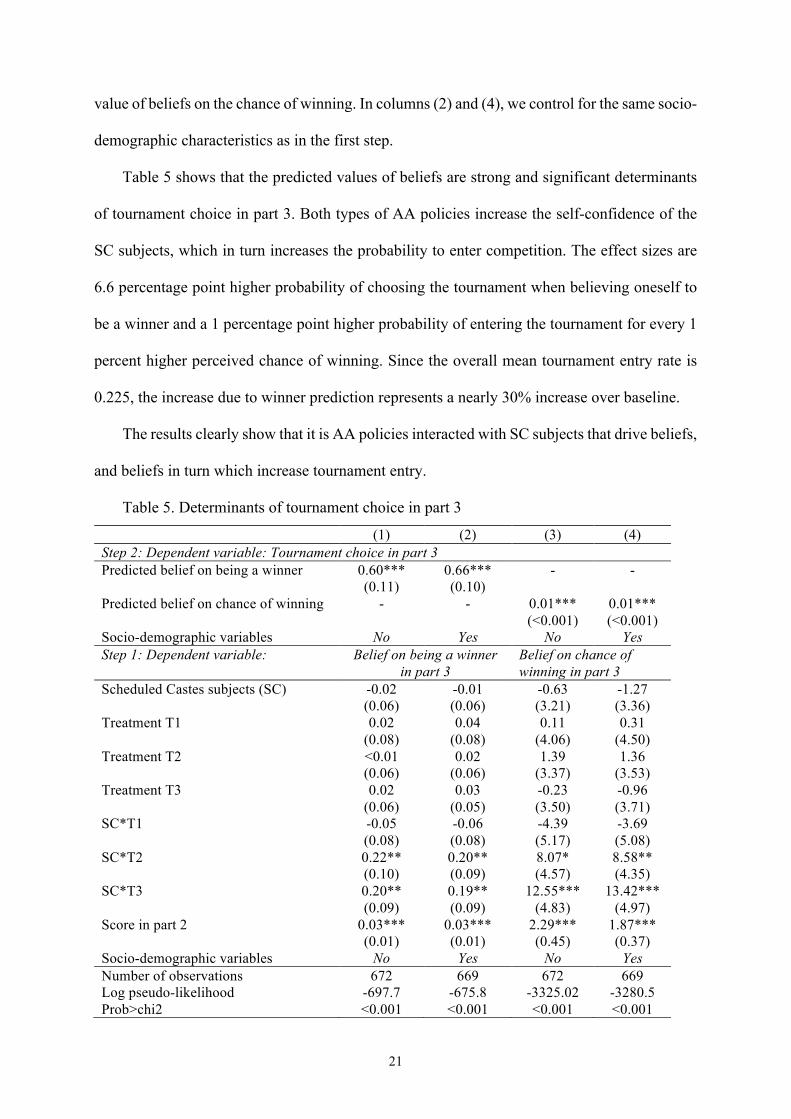
in part 3. Table 5 reports marginal effects in a two-step estimation procedure because beliefs
on being a winner and beliefs about the chance of winning the tournament (that may determine
the decision to compete) are endogenous to the tournament choice. Indeed, using a Durbin–
20
Wu–Hausman test leads us to reject the null hypothesis that both beliefs are exogenous (p<0.01
for both). Thus, in the first step we endogenize beliefs and in the second step we explain
tournament choice by the predicted value of beliefs, as measured in the first step.
In the first step (bottom part of Table 5), we estimate a linear probability model with robust
standard errors clustered at the village level. The dependent variable is the belief of being a
winner in part 3 tournament in columns (1) and (2), and the belief on the percent chance of
winning in columns (3) and (4). In columns (1) and (3), the independent variables include
belonging or not to the SC category, treatment dummies (with T0 as the reference category),
interaction terms between belonging to SC and each treatment, and the subject’s score in part
2 when tournament was compulsory.15 In addition, in columns (3) and (4) we control for socio-
We see that caste and treatments in themselves are not significantly related to beliefs.
However, in all columns, the AA treatment dummies (T2 and T3) interacted with caste (SC)
are significant predictors of beliefs at either the 1% or 5% level. Interestingly, effects sizes are
approximately the same in either case, although the impact of T3 is slightly stronger on the
percent chance of being a winner. SC in AA treatments are about 20 percentage points more
likely to believe that they will be winners and believe they have between 8-13% greater chance
of winning. The identifying assumption is that being SC and subject to AA treatments affect
residual competition only indirectly via beliefs on being a winner/chance of winning and not
directly. Therefore, in the second step the predicted values of beliefs in part 3 are entered as
regressors in the binary tournament choice model that we estimate using a probit model, again
with robust standard errors clustered at the village level. In column (1) the only independent
variable is the predicted value of beliefs of being a winner, and in column (3) the predicted
15 Although subjects do not receive any feedback on their score in part 2, they can form a belief about their performance by counting their number of recalls.
21
value of beliefs on the chance of winning. In columns (2) and (4), we control for the same socio-
demographic characteristics as in the first step.
Table 5 shows that the predicted values of beliefs are strong and significant determinants
of tournament choice in part 3. Both types of AA policies increase the self-confidence of the
SC subjects, which in turn increases the probability to enter competition. The effect sizes are
6.6 percentage point higher probability of choosing the tournament when believing oneself to
be a winner and a 1 percentage point higher probability of entering the tournament for every 1
percent higher perceived chance of winning. Since the overall mean tournament entry rate is
0.225, the increase due to winner prediction represents a nearly 30% increase over baseline.
The results clearly show that it is AA policies interacted with SC subjects that drive beliefs,
and beliefs in turn which increase tournament entry.
Table 5. Determinants of tournament choice in part 3
(1) (2) (3) (4) Step 2: Dependent variable: Tournament choice in part 3 Predicted belief on being a winner Predicted belief on chance of winning Socio-demographic variables
0.60*** (0.11)
-
No
0.66*** (0.10)
-
Yes
-
0.01*** (<0.001)
No
-
0.01*** (<0.001)
Yes Step 1: Dependent variable: Belief on being a winner
in part 3 Belief on chance of winning in part 3
Scheduled Castes subjects (SC) Treatment T1 Treatment T2 Treatment T3 SC*T1 SC*T2 SC*T3 Score in part 2 Socio-demographic variables
-0.02 (0.06) 0.02
(0.08) <0.01 (0.06) 0.02
(0.06) -0.05 (0.08) 0.22** (0.10) 0.20** (0.09)
0.03*** (0.01)
No
-0.01 (0.06) 0.04
(0.08) 0.02
(0.06) 0.03
(0.05) -0.06 (0.08) 0.20** (0.09) 0.19** (0.09)
0.03*** (0.01)
Yes
-0.63 (3.21) 0.11
(4.06) 1.39
(3.37) -0.23 (3.50) -4.39 (5.17) 8.07* (4.57)
12.55*** (4.83)
2.29*** (0.45)
No
-1.27 (3.36) 0.31
(4.50) 1.36
(3.53) -0.96 (3.71) -3.69 (5.08) 8.58** (4.35)
13.42*** (4.97)
1.87*** (0.37)
Yes Number of observations Log pseudo-likelihood Prob>chi2
672 -697.7 <0.001
669 -675.8 <0.001
672 -3325.02 <0.001
669 -3280.5 <0.001
22
Notes: Clustered standard errors at the village level are in parentheses. The four columns report marginal effects. In the first step estimation, the dependent variable in columns (1) and (2) is the belief that the subject will be among the winners in part 3; the dependent variable in columns (3) and (4) is the belief about the chance of winning in part 3. In the second step, a probit model estimates the probability to choose the tournament in part 3. ***, **, and * indicate significance at the 0.01, 0.05, and 0.1 level, respectively.
The spillover effects of AA on confidence and competitiveness
We summarize the spillover effects of AA on confidence and competitiveness as follows:
Result 3. The caste gap in confidence and competitiveness reverts as soon as the AA intervention is removed, showing no evidence of a spillover effect of AA on confidence and competitiveness. This does not support our third conjecture.
Support for Result 3. Considering all the subjects regardless of their payment scheme choice,
Table 4 shows that there is no spillover effects of the AA interventions on relative self-
confidence, when comparing beliefs in part 4B to beliefs in parts 3 and 4A.16 Remember that
in part 4A, subjects are given the choice of submitting their part 1 performance to tournaments
with AA or to a piece rate; in part 4B, subjects again are given the choice of submitting their
part 1 performance to tournament or piece rate, but now AA is removed. Table 4 shows that the
caste gap in the proportion of subjects who believe they will be winners is about the same in
part 4A and in part 3 when AA is available (in part 3, the proportion is 0.15 point higher for SC
than GC in T2 and 0.16 point in T3, both significant at the 10% level (t-test, clustered), and the
respective values in part 4A are 0.09 and 0.18, the second being significant at the 5% level). In
contrast, as soon as the intervention is removed, the caste gap in confidence reverts to the benefit
of the GC subjects: in part 4B, the proportion is 0.11 point higher for GC than SC in T2
(p=0.13), and 0.14 points higher in T3 (significant at the 10% level). Table 4 shows that the
evolution of beliefs is qualitatively similar if considering instead the reported percent chance
of being winners: while the SC subjects are significantly more confident in their chance of
winning the tournament than the GC subjects in parts 3 and 4A when they benefit from AA, the
16 We cannot consider absolute self-confidence here. Indeed, since part 4 does not involve any new task and refers back simply to part 1 score, the absolute self-confidence measure would be the same as that in part 1.
23
caste gap is reverted in part 4B to the statistically insignificant non AA level. Removing AA
policies lower perceptions about success to the part 4 level in T0, where caste is silent.
Regarding competitiveness, Figure 1 shows a substantial decrease in entry among the SC
subjects and a substantial increase among the GC subjects in part 4B compared to parts 3 and
4A. In T2, the entry rate of SC subjects is 0.34 in part 3, 0.33 in part 4A, but goes down to 0.23
when quotas are removed (Wilcoxon signed rank test, W hereafter, p=0.05 and 0.05 when part
3 and part 4A are compared to part 4B, respectively); the respective values for the GC subjects
are 0.17, 0.23 and 0.32 (W test, p=0.02 and 0.14 when part 3 and part 4A are compared to part
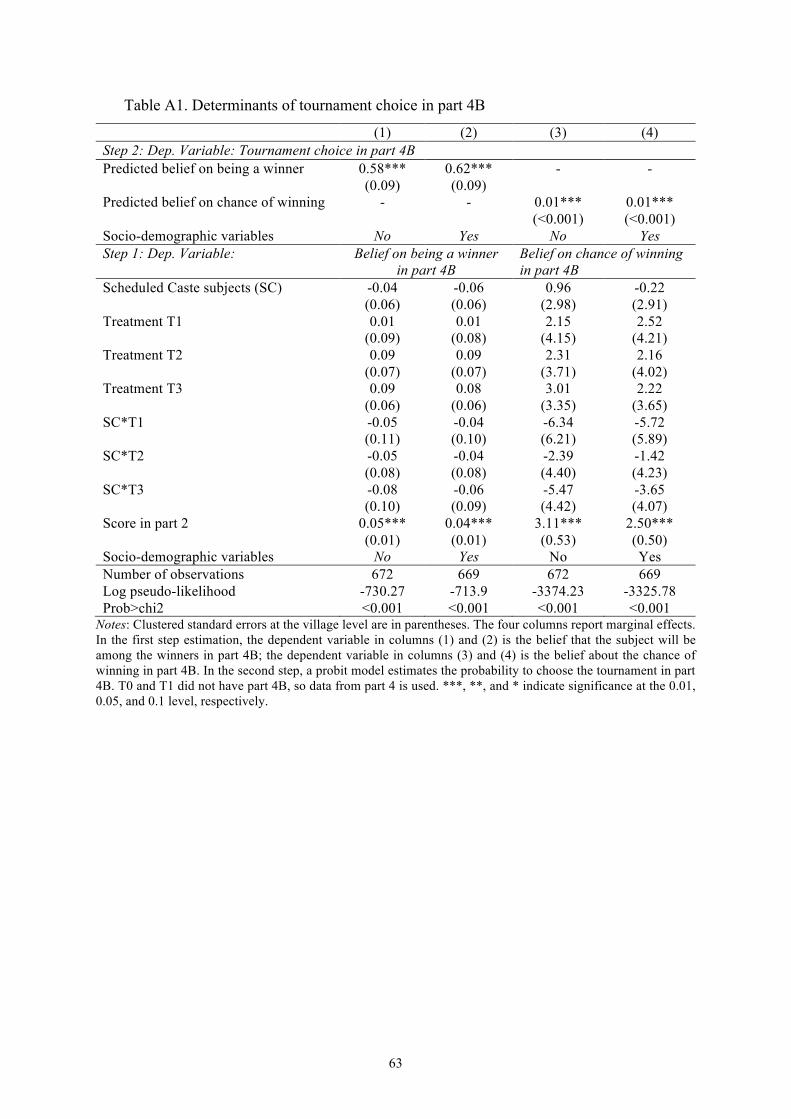
4B, respectively). In T3, the entry rate of SC subjects is 0.31 in part 3, 0.38 in part 4A, and
decreases to 0.18 when the preferential treatment is removed (W test, p=0.02 and <0.01 when
part 3 and part 4A are compared to part 4B, respectively); the respective values for the GC
subjects are 0.19, 0.14 and 0.27 (W test, p=0.10 and <0.01 when part 3 and part 4A are
compared to part 4B, respectively).17 As a result, the caste gap that had previously opened in
favor of the SC subjects under AA is now closed or even reversed.
3.2. The spillover effects of AA on unethical behavior and the bias against out-groups
We now explore whether introducing AA affects the willingness of individuals to hurt a subject
from the other caste. Indeed, because of AA some GC subjects may fear losing the tournament
although they were among the top two performers. Subjects do not receive any feedback on the
outcome of the tournament before the end of the session, but if they anticipate being
downgraded because of AA, they may be willing to cheat in the last part of the experiment to
compensate for this possible loss, especially when they are matched with a subject from the
protected caste and that payoffs are unaligned.18 Our last result can be summarized as follows:
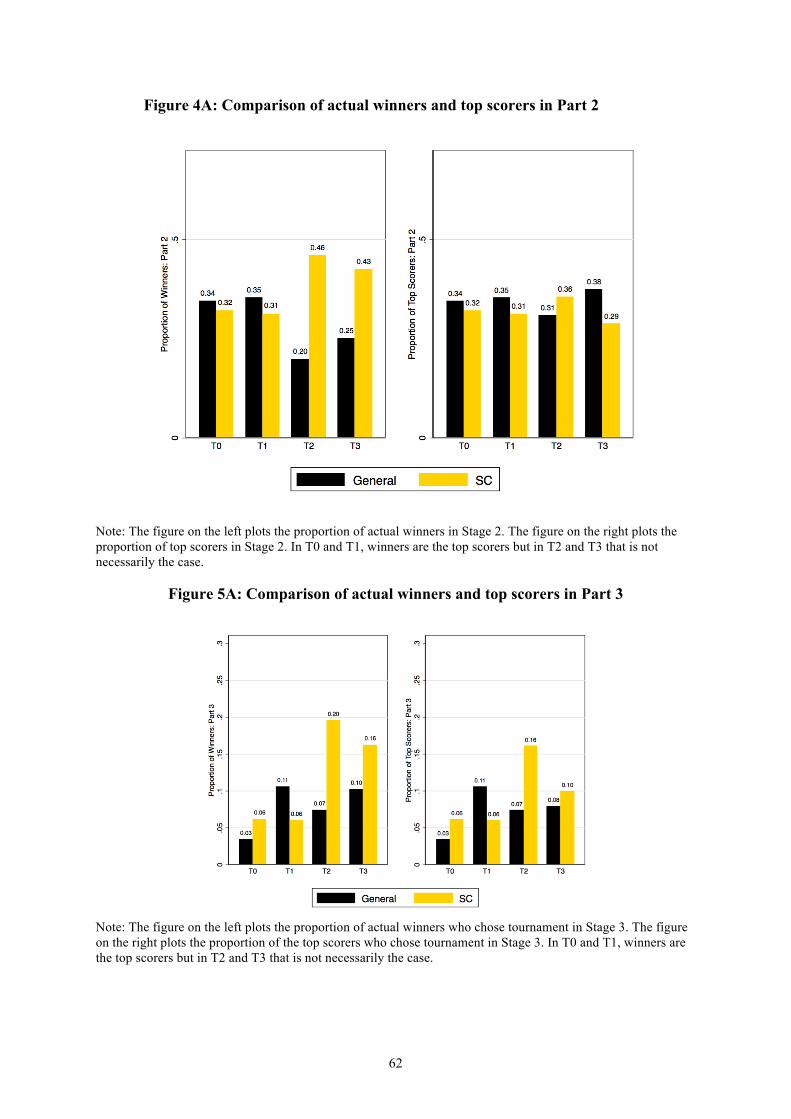
17 We conducted a similar two-step regression analysis as in Table 5 to explain the determinants of the tournament choice in part 4B when AA is removed. The results are reported in Table A1 in Appendix 5. They show that the predicted values of beliefs are still strong and significant predictors of tournament choice like in part 3, but in contrast to part 3, beliefs are no longer explained by the treatment, as the treatment variables are all non-significant. 18 In part 2, when tournament is compulsory, the rate of winners among GC subjects in T2 is 0.20 whereas the rate of top performers among GC subjects is 0.31; in T3, these rates are 0.25 and 0.38, respectively (see Figure
24
Result 4. AA interventions do not increase misreporting among the members of any caste. They do not generate the strong bias that the GC subjects hold against their out-groups from the protected caste, although they tend to increase it. This does not fully support our fourth conjecture.
Support for Result 4. We compare the outcomes of the die roll task across treatments and
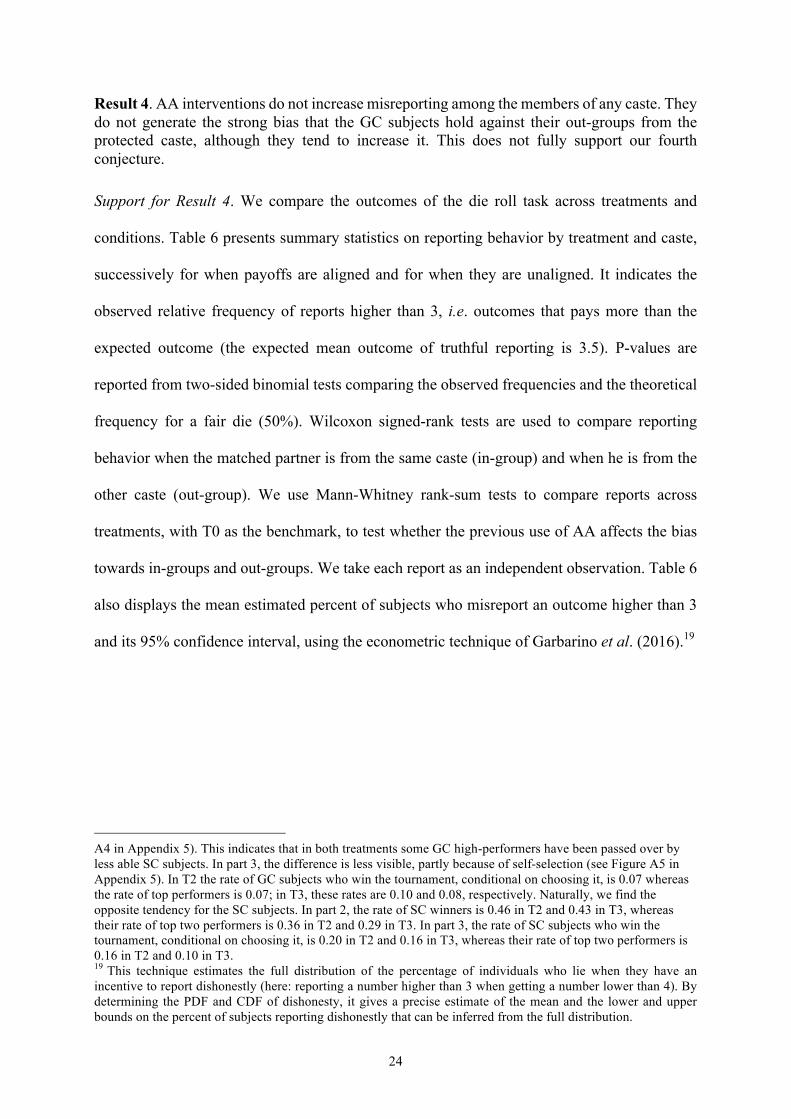
conditions. Table 6 presents summary statistics on reporting behavior by treatment and caste,
successively for when payoffs are aligned and for when they are unaligned. It indicates the
observed relative frequency of reports higher than 3, i.e. outcomes that pays more than the
expected outcome (the expected mean outcome of truthful reporting is 3.5). P-values are
reported from two-sided binomial tests comparing the observed frequencies and the theoretical
frequency for a fair die (50%). Wilcoxon signed-rank tests are used to compare reporting
behavior when the matched partner is from the same caste (in-group) and when he is from the
other caste (out-group). We use Mann-Whitney rank-sum tests to compare reports across
treatments, with T0 as the benchmark, to test whether the previous use of AA affects the bias
towards in-groups and out-groups. We take each report as an independent observation. Table 6
also displays the mean estimated percent of subjects who misreport an outcome higher than 3
and its 95% confidence interval, using the econometric technique of Garbarino et al. (2016).19
A4 in Appendix 5). This indicates that in both treatments some GC high-performers have been passed over by less able SC subjects. In part 3, the difference is less visible, partly because of self-selection (see Figure A5 in Appendix 5). In T2 the rate of GC subjects who win the tournament, conditional on choosing it, is 0.07 whereas the rate of top performers is 0.07; in T3, these rates are 0.10 and 0.08, respectively. Naturally, we find the opposite tendency for the SC subjects. In part 2, the rate of SC winners is 0.46 in T2 and 0.43 in T3, whereas their rate of top two performers is 0.36 in T2 and 0.29 in T3. In part 3, the rate of SC subjects who win the tournament, conditional on choosing it, is 0.20 in T2 and 0.16 in T3, whereas their rate of top two performers is 0.16 in T2 and 0.10 in T3. 19 This technique estimates the full distribution of the percentage of individuals who lie when they have an incentive to report dishonestly (here: reporting a number higher than 3 when getting a number lower than 4). By determining the PDF and CDF of dishonesty, it gives a precise estimate of the mean and the lower and upper bounds on the percent of subjects reporting dishonestly that can be inferred from the full distribution.
25
Table 6. Summary statistics on lying in the die rolling task
Treatments T0 T1 T2 T3 Caste GC SC GC SC GC SC GC SC ALIGNED PAYOFFS
Percent of reports>3 - Same caste partner - Other caste partner
Number of observations
77.38*** 77.38*** 84 84
83.72*** 80.49*** 65.12* 73.17*** 43 41
73.17*** 88.37*** 53.66 81.40*** 41 43
84.21***76.47*** 57.89 73.53*** 38 34
Comparison same/ other caste (p-values)
-
-
0.032
0.439
0.039
0.317
0.04
0.763
Comparison Ti-T0 (p-values) - Same caste partner - Other caste partner
Ref.
Ref.
0.546 0.265
0.472 0.402
0.750 0.032
0.088 0.959
0.521 0.083
0.791 0.443
Mean percent lying (CI) - Same caste partner - Other caste partner
54.20 (43-63)
54.20 (43-63)
66.63 (55-75) 29.15 (8-47)
59.95 (46-71) 44.97 (25-60)
44.97 (25-60) 12.50 (0-31)
76.16 (68-82) 61.86 (48-72)
67.52 (55-76) 17.67 (0-38)
51.44 (32-65) 45.44 (24-61)
UNALIGNED PAYOFFS Number reports>3 (%)
- Same caste partner - Other caste partner
Number of observ.
68.89*** 66.67** 90 78
57.14 57.14 73.81*** 66.67** 42 42
60.0 56.82 77.5*** 59.09 40 44
60.0 80.0*** 50
63.04 60.81
46 Comparison same/ other caste (p-values)
-
-
0.144
0.346
0.089
0.818
0.050
0.818
Comparison Ti-T0 (p-values) - Same caste partner - Other caste partner
Ref.
Ref.
0.176 0.470
0.263 0.810
0.284 0.271
0.246 0.642
0.259 0.143
0.551 0.761
Mean percent lying (CI) - Same caste partner - Other caste partner
37.07 (23-49)
32.48 (16-46)
16.44 (0-36) 46.30 (27-60)
16.44 (0-36) 32.07 (10-50)
20.55 (0-40) 53.79 (37-66)
15.91 (0-35) 19.03 (0-38)
20.21 (0-38) 59.15 (46-69)
25.39 (0-44) 21.71 (0-40)
Note: In T0, there is no information on partner’s caste identity. Thus, we pool the data from the two die rolls. Regarding the number of reports higher than 3, ***, **, and * indicate significance at the 0.1, 0.05 and 0.001 levels, respectively, from binomial tests comparing each frequency with the expected value of 50%. The p-values for the comparisons same/other caste come from Wilcoxon signed-rank tests. Those for the comparisons Ti-T0, with i=1,2,3, are from Mann-Whitney tests. For the mean percent lying statistics, the data in parentheses represent the confidence interval, i.e. the minimum and the maximum estimated percent of subjects lying.
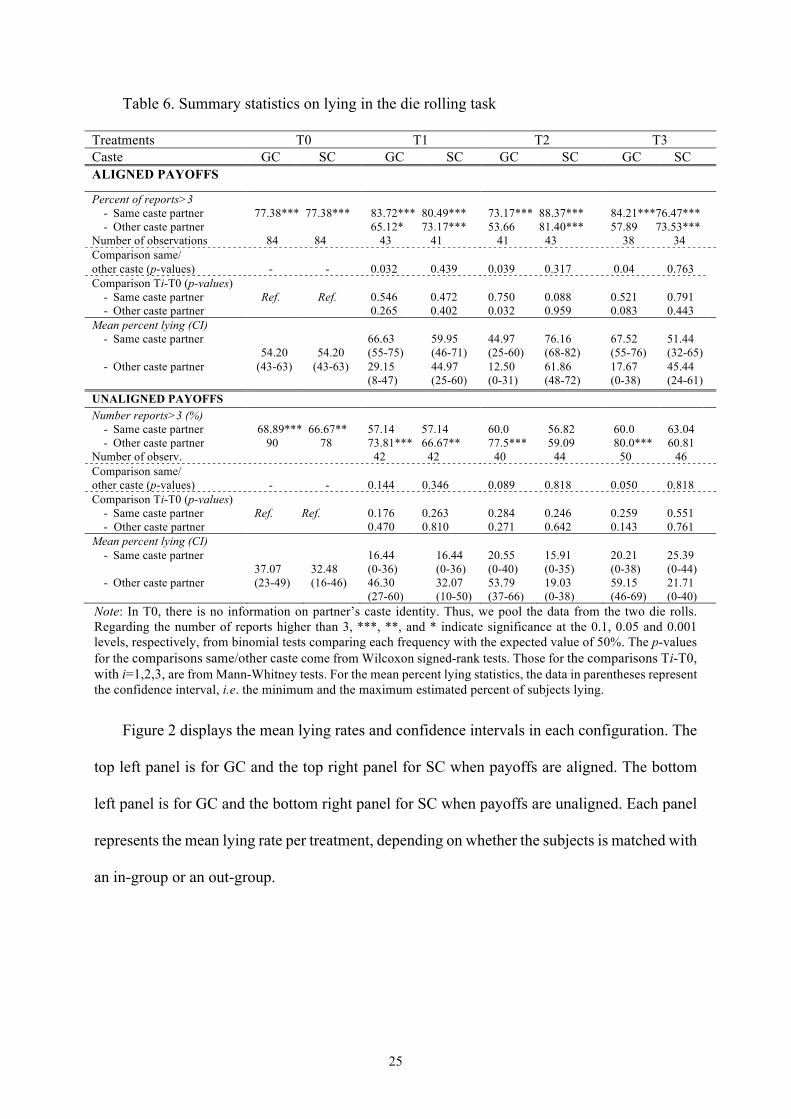
Figure 2 displays the mean lying rates and confidence intervals in each configuration. The
top left panel is for GC and the top right panel for SC when payoffs are aligned. The bottom
left panel is for GC and the bottom right panel for SC when payoffs are unaligned. Each panel
represents the mean lying rate per treatment, depending on whether the subjects is matched with
an in-group or an out-group.
26
General Category, aligned payoffs Scheduled Caste, aligned payoffs
General Category, unaligned payoffs Scheduled Caste, unaligned payoffs
Matched subject from the same caste Matched subject from the other caste
Figure 2: Mean lying rates and confidence intervals, by caste, partner’s caste, condition and treatment
Table 6 shows evidence of widespread lying when payoffs are aligned, as in all treatments
subjects report high payoff outcomes significantly more often than the expected 50%. In the
absence of caste identity (T0), subjects tend to lie less when payoffs are unaligned than when
they are aligned, suggesting that a fraction of people who accept Pareto white lies are not willing
to tell black lies (there is very little overlapping between the CI). Strikingly, when caste identity
is introduced Table 6 and Figure 5 show a very different pattern between GC and SC subjects.
All categories tend to lie more (less) when it benefits (harms, respectively) an in-group rather
than an out-group. But while the difference is never significant for the SC subjects, the
difference is highly significant in most cases (no overlapping between the CI) for the GC
27
subjects who express a strong bias against the SC subjects. Comparing figures in the top left
and the bottom left panels, we can see that many GC subjects refrain from lying when
misreporting also benefits a SC subject: they prefer foregoing a gain to avoid helping someone
from the other caste. When lying harms a SC subject, GC players lie almost as much as when
the lie benefits an in-group: increasing one’s payoff by lying when it harms an out-group
generates as much utility as when it helps an in-group. Comparing the top right and bottom
right panels reveals that in contrast to GC subjects, SC subjects discriminate little between
castes and they tell less black lies than Pareto-white lies.
How do AA interventions impact this behavior? They do not increase lying and the bias
against out-groups exists even in their absence (i.e., in T1), especially for the GC subjects.
However, for these GC subjects it seems to increase slightly with the Preferential Treatment,
while one can discern a movement in the opposite direction for the protected caste. Indeed,
when payoffs are aligned the gap in the GC subjects’ mean lying rate according to the partner’s
caste is 37.48 percentage points in T1, 32.47 in T2 (with quotas) and 49.85 in T3 (with
Preferential Treatment) (respectively 14.98, 14.3 and 6 for SC subjects). Moreover, the GC
subjects tend to lie less under AA than without when a higher report also benefits a member
from the protected caste. When payoffs are unaligned, the gap in the GC subjects’ mean lying
rate is 29.86 percentage points in T1, 33.24 in T2 and 38.94 in T3 (respectively 15.7, 3.12 and
3.68 for SC subjects). Finally, the GC subjects tend to lie more under AA when a higher report
harms a member from the protected caste. This confirms that if AA interventions do not boost
dishonesty and do not generate the bias against the members of the protected caste, they
somewhat tend to increase it.
28
4. Discussion and conclusion
We conducted an artefactual field experiment to examine the potential spillover effects of
Affirmative Action policies (quotas and preferential treatment) in the context of castes in India.
We first examined whether individuals who had previously benefitted from AA protection
would have developed a sufficient taste for competition and confidence in their own abilities
that led them to continue to compete even after the AA policies were removed. Second, we
explored whether being exposed to AA policies affects individuals’ ethical behavior. In
particular, we tested whether behavior is conditioned on being matched with in-groups vs. out-
groups when reporting affects not only one’s payoff but also the payoff of another individual.
Finally, we studied whether reporting differs between subjects from the dominant category and
individuals belonging to the category benefiting from the AA interventions.
We find that our AA interventions have an immediate impact on the individuals’ relative
self-confidence. By increasing the optimism of the beneficiary category regarding their ability
to win the tournament and their chance to win, they boost quite substantially its willingness to
compete. This result points to the importance of retaining AA policies for the purpose of
fostering self-confidence and a desire to compete among the traditionally deprived castes in
India. However, we find very limited spillover effects of AA interventions on further
confidence and competitiveness. Indeed, as soon as the policies are removed, the caste gap in
confidence and competitiveness reverts, revealing a very short-term effect of our interventions
on self-onfidence. As regards the spillovers of these policies on (un)ethical behavior and harm
against the members from the protected caste, we show that they are also limited. Overall, the
AA interventions do not increase cheating and the strong bias of the members of the upper caste
against the protected caste preexists to these interventions. However, if AA interventions do
not generate this bias, the preferential treatment tends to increase it.
29
Our results regarding the absence of spillovers of AA interventions on competitiveness
should be appreciated in the view that in our population, the gap in competitiveness was not
significant in the treatments without our AA interventions. Although this gap was not
significant, we have found, however, that as soon as the caste composition of the group was
made public, the competitiveness of the upper caste increased while that of the lower caste
decreased. Significant deficits appeared both in absolute and relative confidence of the subjects
from the protected caste relative to those from the high caste. It would be interesting, though,
to replicate our study in other locations to test whether our results hold when there is a larger
initial gap in competitiveness. Another possible extension would be to increase the duration of
the experiment to see whether spillovers are more likely to emerge when subjects have
benefited from AA for a longer period of time before the intervention is removed.
Finally, our results on the spillover effects of AA on misreporting and the bias against out-
groups from the protected caste are consistent with previous studies showing the strong and
durable segmentation of the Indian society. This suggests exploring more directly how these
types of measures could evolve to contribute to a better integration of the different groups. This
is left for further investigation.
30
References
Abeler, Johannes; Nosenzo, Daniele; Raymond, Collin (2016). Preferences for truth-telling. IZA Discussion Paper, 10188, Bonn.
Ahern, Kenneth R.; Dittmar, Amy K. (2012). The changing of the boards: the impact on firm valuation of female board representation. The Quarterly Journal of Economics, 127 (1):137-197.
Akerlof, George A.; Kranton, Rachel E. (2000). Economics and Identity. Quarterly Journal of Economics, 115 (3): 715-53.
Ambrose, Maureen L.; Seabright, Mark A.; Schminke, Marshall (2002). Sabotage in the workplace: The role of organizational injustice. Organizational Behavior and Human Decision Processes, 89(1), 947-965.
Balafoutas, Loukas; Sutter, Matthias (2012). Affirmative Action Policies Promote Women and Do Not Harm Efficiency in the Laboratory. Science 335(6068):579-582.
Beaman, Lori; Chattopadhyay, Raghabendra; Duflo, Esther; Pande, Rohini; Topalova, Petia (2009). Powerful women: female leadership and gender bias. The Quarterly Journal of Economics, 124(4): 1497-1540.
Beilock, Sian L.; Rydell, Robert J.; McConnell, Allen R. (2007). Stereotype threat and working memory: Mechanisms, alleviation, and spillover. Journal of Experimental Psychology 136(2): 256–276.
Bertrand Marianne; Black, Sandra E.; Jensen Sissel; Lleras-Muney, Adriana (2014). Breaking the glass ceiling? The effect of board quotas on female labor market outcomes in Norway. NBER Working Paper No. 20256.
Besley, Timothy; Pande, Rohini; Rahman, Lupin; Rao, Vijayendra (2004). The politics of public good provision: evidence from Indian local governments. Journal of the European Economic Association Papers and Proceedings: 2 (2–3).
Cadsby, C. Bram; Du, Ninghua; Song, Fei (2016). In-group favoritism and moral decision-making. Journal of Economic Behavior & Organization, 128: 59-71.
Chen, Yan; Li, Sherry Xin (2006). Group Identity and Social Preferences. American Economic Review, 99 (1): 431-457.
Datta Gupta, Nabanita; Poulsen, Anders; Villeval, Marie Claire (2013). Gender and Competitiveness. Experimental Evidence. Economic Inquiry, 51 (1): 816–835.
Deshpande, Ashwani (2011). The Grammar of Caste: Economic Discrimination in Contemporary India. Oxford: Oxford University Press.
de Zwart, Frank (July 2000). The Logic of Affirmative Action: Caste, Class and Quotas in India. Acta Sociologica, 43 (3): 235–249.
Dimant, Eugen (2016). On peer effects: behavioral contagion of (un)ethical behavior and the role of social identity. University of Pennsylvania and Harvard University, mimeo.
Duflo, Esther (2005). Why political reservations? Journal of the European Economic Association, 3 (2–3): 668–678.
Erat, Sanjiv; Gneezy, Uri (2012). White lies. Management Science. 58 (4): 723-733.
European Commission (2015). Gender balance on corporate boards. October.
31
Fehr, Ernst; Hoff, Karla; Kshetramade, Mayuresh (2008). Spite and Development. The American Economic Review Papers and Proceedings, 98 (2): 494-499.
Fehr, Ernst; Hoff, Karla (2011). Introduction: tastes, castes and culture: the influence of society on preferences. The Economic Journal, 121 (November): F396-F412.
Fischbacher, Urs; Föllmi-Heusi, Franziska (2013). Lies in disguise: An experimental study on cheating. Journal of the European Economic Association 11 (3): 525–547.
Fréchette, Guillaume R.; Schotter, Andrew (Eds.) (2015). Handbook of Experimental Economic Methodology. Oxford: Oxford University Press. 477 p.
Fryer, Roland G. Jr.; Lowry, Glenn C. (2005). Affirmative Action and its Mythology. Journal of Economic Perspectives, 19(3): 147-162.
Garbarino, Ellen; Slonim, Robert; Villeval, Marie Claire (2016). Loss Aversion and lying behavior: Theory, estimation and empirical evidence. GATE Working Paper 2016-31.
Gino, Francesca; Ayal, Shahar ; Ariely, Dan (2009). Contagion and Differentiation in Unethical Behavior: The Effect of One Bad Apple on the Barrel. Psychological Science, 20(3): 393-398.
Gneezy, Uri; Potters, Jan (1997). An experiment on risk taking and evaluation periods. The Quarterly Journal of Economics, 112 (2): 631-645.
Gneezy, Uri; Niederle, Muriel; Rustichini, Aldo, (2003). Performance in Competitive Environments: Gender Differences. The Quarterly Journal of Economics: 1049-1074.
Harrison, Glenn W.; List, John A. (2004). Field experiments. Journal of Economic Literature: 1009-1055.
Hoff, Karla; Pandey, Priyanka (2006). Discrimination, social identity, and durable inequalities. American Economic Review. Papers & Proceedings, 96(2): 206–211.
Hoff, Karla; Kshetramade, Mayuresh; Fehr, Ernst (2011). Caste and punishment: the legacy of caste culture in norm enforcement. The Economic Journal, 121 (November): F449-475.
Hoff, Karla; Pandey, Priyanka (2014). Making up people—The effect of identity on performance in a modernizing society. Journal of Development Economics, 106:118-131.
Holzer, Harry J.; Neumark, David (2000). Assessing affirmative action. Journal of Economic Literature, 38(3): 483–568.
Jiang, Ting (2015). Other-regarding Preferences and Other-regarding Cheating – Experimental Evidence from China, Italy, Japan and the Netherlands. Mimeo.
Leibbrandt, Andreas; Wang, Liang Choon; Foo, Cordelia (2015). Gender quotas, competitions, and peer review: Experimental evidence on the backlash against women. Mimeo.
Möbius, Markus M.; Niederle, Muriel; Niehaus, Paul, Rosenblat, Tanya S. (2011). Managing self-confidence: Theory and experimental evidence., National Bureau of Economic Research Working Paper No.17014.
Niederle, Muriel; Vesterlund, Lise, (2007). Do Women Shy Away from Competition? Do Men Compete Too Much? The Quarterly Journal of Economics, 122(3): 1067-1101.
Niederle, Muriel; Segal, Carmit; Vesterlund, Lise (2013) How Costly Is Diversity? Affirmative Action in Light of Gender Differences in Competitiveness. Management Science 59(1):1-16.
OECD (2012). Closing the Gender Gap. Paris: OECD Publishing.
32
Pande, Rohini (2003). Can mandated political representation increase policy influence for disadvantaged minorities? Theory and evidence from India. American Economic Review, 93(4): 1132–1151.
Piff, Paul K.; Stancato, Daniel M., Côté, Stéphane; Mendoza-Denton, Rodolpho; Keltner, Dacher (2012). Higher social class predicts increased unethical behavior. Proceedings of the National Academy of Sciences of the USA, 109(11): 4086-4091.
Shalvi, Shaul; Dana, Jason; Handgraaf, Michel J.J.; De Dreu, Carsten K.W. (2011). Justified ethicality: observing desired counterfactuals modifies ethical perceptions and behavior. Organizational Behavior and Human Decision Processes, 115: 181–190.
Schurr, Amos; Ritov, Ilana (2016). Winning a competition predicts dishonest behavior. Proceedings of the National Academy of Sciences of the USA, 113(7): 1754-1759.
Shih, Margaret J.; Pittinsky, Todd L.; Ho, Geoffrey C. (2011). Stereotype Boost: Positive Outcomes from the Activation of Positive Stereotypes, in Inzlicht, Michael; Schmader, Toni, Stereotype Threat: Theory, Process, and Application. New York: Oxford University Press, 141-143.
Siddique, Zahra (2011). Evidence on caste based discrimination. Labour Economics, 18, Supplement 1 (0): S146-S159.
Steele, Claude M.; Aronson, Joshua (1995). Stereotype threat and the intellectual test performance of African Americans. Journal of Personality and Social Psychology, 69(5): 797-811.
Thorat, Sukhadeo; Attewell, Paul (2010). The Legacy of Social Exclusion: A Correspondence Study of Job Discrimination in India’s Urban Private Sector,” in Blocked by Caste: Economic Discrimination in Thorat, Sukhadeo, and Newman, Katherine S. (eds.), Modern India. Oxford: Oxford University Press: 35-51.
33
Appendix 1. Instructions for all treatments
Introduction (Common for all)
Welcome!
Thank you all for taking the time to come today. Today’s session will take less than two hours. Before we begin, I want to make some general comments about what we are doing here today and explain the rules that you must follow.
You have each received an anonymous identification number. At some point, you will interact with other participants: you will never know their identity or their choices. Similarly, the other participants will never know your identity and your choices. All your choices and responses are anonymous.
The session consists of several tasks. At the end of the session, one of these tasks will be randomly selected to determine your earnings in this experiment. Therefore, each task may count for determining your earnings. The method we use to determine your earnings varies across tasks. Before each task we will describe in detail how your payment is determined.
Whatever money you earn in the session will be yours to keep and take home. In addition to the money you earn in the session, we will pay you Rs. 100 for your participation today. Your earnings will be paid to you in cash and in private at the end of the session.
At the end of the session, you will have to fill out a questionnaire with a list of simple questions. We are about to begin the first task. It is important that you listen as carefully as possible. We will distribute the instructions for the following task at the end of this first part.
If you have any question, please raise your hand and we will answer your questions in private. Please do not ask questions to the other participants or talk about the game with them at any point during today’s session. This is very important. Please be sure that you obey this rule.
Instruction for Baseline Treatment (T0)
We will describe below the instructions for Task 1. We will distribute the instructions for the following task at the end of this task.
Task 1. Piece rate [Common for T0, T1, T2 and T3]
For Task 1, you will be asked to memorize and report numbers and then, we will ask you some questions.
We will dictate fifteen numbers between 1 and 100. Each number will be dictated twice. After the completion of the dictation, you will be asked to recall as many numbers as you can and then write them down on the response sheet provided to you within 3 minutes. You do not have to write the numbers down in the order in which they were dictated. Just write down as many numbers as you can recall.
Note that you are not allowed to write anything while the dictation is going on; otherwise you will be excluded from the session. This is an individual task, so it is not permitted to discuss the numbers with any of the other participants. Doing so will also lead to exclusion from the session. So you should listen carefully what the numbers are, memorize them and then reproduce as many of these numbers as you can on the response sheet. You cannot write more than 15 numbers (any number that would be reported after the 15th one would not be considered).
We will now play a practice round of this task with only 5 numbers. You will not earn anything from this practice round but please follow the instructions carefully.
--Practice: please listen to the 5 numbers and report them on your reporting sheet--
If Task 1 is the one randomly selected for payment, then you get Rs.10 per number you recall correctly in the 3 minutes. For example, if you recall correctly 2 numbers, you will earn 2 x 10 = Rs. 20; if you recall 10 numbers, you will earn 10 x 10 = Rs. 100. Your payment does not decrease if you report an incorrect number.
34
We refer to this payment as the piece rate payment. If you have any question, please raise your hand and we will answer your question in private.
--Task 1 will start now. Please listen to the dictated numbers carefully and do not write anything before you are invited to do so. --
-- Now, please write down as many of the dictated numbers as you can recall in the next 3 minutes. --
-- Three minutes are over. Please stop writing immediately. --
Question 1.1
-- Please indicate on your reporting sheet in the box in front of “Question 1.1” how many numbers out of those you have reported you think you have correctly recalled. If this task is selected for payment, you will receive an additional Rs. 50 if your prediction matches your actual score. --
Task 2. Tournament
As in Task 1, after listening to a series of 15 dictated numbers, you will be given 3 minutes to write down as many recalled numbers as possible (in the limit of 15). However, for this task your payment depends on your performance relative to that of a group of other participants. Each group consists of six people. Thus, you are in a group with five other people present in this session. You will not know who the five other people in your group are. The composition of your group of six remains the same until you are no longer in a group of six. If Task 2 is the one randomly selected for payment, then your earnings depend on your number of correct recalls compared to that of the five other people in your group. The two group members who correctly recall the most numbers are the winners. They will receive Rs. 30 each per correct recall, while the four other group members receive no payment. So if you are among the two top performers, then you will earn Rs. 30 for each correct number that you recall in this task You will not be informed of how you did in the tournament relative to others until all four tasks have been completed. If there are ties the winner will be randomly determined. We refer to this as the tournament payment. If you have any question, please raise your hand and we will answer your question in private.
--Task 2 will start now. Please listen to the dictated numbers carefully and do not write anything before you are invited to do so. --
-- Now, please write down as many of the dictated numbers as you can recall in the next 3 minutes. --
-- Three minutes are over. Please stop writing immediately. --
Question 2.1. Please indicate on your reporting sheet in the box in front of “Question 2.1” how many numbers out those you have reported you think you have correctly recalled. If this task is selected for payment, you will receive an additional Rs. 50 if your prediction matches your actual score.
Question 2.2. Please indicate on your reporting sheet in the box in front of “Question 2.2” which rank, between 1 and 6 you think you have got in Task 2, compared to the five other group members. A rank of 1 means you think you got the highest number of correct recalls in the group and rank 6 means you think you got the lowest number of correct recalls in the group and similar for ranks between 1 and 6. If this task is selected for payment, you will receive an additional Rs.50 if your guess is correct. – Question 2.3. Please indicate on your reporting sheet in the box in front of “Question 2.3” what is the chance that you will be among the top two scorers in your group of six in this Task. Please indicate any number between 0 and 100, with 0 if you are absolutely sure you are not among the top two scorers in
35
your group of six, 100 if you are absolutely sure that you are among the top two scorers, and some number in between 0 and 100 depending on how sure you are of being among the top two scorers. The higher this number, the more confident you are in being among the top two scorers. You will receive a maximum bonus of Rs.50 and a minimum bonus of 0 for answering this question. The more truthful you are in your report, the higher the bonus will be. In other words, your best interest is in truthfully reporting what you think your chances of being among the top two are. If you are interested in knowing how your bonus is calculated, ask us after the study is over.
Task 3. Choice
As in the previous two tasks, after listening to a series of 15 dictated numbers, you will be given 3 minutes to write down as many recalled numbers as possible. However, before that, you will get to choose which of the two previous payment modes you prefer to apply to your performance in Task 3. You can either choose to be paid according to the piece rate, or according to the tournament.
If Task 3 is randomly selected for payment, then your earnings for this task are determined as follows.
- If you choose the piece rate (i.e. the payment mode used in Task 1), you receive Rs. 10 per number correctly recalled.
- If you choose the tournament (i.e. the payment mode used in Task 2), your performance in Task 3 will be evaluated relative to the performance of the other five participants of your group in the Task 2 -Tournament. The Task 2-tournament is the one you just completed. If you correctly recall more numbers than four of your other group members in Task 2, then you receive Rs. 30 for each correctly recalled number. You will receive no earnings for this task if you choose the tournament and are not among the two winners. You will not be informed of how you did in the tournament until the end of the session. If there are ties the winner will be randomly determined.
If you have any question, please raise your hand and we will answer your question in private.
--Task 3 will start now.
Question 3.1. Please indicate on your reporting sheet which payment scheme you prefer to apply to your performance in Task 3. Strike through the option which you would not like to select and circle the option which you would like to select:
Example 1: If you want to be paid according to Piece rate and not according to Tournament, you should enter:
Piece rate
Tournament
Example 2: If you want to be according to Tournament and not according to Piece rate you should enter:
Piece rate
Tournament
Please select your payment option here:
1. Piece rate
2. Tournament
Now, please listen to the dictated numbers carefully and do not write anything before you are invited to do so. --
-- Now, please write down as many of the dictated numbers as you can recall in the next 3 minutes. --
-- Three minutes are over. Please stop writing immediately. --
36
Question 3.2. Please indicate on your reporting sheet in the box in front of “Question 3.2” how many numbers out of those you have reported you think you have correctly recalled. If this task is selected for payment, you will receive an additional Rs. 50 if your prediction matches your actual score.
Question 3.3. Please indicate on your reporting sheet in the box in front of “Question 3.3” which rank, between 1 for the highest number of correct recalls to 6 for the lowest number of correct recalls, you think you have got in Task 3, compared to the five other group members in Task 2. If this task is selected for payment, you will receive an additional Rs.50 if your guess is correct. We ask you to answer this question even if you have chosen the piece rate payment mode. – Question 3.4. Please indicate on your reporting sheet in the box in front of “Question 3.4” what is the chance that you will be among the top two scorers in your group of six in this Task. Please indicate any number between 0 and 100, with 0 if you are absolutely sure you are not among the top two scorers in your group of six, 100 if you are absolutely sure that you are among the top two scorers, and some number in between 0 and 100 depending on how sure you are of being among the top two scorers. The higher this number, the more confident you are in being among the top two scorers. You will receive a maximum bonus of Rs.50 and a minimum bonus of 0 for answering this question. The more truthful you are in your report, the higher the bonus will be. In other words, your best interest is in truthfully reporting what you think your chances of being among the top two are. If you are interested in knowing how your bonus is calculated, ask us after the study is over. We ask you to answer this question even if you have chosen the piece rate payment mode. --
Task 4. Choice 2
In contrast to the previous tasks, you will not have to recall numbers for this Task. Instead you will be paid one more time for the numbers you recalled in Task 1-Piece rate. However, you will have to choose which payment mode you prefer to apply to your performance in Task 1 (when you were paid Rs. 10 per number correctly recalled). You can either choose to be paid according to the piece rate or according to the tournament.
If Task 4 is randomly selected for payment, then your earnings for this task are determined as follows.
- If you choose the piece rate, you receive Rs. 10 per number correctly recalled in Task 1.
- If you choose the tournament, your performance in Task 1 will be evaluated relative to the performance of the other five participants of your group in the Task 1. If you correctly recalled in Task 1 more numbers than four of your other group members in Task 1, then you receive Rs. 30 for each number that you correctly recalled. You will receive no earnings for this task if you choose the tournament and are not among the two winners. You will not be informed of how you did in the tournament until the end of the session. If there are ties the winner will be randomly determined.
If you have any question, please raise your hand and we will answer your question in private.
--Task 4 will start now.
Question 4.1. Please indicate on your reporting sheet which payment scheme you prefer to apply to your performance in Task 1 and strike through the option which you would not like to select and circle the option which you would like to select.
1. Piece rate
2. Tournament
Question 4.2. Please indicate on your reporting sheet in the box in front of “Question 4.2” which rank, between 1 for the highest number of correct recalls to 6 for the lowest number of correct recalls, you think you have got in Task 1, compared to the five other group members in Task 1. If this task is selected for payment, you will receive an additional Rs.50 if your guess is correct. We ask you to answer this question even if you have chosen the piece rate payment mode. --
37
Question 4.3. Please indicate on your reporting sheet in the box in front of “Question 4.3” what is the chance that you will be among the top two scorers in your group of six in this Task. Please indicate any number between 0 and 100, with 0 if you are absolutely sure you are not among the top two scorers in your group of six and 100 if you are absolutely sure that you are among the top two scorers and some number in between 0 and 100 depending on how sure you are of being among the top two scorers. You will receive a maximum bonus of Rs.50 and a minimum bonus of 0 for answering this question. The more truthful you are in your report, the higher the bonus will be. In other words, your best interest is in truthfully reporting what you think your chances of being among the top two are. If you are interested in knowing how your bonus is calculated, ask us after the study is over. We ask you to answer this question even if you have chosen the piece rate payment mode. --
Task 5-A Die (Unaligned condition)
You are no longer in a group of six participants. In this Task you are paired successively with two other participants of your group of six.
You have received two cups. Each cup contains a die. Do not open the cups but look under the lid. In one cup, the die is blue. In the other cup, the die is red.
- The cup with the blue die must be used to determine your payoff and the payoff of another participant
- The cup with the red die must be used to determine your payoff and the payoff of another participant
What happens in the first pair?
Both you and your co-participant will have to roll a die that is inside one of the cups. But only the outcome reported by one of you two will count to determine your payoffs in this Task. A random draw at the end of the session will determine whether it is the outcome that you report or the outcome reported by the other participant that will determine your payoffs.
You will roll the die twice by shaking the cup and flipping it over. You have to report the outcome of the first roll only. To see the outcome, just look under the lid.
Your first roll decides on how much you and the other participant earn in this part (if it is your report that is selected at the end of the session). The second roll only serves to make sure that the die is working properly. You may of course roll the die more than twice. However, only the first roll counts. You can see the payoffs from the following chart.
Outcome of the 1st roll 1 2 3 4 5 6 Payoff of the participant rolling Rs. 10 Rs. 20 Rs. 30 Rs. 40 Rs. 50 Rs. 60 Payoff of the other participant Rs. 60 Rs. 50 Rs. 40 Rs. 30 Rs. 20 Rs. 10
For example, if 1 is the reported outcome from the die roll, the participant who rolls the die earns Rs.10 and the other participant earns Rs.60. If 2 is the reported outcome from the die roll, the participant who rolls the die earns Rs.20 and the other participant earns Rs.50. And so on.
What happens in the second pair?
The rules are exactly the same as for the first pair, except that you are paired with a different participant. When the experimenter will instruct you to start, you can start either by rolling the blue die or by rolling the red die. Please wait for the experimenter to instruct you to roll the dice. If you have any question, please raise your hand.
38
Question 5.1. Please report on your reporting sheet in front of question 51 the outcome of the first two die rolls: Blue die: the outcome of the first blue die roll is: 1 2 3 4 5 6 Red die: the outcome of the first red die roll is: 1 2 3 4 5 6
Task 5-B Die (Aligned condition) You are no longer in a group of six participants. In this Task you are paired successively with two other participants of your group of six.
You have received two cups. Each cup contains a die. Do not open the cups but look under the lid. In one cup, the die is blue. In the other cup, the die is red.
- The cup with the blue die must be used to determine your payoff and the payoff of another participant
- The cup with the red die must be used to determine your payoff and the payoff of another participant
What happens in the first pair?
Both you and your co-participant will have to roll a die that is inside one of the cups. But only the outcome reported by one of you two will count to determine your payoffs in this Task. A random draw at the end of the session will determine whether it is the outcome that you report or the outcome reported by the other participant that will determine your payoffs.
You will roll the die twice by shaking the cup and flipping it over. You have to report the outcome of the first roll only. To see the outcome, just look under the lid.
Your first roll decides on how much you and the other participant earn in this part (if it is your report that is selected at the end of the session). The second roll only serves to make sure that the die is working properly. You may of course roll the die more than twice. However, only the first roll counts. You can see the payoffs from the following chart.
Outcome of the 1st roll 1 2 3 4 5 6 Payoff of the participant rolling Rs. 10 Rs. 20 Rs. 30 Rs. 40 Rs. 50 Rs. 60 Payoff of the other participant Rs. 10 Rs. 20 Rs. 30 Rs. 40 Rs. 50 Rs. 60
For example, if 1 is the reported outcome from the die roll, the participant who rolls the die earns Rs.10 and the other participant (whose the reported outcome does not count) earns Rs. 10. If 2 is the reported outcome from the die roll, the participant who rolls the die earns Rs.20 and the other participant earns Rs. 20. And so on.)
What happens in the second pair?
The rules are exactly the same as for the first pair, except that you are paired with a different participant. When the experimenter will instruct you to start, you can start either by rolling the blue die or by rolling the red die. Please wait for the experimenter to instruct you to roll the dice. If you have any question, please raise your hand. Question 5.1. Please report on your reporting sheet in front of question 5.1 the outcome of the first two die rolls: Blue die (pair with a participant from the same caste): the outcome of the first blue die roll is: 1 2 3 4 5 6 Red die (pair with a participant from the other caste): the outcome of the first red die roll is: 1 2 3 4 5 6
39
Instructions for Treatment 1 (T1)
Task 1. Piece rate [Common for T0, T1, T2 and T3]
Task 2. Tournament
As in Task 1, after listening to a series of 15 dictated numbers, you will be given 3 minutes to write down as many recalled numbers as possible (in the limit of 15). However, for this task your payment depends on your performance relative to that of a group of other participants. Each group consists of six people, out of which three are from the General Category and three are from the Scheduled Caste category. Thus, you are in a group with five other people present in this session. You will not know who the five other people in your group are. The composition of your group of six remains the same until you are no longer in a group of six. If Task 2 is the one randomly selected for payment, then your earnings depend on your number of correct recalls compared to that of the five other people in your group. The two group members who correctly recall the most numbers are the winners. They will receive Rs. 30 each per correct recall, while the four other group members receive no payment. So, if you are among the two top performers, then you will earn Rs. 30 for each correct number that you recall in this task You will not be informed of how you did in the tournament relative to others until all four tasks have been completed. If there are ties the winner will be randomly determined. We refer to this as the tournament payment. If you have any question, please raise your hand and we will answer your question in private.
--Task 2 will start now. Please listen to the dictated numbers carefully and do not write anything before you are invited to do so. --
-- Now, please write down as many of the dictated numbers as you can recall in the next 3 minutes. --
-- Three minutes are over. Please stop writing immediately. --
-- Question 2.1. Please indicate on your reporting sheet in the box in front of “Question 2.1” how many numbers out of those you have reported you think you have correctly recalled. If this task is selected for payment, you will receive an additional Rs. 50 if your prediction matches your actual score.
Question 2.2a. Please indicate on your reporting sheet in the box in front of “Question 2.2a” which rank, between 1 and 6 you think you have got in Task 2, compared to the five other group members. A rank of 1 means you think you got the highest number of correct recalls in the group and rank 6 means you think you got the lowest number of correct recalls in the group and similar for ranks between 1 and 6. If this task is selected for payment, you will receive an additional Rs.50 if your guess is correct. – Question 2.2b. Please indicate on your reporting sheet in the box in front of “Question 2.2b” which rank, between 1 and 3 you think you have got in Task 2, compared to the three other group members of your own caste. A rank of 1 means you think you got the highest number of correct recalls within your own caste in your group and rank 3 means you think you got the lowest number of correct recalls within your caste in the group and similar for ranks between 1 and 3. If this task is selected for payment, you will receive an additional Rs.50 if your guess is correct. – Question 2.3. Please indicate on your reporting sheet in the box in front of “Question 2.3” what is the chance that you will be among the top two scorers in your group of six in this Task. Please indicate any number between 0 and 100, with 0 if you are absolutely sure you are not among the top two scorers in your group of six, 100 if you are absolutely sure that you are among the top two scorers, and some number in between 0 and 100 depending on how sure you are of being among the top two scorers. The higher this number, the more confident you are in being among the top two scorers. You will receive a
40
maximum bonus of Rs.50 and a minimum bonus of 0 for answering this question. The more truthful you are in your report, the higher the bonus will be. In other words, your best interest is in truthfully reporting what you think your chances of being among the top two are. If you are interested in knowing how your bonus is calculated, ask us after the study is over.
Task 3. Choice
As in the previous two tasks, after listening to a series of 15 dictated numbers, you will be given 3 minutes to write down as many recalled numbers as possible. However, before that, you will get to choose which of the two previous payment modes you prefer to apply to your performance in Task 3. You can either choose to be paid according to the piece rate, or according to the tournament.
If Task 3 is randomly selected for payment, then your earnings for this task are determined as follows.
- If you choose the piece rate (i.e. the payment mode used in Task 1), you receive Rs. 10 per number correctly recalled.
- If you choose the tournament (i.e. the payment mode used in Task 2), your performance in Task 3 will be evaluated relative to the performance of the other five participants of your group in the Task 2 -Tournament. Remember, out of the six people in each group, three are from General Category and three are from Scheduled Caste category. The Task 2-tournament is the one you just completed. If you correctly recall more numbers than four of your other group members in Task 2, then you receive Rs. 30 for each correctly recalled number. You will receive no earnings for this task if you choose the tournament and are not among the two winners. You will not be informed of how you did in the tournament until the end of the session. If there are ties the winner will be randomly determined.
If you have any question, please raise your hand and we will answer your question in private.
--Task 3 will start now.
Question 3.1. Please indicate on your reporting sheet which payment scheme you prefer to apply to your performance in Task 3. Strike through the option which you would not like to select and circle the option which you would like to select:
Example 1: If you want to be paid according to Piece rate and not according to Tournament, you should enter:
Piece rate
Tournament
Example 2: If you want to be according to Tournament and not according to Piece rate you should enter:
Piece rate
Tournament
Please select your payment option here:
1. Piece rate
2. Tournament
Now, please listen to the dictated numbers carefully and do not write anything before you are invited to do so. --
-- Now, please write down as many of the dictated numbers as you can recall in the next 3 minutes. --
-- Three minutes are over. Please stop writing immediately. --
41
--Question 3.2. Please indicate on your reporting sheet in the box in front of “Question 3.2” how many numbers out of those you have reported you think you have correctly recalled. If this task is selected for payment, you will receive an additional Rs. 50 if your prediction matches your actual score.
Question 3.3a. Please indicate on your reporting sheet in the box in front of “Question 3.3a” which rank, between 1 for the highest number of correct recalls to 6 for the lowest number of correct recalls, you think you have got in Task 3, compared to the five other group members in Task 2. If this task is selected for payment, you will receive an additional Rs.50 if your guess is correct. We ask you to answer this question even if you have chosen the piece rate payment mode. Question 3.3b. Please indicate on your reporting sheet in the box in front of “Question 3.3b” which rank, between 1 and 3 you think you have got in Task 2, compared to the three other group members of your own caste. A rank of 1 means you think you got the highest number of correct recalls within your own caste in your group and rank 3 means you think you got the lowest number of correct recalls within your caste in the group and similar for ranks between 1 and 3. If this task is selected for payment, you will receive an additional Rs.50 if your guess is correct. – – Question 3.4. Please indicate on your reporting sheet in the box in front of “Question 3.4” what is the chance that you will be among the top two scorers in your group of six in this Task. Please indicate any number between 0 and 100, with 0 if you are absolutely sure you are not among the top two scorers in your group of six, 100 if you are absolutely sure that you are among the top two scorers, and some number in between 0 and 100 depending on how sure you are of being among the top two scorers. The higher this number, the more confident you are in being among the top two scorers. You will receive a maximum bonus of Rs.50 and a minimum bonus of 0 for answering this question. The more truthful you are in your report, the higher the bonus will be. In other words, your best interest is in truthfully reporting what you think your chances of being among the top two are. If you are interested in knowing how your bonus is calculated, ask us after the study is over. We ask you to answer this question even if you have chosen the piece rate payment mode. --
Task 4 - Choice 2
In contrast to the previous tasks, you will not have to recall numbers for this Task. Instead you will be paid one more time for the numbers you recalled in Task 1-Piece rate. However, you will have to choose which payment mode you prefer to apply to your performance in Task 1 (when you were paid Rs. 10 per number correctly recalled). You can either choose to be paid according to the piece rate or according to the tournament.
If Task 4 is randomly selected for payment, then your earnings for this task are determined as follows.
- If you choose the piece rate, you receive Rs. 10 per number correctly recalled in Task 1.
- If you choose the tournament, your performance in Task 1 will be evaluated relative to the performance of the other five participants of your group in the Task 1. Remember, out of the six people in each group, three are from General Category and three are from Scheduled Caste category. If you correctly recalled in Task 1 more numbers than four of your other group members in Task 1, then you receive Rs. 30 for each number that you correctly recalled. You will receive no earnings for this task if you choose the tournament and are not among the two winners. You will not be informed of how you did in the tournament until the end of the session. If there are ties the winner will be randomly determined.
If you have any question, please raise your hand and we will answer your question in private.
--Task 4 will start now.
Question 4.1. Please indicate on your reporting sheet which payment scheme you prefer to apply to your performance in Task 1 and strike through the option which you would not like to select and circle the option which you would like to select.
1. Piece rate
42
2. Tournament
Question 4.2a. Please indicate on your reporting sheet in the box in front of “Question 4.2” which rank, between 1 for the highest number of correct recalls to 6 for the lowest number of correct recalls, you think you have got in Task 1, compared to the five other group members in Task 1. If this task is selected for payment, you will receive an additional Rs.50 if your guess is correct. We ask you to answer this question even if you have chosen the piece rate payment mode. – Question 4.2b. Please indicate on your reporting sheet in the box in front of “Question 4.2b” which rank, between 1 and 3 you think you have got in Task 2, compared to the three other group members of your own caste. A rank of 1 means you think you got the highest number of correct recalls within your own caste in your group and rank 3 means you think you got the lowest number of correct recalls within your caste in the group and similar for ranks between 1 and 3. If this task is selected for payment, you will receive an additional Rs.50 if your guess is correct. Question 4.3. Please indicate on your reporting sheet in the box in front of “Question 4.3” what is the chance that you will be among the top two scorers in your group of six in this Task. Please indicate any number between 0 and 100, with 0 if you are absolutely sure you are not among the top two scorers in your group of six and 100 if you are absolutely sure that you are among the top two scorers and some number in between 0 and 100 depending on how sure you are of being among the top two scorers.. We ask you to answer this question even if you have chosen the piece rate payment mode. You will receive a maximum bonus of Rs.50 and a minimum bonus of 0 for answering this question. The more truthful you are in your report, the higher the bonus will be. In other words, your best interest is in truthfully reporting what you think your chances of being among the top two are. If you are interested in knowing how your bonus is calculated, ask us after the study is over. We ask you to answer this question even if you have chosen the piece rate payment mode. --
Task 5-A – Die (Unaligned condition) [Common for T1, T2 and T3] You are no longer in a group of six participants. In this Task you are paired successively with two other participants of your group of six. In one case, you are paired with someone from the same caste as you and in the other case you are paired with someone from the other caste.
You have received two cups. Each cup contains a die. Do not open the cups but look under the lid. In one cup, the die is blue. In the other cup, the die is red.
- The cup with the blue die must be used to determine your payoff and the payoff of another participant from your own caste.
- The cup with the red die must be used to determine your payoff and the payoff of another participant from the other caste.
What happens in the first pair?
Both you and your co-participant will have to roll a die that is inside one of the cups. But only the outcome reported by one of you two will count to determine your payoffs in this Task. A random draw at the end of the session will determine whether it is the outcome that you report or the outcome reported by the other participant that will determine your payoffs.
You will roll the die twice by shaking the cup and flipping it over. You have to report the outcome of the first roll only. To see the outcome, just look under the lid.
Your first roll decides on how much you and the other participant earn in this part (if it is your report that is selected at the end of the session). The second roll only serves to make sure that the die is working properly. You may of course roll the die more than twice. However, only the first roll counts. You can see the payoffs from the following chart.
43
Outcome of the 1st roll 1 2 3 4 5 6 Payoff of the participant rolling Rs. 10 Rs. 20 Rs. 30 Rs. 40 Rs. 50 Rs. 60 Payoff of the other participant Rs. 60 Rs. 50 Rs. 40 Rs. 30 Rs. 20 Rs. 10
For example, if 1 is the reported outcome from the die roll, the participant who rolls the die earns Rs.10 and the other participant earns Rs. 60. If 2 is the reported outcome from the die roll, the participant who rolls the die earns Rs.20 and the other participant earns Rs. 50. And so on. What happens in the second pair?
The rules are exactly the same as for the first pair, except that you are paired with a different participant. When the experimenter will instruct you to start, you can start either by rolling the blue die or by rolling the red die. Please wait for the experimenter to instruct you to roll the dice. If you have any question, please raise your hand. Question 5.1. Please report on your reporting sheet in front of question 51 the outcome of the first two die rolls: Blue die (pair with a participant from the same caste): the outcome of the first blue die roll is: 1 2 3 4 5 6 Red die (pair with a participant from the other caste): the outcome of the first red die roll is: 1 2 3 4 5 6
Task 5-B Die (Aligned condition) [Common for T1, T2 and T3] You are no longer in a group of six participants. In this Task you are paired successively with two other participants of your group of six. In one case, you are paired with someone from the same caste as you and in the other case you are paired with someone from the other caste).
You have received two cups. Each cup contains a die. Do not open the cups but look under the lid. In one cup, the die is blue. In the other cup, the die is red.
- The cup with the blue die must be used to determine your payoff and the payoff of another participant from your own caste.
- The cup with the red die must be used to determine your payoff and the payoff of another participant from the other caste.
What happens in the first pair?
Both you and your co-participant will have to roll a die that is inside one of the cups. But only the outcome reported by one of you two will count to determine your payoffs in this Task. A random draw at the end of the session will determine whether it is the outcome that you report or the outcome reported by the other participant that will determine your payoffs.
You will roll the die twice by shaking the cup and flipping it over. You have to report the outcome of the first roll only. To see the outcome, just look under the lid.
Your first roll decides on how much you and the other participant earn in this part (if it is your report that is selected at the end of the session). The second roll only serves to make sure that the die is working properly. You may of course roll the die more than twice. However, only the first roll counts. You can see the payoffs from the following chart.
44
Outcome of the 1st roll 1 2 3 4 5 6 Payoff of the participant rolling Rs. 10 Rs. 20 Rs. 30 Rs. 40 Rs. 50 Rs. 60 Payoff of the other participant Rs. 10 Rs. 20 Rs. 30 Rs. 40 Rs. 50 Rs. 60
For example, if 1 is the reported outcome from the die roll, the participant who rolls the die earns Rs.10 and the other participant (whose the reported outcome does not count) earns Rs. 10. If 2 is the reported outcome from the die roll, the participant who rolls the die earns Rs.20 and the other participant earns Rs. 20. And so on.) What happens in the second pair?
The rules are exactly the same as for the first pair, except that you are paired with a different participant. When the experimenter will instruct you to start, you can start either by rolling the blue die or by rolling the red die. Please wait for the experimenter to instruct you to roll the dice. If you have any question, please raise your hand. Question 5.1. Please report on your reporting sheet in front of question 5.1 the outcome of the first two die rolls: Blue die (pair with a participant from the same caste): the outcome of the first blue die roll is: 1 2 3 4 5 6 Red die (pair with a participant from the other caste): the outcome of the first red die roll is: 1 2 3 4 5 6
45
Instructions for Treatment 2 (T2)
Task 1. Piece rate [Common for T0, T1, T2 and T3]
Task 2. Quota-Tournament
As in Task 1, after listening to a series of 15 dictated numbers, you will be given 3 minutes to write down as many recalled numbers as possible (in the limit of 15). However, for this task your payment depends on your performance relative to that of a group of other participants through a method called Quota-Tournament. Before proceeding, we explain the rules of Quota-Tournament. Each group consists of six people, out of which three are from the General Category and three are form the Scheduled Caste category. Thus, you are in a group with five other people present in this session. You will not know who the five other people in your group are. The composition of your group of six remains the same until you are no longer in a group of six. In Quota-Tournament the winners are determined as follows:
• If you belong to the Scheduled Caste category: you are a winner and receive Rs. 30 for each correctly recalled number if you have a better Task 2 - performance than (i) the other two participants from the Scheduled Caste category in your group in Task 2, or (ii) at least four members of your group in Task 2. If you are not a winner, then you do not earn anything.
• If you belong to the General category: you receive Rs. 30 for each correctly recalled number if you have a better Task 2 - performance than (i) the other two participants from the General category in your group in Task 2, and (ii) four members of your group in Task 2. If you are not a winner, then you do not earn anything.
You will not be informed of how you did in the tournament until the end of the session. If there are ties, the winner will be randomly determined.
--Task 2 will start now. Please listen to the dictated numbers carefully and do not write anything before you are invited to do so. --
-- Now, please write down as many of the dictated numbers as you can recall in the next 3 minutes. --
-- Three minutes are over. Please stop writing immediately. --
-- Question 2.1. Please indicate on your reporting sheet in the box in front of “Question 2.1” how many numbers out of those you have reported you think you have correctly recalled. If this task is selected for payment, you will receive an additional Rs. 50 if your prediction matches your actual score.
Question 2.2a. Please indicate on your reporting sheet in the box in front of “Question 2.2a” which rank, between 1 and 6 you think you have got in Task 2, compared to the five other group members. A rank of 1 means you think you got the highest number of correct recalls in the group and rank 6 means you think you got the lowest number of correct recalls in the group and similar for ranks between 1 and 6. If this task is selected for payment, you will receive an additional Rs.50 if your guess is correct. – Question 2.2b. Please indicate on your reporting sheet in the box in front of “Question 2.2b” which rank, between 1 and 3 you think you have got in Task 2, compared to the three other group members of your own caste. A rank of 1 means you think you got the highest number of correct recalls within your own caste in your group and rank 3 means you think you got the lowest number of correct recalls within your caste in the group and similar for ranks between 1 and 3. If this task is selected for payment, you will receive an additional Rs.50 if your guess is correct. Question 2.3. Please indicate on your reporting sheet in the box in front of “Question 2.3” what is the
46
chance that you will be among the “winners” in your group of six in this Task. Please indicate any number between 0 and 100, with 0 if you are absolutely sure you are not among the winners in your group of six, 100 if you are absolutely sure that you are among the winners, and some number in between 0 and 100 depending on how sure you are of being among the winners. The higher this number, the more confident you are in being among the winners. You will receive a maximum bonus of Rs.50 and a minimum bonus of 0 for answering this question. The more truthful you are in your report, the higher the bonus will be. In other words, your best interest is in truthfully reporting what you think your chances of being among the winners are. If you are interested in knowing how your bonus is calculated, ask us after the study is over.
Task 3. Choice
As in the previous two tasks, after listening to a series of 15 dictated numbers, you will be given 3 minutes to write down as many recalled numbers as possible. However, before that, you will get to choose which of the two previous payment modes you prefer to apply to your performance in Task 3. You can either choose to be paid according to the piece rate, or according to the tournament.
If Task 3 is randomly selected for payment, then your earnings for this task are determined as follows.
- If you choose the piece rate (i.e. the payment mode used in Task 1), you receive Rs. 10 per number correctly recalled.
- If you choose the Quota-tournament, your performance in Task 3 will be evaluated relative to the performance of the other five participants of your group in the Task 2. * If you belong to the Scheduled Caste category: you receive Rs. 30 for each correctly recalled number if you are a winner i.e. you have a better Task 3-performance than (i) the other two participants from the Scheduled Caste category in your group in Task 2, or (ii) four members of your group in Task 2. If you are not a winner, then you do not earn anything.
* If you belong to the General category: you receive Rs. 30 for each correctly recalled number if you are a winner i.e. you have a better Task 3- performance than (i) the other two participants from the General category in your group in Task 2, and (ii) four members of your group in Task 2. If you are not a winner, then you do not earn anything.
You will not be informed of how you did in the tournament until the end of the session. If there are ties the winner will be randomly determined.
If you have any question, please raise your hand and we will answer your question in private.
--Task 3 will start now.
Question 3.1. Please indicate on your reporting sheet which payment scheme you prefer to apply to your performance in Task 3. Strike through the option which you would not like to select and circle the option which you would like to select:
Example 1: If you want to be paid according to Piece rate and not according to Quota-Tournament, you should enter:
Piece rate
Quota-Tournament
Example 2: If you want to be according to Quota-Tournament and not according to Piece rate you should enter:
Piece rate
Quota-Tournament
Please select your payment option here:
3. Piece rate
47
4. Quota-Tournament
Now, please listen to the dictated numbers carefully and do not write anything before you are invited to do so. --
-- Now, please write down as many of the dictated numbers as you can recall in the next 3 minutes. --
-- Three minutes are over. Please stop writing immediately. --
--Question 3.2. Please indicate on your reporting sheet in the box in front of “Question 3.2” how many numbers out of those you have reported you think you have correctly recalled. If this task is selected for payment, you will receive an additional Rs. 50 if your prediction matches your actual score.
Question 3.3a. Please indicate on your reporting sheet in the box in front of “Question 3.3a” which rank, between 1 for the highest number of correct recalls to 6 for the lowest number of correct recalls, you think you have got in Task 3, compared to the five other group members in Task 2. If this task is selected for payment, you will receive an additional Rs.50 if your guess is correct. We ask you to answer this question even if you have chosen the piece rate payment mode. – Question 3.3b: Please indicate on your reporting sheet in the box in front of “Question 3.3b” which rank, between 1 and 3 you think you have got in Task 2, compared to the three other group members of your own caste. A rank of 1 means you think you got the highest number of correct recalls within your own caste in your group and rank 3 means you think you got the lowest number of correct recalls within your caste in the group and similar for ranks between 1 and 3. If this task is selected for payment, you will receive an additional Rs.50 if your guess is correct. Question 3.4. Please indicate on your reporting sheet in the box in front of “Question 3.4” what is the chance that you will be among the “winners” in your group of six in this Task. Please indicate any number between 0 and 100, with 0 if you are absolutely sure you are not among the winners in your group of six, 100 if you are absolutely sure that you are among the winners, and some number in between 0 and 100 depending on how sure you are of being among the winners. The higher this number, the more confident you are in being among the winners. You will receive a maximum bonus of Rs.50 and a minimum bonus of 0 for answering this question. The more truthful you are in your report, the higher the bonus will be. In other words, your best interest is in truthfully reporting what you think your chances of being among the winners are. If you are interested in knowing how your bonus is calculated, ask us after the study is over. We ask you to answer this question even if you have chosen the piece rate payment mode.
Task 4A - Choice 2
In contrast to the previous tasks, you will not have to recall numbers for this Task. Instead you will be paid one more time for the numbers you recalled in Task 1-Piece rate. However, you will have to choose which payment mode you prefer to apply to your performance in Task 1 (when you were paid Rs. 10 per number correctly recalled). You can either choose to be paid according to the piece rate or according to the Quota-tournament. If Task 4A is randomly selected for payment, then your earnings for this task are determined as follows.
- If you choose the piece rate, you receive Rs. 10 per number correctly recalled in Task 1.
- If you choose the Quota-tournament, your performance in Task 1 will be evaluated relative to the performance of the other five participants of your group in the Task 1. * If you belong to the Scheduled Caste category: you receive Rs. 30 for each correctly recalled number if you are a winner i.e. you have a better Task 1-performance than (i) the other two participants from the Scheduled Caste category in your group in Task 1, or (ii) at least four members of your group in Task 1. If you are not a winner, then you do not earn anything
- * If you belong to the General category: you receive Rs. 30 for each correctly recalled number if you are a winner i.e. you have a better Task 1- performance than (i) the other two participants
48
from the General category in your group in Task 1, and (ii) four members of your group in Task 1. If you are not a winner, then you do not earn anything
You will not be informed of how you did in the tournament until the end of the session. If there are ties, the winner will be randomly determined.
If you have any question, please raise your hand and we will answer your question in private.
--Task 4A will start now.
Question 4A.1. Please indicate on your reporting sheet which payment scheme you prefer to apply to your performance in Task 1 and strike through the option which you would not like to select and circle the option which you would like to select.
1. Piece rate
2. Quota-Tournament
Question 4A.2a. Please indicate on your reporting sheet in the box in front of “Question 4A.2a” which rank, between 1 for the highest number of correct recalls to 6 for the lowest number of correct recalls, you think you have got in Task 1, compared to the five other group members in Task 1. If this task is selected for payment, you will receive an additional Rs.50 if your guess is correct. We ask you to answer this question even if you have chosen the piece rate payment mode. -- Question 4A.2b. Please indicate on your reporting sheet in the box in front of “Question 4A.2b” which rank, between 1 for the highest number of correct recalls to 3 for the lowest number of correct recalls, you think you have got in Task 1, compared to the two other group members from the same caste as you in Task 1. If this task is selected for payment, you will receive an additional Rs.50 if your guess is correct. We ask you to answer this question even if you have chosen the piece rate payment mode.
Question 4A.3. Please indicate on your reporting sheet in the box in front of “Question 4A.3” what is the chance that you will be among the “winners” in your group of six in this Task. Please indicate any number between 0 and 100, with 0 if you are absolutely sure you are not among the winners in your group of six, 100 if you are absolutely sure that you are among the winners, and some number in between 0 and 100 depending on how sure you are of being among the winners. The higher this number, the more confident you are in being among the winners. You will receive a maximum bonus of Rs.50 and a minimum bonus of 0 for answering this question. The more truthful you are in your report, the higher the bonus will be. In other words, your best interest is in truthfully reporting what you think your chances of being among the winners are. If you are interested in knowing how your bonus is calculated, ask us after the study is over. We ask you to answer this question even if you have chosen the piece rate payment mode.
Task 4B. Choice 3
Like in Task 4A, you will not have to recall numbers for this Task and you will be paid one more time for the numbers you recalled in Task 1-Piece rate. You will again have to choose which payment mode you prefer to apply to your performance in Task 1. The only difference is that the rules for the tournament are now different. The two winners of the tournament are the two group members who had the highest scores in Task 1, regardless of their caste. You can either choose to be paid according to the piece rate or according to the tournament.
If Task 4B is randomly selected for payment, then your earnings for this task are determined as follows.
- If you choose the piece rate, you receive Rs. 10 per number correctly recalled in Task 1.
- If you choose the tournament, your performance in Task 1 will be evaluated relative to the performance of the other five participants of your group in the Task 1 –Piece rate. If you correctly recalled in Task 1 more numbers than four of your other group members in Task 1, then you are a “winner” and receive Rs. 30 for each number that you correctly recalled. You will receive no earnings for this task if you choose the tournament and are not among the two
49
“winners”. You will not be informed of how you did in the tournament until the end of the session. If there are ties the winner will be randomly determined.
If you have any question, please raise your hand and we will answer your question in private.
--Task 4B will start now.
Question 4B.1. Please indicate on your reporting sheet which payment scheme you prefer to apply to your performance in Task 1. Strike through the option which you would not like to select and circle the option which you would like to select.
1. Piece rate
2. Tournament
Question 4B.2a. Please indicate on your reporting sheet in the box in front of “Question 4B.2a” which rank, between 1 for the highest number of correct recalls to 6 for the lowest number of correct recalls, you think you have got in Task 1, compared to the five other group members in Task 1. If this task is selected for payment, you will receive an additional Rs.50 if your guess is correct. We ask you to answer this question even if you have chosen the piece rate payment mode. – Question 4B.2b. Please indicate on your reporting sheet in the box in front of “Question 4B.2b” which rank, between 1 for the highest number of correct recalls to 3 for the lowest number of correct recalls, you think you have got in Task 1, compared to the two other group members from the same caste as you in Task 1. If this task is selected for payment, you will receive an additional Rs.50 if your guess is correct. We ask you to answer this question even if you have chosen the piece rate payment mode.
Question 4B.3. Please indicate on your reporting sheet in the box in front of “Question 4B.3” what is the chance that you will be among the “winners” in your group of six in this Task. Please indicate any number between 0 and 100, with 0 if you are absolutely sure you are not among the winners in your group of six, 100 if you are absolutely sure that you are among the winners, and some number in between 0 and 100 depending on how sure you are of being among the winners. The higher this number, the more confident you are in being among the winners. You will receive a maximum bonus of Rs.50 and a minimum bonus of 0 for answering this question. The more truthful you are in your report, the higher the bonus will be. In other words, your best interest is in truthfully reporting what you think your chances of being among the winners are. If you are interested in knowing how your bonus is calculated, ask us after the study is over. We ask you to answer this question even if you have chosen the piece rate payment mode.
50
Instruction for Treatment 3 (T3)
Task 1. Piece rate [Common for T0, T1, T2 and T3]
Task 2. PT-Tournament
As in Task 1, after listening to a series of 15 dictated numbers, you will be given 3 minutes to write down as many recalled numbers as possible (in the limit of 15). However, for this task your payment depends on your performance relative to that of a group of other participants through a method called PT-Tournament. Before proceeding, we explain the rules of PT-Tournament. Each group consists of six people, out of which three are from the General Category and three are form the Scheduled Caste category. Thus, you are in a group with five other people present in this session. You will not know who the five other people in your group are. The composition of your group of six remains the same until you are no longer in a group of six. In PT-Tournament the “winners” are determined as follows:
• If you belong to the Scheduled Caste category: your final score in the memory game will be your actual score plus 2. You are a “winner” and receive Rs. 30 for each correctly recalled number if you have a better Task 2 – final score than at least four other members of your group. If you are not a winner, then you do not earn anything.
• If you belong to the General category: your final score in the memory game is only your actual score. You are a “winner” and receive Rs. 30 for each correctly recalled number if you have a better Task 2- final score than at least four other members of your group. If you are not a winner, then you do not earn anything.
You will not be informed of how you did in the tournament until the end of the session. If there are ties, the winner will be randomly determined.
--Task 2 will start now. Please listen to the dictated numbers carefully and do not write anything before you are invited to do so. --
-- Now, please write down as many of the dictated numbers as you can recall in the next 3 minutes. --
-- Three minutes are over. Please stop writing immediately. --
Question 2.1. Please indicate on your reporting sheet in the box in front of “Question 2.1” how many numbers out of those you have reported you think you have correctly recalled. If this task is selected for payment, you will receive an additional Rs. 50 if your prediction matches your actual score.
Question 2.2a. Please indicate on your reporting sheet in the box in front of “Question 2.2a” which rank, depending on your actual score, between 1 and 6 you think you have got in Task 2, compared to the five other group members. A rank of 1 means you think you got the highest actual score in the group and rank 6 means you think you got the lowest actual score in the group and similar for ranks between 1 and 6. If this task is selected for payment, you will receive an additional Rs.50 if your guess is correct. – Question 2.2b. Please indicate on your reporting sheet in the box in front of “Question 2.2b” which rank, depending on your final score, between 1 and 6 you think you have got in Task 2, compared to the five other group members. A rank of 1 means you think you got the highest actual score in the group and rank 6 means you think you got the lowest actual score in the group and similar for ranks between 1 and 6. If this task is selected for payment, you will receive an additional Rs.50 if your guess is correct. – Question 2.2c. Please indicate on your reporting sheet in the box in front of “Question 2.2c” which rank, depending on your final score, between 1 and 3 you think you have got in Task 2, compared to the two other group members of your caste. A rank of 1 means you think you got the highest actual score in
51
the group and rank 6 means you think you got the lowest actual score in the group and similar for ranks between 1 and 6. If this task is selected for payment, you will receive an additional Rs.50 if your guess is correct. – Question 2.3. Please indicate on your reporting sheet in the box in front of “Question 2.3” what is the chance that you will be among the top two, depending on your final score, in your group of six in this Task. Please indicate any number between 0 and 100, with 0 if you are absolutely sure you are not among the top two, 100 if you are absolutely sure that you are among the top two, and some number in between 0 and 100 depending on how sure you are of being among the top two. The higher this number, the more confident you are in being among the top two, depending on your final score. You will receive a maximum bonus of Rs.50 and a minimum bonus of 0 for answering this question. The more truthful you are in your report, the higher the bonus will be. In other words, your best interest is in truthfully reporting what you think your chances of being among the winners are. If you are interested in knowing how your bonus is calculated, ask us after the study is over.
Task 3. Choice
As in the previous two tasks, after listening to a series of 15 dictated numbers, you will be given 3 minutes to write down as many recalled numbers as possible. However, before that, you will get to choose which of the two previous payment modes you prefer to apply to your performance in Task 3. You can either choose to be paid according to the piece rate, or according to the PT-tournament.
If Task 3 is randomly selected for payment, then your earnings for this task are determined as follows.
- If you choose the piece rate (i.e. the payment mode used in Task 1), you receive Rs. 10 per number correctly recalled.
- If you choose the PT-tournament, your final score in Task 3 will be evaluated relative to the final scores of the other five participants of your group in the Task 3.
o If you belong to the Scheduled Caste category: your final score in Task 3 will be your actual score plus 2. You are a “winner” and receive Rs. 30 for each correctly recalled number if you have a better Task 2 – final score than at least four other members of your group. If you are not a winner, then you do not earn anything.
o If you belong to the General category: your final score in the memory game is only your actual score. You are a “winner” and receive Rs. 30 for each correctly recalled number if you have a better Task 3 - final score than at least four other members of your group. If you are not a winner, then you do not earn anything.
You will not be informed of how you did in the tournament until the end of the session. If there are ties the winner will be randomly determined.
If you have any question, please raise your hand and we will answer your question in private.
--Task 3 will start now.
Question 3.1. Please indicate on your reporting sheet which payment scheme you prefer to apply to your performance in Task 3. Strike through the option which you would not like to select and circle the option which you would like to select:
Example 1: If you want to be paid according to Piece rate and not according to PT-Tournament, you should enter:
Piece rate
PT-Tournament
Example 2: If you want to be according to PT-Tournament and not according to Piece rate you should enter:
Piece rate
52
PT-Tournament
Please select your payment option here:
1. Piece rate 2. PT-Tournament
Now, please listen to the dictated numbers carefully and do not write anything before you are invited to do so. --
-- Now, please write down as many of the dictated numbers as you can recall in the next 3 minutes. --
-- Three minutes are over. Please stop writing immediately. --
Question 3.2. Please indicate on your reporting sheet in the box in front of “Question 3.2” how many numbers out of those you have reported you think you have correctly recalled. If this task is selected for payment, you will receive an additional Rs. 50 if your prediction matches your actual score.
Question 3.3a. Please indicate on your reporting sheet in the box in front of “Question 3.3a” which rank, depending on your actual score, between 1 and 6 you think you have got in Task 2, compared to the five other group members. A rank of 1 means you think you got the highest actual score in the group and rank 6 means you think you got the lowest actual score in the group and similar for ranks between 1 and 6. If this task is selected for payment, you will receive an additional Rs.50 if your guess is correct. Question 3.3b. Please indicate on your reporting sheet in the box in front of “Question 3.3b” which rank, depending on your final score, between 1 and 6 you think you have got in Task 3, compared to the five other group members. A rank of 1 means you think you got the highest actual score in the group and rank 6 means you think you got the lowest actual score in the group and similar for ranks between 1 and 6. If this task is selected for payment, you will receive an additional Rs.50 if your guess is correct. – Question 3.3c. Please indicate on your reporting sheet in the box in front of “Question 3.3c” which rank, depending on your final score, between 1 and 3 you think you have got in Task 2, compared to the two other group members of your caste. A rank of 1 means you think you got the highest actual score in the group and rank 6 means you think you got the lowest actual score in the group and similar for ranks between 1 and 6. If this task is selected for payment, you will receive an additional Rs.50 if your guess is correct. – Question 3.4. Please indicate on your reporting sheet in the box in front of “Question 2.3” what is the chance that you will be among the top two, depending on your final score, in your group of six in this Task. Please indicate any number between 0 and 100, with 0 if you are absolutely sure you are not among the top two, 100 if you are absolutely sure that you are among the top two, and some number in between 0 and 100 depending on how sure you are of being among the top two. The higher this number, the more confident you are in being among the top two, depending on your final score. You will receive a maximum bonus of Rs.50 and a minimum bonus of 0 for answering this question. The more truthful you are in your report, the higher the bonus will be. In other words, your best interest is in truthfully reporting what you think your chances of being among the winners are. If you are interested in knowing how your bonus is calculated, ask us after the study is over. We ask you to answer this question even if you have chosen the piece rate payment mode. --
Task 4A - Choice 2
In contrast to the previous tasks, you will not have to recall numbers for this Task. Instead you will be paid one more time for the numbers you recalled in Task 1-Piece rate. However, you will have to choose which payment mode you prefer to apply to your performance in Task 1 (when you were paid Rs. 10 per number correctly recalled). You can either choose to be paid according to the piece rate or according to the PT-tournament.
53
If Task 4A is randomly selected for payment, then your earnings for this task are determined as follows.
- If you choose the piece rate, you receive Rs. 10 per number correctly recalled in Task 1.
- If you choose the PT-tournament, your performance in Task 1 will be evaluated relative to the performance of the other five participants of your group in the Task 1.
o If you belong to the Scheduled Caste category: your final score will be your actual score in Task 1 plus 2. You are a winner and will receive Rs. 30 for each correctly recalled number if you have a better Task 1 – final score than at least four other members of your group. If you are not a winner, then you do not earn anything.
o If you belong to the General category: your final score will be only your actual score in Task 1. You are a winner and will receive Rs. 30 for each correctly recalled number if you have a better Task 1 - final score than at least four other members of your group. If you are not a winner, then you do not earn anything.
You will not be informed of how you did in the tournament until the end of the session. If there are ties, the winner will be randomly determined.
If you have any question, please raise your hand and we will answer your question in private.
--Task 4A will start now.
Question 4A.1. Please indicate on your reporting sheet which payment scheme you prefer to apply to your performance in Task 1 and strike through the option which you would not like to select and circle the option which you would like to select.
1. Piece rate
2. PT-Tournament
Question 4A.2a. Please indicate on your reporting sheet in the box in front of “Question 4A.2a” which rank, depending on your actual score, between 1 and 6 you think you have got in Task 1, compared to the five other group members. A rank of 1 means you think you got the highest actual score in the group and rank 6 means you think you got the lowest actual score in the group and similar for ranks between 1 and 6. If this task is selected for payment, you will receive an additional Rs.50 if your guess is correct. Question 4A.2b. Please indicate on your reporting sheet in the box in front of “Question 4A.2b” which rank, depending on your final score, between 1 and 6 you think you have got in Task 1, compared to the five other group members. A rank of 1 means you think you got the highest actual score in the group and rank 6 means you think you got the lowest actual score in the group and similar for ranks between 1 and 6. If this task is selected for payment, you will receive an additional Rs.50 if your guess is correct. – Question 4A.2c. Please indicate on your reporting sheet in the box in front of “Question 4A.2c” which rank, depending on your final score, between 1 and 3 you think you have got in Task 2, compared to the two other group members of your caste. A rank of 1 means you think you got the highest actual score in the group and rank 6 means you think you got the lowest actual score in the group and similar for ranks between 1 and 6. If this task is selected for payment, you will receive an additional Rs.50 if your guess is correct. Question 4A.3. Please indicate on your reporting sheet in the box in front of “Question 4A.3” what is the chance that you will be among the top two, depending on your final score, in your group of six in this Task. Please indicate any number between 0 and 100, with 0 if you are absolutely sure you are not among the top two, 100 if you are absolutely sure that you are among the top two, and some number in between 0 and 100 depending on how sure you are of being among the top two. The higher this number, the more confident you are in being among the top two, depending on your final score. You will receive a maximum bonus of Rs.50 and a minimum bonus of 0 for answering this question. The more truthful
54
you are in your report, the higher the bonus will be. In other words, your best interest is in truthfully reporting what you think your chances of being among the winners are. If you are interested in knowing how your bonus is calculated, ask us after the study is over. We ask you to answer this question even if you have chosen the piece rate payment mode.
Task 4B. Choice 3
Like in Task 4A, you will not have to recall numbers for this Task and you will be paid one more time for the numbers you recalled in Task 1-Piece rate. You will again have to choose which payment mode you prefer to apply to your performance in Task 1. The only difference is that the rules for the tournament are now different. The two winners of the tournament are the two group members who had the highest scores in Task 1, regardless of their caste. You can either choose to be paid according to the piece rate or according to the tournament.
If Task 4B is randomly selected for payment, then your earnings for this task are determined as follows.
- If you choose the piece rate, you receive Rs. 10 per number correctly recalled in Task 1.
- If you choose the tournament, your performance in Task 1 will be evaluated relative to the performance of the other five participants of your group in the Task 1, based on your actual score. If you correctly recalled in Task 1 more numbers than four of your other group members in Task 1, then you receive Rs. 30 for each number that you correctly recalled. You will receive no earnings for this task if you choose the tournament and are not among the two top scorers. You will not be informed of how you did in the tournament until the end of the session. If there are ties the winner will be randomly determined.
If you have any question, please raise your hand and we will answer your question in private.
--Task 4B will start now.
Question 4B.1. Please indicate on your reporting sheet which payment scheme you prefer to apply to your performance in Task 1. Strike through the option which you would not like to select and circle the option which you would like to select.
1. Piece rate 2. Tournament
Question 4B.2a. Please indicate on your reporting sheet in the box in front of “Question 4B.2a” which rank, between 1 for the highest number of correct recalls to 6 for the lowest number of correct recalls, you think you have got in Task 1, compared to the five other group members in Task 1. If this task is selected for payment, you will receive an additional Rs.50 if your guess is correct. We ask you to answer this question even if you have chosen the piece rate payment mode. – Question 4B.2b. Please indicate on your reporting sheet in the box in front of “Question 4B.2b” which rank, between 1 for the highest number of correct recalls to 3 for the lowest number of correct recalls, you think you have got in Task 1, compared to the two other group members of your own caste in Task 1. If this task is selected for payment, you will receive an additional Rs.50 if your guess is correct. We ask you to answer this question even if you have chosen the piece rate payment mode.
Question 4B.3. Please indicate on your reporting sheet in the box in front of “Question 4B.3” what is the chance that you will be among the top two, depending on your score, in your group of six in this Task. Please indicate any number between 0 and 100, with 0 if you are absolutely sure you are not among the top two, 100 if you are absolutely sure that you are among the top two, and some number in between 0 and 100 depending on how sure you are of being among the top two. The higher this number, the more confident you are in being among the top two, depending on your final score. You will receive a maximum bonus of Rs.50 and a minimum bonus of 0 for answering this question. The more truthful you are in your report, the higher the bonus will be. In other words, your best interest is in truthfully reporting what you think your chances of being among the winners are. If you are interested in knowing
55
how your bonus is calculated, ask us after the study is over. We ask you to answer this question even if you have chosen the piece rate payment mode.
Task 6 – Investment Task [Common for T0, T1, T2 and T3] At the beginning of this Task you will receive Rs. 100. You are asked to choose how many Rs. (between 0 and 100) you wish to invest in a risky option. The amount that you do not invest is for you to keep.
We will toss a coin at the end of the session.
- If the coin comes up heads, your investment is a success. You earn 3 times the amount invested (plus the amount that you did not invest).
- If the coin comes up tails, your investment is a failure. You earn 0 and lose your investment (you keep only the amount that you did not invest).
Example 1. You invest nothing. The coin flip does not affect your earnings for this part. You get the Rs. 100 for sure.
Example 2. You invest all of the Rs. 100. If the coin comes up heads, you earn Rs. 300; if it comes up tails, you earn nothing and end up with 0 in this part.
Example 3. You invest Rs. 40. It the coin comes up heads, you earn 60 (the amount that you did not invest) + 3 x 40 (the mount you invested) = Rs.180. If the coin lands on tails, you earn Rs. 60 (the amount that you did not invest).
If you have any question, please raise your hand and we will answer your question in private.
Question 6.1 Please indicate on your reporting sheet how much you are willing to invest (between 0 and 100).
Exit Survey [Common T0, T1, T2 and T3] Demographic questionnaire
Please answer the following questions. We remind you that your responses are anonymous.
1. What is your age ________years
2. What is your gender? Male / Female________
3. Are you married? |___|Yes |___| No
4. Do you have children? |___| Yes |___| No
a. If yes how many? _________
b. How many of these children are under age 5?________
5. Religion: • Hindu • Muslim • Others
6. If you have a religion, do you pray
|___| several times per day |___| once per day |___| every week |___| rarely |___| never
7. Caste: • General • OBC • SC • ST • Others/No Caste
8. Education level:
a. Class _________ (if passed Class 12 or below) b. Bachelors c. Masters or above
9. Gross Monthly Family Income (before tax): Rs. ________________
56
10. If you compare your family’s economic conditions to the others in your village, your family is (tick as appropriate):
___ very poor, ___poor, ___average, ___rich, ___very rich
11. Employment status:
12. No. of years of employment in total 13. No. of years of employment in current job 14. Does your family own a TV? |___| 1=yes, 2=no
15. Does your family own a motorbike or car |___| 1=yes, 2=no.
16. Does your family own a bicycle? |___| 1=yes, 2=no
Risk attitudes
Please answer the following questions. Are you a person who is fully prepared to take risks or do you try to avoid taking risks in the following situations?
Please tick the circle that describes you the best on the following scale, where the value 0 means: ‘not at all willing to take risks’ and the value 10 means: ‘very willing to take risks’.
17. In general
18. When it comes to financial matters?
19. When it comes to health matters?
----
Appendix 2. Experimental sites: West Bengal and South 24 Paraganas
Figure 6: West Bengal and South 24 Paraganas in map
(a) West Bengal (b) South 24 Paraganas
Km 25 50 100
(c) Blocks within South 24 Paraganas (d) Sampled Villages and Wards
14
Appendix 3. Summary statistics on the subject-pool
Notes: The Table report mean values. Diff. denote the treatment differences. The numbers in parentheses denote p-values reported from Mann-Whitney rank sum tests. a: Caste data is presented as General, OBC, SC, ST. b: SC is equal to 1 if a subject is either OBC, SC or ST, and 0 otherwise. c: Years of education completed
Appendix 4. Pictures of some experimental sessions
Figure 7: Some photographs from the field
(a)
(b)
(c)
14
60
Appendix 5.
Figure 1A: Distribution of scores in the memory task
Notes: The top left panel plots the distribution of the scores obtained in parts 1, 2 and 3, namely score1, score2 and score3. The mean scores are 8.01, 8.63 and 7.42, respectively. The figure in the top right panel compares score in part 1 across castes. The mean score in part 1 is 8.12 for the GC subjects and 7.98 for the SC subjects (t-test, p=0.40). The figure in the bottom right panel compares scores across gender. Mean score in part 1 is 8.16 for males and 7.93 for females (t-test, p=0.30). The figure in the bottom left panel plots the distribution of scores in part 1 for each treatment. Score in part 1 does not vary either between T1 and T0 (t-test, p=0.34), or T2 and T0 (t-test, p=0.84), or T3 and T0 (t-test, p=0.93). All standard errors are clustered at the village level. We rely only on score in part 1 to illustrate balance across treatments since treatments can potentially affect scores in subsequent parts.
Figure 5: Scores in Memory Games0
.05
.1.1
5D
en
sity
0 5 10 15Score
Score 1 Score 2
Score 3
0
.2
.4
.6
.8
1
Cu
mu
lative
Pro
ba
bili
ty
0 5 10 15Score 1
T0 T1
T2 T3
0
.2
.4
.6
.8
1
Cu
mu
lative
Pro
ba
bili
ty
0 5 10 15Score 1
General Scheduled Caste
0
.2
.4
.6
.8
1
Cu
mu
lative
Pro
ba
bili
ty
0 5 10 15Score 1
Female Male
The top left figure plots the distribution the scores obtained in Stage 1, 2 and 3, namely, Score 1, Score 2 and Score 3. The
average scores are 8.01, 8.63 and 7.42, respectively. The figure on the top right compares Score 1 across caste. Mean score in
Stage 1 is 8.12 for General and 7.98 for SC (t-test, p-value=0.40). The figure on the bottom right compares it across gender.
Mean score in Stage 1 is 8.16 for male and 7.93 for female (t-test, p-value=0.30). The bottom left figure plots the distribution
of the Score 1 for each treatment. Score 1 does not vary either between T1 and T0 (t-test, p-value=0.34) or T2 and T0
(t-test, p-value=0.84) or T3 and T0 (t-test, p-value=0.93). All standard errors are clustered at the village level. We rely only
on Score 1 to illustrate balance across treatments since treatments can potentially a�ect scores in subsequent stages.
Figure 3A: Relative self-confidence: prediction error about being a winner
Direct Impact of AA
Q4: Does AA impact productivity? If so, does it di�er across castes? across AA instruments? (this part should besummarized in one sentence if there is no impact of AA on performance)
A: Does score in stage 3 di�er in T2 and T3? NO. AA action has not e�ect on the memory game scores. SeeWord doc - Other results.
Q5: Does AA change beliefs about one’s relative ability and is the e�ect (if any) di�erent across castes?Q6: Does AA impacts the caste gap in competitiveness?A: refer to the sumary stat tablesQ7: Does AA lead less able SC subjects to overcome more able G subjects?A: Refer to the word file.
Spillover e�ects of AA
Q8. - Do people from each caste still compete at the same rate when AA is removed? (this is the most importantpoint in this part)
A: No. Refer to Fig 3, Table 2 and Table 3.Q9. - Does AA lead to retaliation (die task with unaligned vs. aligned interests)? (but if there is no result on
this point, we can just report the task very briefly in the design section and mention that we will not comment on itbecause nothing is significant)
A: Yes it does. Table 4,5 and 6 give the details.
Estimation Strategy
Table 7 presents the results from probit estimation. This is essentially the Belafoutas and Sutter specification.Column 3 and 4 includes beliefs and the treatment for the SC vanishes. This indicates. beliefs systematically varywith the treatments and is therefore endogenous. The correct specification is one where treatments a�ects beliefs inthe first stage and beliefs a�ect the tournament choice in the second stage. Table 8 estimates this empirical model.
In part 1, the di�erence in prediction error between General and SC in T0 is 0.05 (t-test,p-value=0.85), in T1 is 0.18(t-test,p-value=0.62), in T2 is 0.15 (t-test,p-value=0.67), in T3 is 0.25 (t-test,p-value=0.41). All standard errors are
clustered at the village level. The corresponding tests for part 2 and 3 are given in Table 3.
The proportion of subjects who predict they will be among the winners is given in y-axis. That proportion increasesfor the SC in the presence of AA policy, as is clear from the figure in the left and middle. However, as the right
hand side figure shows, when the AA policy is removed, the proportion of SC who believe they will be among thewinners decreases.
3
62
Figure 4A: Comparison of actual winners and top scorers in Part 2
Note: The figure on the left plots the proportion of actual winners in Stage 2. The figure on the right plots the proportion of top scorers in Stage 2. In T0 and T1, winners are the top scorers but in T2 and T3 that is not necessarily the case.
Figure 5A: Comparison of actual winners and top scorers in Part 3
Note: The figure on the left plots the proportion of actual winners who chose tournament in Stage 3. The figure on the right plots the proportion of the top scorers who chose tournament in Stage 3. In T0 and T1, winners are the top scorers but in T2 and T3 that is not necessarily the case.
63
Table A1. Determinants of tournament choice in part 4B
(1) (2) (3) (4) Step 2: Dep. Variable: Tournament choice in part 4B Predicted belief on being a winner Predicted belief on chance of winning Socio-demographic variables
0.58*** (0.09)
-
No
0.62*** (0.09)
-
Yes
-
0.01*** (<0.001)
No
-
0.01*** (<0.001)
Yes Step 1: Dep. Variable: Belief on being a winner
in part 4B Belief on chance of winning in part 4B
Scheduled Caste subjects (SC) Treatment T1 Treatment T2 Treatment T3 SC*T1 SC*T2 SC*T3 Score in part 2 Socio-demographic variables
-0.04 (0.06) 0.01
(0.09) 0.09
(0.07) 0.09
(0.06) -0.05 (0.11) -0.05 (0.08) -0.08 (0.10)
0.05*** (0.01)
No
-0.06 (0.06) 0.01
(0.08) 0.09
(0.07) 0.08
(0.06) -0.04 (0.10) -0.04 (0.08) -0.06 (0.09)
0.04*** (0.01)
Yes
0.96 (2.98) 2.15
(4.15) 2.31
(3.71) 3.01
(3.35) -6.34 (6.21) -2.39 (4.40) -5.47 (4.42)
3.11*** (0.53)
No
-0.22 (2.91) 2.52
(4.21) 2.16
(4.02) 2.22
(3.65) -5.72 (5.89) -1.42 (4.23) -3.65 (4.07)
2.50*** (0.50) Yes
Number of observations Log pseudo-likelihood Prob>chi2
672 -730.27 <0.001
669 -713.9 <0.001
672 -3374.23 <0.001
669 -3325.78 <0.001
Notes: Clustered standard errors at the village level are in parentheses. The four columns report marginal effects. In the first step estimation, the dependent variable in columns (1) and (2) is the belief that the subject will be among the winners in part 4B; the dependent variable in columns (3) and (4) is the belief about the chance of winning in part 4B. In the second step, a probit model estimates the probability to choose the tournament in part 4B. T0 and T1 did not have part 4B, so data from part 4 is used. ***, **, and * indicate significance at the 0.01, 0.05, and 0.1 level, respectively.
Economics Working Papers
2015-25: John Kennes and John Knowles: Liberalization of Birth Control and
the Unmarried Share of Births - Evidence from Single Mothers in the
Marriage Market
2015-26: Benjamin Friedrich: Trade Shocks, Firm Hierarchies and Wage
Inequality
2015-27: Kenneth Lykke Sørensen: Active Labor Market Programs and
Reservation Wages: Its a Hazard
2016-01: Alexander K. Koch and Julia Nafziger: Correlates of Narrow
Bracketing
2016-02: John Kennes and Daniel le Maire: Competing Auctions of Skills
2016-03: Mette Trier Damgaard and Christina Gravert: The hidden costs of
nudging: Experimental evidence from reminders in fundraising
2016-04: Sylvanus Kwaku Afesorgbor and Renuka Mahadevan: The Impact of
Economic Sanctions on Income Inequality of Target States
2016-05: Martin Paldam and Erich Gundlach: Jumps into democracy: The
transition in the Polity Index
2016-06: Erich Gundlach and Martin Paldam: Socioeconomic transitions as
common dynamic processes
2016-07: Rune V. Lesner: Testing for Statistical Discrimination based on
Gender
2016-08: Rune V. Lesner: The Long-Term Effect of Childhood Poverty
2016-09: Sylvanus Kwaku Afesorgbor: Economic Diplomacy in Africa: The
Impact of Regional Integration versus Bilateral Diplomacy on Bilateral
Trade
2016-10: John Kennes and Daniel le Maire: On the equivalence of buyer and
seller proposals within canonical matching and pricing environments
2016-11: Ritwik Banerjee, Nabanita Datta Gupta and Marie Claire Villeval: The
Spillover Effects of Affirmative Action on Competitiveness and