Page 1
Scripta Materialia 201 (2021) 113975
Contents lists available at ScienceDirect
Scripta Materialia
journal homepage: www.elsevier.com/locate/scriptamat
Work hardening discrepancy designing to strengthening gradient
nanotwinned Cu
Tao Wan
a , b , 1 , Zhao Cheng
a , 1 , Linfeng Bu
a , c , Lei Lu
a , 2 , ∗
a Shenyang National Laboratory for Materials Science, Institute of Metal Research, Chinese Academy of Sciences, Shenyang 110016, China b School of Materials Science and Engineering, University of Science and Technology of China, Shenyang 110016, China c CAS Key Laboratory of Mechanical Behavior and Design of Materials, Department of Modern Mechanics, CAS Center for Excellence in Complex System
Mechanics, University of Science and Technology of China, Hefei 230027, China
a r t i c l e i n f o
Article history:
Received 20 January 2021
Revised 29 March 2021
Accepted 23 April 2021
Keywords:
Gradient nanotwinned Cu
Work hardening discrepancy
Extra strengthening
Strain delocalization
Elastic-plastic transition
a b s t r a c t
This study investigates the mechanical behaviors of sandwiched gradient nanotwinned (GNT) Cu designed
by only changing the soft component in the central layer with a fixed hard component at its surface. We
found that as the work hardening discrepancy of components increases, both the strengthening and work
hardening of GNT Cu increase simultaneously, producing a better strength-ductility synergy compared to
their freestanding components. The optimized mechanical properties are results of the promoted strain
delocalization, prolonged elastic-plastic transition, and larger strain gradient, which induces more geo-
metrically necessary dislocations (GNDs) at the interfaces.
© 2021 Acta Materialia Inc. Published by Elsevier Ltd. All rights reserved.
t
c
r
t
t
s
d
t
g
p
d
c
d
a
s
g
e
[
a
p
g
a
d
t
t
c
i
T
s
b
t
t
t
u
w
c
t
w
h
1
Gradient nanostructured (GNS) metallic materials [1] with spa-
ially gradient microstructures ranging from nanometers to mi-
rometers have attracted extensive attentions due to their supe-
ior mechanical properties such as high strength [2] , good duc-
ility [3–6] , and considerable work hardening [ 2 , 7 , 8 ] compared
o their counterparts with homogeneous and/or randomly mixed
tructures.
Generally, this built-in structural gradient is regarded to mainly
epend on the difference of either yield strength or hardness be-
ween the different com ponents. According to the existing strain
radient plasticity theory [9–11] , the plastic strain gradient and
rogressive plastic yielding (due to the strength difference) of gra-
ient microstructures are accompanied with the emitting and ac-
umulation of dislocations, especially the geometrically necessary
islocations (GNDs) [ 9 , 12–14 ], resulting in an extra strengthening
nd work hardening [15–18] . For example, hardness gradient [2] or
trength gradient [19] is quantitatively characterized as structural
radient in gradient nanotwinned (GNT) Cu samples with differ-
nt gradient distributions of nanoscale twin thicknesses. Studies
2 , 19 ] showed that a concomitant increase in hardness/strength
∗ Corresponding author.
E-mail address: [email protected] (L. Lu). 1 These authors contributed equally to this work. 2 Lei Lu was an Editor of the journal during the review period of the article. To
void a conflict of interest, Lei Lu was blinded to the record and another editor
rocessed this manuscript.
t
n
e
2
H
ttps://doi.org/10.1016/j.scriptamat.2021.113975
359-6462/© 2021 Acta Materialia Inc. Published by Elsevier Ltd. All rights reserved.
radient is often accompanied by a marked increase in strength
nd work hardening. In particular, typical bundles of concentrated
islocations (BCDs) along the gradient direction form to suppress
he strain/stress localization in the grain interiors. These BCDs con-
ribute to ideal large plastic strains of GNT Cu.
As a matter of fact, besides the hardness/strength discrepancy,
omponents in GNS metals also vary greatly in ductility; and more
mportantly, ductility and strength generally inversely behave [ 2 , 7 ].
he co-deformation of gradient structure depends greatly on both
trength and ductility. To some extent, work hardening builds a
ridge for both strength and ductility of materials [20] . However,
he effect of work hardening discrepancy, which could represent
he plastic incompatibility between components, on the deforma-
ion behaviors and strengthening mechanism of GNS metals is still
nknown.
In this study, a series of two-components sandwiched GNT Cu,
hich have a fixed hard component on the surface while the soft
entral components changed with different work hardening abili-
ies, are designed and fabricated under good control. The effect of
ork hardening discrepancy on tensile properties, elastic-to-plastic
ransitions, as well as deformation mechanisms are clarified.
As reported in the previous study [2] , four individual homoge-
ous nanotwinned (HNT) Cu are fabricated using direct-current
lectrodeposition and keeping the electrolyte temperatures at 20,
5, 30, and 35 °C, respectively. These samples are referred to as
NT- A ©, B ©, C ©, and D ©. Taking the four HNT structures as basic
Page 2
T. Wan, Z. Cheng, L. Bu et al. Scripta Materialia 201 (2021) 113975
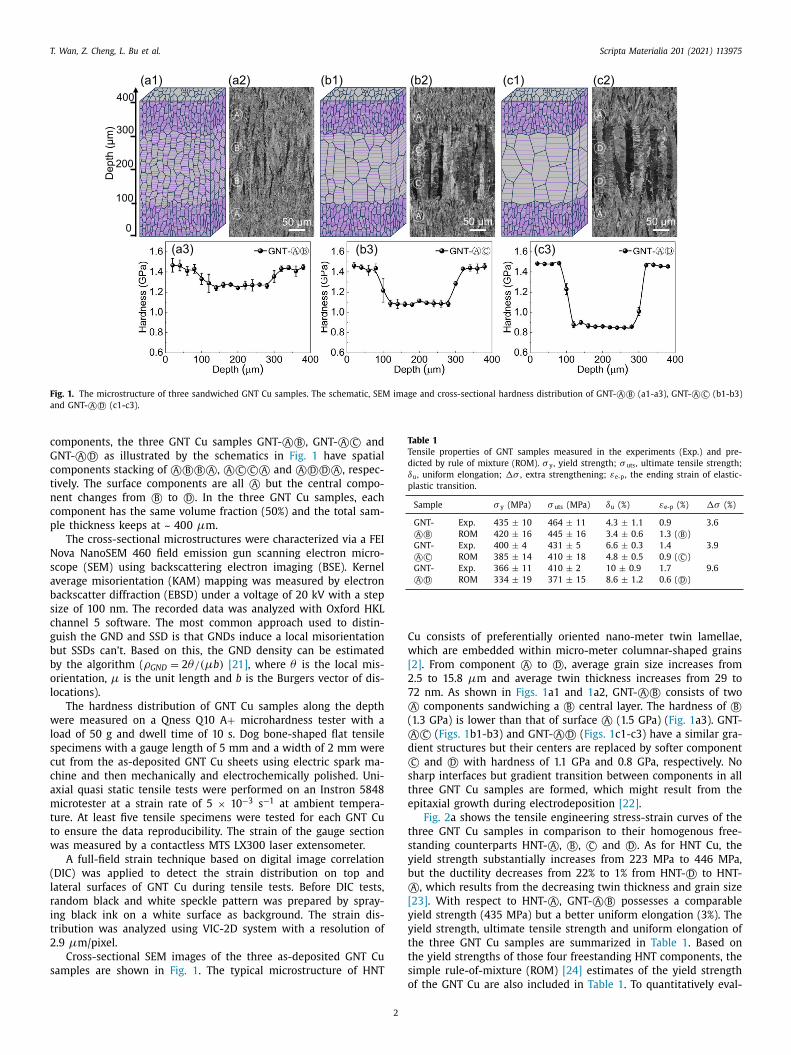
Fig. 1. The microstructure of three sandwiched GNT Cu samples. The schematic, SEM image and cross-sectional hardness distribution of GNT- A © B © (a1-a3), GNT- A © C © (b1-b3)
and GNT- A © D © (c1-c3).
c
G
c
t
n
c
p
N
s
a
b
s
c
g
b
b
o
l
w
l
s
c
c
a
m
t
t
w
(
l
r
i
t
2
s
Table 1
Tensile properties of GNT samples measured in the experiments (Exp.) and pre-
dicted by rule of mixture (ROM). σ y , yield strength; σ uts , ultimate tensile strength;
δu , uniform elongation; �σ , extra strengthening; εe-p , the ending strain of elastic-
plastic transition.
Sample σ y (MPa) σ uts (MPa) δu (%) εe-p (%) �σ (%)
GNT-
A © B ©Exp. 435 ± 10 464 ± 11 4.3 ± 1.1 0.9 3.6
ROM 420 ± 16 445 ± 16 3.4 ± 0.6 1.3 ( B ©)
GNT-
A © C ©Exp. 400 ± 4 431 ± 5 6.6 ± 0.3 1.4 3.9
ROM 385 ± 14 410 ± 18 4.8 ± 0.5 0.9 ( C ©)
GNT-
A © D ©Exp. 366 ± 11 410 ± 2 10 ± 0.9 1.7 9.6
ROM 334 ± 19 371 ± 15 8.6 ± 1.2 0.6 ( D ©)
C
w
[
2
7
©(
©d
©s
t
e
t
s
y
b
©[
y
y
t
t
s
omponents, the three GNT Cu samples GNT- A © B ©, GNT- A © C © and
NT- A © D © as illustrated by the schematics in Fig. 1 have spatial
omponents stacking of A © B © B © A ©, A © C © C © A © and A © D © D © A ©, respec-
ively. The surface components are all A © but the central compo-
ent changes from B © to D ©. In the three GNT Cu samples, each
omponent has the same volume fraction (50%) and the total sam-
le thickness keeps at ~ 400 μm.
The cross-sectional microstructures were characterized via a FEI
ova NanoSEM 460 field emission gun scanning electron micro-
cope (SEM) using backscattering electron imaging (BSE). Kernel
verage misorientation (KAM) mapping was measured by electron
ackscatter diffraction (EBSD) under a voltage of 20 kV with a step
ize of 100 nm. The recorded data was analyzed with Oxford HKL
hannel 5 software. The most common approach used to distin-
uish the GND and SSD is that GNDs induce a local misorientation
ut SSDs can’t. Based on this, the GND density can be estimated
y the algorithm ( ρGND = 2 θ/ (μb) [21] , where θ is the local mis-
rientation, μ is the unit length and b is the Burgers vector of dis-
ocations).
The hardness distribution of GNT Cu samples along the depth
ere measured on a Qness Q10 A + microhardness tester with a
oad of 50 g and dwell time of 10 s. Dog bone-shaped flat tensile
pecimens with a gauge length of 5 mm and a width of 2 mm were
ut from the as-deposited GNT Cu sheets using electric spark ma-
hine and then mechanically and electrochemically polished. Uni-
xial quasi static tensile tests were performed on an Instron 5848
icrotester at a strain rate of 5 × 10 −3 s −1 at ambient tempera-
ure. At least five tensile specimens were tested for each GNT Cu
o ensure the data reproducibility. The strain of the gauge section
as measured by a contactless MTS LX300 laser extensometer.
A full-field strain technique based on digital image correlation
DIC) was applied to detect the strain distribution on top and
ateral surfaces of GNT Cu during tensile tests. Before DIC tests,
andom black and white speckle pattern was prepared by spray-
ng black ink on a white surface as background. The strain dis-
ribution was analyzed using VIC-2D system with a resolution of
.9 μm/pixel.
Cross-sectional SEM images of the three as-deposited GNT Cu
amples are shown in Fig. 1 . The typical microstructure of HNT
o
2
u consists of preferentially oriented nano-meter twin lamellae,
hich are embedded within micro-meter columnar-shaped grains
2] . From component A © to D ©, average grain size increases from
.5 to 15.8 μm and average twin thickness increases from 29 to
2 nm. As shown in Figs. 1 a1 and 1 a2, GNT- A © B © consists of two
A components sandwiching a B © central layer. The hardness of B ©1.3 GPa) is lower than that of surface A © (1.5 GPa) ( Fig. 1 a3). GNT-
A C © ( Figs. 1 b1-b3) and GNT- A © D © ( Figs. 1 c1-c3) have a similar gra-
ient structures but their centers are replaced by softer component
C and D © with hardness of 1.1 GPa and 0.8 GPa, respectively. No
harp interfaces but gradient transition between components in all
hree GNT Cu samples are formed, which might result from the
pitaxial growth during electrodeposition [22] .
Fig. 2 a shows the tensile engineering stress-strain curves of the
hree GNT Cu samples in comparison to their homogenous free-
tanding counterparts HNT- A ©, B ©, C © and D ©. As for HNT Cu, the
ield strength substantially increases from 223 MPa to 446 MPa,
ut the ductility decreases from 22% to 1% from HNT- D © to HNT-
A , which results from the decreasing twin thickness and grain size
23] . With respect to HNT- A ©, GNT- A © B © possesses a comparable
ield strength (435 MPa) but a better uniform elongation (3%). The
ield strength, ultimate tensile strength and uniform elongation of
he three GNT Cu samples are summarized in Table 1 . Based on
he yield strengths of those four freestanding HNT components, the
imple rule-of-mixture (ROM) [24] estimates of the yield strength
f the GNT Cu are also included in Table 1 . To quantitatively eval-
Page 3
T. Wan, Z. Cheng, L. Bu et al. Scripta Materialia 201 (2021) 113975
Fig. 2. Engineering stress-strain curves (a) and work hardening rate, �, vs. true strain curves (b) of GNT- A © B ©, GNT- A © C © and GNT- A © D © in comparison to their HNT compo-
nents. The inset of (b) shows the work hardening rates at a true strain of 5% of HNT Cu. The endings of elastic-plastic transition are indicated by the intersections of work
hardening curves with the dash line at � = E /100 in (b), where E is Young’s modulus (120 GPa).
u
p
�
w
m
s
s
©
a
s
s
t
H
i
t
t
c
o
a
d
l
i
H
c
r
e
a
o
H
o
t
s
t
i
s
s
s
i
o
i
t
c
s
i
a
l
s
t
d
o
f
h
s
t
©m
t
s
t
t
p
d
o
t
G
[
B
t
p
l
t
i
[
d
m
s
g
s
d
a
t
e
i
e
i
s
ate the strengthening of GNT structures, an extra strengthening
arameter, �σ , is defined as follows:
σ=
σy − σROM
σROM
(1)
here σ y is the measured yield strength and σ ROM
is the esti-
ated strength by ROM. As expected, all GNT Cu exhibit extra
trengthening behaviors relative to the HNT samples. The extra
trengthening increases from 3.6% to 9.6% as for GNT- A © B © to GNT-
A D ©.
Work hardening rate curves of both HNT and GNT Cu samples
re shown in Fig. 2 b. Obviously, we see two typical work hardening
tages: the elastic-plastic transition stage with a steep decrease at
mall strain (less than ~2%) and the steady-state stage with a gen-
le decrease at larger stain. Compared to other HNT Cu samples,
NT- A © has no obvious steady-state work hardening stage. Accord-
ng to the description of work hardening stage in [20] , the elastic
o plastic transition stage of ploy-crystalline metals can be charac-
erized by the work hardening rate � of E /25 to E /100. Here we
hoose the lower limit value ( E /100) to define the ending strain
f elastic-plastic stage, ε e-p . The ε e-p of HNT and GNT Cu samples
re presented in Fig. 2 and Table 1 . From HNT- B © to HNT- D ©, εe-p
ecreases from 1.3% to 0.6% while the work hardening ability at
arge strain increases. From the inset in Fig. 2 b, the work harden-
ng rate at a true strain of 5% increases from 0 to 568 MPa for
NT- A © to HNT- D ©, which indicates the vast work hardening dis-
repancy among different components.
The work hardening behaviors of GNT Cu samples are uniquely
elated to HNT Cu samples, as shown in Fig. 2 b. The work hard-
ning curve with εe-p = 0.9% of GNT- A © B © lies between HNT- A ©nd HNT- B ©. Interestingly, εe-p increases to 1.4% (higher than that
f HNT- C ©) of GNT- A © C © and up to 1.7% (even higher than that of
NT- D ©) of GNT- A © D ©. More importantly, the work hardening rates
f GNT- A © C © and A © D © are still higher than those of their soft cen-
ral components at large strain stage. The above experimental re-
ults clearly show that a larger work hardening discrepancy be-
ween the two components results in a stronger extra strengthen-
ng and a higher work hardening in GNT structures.
To understand the effect of work hardening discrepancy on
trengthening and work hardening of GNT Cu, we performed in-
itu strain distribution DIC experiments on both top and lateral
urfaces of GNT Cu samples, as presented in Figs. 3 and 4 . Fig. 3 a
llustrates the distribution of tensile strain εx on the top surface
f GNT Cu. As for GNT- A © B © ( Figs. 3 b 1 -b 3 ), the strain distribution
s quite uniform at a small strain ( εapp = 0.5%); but at εapp = 2%,
he strain distribution becomes heterogeneous, and a severe strain
oncentration ( > 3%) is detected at a small region in the gauge
ection. As the applied strain increases up to 4%, strain localization
3
s further intensified. The strain localization of GNT- A © C © is much
lleviated compared to that of GNT- A © B ©. Interestingly, the strain
ocalization in GNT- A © D © is almost disappeared at εapp = 4%, as
hown in Figs. 3 d 1 -d 3 . The results suggest that the strain localiza-
ion of GNT Cu is effectively suppressed by a larger work hardening
iscrepancy between components.
Fig. 4 a shows similar strain distributions on the lateral surfaces
f the three GNT Cu samples. Considering the gradient plastic de-
ormation accompanied with progressively yielding from soft to
ard components, we choose a small strain at ε = 1% to study the
train distributions. No obvious difference of strain along sample
hickness, εz , between surface and center can be detected in GNT-
A B © or GNT- A © C ©. By contrast, it can be seen that εz of center is
uch larger than that of surface in GNT- A © D ©. To further quanti-
atively evaluate the strain distribution, the average εz profiles are
hown in Fig. 4 b. For three GNT Cu samples, εz is larger in center
han that at its surface, originating from the larger tensile plas-
ic strain of center (due to the lower yield strength) with a larger
lastic Poisson’s ratio (~0.5) [25] . From GNT- A © B © to GNT- A © D ©, the
ifference of εz between surface and central or the strain gradient
f the whole sample increases substantially, also consistent with
he larger yield strength difference.
Physically, the strain gradient in heterogenous structure needs
NDs to accommodate the incompatibility of plastic deformation
9–11] . As reported in 4-components GNT Cu samples in [2] , extra
CDs as potential GND configurations are formed to accommodate
he gradient deformation. However, the sandwiched GNT Cu sam-
les in this study are almost BCDs free, even in GNT- A © D © with the
argest strain gradient, as shown in Fig. 4 c. This is possibly because
he structural gradients of these sandwiched GNT Cu sample are
nsufficiently large, comparing to that of 4-components GNT Cu in
2] .
Still taking the GNT- A © D © as example, we measured the GNDs
istribution across the interface between A © and D © components by
eans of EBSD, as shown in Fig. 4 d. The distribution of GND den-
ity reaches a peak at the interface, which is consistent with the
radient transition region in Fig. 1 c. The GND density of A © (with
maller twin thickness and grain size) is higher than that of D ©,
ue to more grain boundaries and twin boundaries emitting and
ccumulating the GNDs [9] . The GND density gradient and peak in
he sandwiched GNT Cu are consistent with the results in the het-
rogenous Cu/bronze laminates [26] , where GNDs pile up near the
nterface-affected zone (IAZ).
The above experimental results clearly indicate that work hard-
ning discrepancy between components has a significant influence
n the strengthening effect and deformation behaviors of GNT Cu
amples. The strain localization of GNT Cu can be effectively sup-
Page 4
T. Wan, Z. Cheng, L. Bu et al. Scripta Materialia 201 (2021) 113975
Fig. 3. (a) Illustrates measurement of strain distribution on top surfaces of GNT Cu. The distribution of tensile strain, εx , on surface of GNT- A © B © (b1-b3), GNT- A © C © (c1-c3)
and GNT- A © D © (d1-d3) at different applied tensile strains, εapp .
Fig. 4. Local strain distribution mapping on lateral surface (a) and corresponding profiles of average local lateral strain, εz , (b) of GNT- A © B ©, GNT- A © C © and GNT- A © D © at
εapp = 1%. (c) SEM image of D © in GNT- A © D © at εapp = 1%. (d) GND density mapping and average GND density variation across the interface of GNT- A © D © at εapp = 1%.
p
t
c
u
g
i
©©s
m
t
The strain delocalization can also be understood in terms of the
ressed not only in the elastic-plastic transition stage but also in
he plastic deformation stage by increasing work hardening dis-
repancy. For HNT Cu samples, the elastic to plastic transition is
ndertaken from soft grains (with favorable orientations) to hard
rains. However, in GNT Cu, the additional elastic-plastic transition
s sustained by the progressive yielding from soft components ( B ©,
4
C or D ©) to hard component ( A ©), indicating the hard component
A determines εe-p . Component A © has a limited ductility in free-
tanding sate, corresponding to the early strain localization or pre-
ature necking [ 27 , 28 ], but has a larger uniform elongation due
o the alleviated strain localization when stacked in GNT structure.
Page 5
T. Wan, Z. Cheng, L. Bu et al. Scripta Materialia 201 (2021) 113975
c
p
n
a
c
p
i
h
a
s
t
s
m
c
w
m
f
c
s
p
m
D
c
i
A
r
a
a
C
X
N
b
N
R
[
[[
[
[[
[
[
[
[
[
[
[
onstraint between two components: the high work hardening ca-
acity of soft component compensates for that of the hard compo-
ent to keep the overall GNT Cu sample more stable and the GNDs
t interface provide additional work hardening [ 16 , 26 ].
As shown in Figs. 2 (b) and 3, the larger work hardening dis-
repancy increasingly suppresses the strain localization and im-
roves the deformation stability. The suppressed strain localization
n GNT structure can promote hard component A © to undertake
igher stress, which accordingly enhances yield strength of GNT Cu
nd prolongs the elastic to plastic transition at initial deformation
tage. Such suppressed strain localization and damage accumula-
ion are beneficial to the GNDs induced strengthening [29] and the
uperior fatigue resistance, as observed in gradient nanostructured
etals under cyclic loading [ 30 , 31 ], compared to its homogeneous
ounterparts.
In summary, we designed a series of gradient nanotwinned Cu
ith varying work hardening discrepancy and investigated their
echanical properties. An important insight from this study shows,
or the first time, that as the work hardening discrepancy in-
reases, the strengthening and work hardening of GNT Cu increase
imultaneously with promoted strain delocalization. This finding
rovides an additional strategy to develop high-performance GNS
etals.
eclaration of Competing Interest
The authors declare that they have no known competing finan-
ial interests or personal relationships that could have appeared to
nfluence the work reported in this paper.
cknowledgments
The authors acknowledge financial support by National Natu-
al Science Foundation of China (NSFC, Grant Numbers. U1608257
nd 51931010 ), the Key Research Program of Frontier Science
nd International partnership program (Grant Number. GJHZ2029 ),
AS, and LiaoNing Revitalization Talents Program (Grant Number.
LYC1802026 ). Z.C. acknowledges support by Project Funded by
ational Natural Science Foundation of China (NSFC, Grant Num-
er. 52001312 ) and China Postdoctoral Science Foundation (Grant
umber. BX20190336 and 2019M661150 ).
5
eferences
[1] X. Li , L. Lu , J. Li , X. Zhang , H. Gao , Nat. Rev. Mater. 5 (2020) 706–723 .
[2] Z. Cheng , H.F. Zhou , Q.H. Lu , H.J. Gao , L. Lu , Science 362 (6414) (2018) 559 - + .
[3] T.H. Fang , W.L. Li , N.R. Tao , K. Lu , Science 331 (6024) (2011) 1587–1590 . [4] Y. Lin , J. Pan , H.F. Zhou , H.J. Gao , Y. Li , Acta Mater 153 (2018) 279–289 .
[5] A. Jérusalem , W. Dickson , M.J. Pérez-Martín , M. Dao , J. Lu , F. Gálvez , Scr. Mater.69 (11-12) (2013) 773–776 .
[6] H.T. Wang , N.R. Tao , K. Lu , Scr. Mater. 68 (1) (2013) 22–27 . [7] X. Wu , P. Jiang , L. Chen , F. Yuan , Y.T. Zhu , Proc. Natl. Acad. Sci. U. S. A. 111 (20)
(2014) 7197–7201 .
[8] C.W. Shao , P. Zhang , Y.K. Zhu , Z.J. Zhang , Y.Z. Tian , Z.F. Zhang , Acta Mater 145(2018) 413–428 .
[9] M.F. Ashby , Philos. Mag. 21 (170) (1970) 399–424 . [10] N.A. Fleck , G.M. Muller , M.F. Ashby , J.W. Hutchinson , Acta Metall. Mater. 42 (2)
(1994) 475–7487 . [11] H. Gao , Y. Huang , W.D. Nix , J.W. Hutchinson , J. Mech. Phys. Solids 47 (6) (1999)
1239–1263 . 12] Z. Zeng , X. Li , D. Xu , L. Lu , H. Gao , T. Zhu , Extreme Mech. Lett. 8 (2016)
213–219 .
[13] L.P. Kubin , A. Mortensen , Scr. Mater. 48 (2002) 119–125 . [14] H. Gao , Y. Huang , Scr. Mater. 48 (2) (2003) 113–118 .
[15] Y. Zhu , X. Wu , Mater. Res. Lett. 7 (10) (2019) 393–398 . [16] N.A. Fleck , M.F. Ashby , J.W. Hutchinson , Scr. Mater. 48 (2) (2003) 179–183 .
[17] C.W. Sinclair , G. Saada , J.D. Embury , Philos. Mag. 86 (25-26) (2006) 4081–4098 .[18] Y.F. Wang , C.X. Huang , M.S. Wang , Y.S. Li , Y.T. Zhu , Scr. Mater. 150 (2018) 22–25 .
[19] Y. Zhang , Z. Cheng , L. Lu , T. Zhu , J. Mech. Phys. Solids 140 (2020) 103946 .
20] U.F. Kocks , H. Mecking , Prog. Mater. Sci. 48 (3) (2003) 171–273 . 21] X. Ma , C. Huang , J. Moering , M. Ruppert , H.W. Höppel , M. Göken , J. Narayan ,
Y. Zhu , Acta Mater 116 (2016) 43–52 . 22] E. Chassaing , R. Wiart , Electrochim. Acta 29 (1984) 649–660 .
23] Z.S. You , L. Lu , K. Lu , Acta Mater. 59 (18) (2011) 6927–6937 . 24] S.L. Semiatin , H.R. Piehler , Metall. Trans. A 10 (1) (1979) 85–96 .
25] C.W. Bert , E.J. Mills , W.S. Hyler , J. Basic Eng. 89 (1) (1967) 35–39 .
26] C.X. Huang , Y.F. Wang , X.L. Ma , S. Yin , H.W. Höppel , M. Göken , X.L. Wu ,H.J. Gao , Y.T. Zhu , Mater. Today 21 (7) (2018) 713–791 .
27] F. Yuan , D. Yan , J. Sun , L. Zhou , Y. Zhu , X. Wu , Mater. Res. Lett. 7 (1) (2019)12–17 .
28] M. Goto , S.Z. Han , J. Kitamura , T. Yakushiji , J.H. Ahn , S.S. Kim , M. Baba , T. Ya-mamoto , J. Lee , Int. J. Fatigue 73 (2015) 98–109 .
29] Y. Wang , C. Huang , Z. Li , X. Fang , M. Wang , Q. He , F. Guo , Y. Zhu , Extreme
Mech. Lett. 37 (2020) 100686 . 30] L. Yang , N.R. Tao , K. Lu , L. Lu , Scr. Mater. 68 (10) (2013) 801–804 .
31] J. Long , Q. Pan , N. Tao , M. Dao , S. Suresh , L. Lu , Acta Mater. 166 (2019) 56–66 .