Project Dashboard.doc Page 1 of 10 Work Instruction Project Dashboard Purpose The purpose of this module is to provide an overview of how to use the Project Dashboard in the MIP, including searching for projects based on: • Geographic Area • Project Level • Project Health This work instruction displays screens for a Studies project, but the process to navigate the Project Dashboard is applicable for Revisions and Amendments projects as well. The work instruction highlights any changes between the Studies and Revisions and Amendments functionality. Prerequisites None Navigation Via Menu Path Log in to the MIP > Workbench and Project Dashboard
Transcript
Project Dashboard.doc Page 1 of 10
Work Instruction Project Dashboard
Purpose
The purpose of this module is to provide an overview of how to use the Project Dashboard in the MIP, including searching for projects based on:
• Geographic Area• Project Level• Project Health
This work instruction displays screens for a Studies project, but the process to navigate the Project Dashboard is applicable for Revisions and Amendments projects as well. The work instruction highlights any changes between the Studies and Revisions and Amendments functionality.
Prerequisites None
Navigation Via Menu Path Log in to the MIP > Workbench
and
Project Dashboard
Project Dashboard.doc Page 2 of 10
Work Steps
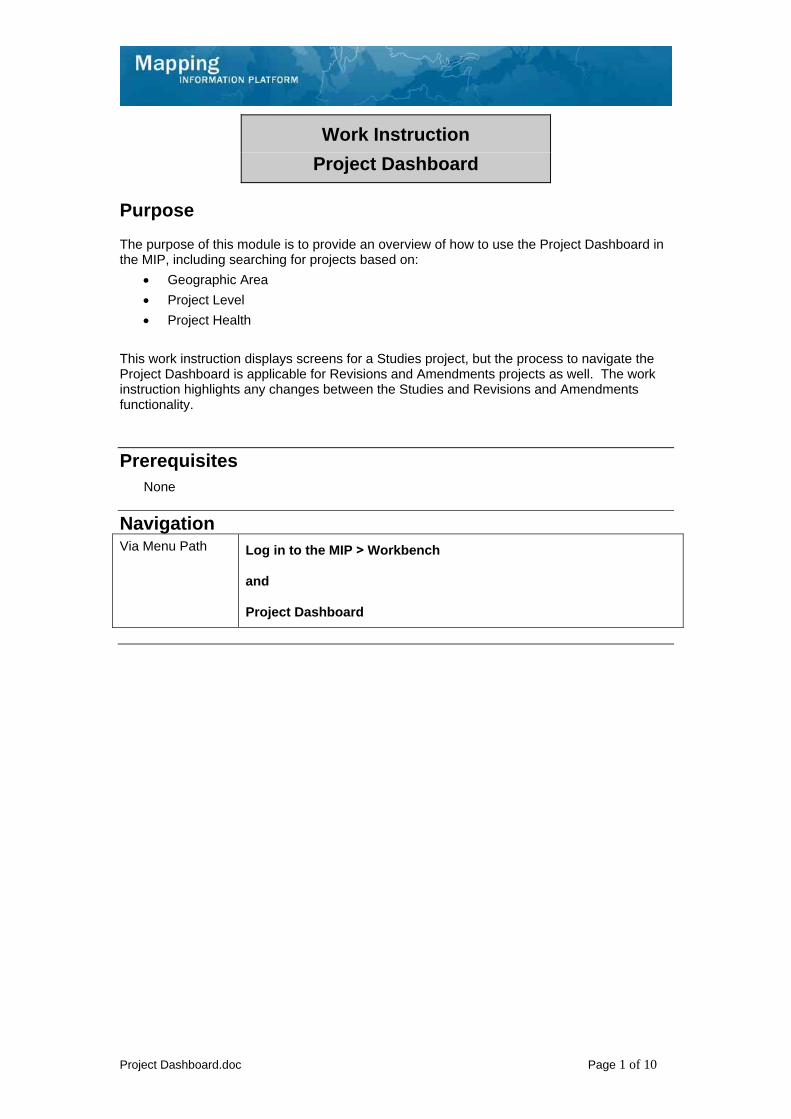
1. Log in to the MIP and click the Workbench tab
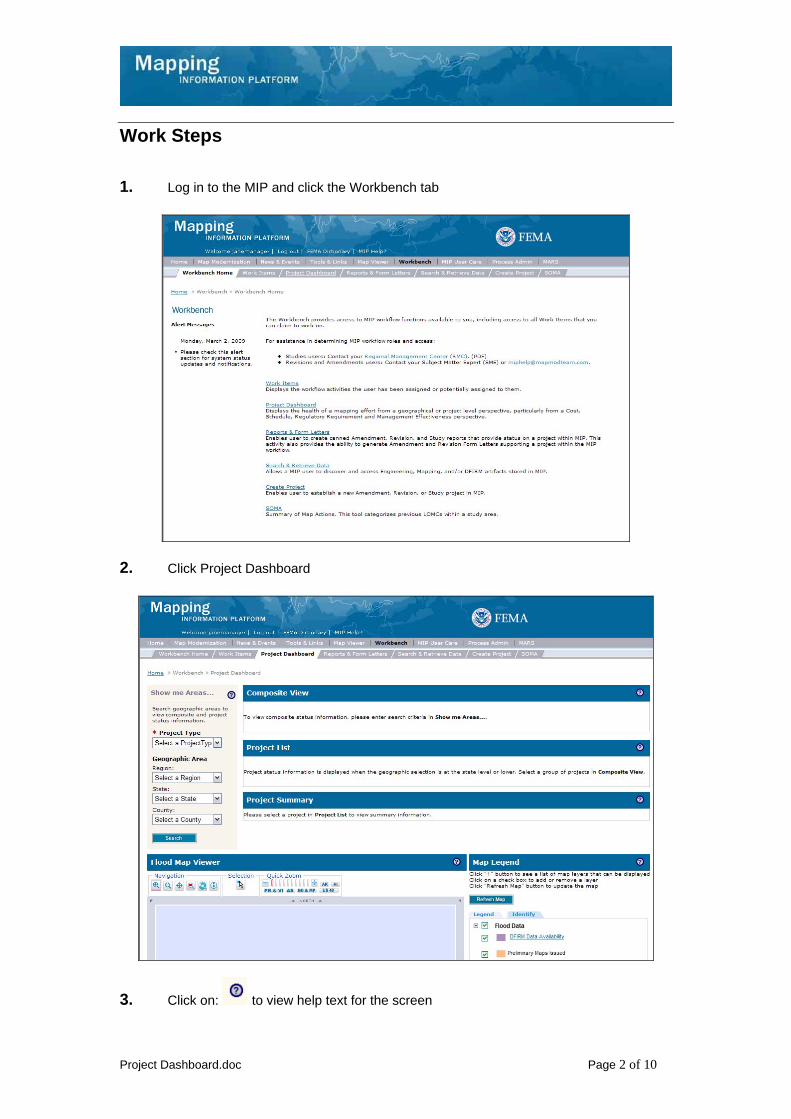
2. Click Project Dashboard
3. Click on: to view help text for the screen
Project Dashboard.doc Page 3 of 10
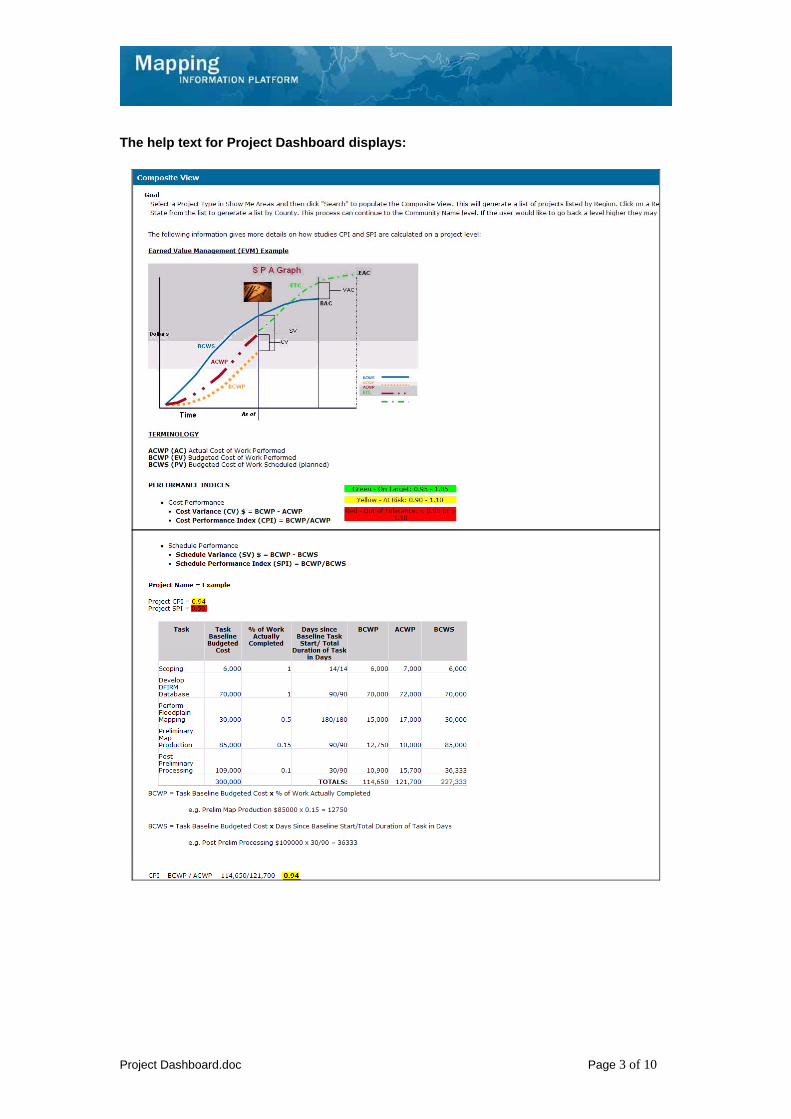
The help text for Project Dashboard displays:
Project Dashboard.doc Page 4 of 10
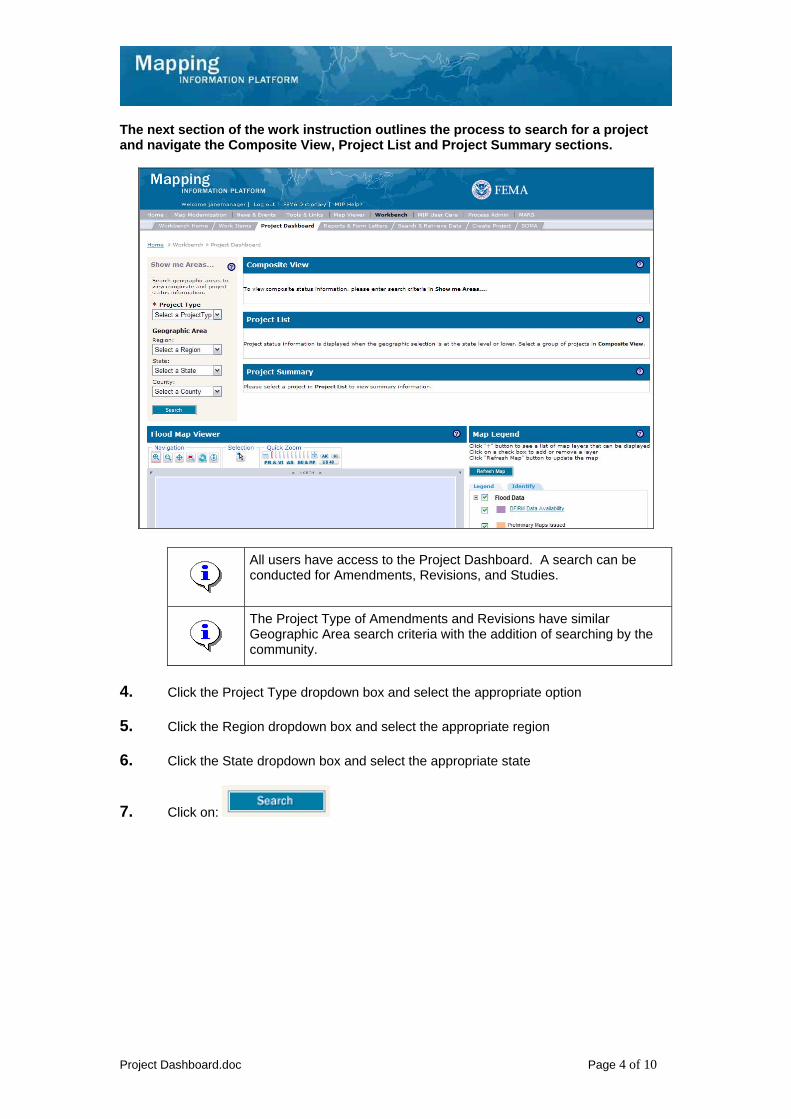
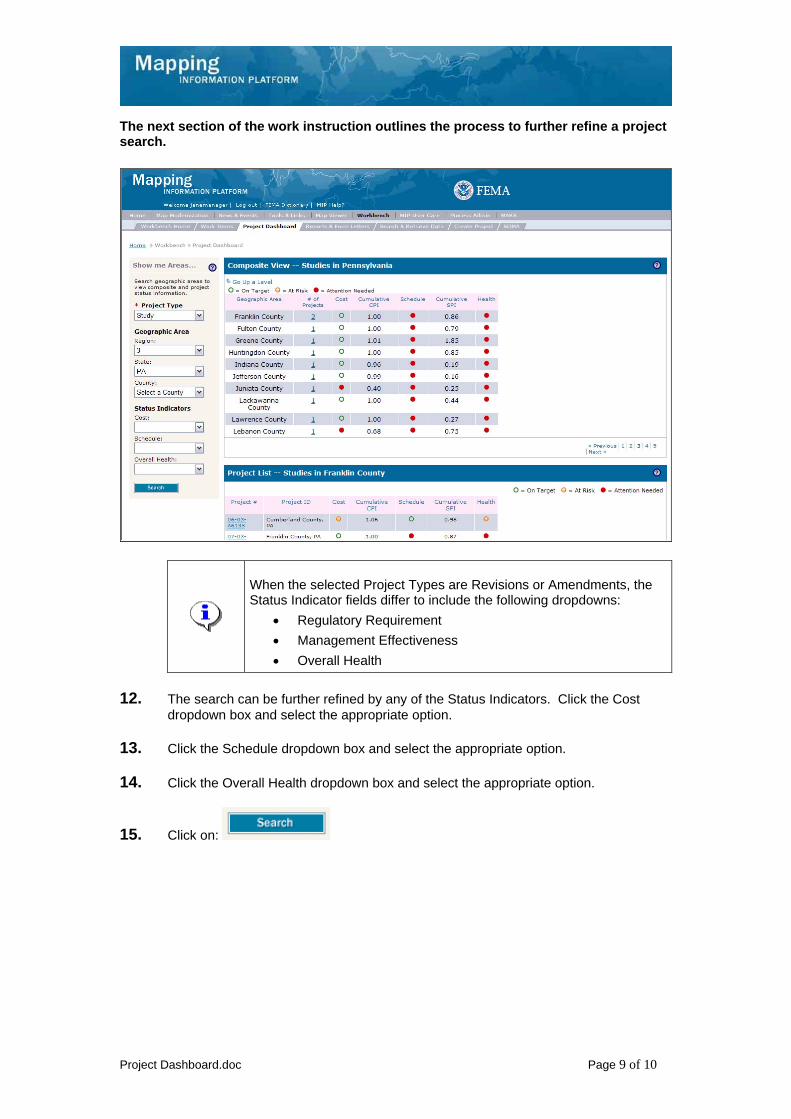
The next section of the work instruction outlines the process to search for a project and navigate the Composite View, Project List and Project Summary sections.
All users have access to the Project Dashboard. A search can be conducted for Amendments, Revisions, and Studies.
The Project Type of Amendments and Revisions have similar Geographic Area search criteria with the addition of searching by the community.
4. Click the Project Type dropdown box and select the appropriate option
5. Click the Region dropdown box and select the appropriate region
6. Click the State dropdown box and select the appropriate state
7. Click on:
Project Dashboard.doc Page 5 of 10
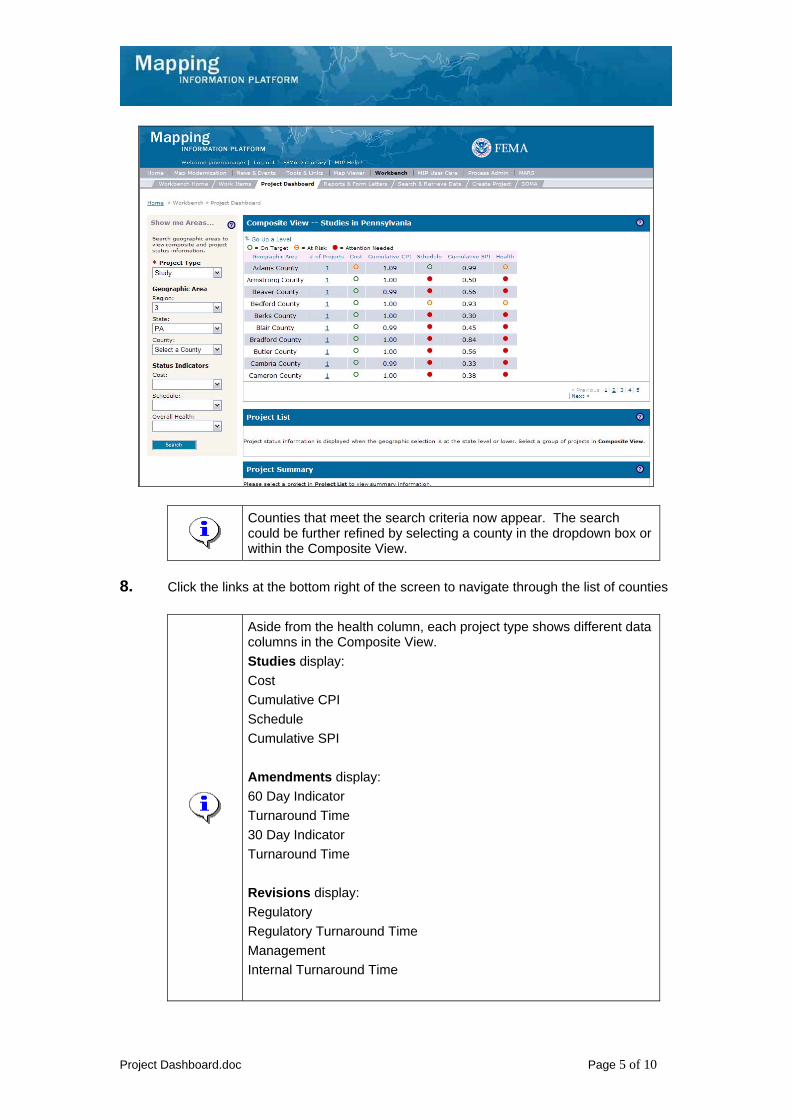
Counties that meet the search criteria now appear. The search could be further refined by selecting a county in the dropdown box or within the Composite View.
8. Click the links at the bottom right of the screen to navigate through the list of counties
Aside from the health column, each project type shows different data columns in the Composite View. Studies display: Cost Cumulative CPI Schedule Cumulative SPI Amendments display: 60 Day Indicator Turnaround Time 30 Day Indicator Turnaround Time Revisions display: Regulatory Regulatory Turnaround Time Management Internal Turnaround Time
Project Dashboard.doc Page 6 of 10
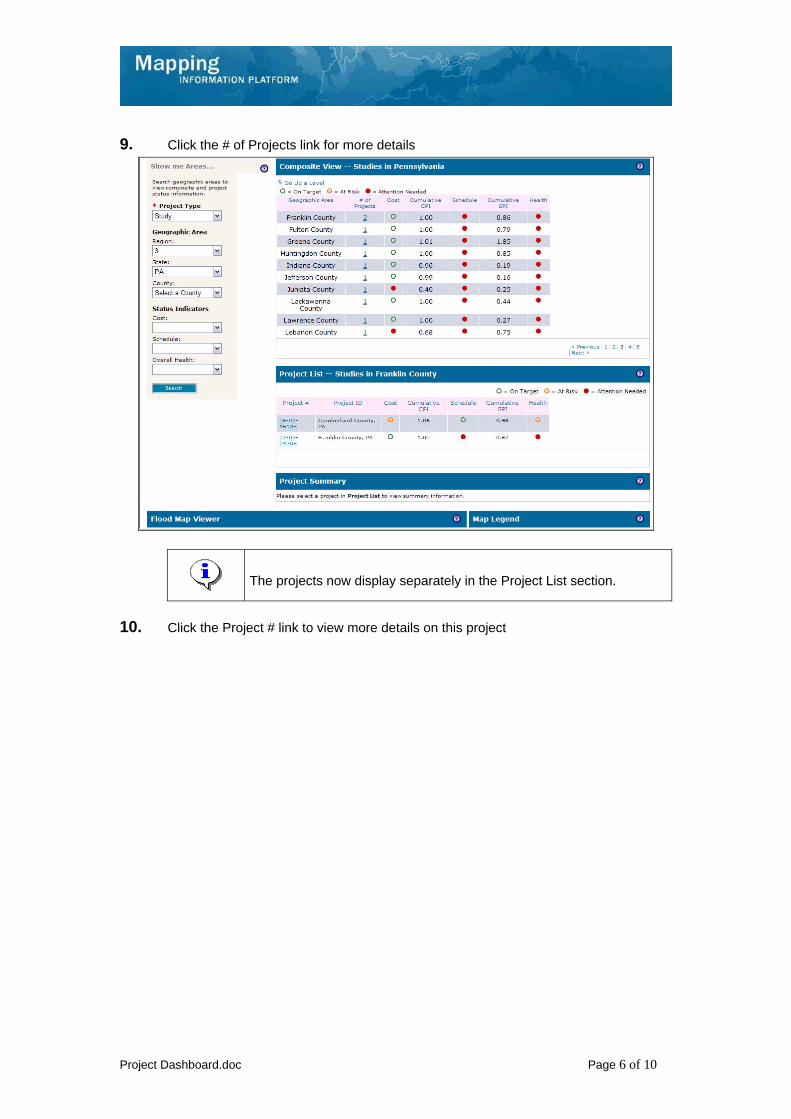
9. Click the # of Projects link for more details
The projects now display separately in the Project List section.
10. Click the Project # link to view more details on this project
Project Dashboard.doc Page 7 of 10
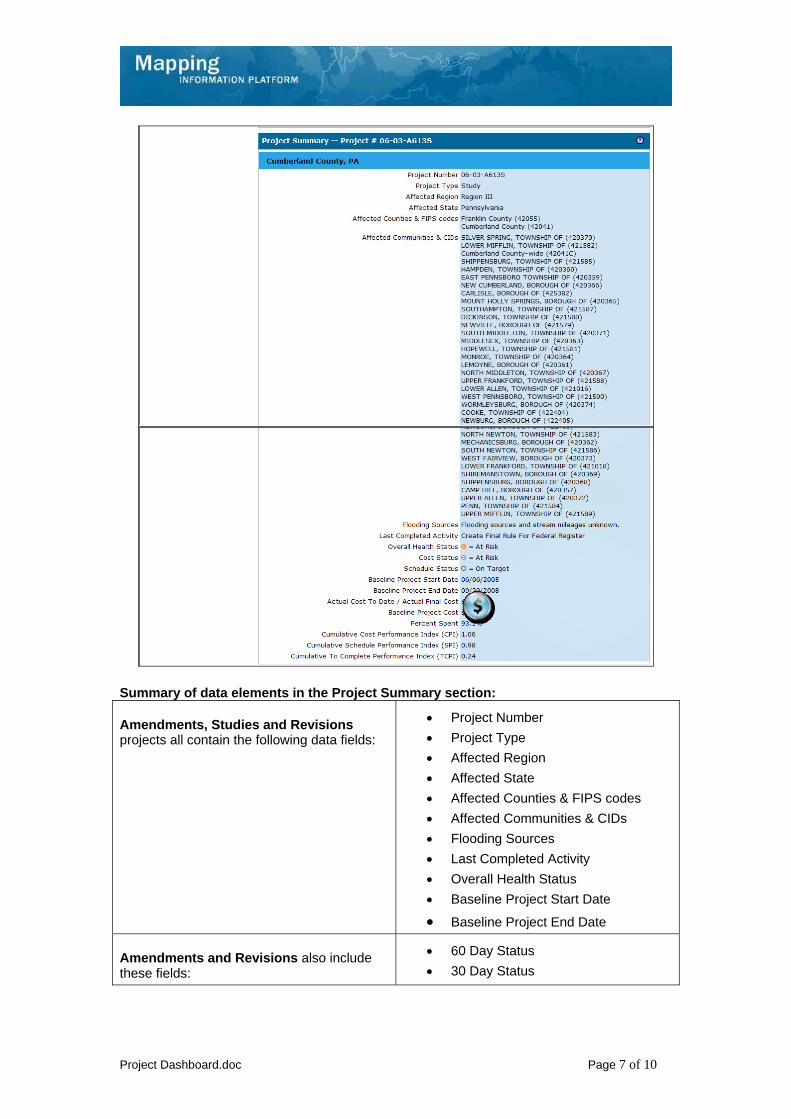
Summary of data elements in the Project Summary section:
Amendments, Studies and Revisions projects all contain the following data fields:
• Project Number • Project Type • Affected Region • Affected State • Affected Counties & FIPS codes • Affected Communities & CIDs • Flooding Sources • Last Completed Activity • Overall Health Status • Baseline Project Start Date
• Baseline Project End Date
Amendments and Revisions also include these fields:

![First bank dashboard project [ragavi sinniah- 20065148]](https://static.documents.pub/doc/80x56/55c8e349bb61eb616b8b4775/first-bank-dashboard-project-ragavi-sinniah-20065148.jpg)


