Page 1
Work-Life Balance versus
Work-Life Merge:
A Comparative Analysis of
Psychological Well-Being in
Today’s Workplace
Jennifer Sharkey
Submitted in partial fulfilment of the requirements of the BA Hons in Psychology at
Dublin Business School, School of Arts, Dublin
Supervisor: Dr Barbara Caska
March 2019
Department of Psychology
Dublin Business School
Page 2
1
Table of Contents
Declaration page .......................................................................................................................... 2
Acknowledgements ...................................................................................................................... 3
ABSTRACT ................................................................................................................................ 4
INTRODUCTION ..................................................................................................................... 5
Work-life balance ......................................................................................................................... 5
Work-life merge ........................................................................................................................... 6
Flexibility in the workplace ......................................................................................................... 7
Stress in the workplace ................................................................................................................ 8
Job & life satisfaction ................................................................................................................ 10
The role of organisations ........................................................................................................... 11
Rationale for this study .............................................................................................................. 14
The three hypotheses .................................................................................................................. 14
The three qualitative questions .................................................................................................. 15
METHODOLOGY .................................................................................................................. 16
Participants ................................................................................................................................ 16
Design ........................................................................................................................................ 16
Materials .................................................................................................................................... 17
Procedure ................................................................................................................................... 20
Ethics ......................................................................................................................................... 20
Data analysis ............................................................................................................................. 21
RESULTS ................................................................................................................................. 22
Descriptive statistics .................................................................................................................. 22
Inferential statistics .................................................................................................................... 26
Qualitative thematic analysis ..................................................................................................... 29
DISCUSSION ........................................................................................................................... 46
REFERENCES ......................................................................................................................... 50
APPENDICES .......................................................................................................................... 56
Page 3
2
Declaration page
‘I declare that this thesis that I have submitted to Dublin Business School for the award of BA
(Hons) Psychology is the result of my own investigations, except where otherwise stated, where
it is clearly acknowledged by references. Furthermore, this work has not been submitted for any
other degree.’
Signed: Jennifer Sharkey
Student Number: 10332823
Date: 21st March 2019
Page 4
3
Acknowledgements
I would like to thank my supervisor, Dr Barbara Caska, for her valuable critique and input in
helping me put this thesis together. I would also like to thank Dr Pauline Hyland for her
informative preparatory lectures and research manual, both of which acted as a most welcome
roadmap. I would also like to thank Mr Michael Nolan for his kind assistance in helping me
locate any elusive research papers. My thanks also to Trevor and all the library staff for
providing such a great support service and willingness to help. Last, but not least, I would like
to thank my family and friends, including new friends in the form of my fellow DBS
undergrads, all of whom have supported, encouraged and cheered me on throughout this
challenging but rewarding process.
Jennifer Sharkey
March 2019
“Our deepest fear is not that we are inadequate.
Our deepest fear is that we are powerful beyond measure.
It is our light, not our darkness, that most frightens us.”
- Marianne Williamson, 1992
Page 5
4
ABSTRACT
The aim of this mixed-methods research study was to test the traditional concept of
work-life balance which suggests workers can experience better well-being by
being able to psychologically switch on and off. Participants were 133 full-time
workers split between those that worked solely from their workplace and those that
worked from a combination of their workplace and home. Each participant
completed quantitative online surveys that measured their perceived stress, life
satisfaction and job satisfaction levels. In their own words, they also answered
qualitative questions about how their jobs impacted their lives, what they would
change and what motivates them. Results found participants who worked from a
combination of the workplace and home had significantly greater job and life
satisfaction levels than their workplace-based counterparts. Conclusions drawn
suggest there is real merit in offering flexible constructs to today’s Information Age
workers in order to harvest better psychological well-being in the workplace.
Page 6
5
INTRODUCTION
Work-life balance
The concept of work-life balance (WLB) has been a focus of Organisational
Psychologists since the 1990s (Cooper & Cartwright, 1994) but it was not until the turn of the
millennium that research into this area started in earnest (Warren, 2015; Chang, McDonald &
Burton, 2010; Hughes & Bozionelos, 2007; Gambles, Lewis & Rapoport, 2006). Researchers
have focused on a viewpoint that workers can successfully achieve WLB once they have clearly
defined hours of work, effectively allowing them to psychologically switch on and off
(Warhurst, Eikhof & Haunschild, 2008; Messersmith, 2007;). WLB is characterised by
achieving a state of balance, where the demands of a person’s occupation and personal life are
equivalent i.e. the splitting of equal measures of time and energy between work and home life
(Gyanchandani, 2017). However, the validity of the traditional WLB viewpoint has been called
into question (Warhurst et al., 2008) and even the use of the term balance has been subjected to
criticism by some scholars (Day, Kelloway & Hurrell, 2014) who see it as misleading and not a
true representation of Information Age workers. This scholarian viewpoint is further evidenced
by findings which found work-family conflict prevalent among US workers with almost 70%
reporting they are struggling to balance work and personal obligations (Schieman, Glavin &
Milkie, 2009).
Despite the concept of WLB being debated for decades, very few feasibility studies
were found to have been carried out on identifying psychologically healthy work environments
and the impact, whether positive or negative, on employee well-being (Day et al., 2014).
Further, when Chang et al. (2010) carried out a meta-analysis review of 245 empirical WLB
peer reviewed research studies, published between 1987 and 2006, they discovered there was a
lack of consistency with results. In their study, Chang et al. (2010) focused on the methodology
employed in each case i.e. hypotheses raised, sampling frames and surveys/measures used and
Page 7
6
concluded there needed to be improvement with same to help identify and better understand
how workplaces can impact the psychological well-being of their workers. Kelloway & Day
(2005b) posited and stressed the importance of adopting a broader approach when analysing
well-being in the workplace so that it embodied physical, psychological and societal
contributing factors. Their holistic model looked at consequences in terms of individual
outcomes (i.e. physical, psychological and behavioural), organisational outcomes (e.g. both
employee and financial turnover) and societal outcomes (e.g. government initiatives) (Kelloway
& Day, 2005a).
The shortcomings in previous studies, as outlined above, are the key driving force
behind this new piece of research, which will strive to evaluate, analyse and understand more
about psychological well-being levels of today’s Information Age workers. In addition to using
only time-tested psychological scales, it will also offer respondents the opportunity of putting
their thoughts and needs into their own words by asking them three qualitative questions.
Work-life merge
With the emergence of the Information Age, there is something called work-life merge
(WLM), a phrase coined by Facebook Executive, Emily White (Hinsliff, 2013), that is
gathering some traction. In the current climate, workers may not have the luxury of
psychologically switching off, especially those who work flexible hours (Chen & Karahanna,
2018). Such workers, through their many portable devices, have instant fingertip access to work
servers, email accounts and clients. This flexible work model can remove the necessity of a
worker to be desk based, resulting in the lines that once very precisely separated work and
personal lives being eroded. IT workers, for example, can reboot servers from home at night
and take time off in lieu. They may also choose to work remotely from home during high peak
commuting times and use the time the next day to run a personal errand or visit a doctor. While
Page 8
7
this concept of WLM is relatively new (Hinsliff, 2013), the seeds were first sown as far back as
the 1990s when an increasing number of organisations brought in offerings of flexitime to
employees (Kossek & Ozeki, 1999). However, Kossek & Ozeki (1999) found employees were
slow to take up such opportunities due to existing company cultures coupled with ignorance
around its effectiveness both from an employee and employer perspective. Fast forward three
decades and the workplace is virtually unrecognisable with the introduction of remote wireless
technology. Such technology has brought with it a surge of interest by jobseekers looking to
work remotely, as evidenced in 2017 by one online Irish jobs search engine (Gordon, 2018).
This new way of working introduces a departure from the traditional WLB way of living
and brings with it new challenges for researchers interested in analysing well-being in the
modern day workplace. For example, what are the consequences, if any, for workers who are
permanently psychologically switched on? How does having more flexibility affect their well-
being and satisfaction levels? What role can organisations play in recognition of this changing
work environment? While this research seeks to address these queries, it becomes apparent in
the first instance that the very constructs of flexibility itself require balance and careful
modelling.
Flexibility in the workplace
Michel (2011) demonstrated how companies can ‘cash-in’ on employees who are open
and flexible, resulting in jobs being defined as something that workers are, rather than
something that they do. The focus of this nine-year ethnography study (Michel, 2011) was on
two banks who offered 24/7 administrative support to workers and encouraged timeout/leisure
at work, provided childcare, free meals and amenities as well as car servicing to employees.
However, Michel (2011) found that the consequences of offering such ‘perks’ lead to
participants suffering poorer physical health and admitting that their life was their work. This
Page 9
8
suggests that encouraging a more informal working environment, that allows workers ‘to be
themselves’, can leave them quite vulnerable. What they may perceive as freedom and
autonomy may essentially result in even more control by employers leading to a situation where
workers are under pressure to be permanently poised for work. This could be detrimental to
their health and personal life (Fleming, 2014) and could even lead to an early grave (Gonzalez-
Mulé, & Cockburn, 2016). Reports (Kennedy, 2018) on the inquest into the sudden death of a
21-year old bank intern, Moritz Erhardt, suggested his death could have been triggered by
exhaustion after working for 72 hours straight (Kennedy, 2018). This demonstrates the serious
risks involved when work and goals are so tightly bound together, that even taking time out to
sleep or rest is not an option.
Understanding basic needs and what motivates workers is also a vital stepping stone
towards creating greater employee well-being (Chmiel, Fraccaroli & Sverke, 2017) and perhaps
a lot can be learned from a large research study carried out on self-employed workers (Warr &
Inceoglu, 2017). Results showed participants enjoyed greater engagement with their work and
reported higher levels of happiness than those in direct employment. They also enjoyed more
success, were more satisfied, energised and innovated. The flexibility, freedom and autonomy
they enjoyed brought out higher standards in their work, as well as giving them a greater
competitive edge. Their feelings of satisfaction were boosted as they recognised any rewards
they got were attributable to their own hard work and contribution (Warr & Inceoglu, 2017).
Stress in the workplace
However, flexible hours controlled by management have also been found wanting, as
research (Wood, 2016) carried out at a large UK supermarket uncovered abuse in the
management of zero/flexi hour contracts that took place in order to keep costs down. This led to
employees feeling stressed due to uncertainty about their hours and the knock-on effect it had
Page 10
9
on their personal lives, resulting in negative feelings towards the employer (Wood, 2016). To
address issues of such poor work practices similar to those as outlined by Wood (2016), the
Irish government recently outlawed the use of zero-hour contracts except in cases of emergency
("Employment (Miscellaneous Provisions) Act 2018", 2019) resulting in greater rights for
workers. Employers may even gain from such legislation, as this style of poor management,
particularly in the service industry, could result in a false economy (Motro, Ordonez &
Pittarello, 2014). Management may think they are saving money, when in reality stressed and
unhappy employees translate into dissatisfied customers as well as resulting in employee sick
leave, legal challenges and ultimately loss of revenue (Motro et al., 2014).
Conversely, properly controlled management of flexible working solutions and new
policies can reap positive results (Barnes, 2018). One company, in an effort to improve
employee well-being, ran a trial and introduced a four-day working week but still paid
employees for five. Researchers found this new flexible structure increased well-being, job
satisfaction and reduced stress, while suffering no loss of revenue or quality of service to its
clients. Additionally, as part of their extra four days off per month, each employee was obliged
to work voluntarily in their local community one day per month (Barnes, 2018). Volunteering,
such as this, not only serves the community but also gives the employee an opportunity to give
something back (Piliavin & Siegl, 2007). Additionally, volunteering has been found to boost
both psychological well-being and self-reported health of volunteers, particularly those who had
a lower level of social integration than their counterparts (Piliavin & Siegl, 2007).
However, Wood & Michaelides (2016) discovered that not all workers, who wish for
more autonomy and flexibility by being their own boss, can escape the hazards of work-related
stress. They found as demands on freelancers increased so did their anxiety and stress levels.
They also found that an increase in working hours alone was not detrimental to well-being as it
brought calmness and greater enthusiasm, but this changed when the degree of difficulty of
Page 11
10
their workload was increased, which negatively impacted on their home life. Interestingly,
spending less time at home as a result of working longer hours, correlated positively with a
decrease in work-family/non-work interference (Wood & Michaelides, 2016). This is another
key finding, as it demonstrates how longer hours alone may not be an issue for employees but
rather if demands are unreasonable and workloads increase it can lead to stress.
Job & life satisfaction
For many years, the link between a happy workforce and greater productivity was
dismissed by researchers due to a lack of supporting empirical data (Chmiel et al., 2017). In the
1950s clinical psychologist, Frederick Herzberg, posited making a job more interesting rather
than simply increasing pay led to greater job satisfaction, as well as harvesting employee
psychological growth (Herzberg, 1987). His two-factor motivation-hygiene theory suggested
the key variable in order to improve job satisfaction was motivation, whereas poor hygiene
external factors such as salary and conditions leads to dissatisfaction. However, Herzberg was
quick to add that dissatisfaction is not the opposite to satisfaction i.e. an improvement in
hygienic factors does not equate to satisfaction (Herzberg, 1987). Hackman & Oldman (1975)
later constructed a Development of the Job Diagnostic Survey theoretical model consisting of
five core job dimensions (skill variety, task identity, task significance, autonomy and feedback).
They suggested these factors influenced three critical psychological states relating to
meaningfulness, responsibility and results. These in turn then lead to higher motivation,
performance, satisfaction and turnover and lower absenteeism (Hackman & Oldman, 1975).
Throughout the 1990s the number of studies on job satisfaction declined from the
previous decade (Judge, Thoresen, Bono & Patton, 2001) as research findings at the time were
conflicting. However, Judge et al. (2001) conducted a broad review of 300+ studies and were
firm in their conclusion that the satisfaction-performance relationship held real merit and
Page 12
11
required further analysis. When Zelenski, Murphy Jenkins (2008) carried out their study, doubt
still existed as to the connection between the two but their findings also concluded that happier
employees were more productive. Subsequent research (Oswald, Proto & Sgroi, 2015) has
found that there are many advantages to achieving healthy levels of psychological well-being of
employees, not just to the employees themselves but to companies who go on to experience an
increase in productivity, revenue, a more satisfied workforce and, ultimately, happier
shareholders (Oswald et al., 2015). Greater well-being at work also brings about an
improvement in employee creativity, productivity and loyalty, resulting in enhanced customer
care (Sgroi, 2015). Such renewed positivity amongst the workforce also brings benefits to
society at large, as well-being plays a key role in creating strong and thriving communities
(Jeffrey, Mahony, Michaelson & Abdalla, 2014).
The role of organisations
Workplace stress is bad for business with annual costs to employers in the region of
$300bn in the US (Smith, 2016) and £5bn in the UK (Russell, Maitre, Watson & Fahey, 2018).
Recognising how employees are a company’s most valuable resource is a must in today’s fast
paced and competitive working environment (Hyacinth, 2017). Companies, who place
increasing shareholder value as a priority above the human factor, can find themselves severely
out of pocket due to costs of fighting cases brought by disgruntled employees and, in some
cases, even leading to bankruptcy (Hyacinth, 2017).
To combat such escalating problems, legislation in Ireland and the EU outlines a ‘Duty
of Care’ employers have to their employees to ensure they are not unduly compromised at work
(HSA, 2018). The ESRI also recently identified (Russell et al., 2018) several key work stressors
amongst workers in the UK and Ireland, such as emotional demands, time pressure,
bullying/harassment/violence, physically demanding work, effort-reward imbalance and long
Page 13
12
working hours. They also found that by putting in place appropriate support structures, in
partnership with both managers and co-workers, such stressors can be mitigated (Russell et al.,
2018). However, such support is only of benefit once the demands on employees are not
unreasonable and management actively engage in ensuring support is sustained (HSA, 2018).
Once again, a recurrent theme with the research outlined in this paper points towards how
companies can fail in their approach in harvesting psychological well-being in the workplace.
Such failure seems to highlight a disconnect between management and their employees, and
perhaps even a disconnect between researchers, policymakers and organisations.
Such disconnection is further exposed when, for example, trends and demands change,
such as in the 1990s (O'Riordan, 2018) when HR experienced a transition from simple HR to
strategic HR, with the aim to place more emphasis on the interests of organisations so that HR
practices and policies aligned more closely with their needs (O’Riordan, 2018). This ultimately
led to HR professionals having to rethink their place and take on a more strategic position of
serving the needs of managers and shareholders above the needs of their employees. Ultimately,
on the ground, this equated to HR changing from being a people partner to a business partner
and left employees feeling neglected, resulting in poorer performance (O'Riordan, 2018). The
challenge now facing HR professionals is changing the mindset of management who may see
HR as a costly extra rather than something that adds value. Good HR practices can act as a
motivating force for staff as it gives them a voice and a sense that someone cares and
understands their needs, leading to suitable flexible working options, greater confidence and
positivity in terms of employee productivity, performance and well-being (O'Riordan, 2018).
Again, such findings point towards the need for employers to be more transparent, flexible and
aware that employees have voices, needs and expectations, which if met, could lead to very
successful partnerships (O'Riordan, 2018).
Page 14
13
Evidence of not paying proper attention to peoples’ and workers’ needs can be found
when considering Brexit, Donald Trump’s election to the US Presidency and recent Yellow
Vest protests in Paris. Brexit has been viewed as a vote against the British elite, with supporters
believing their values and interests were being ignored (Mauldin, 2016). In America, Trump’s
election was seen as a victory over the coastal elite by those who also felt left behind (Zurcher,
2016). Anger has been gradually brewing in France since the 1980s following the introduction
of economic and cultural regulations, resulting in economic hardship for workers believing they
too have been forgotten by those in charge (Henley, 2018). These are the very real
consequences of ignoring the basic needs of individuals that perhaps organisations should heed
when managing their own workforces.
Transparency is another key component for employers to bear in mind when wishing to
create thriving, collaborative and happy working environments as choosier employees, such as
millennials, have been found to ‘job hop’ (Gallup, 2016) if they observe poor management
practice in the workplace. Researchers, LoMonaco-Benzing, & Ha-Brookshire (2016) found
that what was once considered to be a lack of loyalty on the part of these young workers was, in
fact, an action taken as a result of the company’s culture, values and work practices not adding
up to what they were sold at interview. They also found that as these workers were brought up
in less traditional and more progressive/pro-social environments, it has led to a lower tolerance
of poor management systems (LoMonaco-Benzing et al., 2016).
Conversely, those in charge have the power to turn things around as management
intervention was found to be effective (Kelly et al., 2014) with the introduction of increased
supervisory support to employees coupled with greater work schedule flexibility. Results of
such intervention were a decrease in work-family conflict, a feeling of being more in control of
their lives and an increase in life satisfaction levels. Employees also perceived themselves as
getting adequate time to spend with loved ones, delivering much needed psychological boosts
Page 15
14
(Kelly et al., 2014). Again, this serves to highlight the many positives that management can
realise by carefully choosing and tailoring the correct level of support and flexibility to suit both
parties.
Rationale for this study
This mixed-methods research study will attempt to quantitatively analyse and compare
differences in levels of well-being of today’s Information Age workers by using the
psychological variables of perceived stress, job satisfaction and life satisfaction. It will seek to
test the traditional work-life balance concept that workers experience better well-being by being
able to psychologically switch on and off. Further, to try and bridge the gap of disconnection
that evidentially exists between workers and their employers, this current study also includes
qualitative questions to capture participants’ thoughts and needs. By drawing on Kelloway &
Day’s (2005a) more holistic approach of encompassing outcomes pertaining to individuals,
organisations and societal factors, it is hoped these quantitative and qualitative findings will add
to the body of research that exists in this area and highlight to employers the merit of putting in
place properly managed constructs that work for both sides.
The three hypotheses
1. There will be a significant difference between work-life balance (WLB) workers and
work-life merge (WLM) workers on levels of affective job satisfaction (AJS)
2. There will be a significant difference in levels of well-being of a) perceived stress
(PS) and b) satisfaction with life (SWL) between WLB and WLM workers
3. There will be a significant difference in levels of satisfaction a) SWL and b) AJS
between WLM workers who have flexible working arrangements with employers
(WLM Flexi) and those who do not (WLM Non-flexi)
Page 16
15
The three qualitative questions
1. How does your job impact or affect your personal life?
2. What would you change about your job to enhance your personal life?
3. What motivates you most about working?
Page 17
16
METHODOLOGY
Participants
Participants (N = 133) in this quantitative and qualitative anonymous study were male (N = 50)
and female (N = 83) full-time employees ranging in age from 18–65 years old. In addition to
being over 18 years of age, participants were required to be working a minimum of 20 hours per
week but not solely from home. Two groups of workers were identified as WLB (work-life
balance) and WLM (work-life merge) with a split ratio of 66%/34% respectively. WLB workers
(N = 90) being defined as full-time workers who worked solely from their place of work and
WLM workers (N = 43) being defined as full-time workers who worked from a combination of
their place of work and home. For the third hypothesis, the WLM group was further split
between (WLM Flexi) being defined as those that had a flexible working arrangement with
their employer (N = 31) and (WLM Non-flexi) those that did not have a flexible working
arrangement with their employer (N = 12). Participants were invited to participate in the online
survey through the social media platforms of Facebook, LinkedIn and WhatsApp. Some
participants chose to share the survey on their own personal profiles generating a snowball
effect of sample collection. Consent was obtained from all participants before proceeding with
the survey and no incentives or rewards were offered or given for their participation.
Design
A mixed-methods research study was carried out to quantitatively analyse data regarding self-
reported levels of Perceived Stress (PS), Satisfaction With Life (SWL) and Affective Job
Satisfaction (AJS) between the two groups of workers. Thematic analysis was also carried out
on the three short answer questions asked.
Page 18
17
One Independent Variable (IV):
1. Full-time workers (with two levels) for first two hypotheses:
a) WLB workers (who work from their place of work only)
b) WLM workers (who work from a combination of their place of work and home)
One Independent Variable (IV):
1. WLM workers (with two levels) for third hypothesis:
a) WLM Flexi workers (who had a flexible working arrangement with their employer)
b) WLM Non-flexi (who did not have a flexible working arrangement with their
employer)
Three Dependent Variables (DVs):
1. Perceived Stress (PS) total
2. Satisfaction With Life (SWL) total
3. Affective Job Satisfaction (AJS) total
Materials
Google Forms was used to create an electronic questionnaire with an online link posted on
Facebook, LinkedIn and WhatsApp. An information sheet and consent form were included as a
precursor to the survey (see Appendix A). Demographic questions were asked to identify
gender, age group, hours of work, place of work and commuting times (see Appendix B). Three
widely used psychological research scale questionnaires were used i.e. the Perceived Stress
Scale (PSS) (Cohen., Kamarck & Mermelstein, 1983), Satisfaction with Life Scale (SWLS)
(Diener, Emmons, Larsen & Griffin, 1985) and A Brief Index of Affective Job Satisfaction
(BIAJS) (Thompson & Phua, 2012) (see Appendix C). Three qualitative questions were also
Page 19
18
asked to learn more about how jobs affected participants’ personal lives, what they would
change about their jobs to enhance their personal lives and what motivates them to work (See
Appendix D). Contact details for support services were provided at the end of the survey (see
Appendix E). The following software was used: SPSS v.25 to carry out the quantitative
analysis, MS Word 2016 to create APA style tables, MS Publisher 2016 to draw the thematic
maps, MS Excel 2016 for importing the raw data from Google Forms and NVivo v.12 to create
nodes, themes, sub-themes and the word cloud when carrying out the thematic analysis of the
qualitative answers using Braun & Clarke’s (2006) six-steps of thematic analysis.
Questionnaire 1: Perceived Stress Scale (PSS)
Participants completed the Perceived Stress Scale (PSS) (Cohen et al., 1993), which was
designed to measure an individual’s perception of stress during the past month. The questions
are constructed in such a way as to make them easy for respondents to understand, and the
answers give insight into how controllable and unpredictable they perceive their lives to be,
which are central factors when experiencing stress (Wu & Amtmann, 2013). The scale, due to
its general nature, is seen as being suitable to any subpopulation group, who have at least a
junior high school education (Cohen et al., 1993). For this survey, the shorter 4-item scale was
used (PSS-4), which asked respondents to rate their stress over the last month by using two
negatively stated and two positively stated items. The internal consistency of this shortened 4-
item scale was found to be a sufficient and suitable tool for assessing perceived stress levels
(Vallejo, Vallejo-Slocker, Fernández-Abascal & Mañanes, 2018). PSS-4 asks about
participants’ thoughts and feelings during the last month, e.g. ―In the last month, how often
have you felt that you were unable to control the important things in your life? and ―In the last
month, how often have you felt confident about your ability to handle your personal problems?
and are rated on a 5-point scale from Never to Very Often. Scores range from 0-16, with the
Page 20
19
lower the score, the lower the perceived stress and the higher the score, the higher the perceived
stress. Reverse coding was employed for items 2 and 3. Internal reliability (Cronbach’s α)
reached its desired level for this scale at .75 (Cronbach, 1951).
Questionnaire 2: Satisfaction with Life Scale (SWLS)
Participants also completed the Satisfaction With Life Scale (SWLS) (Diener et al., 1985),
which was designed as a tool to measure the judgemental component of subjective well-being.
There is a moderate to high correlation with SWLS scoring and other scales that also focus on
subjective well-being (Diener et al., 1985). The scale has also proven to be a useful tool in
detecting changes in life satisfaction of patients undergoing clinical intervention (Pavot &
Diener, 1993). Research from a combination of both self- and peer- reported studies of life
satisfaction and subjective well-being, strongly suggests that subjective well-being is a far-
reaching and lasting phenomenon, and not just a spur of the moment judgement (Pavot, Diener,
Colvin & Sandvik, 1991). When completing the survey participants rated, for example, the
conditions of their life, their satisfaction with life and whether they would make life changes if
they could start over. The SWLS consists of five items, e.g. ―So far, I have gotten the
important things I want in life, ―In most ways my life is close to my ideal, and were rated on a
7-point scale, ranging from 1- strongly disagree, to 7- strongly agree. Higher scores (ranging
from 31-35) are indicative of a greater degree of life satisfaction. Conversely, lower scores
(ranging from 5-9) are indicative of lower life satisfaction. Internal reliability (Cronbach’s α)
reached its desired level for this scale at .90 (Cronbach, 1951).
Questionnaire 3: A Brief Index of Affective Job Satisfaction (BIAJS)
The third and final quantitative scale that participants completed was A Brief Index of Affective
Job Satisfaction (BIAJS) (Thompson & Phua, 2012), which was designed in response to
Page 21
20
criticism of research methods of measuring affective job satisfaction. Previously, research
scales were lengthy and measured job satisfaction cognitively rather than affectively and the
brief BIJAS addressed both issues whilst also maintaining integrity (Thompson & Phua, 2012).
The BIJAS consists of seven items, e.g. ―I find real enjoyment in my job, ―Most days I am
enthusiastic about my job and were rated on a 5-point scale ranging from 1- Strongly Agree to
5- Strongly Disagree. Three of the seven items were distractor items (2, 4 and 6) and only the
remaining four items were used to find total score of job satisfaction. Internal reliability
(Cronbach’s α) reached its desired level for this scale at .88 (Cronbach, 1951).
Procedure
This study comprised of quantitative data and qualitative data collected when participants
submitted their completed online surveys. An online information sheet advised participants of
the nature of the study on psychological well-being of workers and that it would take
approximately 5-10 minutes to complete. Before starting the survey, they answered three
compulsory questions to confirm they were 18 years of age or older, that they worked a
minimum of 20 hours per week and that they consented to take part in this survey (See
Appendix A). All participants were then asked a series of demographic questions (See
Appendix B) before completing the three quantitative multiple-choice questionnaires (See
Appendix C) and the three short answer qualitative questions (See Appendix D). Once
participants completed the survey, a pop-up screen thanked them for their participation and
asked them to submit. No further action was required from them post submission.
Ethics
The information sheet also informed participants that the survey abided by The Code of Ethics
of Psychological Society of Ireland (PSI) and that participation was voluntary and that they had
Page 22
21
the right to withdraw at any time. However, due to the anonymous nature of all data collected,
they were also made aware it would not be possible to withdraw from participation once they
submitted their answers, as it would be impossible to attribute data to any one individual. They
were also advised all data collected would be stored on a password protected PC and be
destroyed one year after the examination board published their results. They were also given
contact details for both the researcher and supervisor (See Appendix A). They were advised
contact details for support services would be provided at end of the survey, should any
questions raise minor negative feelings (See Appendix E).
Data analysis
In an effort to understand more about how work impacts and affects participants’ personal lives,
what they would change about their job to enhance their personal lives and what motivates them
about work, the following qualitative questions were asked:
1. How does your job impact or affect your personal life?
2. What would you change about your job to enhance your personal life?
3. What motivates you most about working?
To analyse these answers, Braun & Clarke’s (2006) six-steps of thematic analysis was used,
which included familiarisation with data in the first instance, followed by the creation of initial
codes and identification of themes and sub-themes. Thematic maps were then created which
acted as a good visual guide when repeatedly reviewing and refining the themes and sub-themes
further. Finally, a thematic report was then created, which was supported with direct quotes
from participants.
Page 23
22
RESULTS
SPSS v.25 was used to run descriptive and inferential statistical analysis in the quantitative part
of this study, the results of which are detailed below. Preliminary analysis of the data collected
found violations of parametric test assumptions. Therefore, non-parametric Mann-Whitney U
tests were performed in place of the originally intended parametric Independent Samples t-tests
and MANOVA tests. The significance threshold was set at .05 for each test, which were all
two-tailed. The z value was used to calculate the effect size for any significant results (Cohen,
1988). NVivo v.12 was used to carry out the thematic analysis of the answers given to the three
qualitative questions asked, using Braun & Clarke’s (2006) six-steps of thematic analysis.
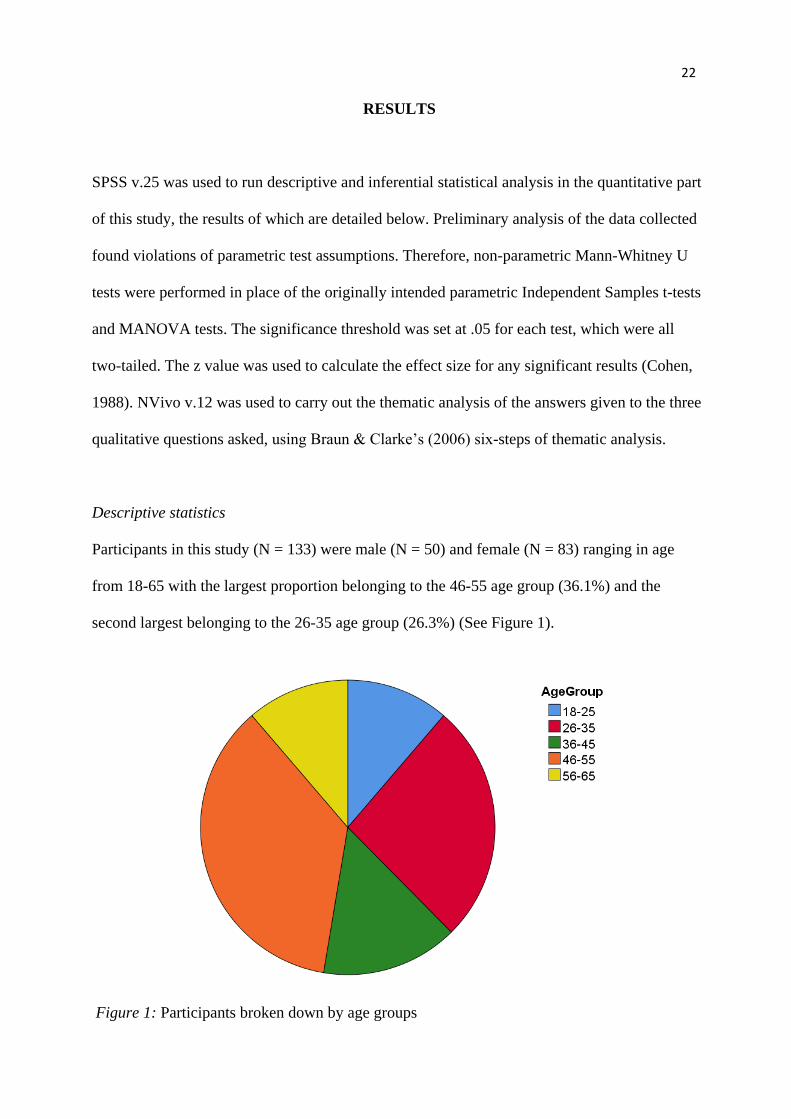
Descriptive statistics
Participants in this study (N = 133) were male (N = 50) and female (N = 83) ranging in age
from 18-65 with the largest proportion belonging to the 46-55 age group (36.1%) and the
second largest belonging to the 26-35 age group (26.3%) (See Figure 1).
Figure 1: Participants broken down by age groups
Page 24
23
The sample consisted of two groups of full-time workers i.e. work-life balance (WLB) workers
(N = 90) who worked solely from their place of work and work-life merge (WLM) workers (N
= 43) who worked from a combination of their place of work and home (See Table 1).
Table 1: Breakdown of workers per group
Variable No. Percent Valid
Percent
Cumulative
Percent
Work-life balance workers
90
67.7
67.7
67.7
Work-life merge workers
Total
43
133
32.3
100.0
32.3
100.0
100.0
To take part in the survey, each participant had to work full-time for a minimum of 20 hours per
week. In the WLB group, those that worked on average of 40–49 hours per week represented the
largest group (46.7%) with the second largest working an average of 30-39 hours per week
(28.9%) (See Figure 2).
Figure 2: Average hours worked per week by the work-life balance group
Page 25
24
In the WLM group, those that worked on average of 30–39 hours per week represented the
largest group (34.9%) with the second largest working an average of 40-49 hours per week
(30.2%) (See Figure 3).
Figure 3: Average hours worked per week by the work-life merge group
For both groups, the majority had commutes of either Up to 5 or 5-10 hours per week with the
biggest difference being in the 10-20 hour per week bracket belonging to 13.3% of the WLB
group (See Figure 4) and only 4.7% of the WLM group (See Figure 5).
Figure 4: Average hours spent commuting per week by the work-life balance group
Page 26
25
Figure 5: Average hours spent commuting per week by the work-life merge group
Each participant completed questions from the Perceived Stress Scale (PSS-4), the Satisfaction
with Life Scale (SWLS) and the Brief Index of Affective Job Satisfaction Scale (BIAJS).
Cronbach’s Alpha reliability was found to be at the desired level for each (See Table 2).
Table 2: Descriptive statistics of psychological measures for hypotheses 1-3
Variable N Mean SD Cronbach’s
Alpha
Perceived Stress
127
6.20
2.76
.75
Satisfaction with Life
132 24.43 6.36 .90
Job Satisfaction
132
14.60
3.04
.88
Tests of normality were run for each of the psychological scales used and results showed the
significance value of the Shapiro-Wilk tests was less than .05 for each scale indicating the data
deviated significantly from a normal distribution (See Table 3).
Page 27
26
Table 3: Test results for normality of scores from the three psychological scales used
Shapiro-Wilk
Statistic df Sig.
Perceived Stress Total
Satisfaction With Life Total
Affective Job Satisfaction Total
.98
.94
.95
125
125
125
.035
.000
.000
Inferential Statistics
Due to violations of parametric test assumptions, as outlined above, only non-parametric tests
were used in this study.
First hypothesis looked at affective job satisfaction (AJS) levels of WLB workers (N = 90) and
WLM workers (N = 42) to establish if there would be a significant difference between the two
groups (IV = WLB & WLM conditions; DV = AJS levels).
A Mann-Whitney U test revealed that the WLB (mean rank = 62.07) condition and the WLM
(mean rank = 76) condition did differ significantly in AJS levels (z = -1.97 p = .049, r = .17).
Therefore, the null can be rejected (See Table 4).
Table 4: Mann-Whitney U test results showing significant difference in affective job satisfaction
levels between work-life balance and work-life merge conditions
AJS Total
Mann-Whitney U
Z
Asymp. Sig. (2-tailed)
Effect size (small to medium)
1491.00
-1.97
.049
.17
Page 28
27
Second hypothesis looked at a) satisfaction with life (SWL) and b) perceived stress (PS) levels
to test if there would be a significant difference between the WLB & WLM groups (IV = WLB
& WLM conditions; DVs = SWL and PS levels).
A Mann-Whitney test revealed that the WLB (N = 89, mean rank = 61.49) condition and the
WLM (N = 43, mean rank = 76.87) condition did differ significantly in SWL levels (z = -2.17,
p = .030, r = .19). Therefore, the null can be rejected (See Table 5).
Table 5: Mann-Whitney U test results showing significant difference in satisfaction with life levels
between work-life balance and work-life merge conditions
SWL Total
Mann-Whitney U
z
Asymp. Sig. (2-tailed)
Effect size (small to medium)
1467.50
-2.17
.030
.19
A Mann-Whitney U test revealed that the WLB (N = 86, mean rank = 64.90) condition and the
WLM (N = 41, mean rank = 62.12) condition did not differ significantly in PS levels (z = -.40,
p = .690). Therefore, the null cannot be rejected.
Third hypothesis looked at SWL and AJS levels to test if there would be a significant difference
between WLM workers who have a flexible working arrangement with their employers (WLM
flexi) and those who do not (WLM non-flexi) (IV = WLM flexi & WLM non-flexi; DVs = AJS
and SWL levels).
Page 29
28
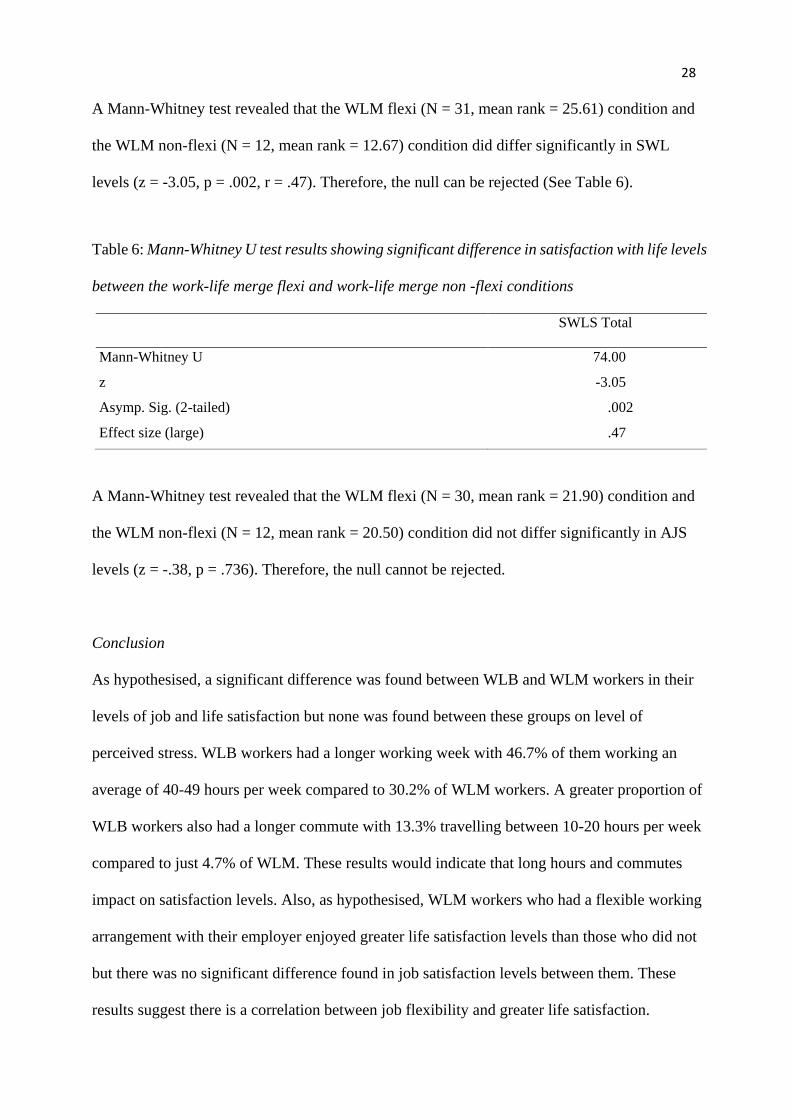
A Mann-Whitney test revealed that the WLM flexi (N = 31, mean rank = 25.61) condition and
the WLM non-flexi (N = 12, mean rank = 12.67) condition did differ significantly in SWL
levels (z = -3.05, p = .002, r = .47). Therefore, the null can be rejected (See Table 6).
Table 6: Mann-Whitney U test results showing significant difference in satisfaction with life levels
between the work-life merge flexi and work-life merge non -flexi conditions
SWLS Total
Mann-Whitney U
z
Asymp. Sig. (2-tailed)
Effect size (large)
74.00
-3.05
.002
.47
A Mann-Whitney test revealed that the WLM flexi (N = 30, mean rank = 21.90) condition and
the WLM non-flexi (N = 12, mean rank = 20.50) condition did not differ significantly in AJS
levels (z = -.38, p = .736). Therefore, the null cannot be rejected.
Conclusion
As hypothesised, a significant difference was found between WLB and WLM workers in their
levels of job and life satisfaction but none was found between these groups on level of
perceived stress. WLB workers had a longer working week with 46.7% of them working an
average of 40-49 hours per week compared to 30.2% of WLM workers. A greater proportion of
WLB workers also had a longer commute with 13.3% travelling between 10-20 hours per week
compared to just 4.7% of WLM. These results would indicate that long hours and commutes
impact on satisfaction levels. Also, as hypothesised, WLM workers who had a flexible working
arrangement with their employer enjoyed greater life satisfaction levels than those who did not
but there was no significant difference found in job satisfaction levels between them. These
results suggest there is a correlation between job flexibility and greater life satisfaction.
Page 30
29
Qualitative thematic analysis
The researcher used Braun & Clarke’s (2006) six steps of thematic analysis to analysis the
answers given. Three qualitative questions were asked to gain greater insight into the thoughts
and needs of participants, all of whom were in full-time employment. The three questions asked
were:
1. How does your job impact or affect your personal life?
2. What would you change about your job to enhance your personal life?
3. What motivates you most about working?
A word cloud from the answers given was generated in NVivo v.12 (See Figure 6).
Figure 6: Word cloud of answers given by participants to the three qualitative questions asked
Page 31
30
Familiarisation with data and initial coding
The raw data was downloaded into a spreadsheet and reviewed by the researcher in its entirety
to gain familiarity with it before being imported into NVivo. Initial codes were then generated.
Transition from codes to themes
The next phase of Braun & Clarke’s (2006) thematic analysis involved the organisation of the
initial codes into broad themes. Each code was categorised into unnamed themes and in some
cases the same code was categorised into more than one theme. When relationships between
codes and themes began to emerge, sub-themes were created. At this point, the initial themes
were further reviewed to ensure an accurate representation of the coded extracts was being met.
Thematic models were then generated to create visuals of the themes which were then refined
further by making any adjustments that the researcher deemed necessary.
Defining and naming themes
Continual analysis and refinement of the themes and sub-themes led to the creation of
definitions and names and the researcher was able to outline each theme in detail confident of
its relevance to the data collected. Once all themes were defined and named, a thematic report
was generated which connected the themes back to the research questions asked and the
previous literature reviewed on well-being in the workplace.
Themes
Question No. 1: “How does your job impact or affect your personal life?”
Four overarching themes were identified in the answers with a number of sub-themes in support
of same. A summary of themes and sub-themes can be seen in Table 7 below.
Page 32
31
Table 7: Summary of themes on impact or affect job has on personal life
Themes Subthemes
Brings benefits & positivity
Enhances my life
Positive impact & affect
Provides money
Takes up too much time
No time for personal pursuits
Lack of family time
Tired and exhausted
Work too inflexible
Brings structure & balance Have good work-life balance
Have set boundaries
Free to choose time off
Negatively affects mental health
Hard to switch off
Moody
Pressure
Stress & worry
Theme 1: Brings benefits & positivity
Participants spoke of the many benefits and positive affect their jobs had on their lives. Some
viewed their job as an enhancement to their personal lives and linked being happy in work to
being happy in their personal lives.
Participant 99: “If work is going well it helps my personal life too”
Participant 22: “I am happy with my job therefore happy with my life”
Others spoke of how remuneration from their jobs enabled them to fund their personal lives and
enhance their standard of living.
Participant 118: “It provides me unique opportunities and a gold
standard of living.”
Page 33
32
Participant 21: “Gives me satisfaction and money to fund my personal
life.”
Theme 2: Takes up too much time
A strong theme throughout the answers given was around the issue of time and the negative
impact having too little time had on their personal lives. Participants also spoke about lack of
flexibility with work hours resulting in less time for family or personal pursuits.
Participant 25: “It takes a lot of my personal time and as such it
prevents me from fully enjoying my family”
Participant 10: “Restricted with flexibility - main problem. I have to
work 9-5:30 no exceptions.”
Others acknowledged the role technology played in how it blurred the boundaries between work
and personal time.
Participant 89: “It somewhat impacts due to new technologies
breaking down the divide between work time / personal time”
Some took a more pragmatic viewpoint when acknowledging the impact technology had on
their lives resulting in a merge of life and work.
Participant 83: “Extensively.... but I accept the nature of the role I'm
in is labour intensive (in stints). By accepting that and being aware, it
makes other of my life easier to assess and manage. Of course, at
times, its straining on my personal life and I've probably lost out on
some interests but I'm playing the long game and you must sacrafice
to get places. If you think emails are on my phone, research is on my
phone, etc... there isn't much getting away from it so I see it that my
life and profession are to be managed as one entity as opposed to "my
Life and my Job".
Page 34
33
Tiredness as a result of working long hours was also an issue for many participants as it resulted
in having limited time with family and friends but also brought on feelings of guilt for some
too.
Participant 111: “My job is so tiring mentally that I do not want to
have many interactions once I am off work. It also impacts the people
with whom I spend personal time.”
Participant 12: “It's hard to juggle family life & work with young
children. Feelings of guilt & being tired”
Theme 3: Brings structure & balance
Some participants spoke of being able to establish boundaries between their working and
personal lives and having good work-life balance. This seemed to be easier for those who had
greater flexibility in their work.
Participant 94: “It is great because I can choose my own days off to a
degree as I am my own boss.”
Participant 69: “Not really as I am freee to choose my time off”
Participant 7: “My job doesn't affect my personal life adversely. I have
a fairly good work life balance.”
Other participants regarded the impact their work had on their personal lives as something they
could control and make a conscious decision about in order to minimise any negatives.
Participant 45: “Tend not to bring work physically nor mentally home
with me. This is something i learned to rather than instructed to do.”
Participant 4: “I have established boundaries around work and home
to make sure they don't impact each other”
Page 35
34
Theme 4: Negatively impacts mental health
There was a strong theme around mental health and how work had a negative impact on same.
Strong feelings were expressed with many talking about how hard it was to switch off mentally
from the stress and worry of work. Worrying about work when at home was a common
complaint amongst some participants.
Participant 18: “Can be worried about managing well in work. Worry
at home then”
Participant 19: “Hard to switch off. Lot of support expectations”
Participant 127: “It can be hard to let go, I am often left with the
emotions, stress, worry, anxiety, fear, self doubt, feeling not good
enough, inadequate. These feelings can be hard to shake off and so
are sometimes clouding who I am in my personal life.”
Not being happy in work had the potential to greatly affect participants mood and feelings of
happiness in general.
Participant 35: “It often causes me unhappiness”
Participant 87: “Feel sometimes unsatisfied and therefore more moody
in my personal life.”
A thematic model of the themes and sub-themes discussed above is shown in Figure 7 below.
Page 36
35
Figure 7: Thematic map: How does your job impact or affect your personal life?
Question No. 2: “What would you change about your job to enhance your personal life?”
Five overarching themes were identified in the answers with a number of sub-themes in support
of same. A summary of themes and sub-themes can be seen in Table 8 below.
Page 37
36
Table 8: Summary of themes on desired job changes to enhance personal life
Themes: Subthemes
Pay increase
Better work structures
Change efficiencies
More support
Staff management
Free up more personal time
More flexibility
More freedom
Shorter commute
Work from home
Work less hours
Change job
More fulfilling role
Retire
Try something different
Would not change anything Happy in job
Have good work life balance
Theme 1: Pay increase
For some participants the only change they would make to their jobs to enhance their personal
lives would be to see an increase in earnings.
Participant 30: “Better salary !”
Theme 2: Better work structures
Some participants expressed frustration about work structures that were in place and felt that
same needed improvement so that they could be more engaged and their skillset better utilised.
Participant 111: “I would have a job that allowed me to utilize my
skills, not one that dealt with so many topics which I find exhausting
and uninteresting.”
Page 38
37
Participant 93: “Make it more challenging”
Participant 127: “More support, training, time to do paperwork, team
building, skills developing”
Theme 3: Free up more personal time
Many participants had a strong desire to change their working hours so they did not encroach
on their personal time.
Participant 43: “I would like to be able to plan my work
commitments/tasks so they better align with my personal life's
commitments. This is not very realistic though.”
Participant 64: “Minimising the amount of work I need to take home.”
Some participants spoke of taking control over any encroachment of personal time.
Participant 83:“I think it's important if you have access to "work"
outside of work, on your phone or otherwise, that you decide when
you are offline. This is probably the one thing I've changed, and had
to change…”
A greater level of flexibility and freedom in the workplace was also a common thread found
throughout the answers.
Participant 10: “Having more flexibility in my working hours.”
Participant 48: “Would like to be able to work slightly less hours.
Getting home earlier in the evening would make a huge difference”
Many participants expressed a wish to have the option of working from home and reduce
commute. Others wanted to work shorter days or change over to part-time work. Some believed
this could be achieved with better use of technology and/or hiring more staff.
Page 39
38
Participant 46: “Either a combination of working from home and the
workplace or hire additional staff to reduce the long days i work”
Participant 103: “Less travel from donegal to dublin for meetings/
greater use of technology”
Theme 4: Would not change anything
Some participants had no desire to change anything about their jobs and were happy with the
status quo. Those that elaborated further on their reasons for being happy with their current
work set-up spoke of an element of freedom and autonomy that existed in ther lives.
Participant 125: “Not much, I'm very lucky in the sense that my job
has a great work/life balance and allows for exploration of interests”
Participant 62: “I have created my job and I really like it”
Participant 69: “It does not impact my personal life as I can do my
work as I see fit most of the time.”
Theme 5: Change job
For some, they wished to change their roles entirely, retire or try something different to gain
greater fulfilment even with less pay.
Participant 82: “My current role is not what I would like to do long
term. I am well paid so appreciate that I need to work hard and am
happy to do so but I would prefer to do this in a role that I truly enjoy
even if that involves lower pay.”
A thematic model of the themes and sub-themes discussed above is shown in Figure 8 below.
Page 40
39
Figure 8: Thematic map: What would you change about your job to enhance your personal life?
Question No. 3: “What motivates you about working?”
Four overarching themes were identified in the answers with a number of sub-themes in support
of same. A summary of themes and sub-themes can be seen in Table 9 below.
Page 41
40
Table 9: Summary of themes on what motivates participants most about working
Themes: Subthemes
Learning & Improving
Adding to knowledge base
Enhancing skillset
Improving self
People interaction
Colleagues
Meeting people
Social life
Team work
Job satisfaction
Enjoy my work
Enjoy the challenge
Helping others
Sense of achievement
The pay cheque Family
Lifestyle
Security
Theme 1: Learning & improving
Learning new things and improving skillsets was found to be a motivating force for some when
participants were asked what motivates them most about their jobs.
Participant 90: “The challenge to continuously improve myself and
learn new things”
Participant 128: “Learning new things and bettering skills I have”
Additionally, the challenge of each day being different served as a motivator for some.
Participant 118: “Every day can be different, but all with the same
background of technology consulting. Different clients and different
technologies, but all technologies.”
In addition to such personal challenges, some participants were motivated by wanting to make a
difference in the lives of others while at the same time bettering themselves.
Page 42
41
Participant 110: “the Idea of making a difference in someone's life and
wanting to constantly become better at what I do”
Theme 2: People interaction
A strong motivating force for many were the positives they got from interacting with other
people whether clients, customers or fellow colleagues. Participants were quite enthusiastic
about this aspect of their working lives.
Participant 12: “I love what I do, teaching something I am very
passionate about and interacting with people”
Participant 90: “The possibility of changing a persons life”
Participant 41: “making a difference to as many people as possible”
Those that experienced good relations with fellow colleagues and enjoyed team work were
further motivated by such an experience.
Participant 82: “…Being in a collaborative environment where a
small a team we try to achieve goals is a real motivator for me.”
Participant 120: “Great colleagues, interesting work.”
The social life and simply experiencing the positives of being with others was another
motivating force identified.
Participant 51: “Being useful, having a purpose, socialising”
Participant 17: “I love to interact with people”
Page 43
42
Theme 3: Satisfaction
Deriving satisfaction was a very strong theme among respondents both from a professional and
personal point of view with a link observed between job satisfaction and personal satisfaction.
Participant 68: “Job satisfaction. I can see that what I do has a
positive impact on the children I work with”
Participant 88: “Personal fulfilment”
Participant 52: “Personal satisfaction and money”
Satisfaction also stemmed from helping others which had a knock on effect of making some
participants feel good about themselves.
Participant 22: “The fact that I make people feel good”
Participant 45: “I work in Training and education so seeing others
achieve makes me feel good about myself”
Some participants were motivated by the feelings they got from accomplishing tasks and from
feeling useful. Others were motivated when their efforts were acknowledged by their employer.
Some enjoyed the challenge of a job well done as well as helping the business to be successful.
Participant 13: “Feeling of accomplishment and being useful”
Participant 131: “Acknowledgement from my employer of my work”
Participant 109: “Doing things right and ti the betterment of the
business”
Theme 4: The pay cheque
Some participants cited money as their sole motivator to work as it was needed to meet their
basic requirements.
Page 44
43
Participant 49: “Got to pay the rent and bills”
Participant 35: “Security”
Whilst others also felt money was their main driving force to work they also acknowledged
some element of personal interest in their work.
Participant 43: “Interest in the work itself is a factor but mostly it is
down to pay.”
Participant 96: “Money. And career progression and
achieving/exceeding targets. But mainly money.”
But for some, it was all about the pay cheque.
Participant 37: “Pay day. I have zero self worth invested in my job.
I'm not a career person.”
Others were keen to believe that money could not be the only driving force behind going to
work. Those working in goal orientated roles linked achieving their goals with basic survival,
which by default brought with it a sense of reward.
Participant 83: “I think we all work for money but there has to be
more to it to be satisfied. My role is very goal orientated becuase if we
don't acheive our goals we're out of a job. The whole process gets me
up and motivated as a result... it's rewarding work I guess.”
A thematic model of the themes and sub-themes discussed above is shown in Figure 9 below.
Page 45
44
Figure 9: Thematic map: What motivates you about working?
Conclusion
Throughout this qualitative analysis there was a strong theme around the issue of time. Many
participants complained of long working hours and long commutes leading to very little time to
spend with family, friends or on personal pursuits. While some were motivated purely for
financial gain, many spoke of enjoying interaction with colleagues and clients and of the
satisfaction they got from helping others. Some were frustrated at work constructs that they felt
needed improving. There was an acknowledgment too that the lines between their working lives
and personal lives were becoming more blurred due to advancing technology, which was
accepted more positively by some than others. There was a real impact on mental health for
some participants with answers detailing how worry and stress about their jobs bled into their
homelife resulting in moodiness and a difficulty in psychologically switching off. Whilst some
were happy with their working and private lives in terms of balance, many wished for less hours
and greater flexibility. These qualitative findings are very much in keeping with the significant
Page 46
45
results found in the quantitative aspect of this survey and, once again, points towards a problem
where excessive demands on workers leads to poorer quality of life.
Page 47
46
DISCUSSION
The purpose of this mixed-methods research study was to test the traditional work-life
balance concept that workers experience better well-being by being able to psychologically
switch on and off. This was done by measuring psychological well-being levels of WLB
workers (who worked from their place of work only) and WLM workers (who worked from a
combination of their place of work and home), as well as asking them some key qualitative
questions. By bringing in both elements of quantitative and qualitative analyses it was hoped
the findings would offer a deeper understanding surrounding workplace well-being as well as
garnering valuable insights pertaining to workers’ thoughts and needs in this Information Age.
As hypothesised, the results found a significant difference between the two groups in both their
job satisfaction and life satisfaction levels with the WLM group scoring higher in both tests, but
no significant difference was found between the groups on their perceived stress levels.
Additionally, the WLM group was split into WLF Flexi (workers who had a flexible working
arrangement with their employer) and WLM Non-flexi (workers who did not have a flexible
working arrangement with their employer) and, as hypothesised, the more flexible group
reported significantly higher life satisfaction levels. However, no significant difference was
found between the same groups on their job satisfaction levels.
For the qualitative part of the study, participants were asked to describe how their jobs
impacted their personal lives, what they would like to see changed and what motivated them to
work. Themes that were identified ranged from positive impacts, such as, structure and
financial security to negative mental aspects, such as, worry, stress and unhappiness that spilled
over into their personal lives. A strong complaint amongst participants was they did not have
enough time to spend with family or on personal pursuits. Desired changes ranged from better
work structures to a wish to for a more flexible working arrangement, with some suggesting this
Page 48
47
should be possible with today’s remote technology. For others, they were quite happy with the
ratio of work-life balance they had already achieved in their lives. Motivating drivers ranged
from the pay cheque to a real desire to want to learn more and improve their skills. Many
participants expressed how work challenges plus interacting with clients, customers and
colleagues were key motivators for them, as well as a strong desire to help others.
The findings here support research and theoretical models previously outlined in this
paper. Whilst some participants in this study spoke of achieving a good work-life balance, this
was only cited by a few as the majority spoke of their struggles with long working hours and
commutes leaving them too exhausted to enjoy personal pursuits. Day et al. (2014) referred to
scholars who criticised the term balance as they saw it as misleading and not a true
representation of what today’s workers achieve in their work and personal lives, and the
findings in this study reinforce that view. Job and life satisfaction levels were found to be
higher for workers who were not tied to their place of work every day unlike their more
restricted counterparts, indicating that a degree of flexibility is a key factor to achieving greater
well-being. Wood (2016) had also demonstrated from their study that when flexibility is
restricted it negatively impacts on workers.
Participants expressed a need for more support and better work structures in the
workplace and how much they were motivated by new challenges, learning and helping others.
This is particularly interesting because despite the concept of work-life balance being
researched in depth over the past three decades, it would appear the early theories of Frederick
Herzberg (1987), discussed previously, are as relevant today as they were when he first posited
them back in the 1950s. For Herzberg, it was of huge importance to make a job interesting to
help keep employees motivated while at the same time harvesting their psychological growth.
However, despite such early insightful theories, a disconnect between employees and their
employers still exists with excessive demands on the former’s lives. This was evident in this
Page 49
48
study by the emergence of a strong theme of exhaustion from participants working and
commuting over long periods, as well as complaints of pressure to perform whilst ‘off the job’
too. Some participants in this study spoke of how today’s technology blurs the lines between
their work and private lives and those who appeared to have a stronger internal locus of control
seemed to accept this as a new way of living, while others found it too intrusive and invasive.
Like all studies, this research paper is not without its weaknesses and perhaps the
qualitative aspect of this study could have been conducted by interview to gather even richer
data. As it stood, participants were asked to complete an online survey and this could have
taken place in any number of places such as at home, at work, whilst travelling, under pressure,
etc, bringing with it any number of antecedent conditions that may not have been ideal for
some. There was also no opportunity to offer face to face support for any participants who may
have found some of the questions disturbing and whilst they were given the contact details of
support services, it may have fallen short for some participants. Also, the intended parametric
tests could not be run due to test scores not being normally distributed.
The strengths of this study lie mainly in its attempt to learn and understand more about
the well-being of today’s Information Age workers by giving them an opportunity to put their
thoughts and needs into their own words. None of the psychological questions presented were
compulsory yet many chose to take the time to talk about themselves, some quite personally.
The quantitative element of this study used only tried and tested psychological scales and
significant differences were found, as hypothesised. These significant findings were enhanced
further by the richness of qualitative data gathered and analysed. The sample size was quite
adequate with a good ratio split between the two conditions and with good representation across
the age groups and sexes.
In conclusion, the findings in this study call for a need for a more contemporary
approach by researchers when analysing and addressing variables that help to promote
Page 50
49
psychologically healthy workplaces and for these new learnings to be communicated effectively
to employers and policymakers. Psychological well-being in the workplace is an area that has
been heavily researched by organisational psychologists, but perhaps what is lacking are real
practical models that are fit for purpose in creating healthy work environments and healthy
minds. Employers may not fully understand and recognise the far-reaching and mutual benefits
that are to be had by adopting and managing flexible work constructs. Failure to be cognisant of
peoples’ needs comes with serious consequences, as has been evidenced across the globe in
recent years and outlined in this paper. Herzberg (1987) spoke of how people want to be
interested, motivated and engaged, but not forgotten, ignored or left behind. Significant
findings, such as those found in this study and comparable studies, coupled with Kelloway &
Day’s (2005a) holistic model of adopting a broader approach, should act as a blueprint for
future researchers, policymakers and management interested in harvesting psychological well-
being in today’s workplaces.
Page 51
50
REFERENCES
Barnes, A. (2018). Perpetual Guardian Newsletter. Retrieved from
https://www.perpetualguardian.co.nz/images/uploads/Spring_2018_Newsletter_Web.pdf
Braun, V., and Clarke, V. (2006). Using thematic analysis in psychology. Qualitative Research
in Psychology, 3: 2, 77 – 101.
Chang, A., McDonald, P. and Burton, P. (2010). Methodological choices in work-life balance
research 1987 to 2006: a critical review. The International Journal of Human Resource
Management, 21(13), 2381-2413.
Chen, A., & Karahanna, E. (2018). Life interrupted: The Effects of Technology Mediated Work
Interruptions on Work and Non Work Outcomes. MIS Quarterly, 42(4), 1023-1042. doi:
10.25300/MISQ/2018/13631
Chmiel, N., Fraccaroli, F., & Sverke, M. (2017). An introduction to work and organizational
psychology (3rd ed.). NJ: Wiley Blackwell.
COHEN, J. (1988). Statistical power analysis for the behavioral sciences. Hove: Lawrence
Erlbaum Associates.
Cohen, S., Kamarck, T. and Mermelstein, R. (1983). A Global Measure of Perceived
Stress. Journal of Health and Social Behavior, 24(4), 385. DOI:
https://doi.org/10.2307/2136404
Cooper, C. and Cartwright, S. (1994). Healthy Mind; Healthy Organization— A Proactive
Approach to Occupational Stress. Human Relations, 47(4), 455-471.
Cronbach, L. (1951). Coefficient alpha and the internal structure of tests. Psychometrika, 16(3),
297-334. http://dx.doi.org/10.1007/bf02310555
Day, A., Kelloway, E. and Hurrell, J. (2014). Workplace well-being. Pondicherry: SPi
Publisher Services.
Page 52
51
Diener, E., Emmons, R., Larsen, R. and Griffin, S. (1985). The Satisfaction With Life
Scale. Journal of Personality Assessment, 49(1), 71-75. DOI:
https://doi.org/10.1207/s15327752jpa4901_13
Employment (Miscellaneous Provisions) Act 2018. (2019). Retrieved from
http://www.welfare.ie/en/pages/Employment_(Miscellaneous_Provisions)_Act_2018.aspx
Fleming, P. (2014). Review Article: When 'life itself' goes to work: Reviewing shifts in
organizational life through the lens of biopower. Human Relations, 67(7), 875-901. doi:
10.1177/0018726713508142
Gallup Inc., (2016). Millennials: The Job-Hopping Generation. Retrieved from
https://www.gallup.com/workplace/231587/millennials-job-hopping-generation.aspx
Gambles, R., Lewis, S. and Rapoport, R. (2006). The Myth of work-life balance. Chichester,
England: John Wiley & Sons.
Gonzalez-Mulé, E., & Cockburn, B. (2016). Worked to Death: The Relationships of Job
Demands and Job Control with Mortality. Personnel Psychology, 70(1), 73-112. doi:
10.1111/peps.12206
Gordon, D. (2018). Home work: why more Irish employees want to work remotely. Irish Times.
Retrieved from http://Home work: why more Irish employees want to work remotely
Gyanchandani, R. (2017). A Qualitative Study on Work-Life Balance of Software
Professionals. IUP Journal Of Organizational Behavior, 16(4), 53-67.
Hackman, J., & Oldham, G. (1975). Development of the Job Diagnostic Survey. Journal Of
Applied Psychology, 60(2), 159-170. doi: 10.1037/h0076546
Henley, J. (2018). How hi-vis yellow vest became symbol of protest beyond France. Retrieved
from https://www.theguardian.com/world/2018/dec/21/how-hi-vis-yellow-vest-became-
symbol-of-protest-beyond-france-gilets-jaunes
Page 53
52
Herzberg, F. (1987). One more time: how do you motivate employees? HBS Reprint No. 87507.
Boston, MA: Harvard Business School Publishing
Hinsliff, G. (2013). The merge: how our work-life balance is changing. The Guardian. Retrieved
April 8, 2018, from https://www.theguardian.com/money/2013/jan/01/merge-work-life-
balance
HSA. (2018). Bullying at Work - Health and Safety Authority. Retrieved from
https://www.hsa.ie/eng/Workplace_Health/Bullying_at_Work/
Hughes, J., & Bozionelos, N. (2007). Work-life balance as source of job dissatisfaction and
withdrawal attitudes: An exploratory study on the views of male workers. Personnel
Review, 36(1), 145-154. http://dx.doi.org/10.1108/00483480710716768
Hyacinth, B., (2017). Why Employees Come First, Customers Second, and Shareholders Third.
Retrieved December 17, 2018 from https://www.linkedin.com/pulse/why-employees-come-
first-customers-second-third-brigette-hyacinth?trk=eml-email_feed_ecosystem_digest_01-
recommended_articles-7-
Unknown&midToken=AQFJMkyVj6ShZw&fromEmail=fromEmail&ut=2CwK6z2eosZ8
01
Jeffrey, K., Mahony, S., Michaelson, J., & Abdalla, S. (2014). Well-being at work. London, UK:
New Economics Foundation.
Judge, T., Thoresen, C., Bono, J., & Patton, G. (2001). The job satisfaction-job performance
relationship: A qualitative and quantitative review. Psychological Bulletin, 127(3), 376-407.
doi: 10.1037//0033-2909.127.3.376
Kelloway, E., & Day, A. (2005a). Building Healthy Workplaces: What We Know So
Far. Canadian Journal Of Behavioural Science/Revue Canadienne Des Sciences Du
Comportement, 37(4), 223-235. doi: 10.1037/h0087259
Page 54
53
Kelloway, E., & Day, A. (2005b). Building Healthy Workplaces: Where We Need to
Be. Canadian Journal Of Behavioural Science/Revue Canadienne Des Sciences Du
Comportement, 37(4), 309-312. doi: 10.1037/h0087265
Kennedy, M. (2018). Bank intern Moritz Erhardt died from epileptic seizure, inquest told.
Retrieved from https://www.theguardian.com/business/2013/nov/22/moritz-erhardt-
merrill-lynch-intern-dead-inquest
Kossek, E.E., and Ozeki, C. (1999), ‘Bridging the Work-Family Policy and Productivity Gap: A
Literature Review’, Community, Work and Family, 2(1), 7-32.
LoMonaco-Benzing, R., & Ha-Brookshire, J. (2016). Sustainability as Social Contract: Textile
and Apparel Professionals’ Value Conflicts within the Corporate Moral Responsibility
Spectrum. Sustainability, 8(12), 1278. doi: 10.3390/su8121278
Mauldin, J. (2016). 3 Reasons Brits Voted For Brexit. Retrieved from
https://www.forbes.com/sites/johnmauldin/2016/07/05/3-reasons-brits-voted-for-
brexit/#13ca8b8a1f9d
Messersmith, J. (2007). Managing work-life conflict among information technology
workers. Human Resource Management, 46(3), 429-451.
Michel, A. (2011). Transcending Socialization. Administrative Science Quarterly, 56(3), 325-
368. doi: 10.1177/0001839212437519
Motro, D., Ordonez, L., & Pittarello, A. (2014). Investigating the Effects of Anger and Guilt on
Unethical Behavior: A Self Regulation Approach. Academy Of Management
Proceedings, 2014(1), 16865. doi: 10.5465/ambpp.2014.123
O'Riordan, J. (2018). The Practice of Human Resource Management. Retrieved from
https://www.ipa.ie/_fileUpload/Documents/THE_PRACTICE_OF_HRM.pdf
Oswald, A., Proto, E., & Sgroi, D. (2015). Happiness and Productivity. Journal Of Labor
Economics, 33(4), 789-822. doi: 10.1086/681096
Page 55
54
Pavot, W., Diener, E., Colvin, C., & Sandvik, E. (1991). Further Validation of the Satisfaction
With Life Scale: Evidence for the Cross-Method Convergence of Well-Being
Measures. Journal Of Personality Assessment, 57(1), 149-161. doi:
10.1207/s15327752jpa5701_17
Pavot, W., & Diener, E. (1993). Review of the Satisfaction With Life Scale. Psychological
Assessment, 5(2), 164-172. doi: 10.1037//1040-3590.5.2.164
Piliavin, J., & Siegl, E. (2007). Health Benefits of Volunteering in the Wisconsin Longitudinal
Study. Journal Of Health And Social Behavior, 48(4), 450-464. doi:
10.1177/002214650704800408
Russell, H., Maitre, B., Watson, D., & Fahey, E. (2018). Job stress and working conditions;
Ireland in comparative perspective. Retrieved December 18, 2018 from
https://www.esri.ie/pubs/RS84.pdf
Schieman, S., Glavin, P., & Milkie, M. (2009). When Work Interferes with Life: Work-Nonwork
Interference and the Influence of Work-Related Demands and Resources. American
Sociological Review, 74(6), 966-988. doi: 10.1177/000312240907400606
Sgroi, D. (2015). Happiness and Productivity: Understanding the HappyProductive
Worker. SMF-CAGE Global Perspectives Series, 2-20.
Smith, J. (2016). Here's why workplace stress is costing employers $300 billion a year. Retrieved
from https://www.businessinsider.com/how-stress-at-work-is-costing-employers-300-
billion-a-year-2016-6
Thompson, E., & Phua, F. (2012). A Brief Index of Affective Job Satisfaction. Group &
Organization Management, 37(3), 275-307. doi: 10.1177/1059601111434201
Vallejo, M., Vallejo-Slocker, L., Fernández-Abascal, E., & Mañanes, G. (2018). Determining
Factors for Stress Perception Assessed with the Perceived Stress Scale (PSS-4) in Spanish
and Other European Samples. Frontiers In Psychology, 9. doi: 10.3389/fpsyg.2018.00037
Page 56
55
Warhurst, C., Eikhof, D. and Haunschild, A. (2008). Work less, live more?. Houndmills:
Palgrave Macmillan.
Warren, T. (2015). Work-life balance/imbalance: the dominance of the middle class and the
neglect of the working class. The British Journal of Sociology, 66(4), pp.691-717.
Warr, P., & Inceoglu, I. (2017). Work Orientations, Well-Being and Job Content of Self-
Employed and Employed Professionals. Work, Employment And Society, 32(2), 292-311.
doi: 10.1177/0950017017717684
Wood, A. (2016). Flexible scheduling, degradation of job quality and barriers to collective
voice. Human Relations, 69(10), 1989-2010. doi: 10.1177/0018726716631396
Wood, S. J., & Michaelides, G. (2016). Challenge and hindrance stressors and wellbeing-based
work–nonwork interference: A diary study of portfolio workers. Human Relations, 69(1),
111–138. https://doi.org/10.1177/0018726715580866
Wu, S., & Amtmann, D. (2013). Psychometric Evaluation of the Perceived Stress Scale in
Multiple Sclerosis. ISRN Rehabilitation, 2013, 1-9. doi: 10.1155/2013/608356
Zelenski, J., Murphy, S., & Jenkins, D. (2008). The Happy-Productive Worker Thesis
Revisited. Journal Of Happiness Studies, 9(4), 521-537. doi: 10.1007/s10902-008-9087-4
Zurcher, A. (2016). Five reasons Donald Trump won. Retrieved from
https://www.bbc.com/news/election-us-2016-37918303