WORK PLAN ADDENDUM #1 IN SITU CHEMICAL OXIDATION FIELD EXPERIMENT SANTA SUSANA FIELD LABORATORY VENTURA COUNTY, CALIFORNIA Prepared For: The Boeing Company The National Aeronautics and Space Administration The United States Department of Energy Prepared By: MWH 2121 North California Blvd. Suite 600 Walnut Creek, California 94596 January 2012
Transcript
WORK PLAN ADDENDUM #1 IN SITU CHEMICAL OXIDATION FIELD EXPERIMENT SANTA SUSANA FIELD LABORATORY
VENTURA COUNTY, CALIFORNIA Prepared For: The Boeing Company The National Aeronautics and Space Administration The United States Department of Energy Prepared By: MWH 2121 North California Blvd. Suite 600 Walnut Creek, California 94596 January 2012
In Situ Chemical Oxidation Field Experiment Work Plan Addendum #1 Santa Susana Field Laboratory, Ventura County, California January 2012
2.0 IN SITU CHEMICAL OXIDATION FIELD EXPERIMENT SCOPE OF WORK ............................................................................................................................ 2-1
In Situ Chemical Oxidation Field Experiment Work Plan Addendum #1 Santa Susana Field Laboratory, Ventura County, California January 2012
ii
LIST OF TABLES
Table 1 Plan Overview, In Situ Chemical Oxidation Field Experiment
Table 2 Work Scope Phases and Quantities
Table 3 Recommended Injection System Equipment Specifications
Table 4 Performance Monitoring and Sampling Schedule
LIST OF FIGURES
Figure 1 ISCO Field Experiment Well Layout
Figure 2 RD-35A Proposed Injection Well Construction Diagram
Figure 3 Process and Instrumentation Diagram
LIST OF APPENDICES
Appendix A Steady-State Simulations of Injection Flow Rate in Deepened Well RD-35A
Appendix B Example Rock Core Log
Appendix C Criteria for Geophysical Logging
Appendix D Boeing/DOE Investigation Derived Waste Memorandum
Appendix E Permanganate ISCO Laboratory Treatability Study Work Plan
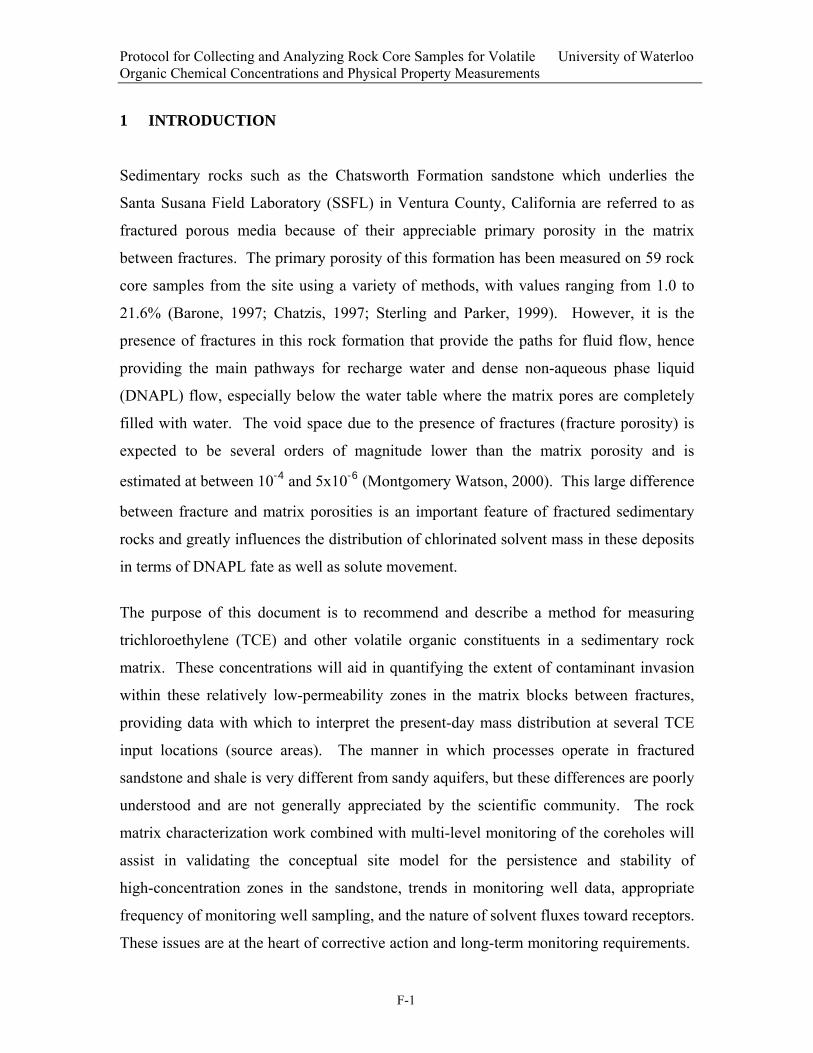
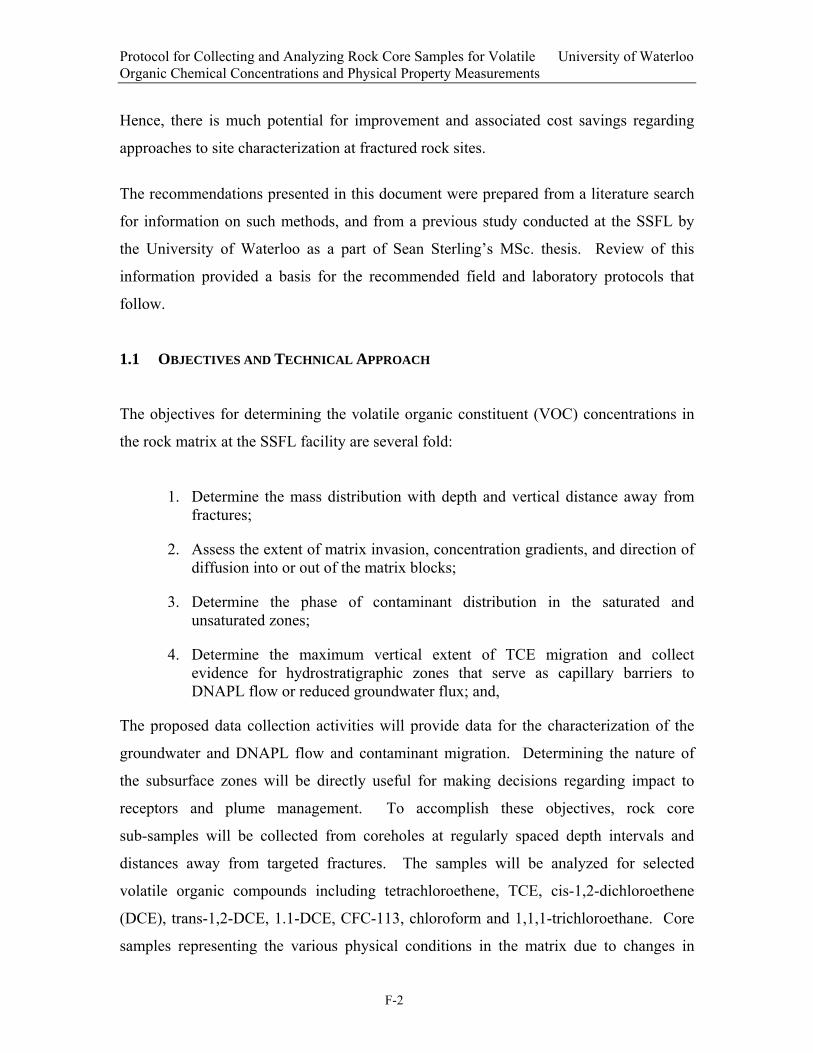
Appendix F Protocol for Collecting and Analyzing Rock Core Samples for Volatile Organic Chemical Concentrations and Physical Properties
In Situ Chemical Oxidation Field Experiment Work Plan Addendum #1 Santa Susana Field Laboratory, Ventura County, California January 2012
iii
LIST OF ABBREVIATIONS AND ACRONYMS
ASTM American Society of Testing and Materials
bgs below ground surface
Boeing The Boeing Company
DTSC Department of Toxic Substances Control
FLUTe Flexible Liner Underground Technology, Inc.
FS feasibility study
g/L grams per liter
gpm gallons per minute
HASP Health and Safety Plan
HDPE high density polyethylene
IEL Instrument and Equipment Laboratory
ISCO In Situ Chemical Oxidation
KMnO4 potassium permanganate
MnO4- permanganate anion
ORP oxidation-reduction potential
PVC polyvinyl chloride
QAPP Quality Assurance Project Plan
RCRA Resource Conservation and Recovery Act
RFI RCRA Facility Investigation
SOP Standard Operating Procedure
SSFL Santa Susana Field Laboratory
TCE trichloroethene
TM technical memorandum
USBR United States Bureau of Reclamation
USEPA United States Environmental Protection Agency
VOC volatile organic compound
WDR Waste Discharge Requirements
XLPE cross-linked polyethylene
In Situ Chemical Oxidation Field Experiment Work Plan Addendum #1 Santa Susana Field Laboratory, Ventura County, California January 2012
1-2
1.0 INTRODUCTION
An In Situ Chemical Oxidation (ISCO) Field Experiment Work Plan was submitted to the
California Department of Toxic Substances Control (DTSC) in June 2009 (MWH, 2009). The
purpose of the ISCO field experiment is to collect field data that will aid in evaluating the
effectiveness, implementability and cost of using in situ chemical oxidation as a technology for
removing volatile organic compounds (VOCs) from the saturated bedrock of the Chatsworth
Formation that underlies Santa Susana Field Laboratory (SSFL). Results from implementing the
ISCO field experiment will be used in the feasibility study (FS) that will be conducted for SSFL.
The ISCO field experiment work plan was conditionally approved by DTSC on April 29, 2011.
The Boeing Company (Boeing) provided written responses to DTSC’s conditional approval in a
letter dated November 9, 2011 (Boeing, 2011). The June 2009 Work Plan provides supporting
background information including a set of performance criteria for the field experiment.
This work plan addendum supplements the original ISCO field experiment work plan and
includes information requested in DTSC’s April 29, 2011 letter. The following additional
information is provided in this addendum:
• List of work elements or tasks to be implemented to accomplish the field experiment (Scope of Work).
• Quantity information to support cost estimating necessary for development and evaluation of proposals from candidate contractors.
• Specifications for testing and sampling procedures and methods, including references to relevant existing site-wide procedures documents.
• Field test sequencing and phasing outline. A more detailed project schedule will be submitted by the selected ISCO field test contractor.
In Situ Chemical Oxidation Field Experiment Work Plan Addendum #1 Santa Susana Field Laboratory, Ventura County, California January 2012
2-1
2.0 IN SITU CHEMICAL OXIDATION FIELD EXPERIMENT SCOPE OF WORK
Based on an evaluation of sixteen candidate sites, the Instrument and Equipment Laboratory
(IEL) Resource Conservation and Recovery Act (RCRA) Facility Investigation (RFI) Site was
selected to conduct the field experiment and well RD-35A was selected as the injection well.
Figure 1 shows the field experiment area and injection well RD-35A location.
Performance objectives for the ISCO field experiment include:
1. Evaluate the delivery and distribution of oxidant in the fractured sandstones of the Chatsworth Formation.
2. Assess the extent of oxidation of trichloroethene (TCE) (and its daughter products) in the rock matrix.
3. Evaluate the magnitude of contaminant concentration reduction in the rock matrix.
4. Assess the natural oxidant demand of the minerals and/or organics present in the rock matrix.
5. Assess the magnitude and extent of mineral deposits on the solid surfaces of the rock associated with the oxidation reaction.
6. Assess the occurrence and effects of the precipitation of oxidation reaction by-products in the fracture system.
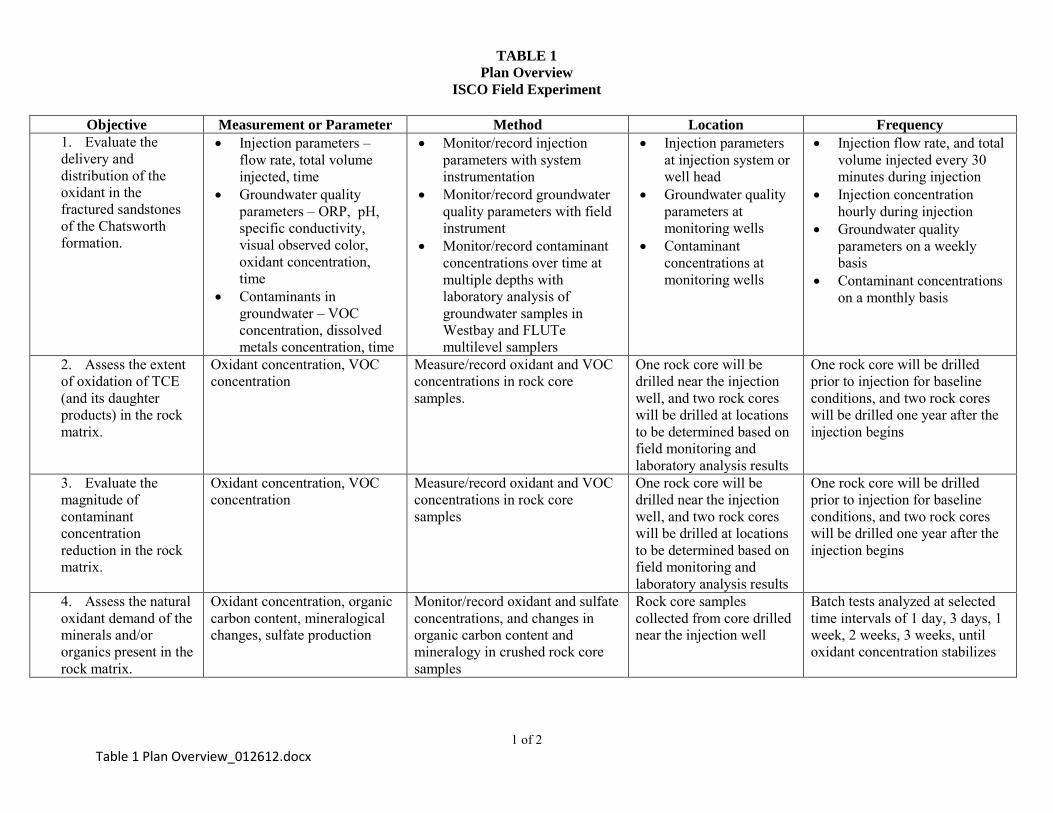
Table 1 lists these objectives; the data that are needed to assess performance for each objective;
the method to be used to collect those data; the location(s) from which the data will be collected;
and the frequencies of data collection. The following sections outline work scope elements of
the ISCO field experiment. Table 2 shows phasing and general sequencing of the work scope
elements and provides quantity information for materials and equipment required for the field
experiment, including installation, operation and performance monitoring.
2.1 PERMITTING
Obtain the following permits to perform the ISCO field experiment:
1) Well installation permits from Ventura County for re-drilling RD-35A and drilling/installing two new monitoring wells and a pre-injection corehole;
2) Los Angeles County Regional Water Quality Control Board General Waste Discharge Requirements (WDR) for Groundwater Remediation at Petroleum Hydrocarbon Fuel and/or Volatile Organic Compound Impacted Sites (Order No. R4-2005-0030);
In Situ Chemical Oxidation Field Experiment Work Plan Addendum #1 Santa Susana Field Laboratory, Ventura County, California January 2012
2-2
3) Building permit from the Ventura County Resource Management Agency, Building and Safety Division, and
4) Ventura County Fire Protection Division Hazardous Materials Permit.
2.2 PRE-FIELD WORK DOCUMENTS
The contractor will operate under its own Health and Safety Plan (HASP) that should include:
1) Site Background/History/Work Plan; 2) Key Personnel and Responsibilities; 3) Job Hazard Analysis/Summary; 4) Personal Protection; 5) Chemical Storage and Handling Plan; 6) Site Control; 7) Decontamination; 8) Contingency Planning; 9) Spill Containment; and 10) Other applicable requirements based on the work to be performed.
The contractor will operate under a site-wide Quality Assurance Project Plan (QAPP) (Haley &
Aldrich, 2010aand MECx, 2009), but will be responsible for preparing a task-specific QAPP that
should include:
1) Project organization and responsibilities with respect to sampling and analysis;
2) Quality assurance objectives for measurement including accuracy, precision, and method detection limits;
3) Sampling procedures;
4) Sample custody procedures and documentation;
5) Field and laboratory calibration procedures;
6) Analytical procedures;
7) Laboratory to be used must be certified pursuant to Health and Safety Code section 25198;
8) Specific routine procedures used to assess data (precision, accuracy and completeness) and response actions;
9) Reporting procedure for measurement of system performance and data quality;
10) Data management, data reduction, validation and reporting; and
11) Internal quality control.
In Situ Chemical Oxidation Field Experiment Work Plan Addendum #1 Santa Susana Field Laboratory, Ventura County, California January 2012
2-3
A Chemical Handling Plan will be prepared for chemicals required in monitoring, testing,
injection, and decontamination procedures during the field experiment. The plan will include:
1) General chemical information including material safety data sheets; 2) Chemical suppliers and delivery volumes; 3) Maximum onsite storage volumes; 4) Storage locations; 5) Chemical handling procedures; 6) Health and safety; 7) Chemical disposal; and 8) Chemical spill procedures.
An Implementation Plan will be prepared consisting of:
1) Final design drawings (process and instrumentation, electrical, and plan view equipment layout);
2) Equipment shop drawings and specification sheets for the field experiment injection system.
3) Operation Plan describing equipment operation including stepwise start/stop procedures, batch mixing procedures, and overall sequencing of mixing, injection, and monitoring steps.
2.3 DRILLING AND MONITORING WELL INSTALLATION
1) Drill out and remove casing from well RD-35A and install a new injection well to 150 feet below ground surface (bgs). RD-35A is currently a 12-1/4-inch borehole with 8-1/4-inch casing from 0 to 19.5 feet bgs, and a 6-1/4-inch borehole from 19.5 feet to 110 feet bgs with a 4-inch casing from 19.5 feet to 105.5 feet bgs. The new well will consist of a 10-inch diameter low carbon steel conductor casing (0.188-inch wall thickness) from 0 to 112 feet bgs. An 8-inch diameter open borehole will initially be drilled to a total depth of 150 feet. A well construction diagram for injection well RD-35A is provided in Figure 2.
Steady-state simulations with differing assumptions for hydraulic conductivity were performed on the new injection well design to evaluate the design flow rate. The results are included in Appendix A. A constant head injection test will be performed once the well has been drilled to confirm the design injection flow rate can be achieved in the field. If the flow rate observed during the slug test is not acceptable, the well may be deepened until a sufficient open interval is established. Details describing overdrilling, deepening, and performing the injection test are provided below.
a. The existing well and infrastructure will be overdrilled using a mud-rotary drilling method to remove existing well materials. The appropriate size rotary drill bit will be used to drill within the existing 8-1/4-inch steel casing, and drill out and remove the existing 4-inch diameter blank and perforated PVC casing to its total
In Situ Chemical Oxidation Field Experiment Work Plan Addendum #1 Santa Susana Field Laboratory, Ventura County, California January 2012
2-4
depth (~105.5 feet bgs). A “bullnose-type” drill bit will be used to allow centering over the 4-inch PVC casing.
b. Additional circulation of the hole will be performed once total depth of the PVC casing is reached to remove any remaining broken pieces of the PVC casing.
c. The existing 8-1/4-inch conductor casing and grout will then be removed by over-drilling with the appropriate size “wash-over” casing (approximately 12-5/8 inches in diameter). The lead piece of this specialty casing will be equipped with drill teeth that have been welded onto the end of the casing. The wash-over casing will be advanced to a depth of approximately 20 feet bgs. The existing casing will be removed and associated grout drilled and circulated out of the hole.
d. Temporary 16-inch diameter casing will then be driven in the hole to seal the alluvial overburden (approximately 10 feet) and provide a temporary conductor for drilling the hole to set the 10-inch permanent conductor casing to 112 feet bgs.
e. A 14-inch diameter rotary bit will then be used to drill to 112 feet bgs.
f. The hole will be thoroughly circulated to remove previously existing well materials and grout.
g. Drill mud will then be thinned out and removed from the hole. The temporary 16-inch conductor casing will be removed and a 10-inch low carbon steel permanent conductor casing (0.188-inch wall thickness) will be grouted in place. Grout will be Type II Portland cement and sand mixed with a maximum of 6 gallons of water per 94-pound bag of cement.
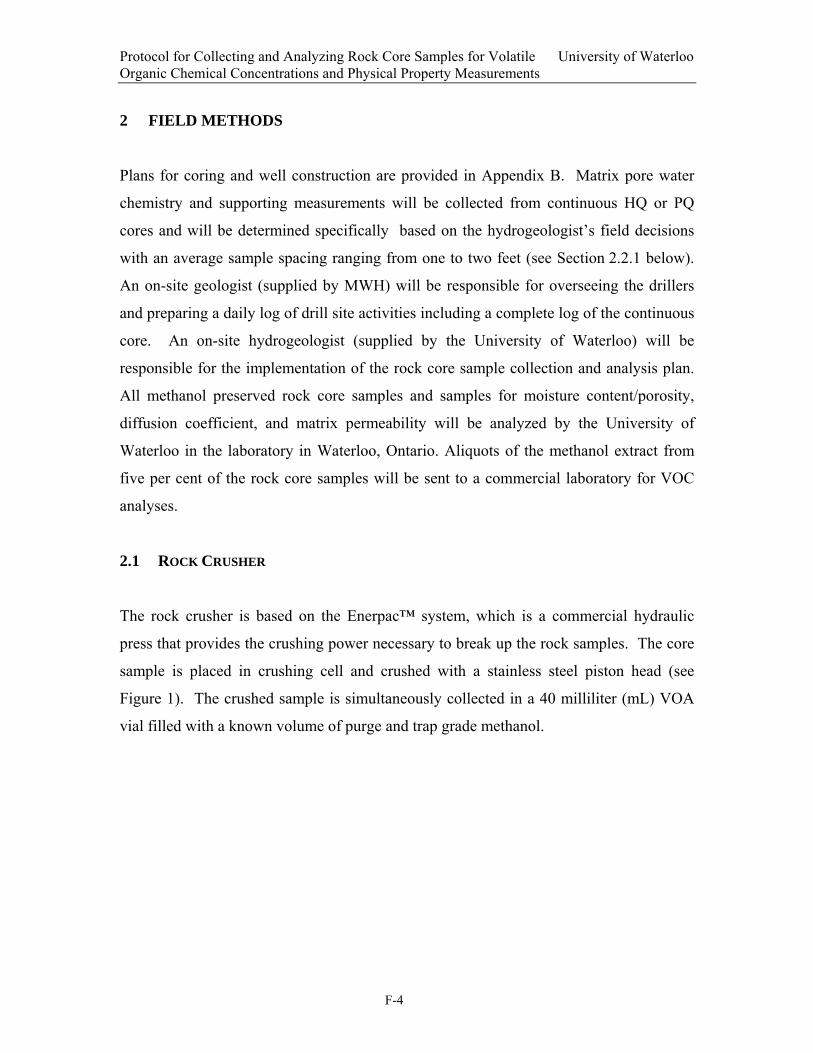
h. After the casing grout has cured (minimum 24 hours), the remainder of the hole will be an open borehole, cored by air rotary drilling to a total depth of 150 feet bgs. The drilling rig will be equipped to core and retrieve HQ-size core (4-inch nominal outside diameter) at 5-foot lengths from the open borehole. Core will be retrieved using an HQ3 triple barrel with split ring inner barrel and logged according to the United States Bureau of Reclamation (USBR) Engineering Geology Field Manual (Chapter 10, 2nd edition, 1998). An example log is provided in Appendix B. Core will be placed into core boxes at the drill site and select sections subsequently shipped to the University of Guelph for bench testing described below in Section 2.4. Sections of core to be selected for shipment will be as directed by the University of Guelph research staff.
i. Once coring has been completed, the borehole will be reamed using air rotary drilling to 8 inches in diameter and a depth of 150 feet bgs.
The open borehole portion of the well will then be developed via bailing, pumping and/or air lifting and allowed to settle for 24 hours.
j. Following development, the 8-inch corehole will be logged from 112 feet to its total depth using the following geophysical/hydrophysical tools and methods: video, natural gamma, caliper, induction resistivity, acoustic televiewer, fluid temperature and heat-pulse flow meter. Geophysical logging will be conducted according to the following American Society of Testing and Materials (ASTM) standards, with additional criteria specified in Appendix B. Borehole geophysical
In Situ Chemical Oxidation Field Experiment Work Plan Addendum #1 Santa Susana Field Laboratory, Ventura County, California January 2012
2-5
log reporting format will be as specified in American Petroleum Institute Recommended Practice 31A (1997), with an additional submittal of the logs via electronic source files and portable document format files.
i. D5753-05 (reapproved 2010) – Standard Guide for Planning and Conducting Borehole Geophysical Logging,
ii. D6726-01 (reapproved 2007) – Standard Guide for Conducting Borehole Geophysical Logging: Electromagnetic Induction,
iii. D6274-98 (reapproved 2004) – Standard Guide for Conducting Borehole Geophysical Logging: Gamma, and
iv. D6127-97 (reapproved 2004) – Standard Guide for Conducting Borehole Geophysical Logging: Mechanical Caliper.
k. The geophysical/hydrophysical logs will be evaluated to identify transmissive fractures in the open borehole and an appropriate injection interval will be selected. Straddle packers will then be installed to isolate the selected injection interval.
l. A one-day constant head injection test will be performed to confirm the selected open borehole interval can accept the design injection flow rate. A pressure transducer with a data logger will be placed down the well, and a tank filled with hydrant water will be connected to the well and allowed to gravity flow into the formation while flow rate is measured and recorded. If a flow rate of 1.5 gpm cannot be maintained during the test, the straddle packer interval may be adjusted and/or the injection well may be drilled deeper to access sufficiently transmissive fractures and create the required open interval. Results from the constant head injection test and geophysical/hydrophysical logging will be evaluated and used to confirm or modify the required open interval.
m. Alluvium, rock and water generated during re-drilling and development of RD-35A will be stored in roll-off bins. Waste characterization and disposal will be the responsibility of Boeing and compliant with the procedures described in Appendix D.
2) Drill and sample one corehole adjacent to RD-35A to establish baseline conditions of VOCs in the rock matrix prior to oxidant injection.
a. The hole will be cored by air rotary drilling to a total depth of 150 feet bgs. The drilling rig will be equipped to core and retrieve NQ-size core (3-inch nominal outside diameter) at 5-foot lengths from the open borehole.
b. Continuous core will be retrieved using an NQ3 triple barrel with split ring inner barrel and logged according to the United States Bureau of Reclamation (USBR) Engineering Geology Field Manual (Chapter 10, 2nd edition, 1998). An example log is provided in Appendix B.
c. Collected cores will then be sampled from a depth of 80 feet to total depth according to procedures described below in Section 2.7.6.
In Situ Chemical Oxidation Field Experiment Work Plan Addendum #1 Santa Susana Field Laboratory, Ventura County, California January 2012
2-6
d. Alluvium, rock and water generated during drilling will be stored in roll-off bins. Waste characterization and disposal will be the responsibility of Boeing and compliant with the procedures described in Appendix D.
e. Upon completing the corehole, the hole will be grouted according to California Well Standards (California Department of Water Resources, 1991) and Ventura County Well Permit guidelines.
3) Drill two new 6-inch diameter monitoring wells to 250 feet bgs at distances of approximately 50 and 100 feet to the northeast from injection well RD-35A. Figure 1 shows approximate locations of the two new monitoring wells to be installed.
a. The drilling location will be cleared of potential subsurface features using surface geophysical methods and hand augering/air knifing to a depth of 5 feet or to top of bedrock, whichever is shallower.
b. A 12-inch diameter borehole will be drilled through the unconsolidated alluvial sediments (if any), weathered bedrock, and into competent bedrock (approximately 10 feet bgs) and an 8-inch PVC conductor casing will be installed in the center of the hole and grouted in place. Grout will be Type II Portland cement and sand mixed with a maximum of 6 gallons of water per 94-pound bag of cement.
c. After the casing grout has cured (minimum 24 hours), the remainder of the hole will be drilled by air rotary drilling using a rotary hammer bit to create a 6-inch diameter open borehole to a total depth of 250 feet bgs.
d. The borehole will be logged using the following geophysical tools and methods: video, natural gamma, caliper, induction resistivity and acoustic televiewer. The procedures and standards described in 1) k above will be followed.
e. Alluvium, rock and water generated during drilling will be stored in roll-off bins. Waste characterization and disposal will be the responsibility of Boeing and compliant with the procedures described in Appendix D.
f. The final open borehole portion of the well will then be developed via bailing, pumping and/or air lifting. Disposition of well development water will be as above in item e.
g. After the hole is completed, equipment will be demobilized and the second monitoring well location is to be cored following steps 2a through 2f above.
h. Following completion of each borehole, a 10-port water FLUTe multilevel water sampling system will be installed. Depths of individual FLUTe ports will be selected based on vadose zone thickness and data obtained from geophysical logging of the corehole. The multilevel sampling systems will be installed by FLUTe personnel or those specifically trained by FLUTe.
4) Install 10-port water FLUTe multilevel sampling system in corehole C-10 (5-1/2-inch diameter coreholes) to a total depth of 250 feet bgs. Depths of individual FLUTe ports will be selected based on data obtained from geophysical logging of the corehole. Note: The ISCO field experiment work plan specified a FLUTe multilevel
In Situ Chemical Oxidation Field Experiment Work Plan Addendum #1 Santa Susana Field Laboratory, Ventura County, California January 2012
2-7
sampling system would be installed in corehole C-1. However, the corehole currently has core pipe installed to a depth of 300 feet to prevent collapse of the hole, hence a FLUTe sampling system will not be installed.
5) Approximately one year after initiating oxidant injection, drill two coreholes and collect rock core from first encountered groundwater to a depth of 150 feet bgs in the test area to evaluate the magnitude and extent of oxidant delivery and contaminant transformation. Exact locations of each rock core will be selected based on field experiment performance monitoring and laboratory analytical results.
a. The rock cores will be cored by air rotary drilling to a total depth of 150 feet bgs. The drilling rig will be equipped to core and retrieve continuous NQ-size core (3-inch nominal outside diameter) in 5-foot lengths from the open borehole.
b. Core will be retrieved using an NQ3 triple barrel with split ring inner barrel and logged according to the United States Bureau of Reclamation (USBR) Engineering Geology Field Manual (Chapter 10, 2nd edition, 1998). An example log is provided in Appendix B.
c. Collected cores will then be sampled according to procedures described below in Section 2.7.6.
d. Alluvium, rock and water generated during drilling will be stored in roll-off bins. Waste characterization and disposal will be the responsibility of Boeing and compliant with the procedures described in Appendix D.
e. Upon completing the coreholes, the holes will be grouted according to California Well Standards (California Department of Water Resources, 1991) and Ventura County Well Permit guidelines.
2.4 BENCH TESTING
Laboratory bench test treatability studies will be performed by the University of Guelph to
accomplish the following objectives:
1) Measure properties including porosity and the diffusion coefficient of permanganate in representative SSFL sandstone samples before and after treatment by permanganate;
2) Identify mineral-permanganate reactions that contribute to natural oxidant demand;
3) Measure permanganate consumption by reaction with naturally occurring minerals and organic carbon; and
4) Assess the potential for detrimental effects including fracture clogging and matrix porosity reduction due to formation of oxidation by-products (manganese dioxide and ferrous hydroxide).
Rock cores will be shipped to the University of Guelph for bench testing as directed by its
researchers. Tests will be conducted on both intact rock cores and crushed samples, and will
include batch tests, 1-D static diffusion testing, and 2-D flow through fracture tests. Elements of
In Situ Chemical Oxidation Field Experiment Work Plan Addendum #1 Santa Susana Field Laboratory, Ventura County, California January 2012
2-8
the bench test are further described in the Permanganate ISCO Treatability Study Work Plan
included as Appendix E.
2.5 INJECTION SYSTEM INSTALLATION
Provide and install the oxidant injection system. The oxidant injection system will be a batch
mix gravity feed system with the capacity to store a minimum of 2,000 gallons of oxidant
solution per batch and deliver oxidant to the subsurface at a maximum flow rate of 5.0 gallons
per minute (gpm). The oxidant injection system will be completely contained in secondary
containment constructed of 30 mil high density poly ethylene (HDPE) and designed to hold 1.25
times the capacity of the storage tank, and with enough surface area to store permanganate pails
required for a single day of batch injections. Injection well RD-35A will be located within the
secondary containment and penetrate the HDPE liner. A flexible HDPE boot will be placed
around the well and welded to the secondary containment to seal the penetration. Injection
system equipment and materials that will be in contact with oxidant will be compatible with
aqueous potassium permanganate (KMnO4) at a concentration of 20 grams per liter (g/L) and
will be rated for outdoor use. The oxidant injection system will be composed of the following
major components:
o minimum 2,000 gallon cross-linked polyethylene (XLPE) tank equipped with electric mixer;
o recirculation pump;
o bag filter with 5-micron filter elements;
o inline static mixer;
o flow control valve;
o 0.5 – 5.0 gpm flow meter and totalizer;
o Two flow totalizers (one for fresh make up water and one for oxidant delivery); and
o 2,500-gallon secondary containment.
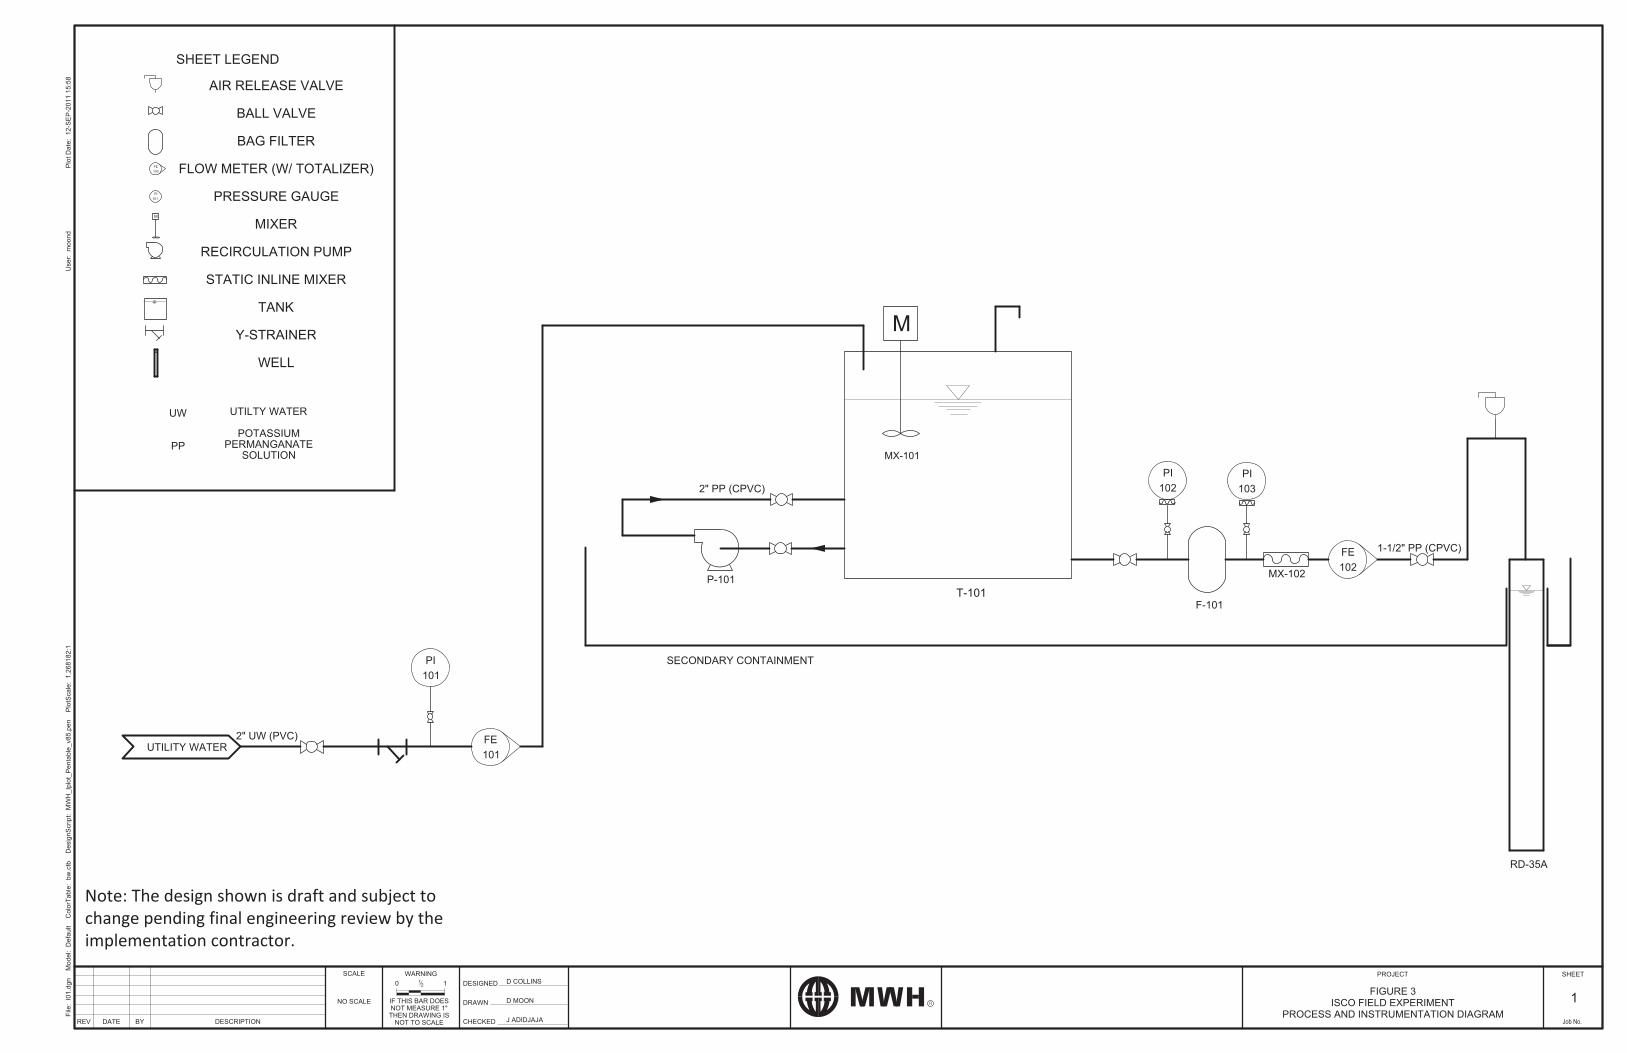
A process and instrumentation diagram showing overall process flow and major components is
shown on Figure 3 and recommended equipment specifications are provided in Table 3. Note:
This work plan is intended to allow for flexibility of the implementation contractor to amend
portions of the field experiment design depending on availability, professional judgment and
other factors. This includes final process configuration, equipment specifications, and selection
In Situ Chemical Oxidation Field Experiment Work Plan Addendum #1 Santa Susana Field Laboratory, Ventura County, California January 2012
2-9
of a solid or pre-mixed oxidant solution of potassium or sodium permanganate. Any changes or
deviations from this work plan addendum will be documented in the implementation plan.
2.6 OXIDANT INJECTION
The field experiment will consist of 10 injection events. Each event is planned to be five 8-hour
days. A period of 25 days will elapse between events to allow the oxidant to diffuse into the
bedrock matrix. Estimated event durations are based on delivering 720 gallons of 20 g/L
KMnO4 solution by gravity at a flow rate of 1.5 gpm into the formation during each 8-hour work
day. At the end of each day, the injection well will be filled with KMnO4 solution and allowed to
deliver oxidant throughout the night, resulting in an additional 370 gallons of oxidant delivery to
the formation. This will result in a daily injection volume of 1,090 gallons and a total of
5,450 gallons per injection event. After 10 events, a total of 54,500 gallons of oxidant solution is
estimated to be injected into the subsurface requiring 8,740 pounds of solid KMnO4. Actual
injection flow rates may change throughout the field experiment based on formation
transmissivity and may require longer field days or additional days of injection to reach target
injection volumes.
Field work during injection events will consist of mixing batches of oxidant solution for
subsurface delivery, injection equipment monitoring and tuning, and performance monitoring
(described below in Section 2.8).
2.7 PERFORMANCE MONITORING
Conduct performance monitoring consisting of measuring and recording injection system
parameters and groundwater quality parameters at surrounding monitoring wells, and collection
of groundwater and rock core samples for laboratory analysis.
2.7.1 Groundwater Monitoring Well Network
The monitoring well network will include the two new monitoring wells to be installed, RD-35B,
wells RD-31 and RD-35C have Westbay multilevel sampling systems installed and require
In Situ Chemical Oxidation Field Experiment Work Plan Addendum #1 Santa Susana Field Laboratory, Ventura County, California January 2012
2-10
sampling at 10 and 12 discrete ports, respectively. The two new monitoring wells and corehole
C-10 will have FLUTe multilevel sampling systems installed with 10 sampling ports in each
well. Monitoring well locations are shown on Figure 1.
Use of the existing wells for monitoring during the field experiment will require coordination
with the groundwater monitoring program at SSFL since these wells are currently being
monitored under the RCRA regulated unit and site-wide groundwater monitoring programs.
2.7.2 Groundwater Sampling Procedures
Groundwater monitoring and sampling will consist of the following elements:
• Pre-sampling preparation; • Calibration and use of field instruments; • Measurement of water levels in monitoring wells; • Purging of monitoring wells and monitoring of field parameters; • Groundwater sample collection and management; • Sample preservation and shipment; • Sample numbering; • Field documentation and chain-of-custody controls; • Equipment decontamination procedures; and • Waste containment and management.
The contractor will follow the Field Sampling Plan which describes the elements above and
includes standard operating procedures (SOPs). The Field Sampling Plan is part of the Site-
Wide Water Quality Sampling and Analysis Plan (Haley & Aldrich, 2010b). Field equipment
will be cleaned, calibrated, and checked for malfunction prior to monitoring and sampling.
Calibration records will be completed and maintained during the field experiment. Water levels
will be measured in all wells included in the monitoring well network prior to monitoring and
sampling activities.
Groundwater sampling at monitoring wells C-1, RD-35B, RD-37, RD-73, and HAR-25 will be
conducted following U.S. Environmental Protection Agency (USEPA) guidelines described in
Low-Flow (Minimal Drawdown) Ground-Water Sampling Procedures, EPA/540/S-95/504, April
1996. RD-73, WS-14, and HAR 24 will be sampled following conventional methods using a
variable speed submersible pump. All wells will be sampled following procedures described in
In Situ Chemical Oxidation Field Experiment Work Plan Addendum #1 Santa Susana Field Laboratory, Ventura County, California January 2012
2-11
the groundwater sampling and low-flow SOPs in the Site-Wide Water Quality SAP (Haley &
Aldrich, 2010b).
Monitoring wells RD-31 and RD-35C have Westbay multilevel sampling systems installed and
will be sampled following procedures outlined in the Site-Wide Water Quality SAP (Haley &
Aldrich, 2010b). Well RD-72 currently has a FLUTe multilevel sampling system, and
monitoring well C-10 and the two new monitoring wells proposed for the ISCO field experiment
will have FLUTe multilevel sampling systems installed. These wells will be sampled following
procedures outlined in the Site-Wide Water Quality SAP (Haley & Aldrich, 2010b). The
Westbay and FLUTe multilevel systems will only be operated and sampled by personnel trained
and experienced in the operation and sampling of these systems.
The contractor will coordinate with the laboratory for the delivery of appropriate bottle sets for
sampling and will be responsible for preservation, shipping, and chain-of-custody requirements.
The contractor will be responsible for documentation of sampling activities including water
levels, purge volumes, water quality parameters, sample collection time, location, sampler, and
analyses requested. Procedures for sample labeling, handling, shipping and documentation are
described in the Sample Management SOP in the Field Sampling Plan (Haley & Aldrich, 2010b).
If reusable sampling equipment is used during field activities, such equipment will be
decontaminated after each sample is collected. Procedures for decontamination are outlined in
the Equipment Decontamination SOP in the Field Sampling Plan.
Liquid waste generated during the groundwater monitoring, sampling and decontamination
activities will be temporarily stored on-site in approved containers prior to being transported to
Boeing’s hazardous waste storage area and relinquished to Boeing-assigned personnel for
appropriate disposal.
2.7.3 Oxidant Injection System Monitoring
The batch number, time and date, volume of fresh make up water and mass of solid KMnO4 for
each batch of oxidant solution mixed will be recorded. The MnO4- concentration in the oxidant
In Situ Chemical Oxidation Field Experiment Work Plan Addendum #1 Santa Susana Field Laboratory, Ventura County, California January 2012
2-12
solution storage tank will be measured and recorded after mixing each batch using a Hach
DR890 field spectrophotometer. Daily injection start and stop times and injection flow rate and
totalizer readings will be recorded during injection.
A pressure transducer with data logger will be placed in the injection well to monitor water level
and oxidant solution levels in the well during the field experiment. The transducer will be
connected to a laptop to allow the water level to be monitored real-time during injection events.
2.7.4 Water Quality Parameters and Analytical Procedures
Groundwater quality parameters to be recorded include oxidation-reduction potential (ORP), pH,
specific conductivity, temperature, MnO4- concentration, and visual observation of color.
Measurements will be performed using a Horiba U-22 multiparameter water quality meter (or
equivalent model) for ORP, pH, specific conductivity and temperature and a Hach DR 890 field
spectrophotometer will be used to measure MnO4- concentration.
Groundwater samples will be collected from the monitoring well network and analyzed for
VOCs by USEPA Method 8260 and dissolved metals by USEPA Method 6010. Laboratory
analyses will be performed by a California-certified testing laboratory using appropriate methods
and required QA/QC procedures as outlined in the QAPP (Haley & Aldrich, 2010a).
2.7.5 Groundwater Monitoring and Sampling Frequency
Groundwater quality parameters will be measured at each monitoring well and each port of the
multilevel sampling systems prior to delivering oxidant to the subsurface in order to establish
baseline conditions. Once delivery of oxidant to the subsurface begins, groundwater quality
parameters will be measured once per week. At the start of injection, groundwater quality
parameters will be measured at primary monitoring wells nearest to injection well RD-35A
including C-1, C-10, RD-31, RD-35B, RD-35C, RD-73 and the two new monitoring wells.
Additional secondary monitoring wells will be added to the sampling schedule as groundwater
quality parameters change (indicating impending arrival of oxidant) or permanganate is observed
in the wells initially being sampled. After completion of oxidant delivery to the subsurface,
In Situ Chemical Oxidation Field Experiment Work Plan Addendum #1 Santa Susana Field Laboratory, Ventura County, California January 2012
2-13
groundwater quality parameters will continue to be monitored on a weekly basis for two
quarters.
Groundwater samples will be collected for laboratory analysis from each of the wells in the test
monitoring network and each port of the multilevel sampling systems prior to delivering oxidant
to the subsurface in order to establish baseline contaminant concentrations. Once delivery of the
oxidant begins, groundwater samples for laboratory analysis will be collected from these wells
and each port of the multilevel sampling systems on a monthly basis. After the completion of
oxidant delivery to the subsurface, groundwater samples for laboratory analysis will be collected
from these wells and multilevel sampling system ports on a monthly basis for two additional
quarters. Sampling and monitoring well information is summarized in Table 4.
2.7.6 Rock Core Sampling
Three coreholes will be drilled to 150 feet bgs as described in Section 2.3. Rock core will be
logged by an onsite geologist and visual observations performed to evaluate potential
permanganate diffusion at fracture locations. Samples of rock core will be collected and
submitted for laboratory analysis at approximately every foot from first encountered
groundwater to total depth when there is no visible staining by permanganate. At fractures
observed in the core where permanganate staining is visible, samples will be collected at two
locations on each side of the fracture. The vertical distance of each sample location from the
affected fracture will depend on bench test results and field observations. Samples obtained
from individual rock cores will be crushed using the Enerpac™ system, placed in sample
containers filled with methanol, and sent to the University of Guelph for laboratory analysis of
VOCs. Rock crushing and sampling activities will follow procedures outlined in Protocol for
Collecting and Analyzing Rock Core Samples for Volatile Organic Chemical Concentrations and
Physical Property Measurements (Parker, et al, 2005), included as Appendix F to this work plan
addendum.
In Situ Chemical Oxidation Field Experiment Work Plan Addendum #1 Santa Susana Field Laboratory, Ventura County, California January 2012
2-14
2.8 DATA EVALUATION AND REPORTING
Data, results, and information obtained during installation, operation, and monitoring activities
performed as part of this field experiment will be summarized and presented in a series of
technical memoranda (TMs). Preliminary data from bench testing including natural oxidant
demand, the permanganate diffusion coefficient, and other bench test objectives will be
summarized by the University of Guelph and presented in a TM.
Following installation of the injection system, a TM will be prepared summarizing the following
activities:
i) Deepening of RD-35A including final well construction and well logging data; ii) Installation of the two new monitoring wells including final well construction and well
logging data; iii) Installation of the FLUTe multilevel sampling systems in the two new monitoring wells
and corehole C-10 including final depth intervals of sampling ports; and iv) Installation of the injection system including as-built drawings of system construction.
Groundwater quality parameters measured and laboratory analytical results of groundwater
samples collected during the operational phase of the field experiment will be reported in SSFL
quarterly groundwater monitoring and sampling reports.
A final data evaluation TM will be prepared after the completion of injection activities and post-
injection monitoring. This TM will contain data and results obtained during the field test and
include the following tables and figures at a minimum:
Tables
i) Results of constant-head injection test at RD-35A after deepening, ii) Log of injection flow rate, total volume injected, and pressure transducer readings
during injection events, iii) Log of batch mix volumes and concentrations, iv) Groundwater quality parameter field measurement results (ORP, specific
v) Groundwater sampling analytical results (VOC and dissolved metals).
In Situ Chemical Oxidation Field Experiment Work Plan Addendum #1 Santa Susana Field Laboratory, Ventura County, California January 2012
2-15
Figures
i) Site plan including surveyed locations of wells used for injection, monitoring and sampling during the field experiment,
ii) As-built drawings: a. Final well construction of RD-35A deepening, b. Construction of new FLUTe sampling systems, c. Well construction of new monitoring wells, and d. Field experiment KMnO4 injection system,
iii) Cross-sections of injection and monitoring wells (minimum of two), iv) Timeline of activities, v) Injection flow rate versus time, total volume injected, and pressure transducer
readings versus time during injection events, vi) Groundwater quality parameters (ORP, specific conductivity, pH, temperature,
MnO4- concentration) versus time,
vii) Groundwater sampling analytical results (VOC and dissolved metals) versus time, viii) Pre- and post-treatment rock core sampling analytical results (equivalent TCE
concentrations and cumulative TCE concentration versus depth) ix) Interpreted oxidant delivery extent (plan view), x) Interpreted oxidant extent of influence (plan view), xi) Borehole geophysical montages.
The final data evaluation TM will discuss objectives of the field test and whether they were
achieved, and present a summary and interpretation of the information and results such that in
situ chemical oxidation as a groundwater remediation technology at the SSFL can be evaluated
for effectiveness, implementability, and cost as part of the feasibility study / corrective measures
study.
In Situ Chemical Oxidation Field Experiment Work Plan Addendum #1 Santa Susana Field Laboratory, Ventura County, California January 2012
3-1
3.0 SCHEDULE
The implementation of the ISCO field experiment will begin with the procurement of an
implementation contractor. This procurement process will include the following steps:
• Issuance of a request for proposal to a list of qualified contractors. • A proposal preparation period of at least 30 days. • A proposal evaluation and award period of at least 60 days.
A detailed schedule will be prepared and submitted by the implementation contractor. This
schedule will include provisions for the following major milestones, with approximate durations
as indicated:
• Contractor submittals and approvals, including pre-field documents (HASP, QAPP, etc.) design drawings (layout, process flow diagram), equipment shop drawings, and a revised schedule: 3 months
• Permitting and monitoring well installation: 3 months
• Bench testing and preparation of TM with preliminary results: 3 months
• Infrastructure procurement and installation: 3 months
• Operations: 10 months
• Post-test monitoring and sampling: 6 months
• Data evaluation and reporting: 6 months The duration of the entire field experiment is expected to be approximately 34 months.
In Situ Chemical Oxidation Field Experiment Work Plan Addendum #1 Santa Susana Field Laboratory, Ventura County, California January 2012
4-1
4.0 REFERENCES
American Petroleum Institute, 1997. Recommended Practice 31A, Standard Form for Hardcopy Presentation of Downhole Well Log Data, First Edition. August.
Boeing, 2011. Draft Responses to April 29, 2011 DTSC Conditional Approval Letter on SSFL Treatability Study Work Plans. August 1.
California Department of Water Resources, 1991. California Well Standards Bulletin 74-90. June.
Haley & Aldrich, 2010a. Groundwater Monitoring Quality Assurance Project Plan, Santa Susana Field Laboratory, Ventura County, California. April.
Haley & Aldrich, 2010b. Site-Wide Water Quality Sampling and Analysis Plan, Santa Susana Field Laboratory, Ventura County, California. December.
MECx, 2009. Quality Assurance Project Plan, Santa Susana Field Laboratory, RCRA Facility Investigation, Surficial Media Operable Unit, Revision 4. March.
MWH, 2009. Treatability Studies Work Plans, Appendix B In Situ Chemical Oxidation (ISCO) Field Experiment Work Plan, Santa Susana Field Laboratory, Ventura County, California. June.
USBR, 1998. United States Bureau of Reclamation Engineering Geology Field Manual, Second Edition.
Objective Measurement or Parameter Method Location Frequency 1. Evaluate the delivery and distribution of the oxidant in the fractured sandstones of the Chatsworth formation.
• Injection parameters – flow rate, total volume injected, time
• Groundwater quality parameters – ORP, pH, specific conductivity, visual observed color, oxidant concentration, time
• Contaminants in groundwater – VOC concentration, dissolved metals concentration, time
• Monitor/record injection parameters with system instrumentation
• Monitor/record groundwater quality parameters with field instrument
• Monitor/record contaminant concentrations over time at multiple depths with laboratory analysis of groundwater samples in Westbay and FLUTe multilevel samplers
• Injection parameters at injection system or well head
• Groundwater quality parameters at monitoring wells
• Contaminant concentrations at monitoring wells
• Injection flow rate, and total volume injected every 30 minutes during injection
• Injection concentration hourly during injection
• Groundwater quality parameters on a weekly basis
• Contaminant concentrations on a monthly basis
2. Assess the extent of oxidation of TCE (and its daughter products) in the rock matrix.
Oxidant concentration, VOC concentration
Measure/record oxidant and VOC concentrations in rock core samples.
One rock core will be drilled near the injection well, and two rock cores will be drilled at locations to be determined based on field monitoring and laboratory analysis results
One rock core will be drilled prior to injection for baseline conditions, and two rock cores will be drilled one year after the injection begins
3. Evaluate the magnitude of contaminant concentration reduction in the rock matrix.
Oxidant concentration, VOC concentration
Measure/record oxidant and VOC concentrations in rock core samples
One rock core will be drilled near the injection well, and two rock cores will be drilled at locations to be determined based on field monitoring and laboratory analysis results
One rock core will be drilled prior to injection for baseline conditions, and two rock cores will be drilled one year after the injection begins
4. Assess the natural oxidant demand of the minerals and/or organics present in the rock matrix.
Oxidant concentration, organic carbon content, mineralogical changes, sulfate production
Monitor/record oxidant and sulfate concentrations, and changes in organic carbon content and mineralogy in crushed rock core samples
Rock core samples collected from core drilled near the injection well
Batch tests analyzed at selected time intervals of 1 day, 3 days, 1 week, 2 weeks, 3 weeks, until oxidant concentration stabilizes
TABLE 1 Plan Overview
ISCO Field Experiment
2 of 2 Table 1 Plan Overview_012612.docx
Objective Measurement or Parameter Method Location Frequency 5. Assess the magnitude and extent of mineral deposits on the solid surfaces of the rock associated with the oxidation reaction.
Reactive minerals associated with Chatsworth formation - iotite, chlorite, pyrite, magnetite, and ilmenite
Determine mineralogy of rock core samples using powder x-ray diffraction, optical microscopy, and scanning electron microscopy
One rock core will be drilled near the injection well, and two rock cores will be drilled at locations to be determined based on field monitoring and laboratory analysis results.
One rock core will be drilled prior to injection for baseline conditions, and two rock cores will be drilled one year after the injection begins
6. Assess the occurrence and effects of the precipitation of oxidation reaction by-products in the fracture system.
Manganese dioxides, ferrous hydroxides
Perform 1-D and 2-D diffusion experiments on rock core samples and monitor/record manganese dioxide and ferrous hydroxide deposition using radiation transmission methods
Rock core samples collected from core drilled near the injection well
Batch tests analyzed at selected time intervals of 1 day, 3 days, 1 week, 2 weeks, 3 weeks, until oxidant concentration stabilizes
Table 2Work Scope Phases and Quantities
ISCO Field Experiment
Work Scope ElementScoping
Quantity Scoping UnitEstimating Quantity Estimating Unit Item
1 Plan 1 Each Health and Safety Plan1 Plan 1 Each Quality Assurance Project Plan1 Plan 1 Each Chemical Handling Plan1 Plan 1 Each Implementation Plan1 Permit 3 Each Ventura County Well Installation Permit1 Permit 1 Each Waste Discharge Requirements from LARWQCB1 Permit 1 Each Building Permit from Ventura County Resource Management Agency1 Permit 1 Each Hazardous Materials Permit from Ventura County Fire Protection Division1 Overdrill 112 Linear Feet Drill out and remove existing 4-inch PVC blank in RD-35A1 Overdrill 19.5 Linear Feet Overdrill 12-1/4-inch borehole to 19.5 feet and remove existing 8-1/4-inch steel conductor casing, install temporary 16-inch conductor casing1 Borehole 112 Linear Feet Drill 14-inch diamater borehole to 112 feet1 Conductor Casing 112 Linear Feet Install 10-inch diameter carbon steel conductor casing1 Rock Coring 38 Linear Feet HQ-rock coring (nominal 4-inch diameter) to a total depth of 150 feet1 Borehole 38 Linear Feet Ream 4-inch diameter core to 8 inches to a total depth of 150 feet1 Straddle Packer Arrangement 1 Each Straddle packer system in 8-inch hole to isolate injection interval1 Constant Head Injection Test 1 Each Perform constant head injection test on deepened RD-35A1 Termination 1 Each Wellhead casing termination, install 14-inch diameter "stovepipe" type wellhead monument, injection system conncetion1 Well Logging 38 Linear Feet Rock core collection, logging, storage (RD-35A)1 Well Logging 38 Linear Feet Natural gamma, caliper, induction resistivity, acoustic televiewer and video logging (RD-35A)1 Well Logging 38 Linear Feet Heat-pulse flow meter and fluid temperature logging (RD-35A)1 Rock Coring 150 Linear Feet NQ-rock coring (nominal 3-inch diameter, new corehole)1 Rock Core Sampling 70 Samples One sample collected every foot after first encountered groundwater(assumes DTW ~ 80 feet)2 Conductor Casing 10 Linear Feet Drill 12-inch diameter borehole and install 8-inch diameter conductor casing to 10 feet2 Borehole 240 Linear Feet Drill 6-inch diameter borehole to 250 feet2 Termination 2 Each Wellhead casing terminations3 Water FLUTe 250 Linear Feet Multilevel (10-port) water monitoring FLUTe (one in each new monitoring well and one in existing corehole C-10)3 Well Logging 240 Linear Feet Rock core collection, logging, storage (two new monitoring wells)3 Well Logging 240 Linear Feet Natural gamma, caliper, induction resistivity (two new monitoring wells)3 Well Logging 240 Linear Feet Acoustic televiewer and video logging (two new monitoring wells)1 Bench Test 1 Each Natural Oxidant Demand, permanganate diffusion testing, mineral-permanganate reactions, oxidation by-product effects on rock matrix1 Technical Memorandum 1 TM Bench Test TM: Summarize laboratory NOD, permanganate diffusion coefficient, and resutls of other bench test studies1 Storage Tank 1 Each 2,000-gallon XLPE vertical tank1 Mixer 1 Each 1 HP bracket mount mixer with impeller1 Recirculation Pump 1 Each 1/2 HP centrifugal pump1 Bag Filter 1 Each Bag Filter Housing1 Filter Elements 10 Each 5-micron bag filter1 Static Mixer 1 Each In-line static mixer
1 Flow Meter 1 Each 0 - 5 gpm digital flow meter and totalizer1 Secondary Containment 1 Each 2,500-gallon HDPE secondary containment
Installation Phase TM 1 Technical Memorandum 1 TM Installation TM: Summarize RD-35A deepening, new monitoring well installation, well logging, bench test results, and injection system installation10 Injection Event 5 days Each event is 5 days, estimated 8 hours per day of active injection10 Solid KMnO4 8740 pounds Remediation grade solid KMnO410 KMnO4 injection flow rate 80 Each Measurement collected every half hour during 8 hour day, 5 days per event10 KMnO4 injection volume 80 Each Measurement collected every half hour during 8 hour day, 5 days per event
1 Pressure Transducer 1 Each Pressure transducer with data logger for continuous monitoring of water level in injection well
Multiparameter Meter 4160 Each ORP, specific conductivity, pH, temperature field measurements from monitoring wells (65 readings during entire field test from 64 monitoring intervals)MnO4- concentration 4160 Each MnO4- concentration field readings from monitoring wells (65 readings during entire field test from 64 monitoring intervals)
Groundwater Sampling Groundwater Sampling 1088 Each Samples collected for VOC and dissolved metals laboratory analysis (64 monitoring intervals sampled during 17 sampling events)2 Rock Coring 150 Linear Feet NQ-rock coring (nominal 3-inch diameter)2 Rock Core Sampling 140 Samples One sample collected every foot after first encountered groundwater, two samples collected on each side of visibly stained fractures (assumes DTW ~ 90 feet, 20 visibly stained fractures per core)
Final Data Evaluation TM 1 Technical Memorandum 1 TM Final Data Evaluation TM: Present complete results , discuss if objectives were achieved, and evaluate technology for effectiveness and implementability
AcronymsFLUTe = Flexible Liner Underground Technology, Inc. MnO4- = permanganate ionGPM = gallons per minute NOD = natural oxidant demandHDPE = high density polyethylene PVC = polyvinyl chlorideHP = horsepower SCH80 = schedule 80ISCO = in situ chemical oxidation TM = technical memorandumKMNO4 = potassium permanganate VOC = volatile organic compoundLARWQCB = Los Angeles Regional Water Quality Control Board XLPE = cross linked polyethylene
Ope
ratio
ns P
hase
Inst
alla
tion
Phas
e
Rock Coring
Groundwater Quality Parameters
System Monitoring
Injections
Injection System Installation
Bench Test
Well Logging
Monitoring Well Installation
Rock Coring
Pre-Field Documents
Permitting
RD-35A Deepening
Well Logging
Table 3Recommended Injection System Equipment Specifications
ISCO Field Experiment
Equipment Tag No. Description
Oxidant Solution Storage Tank T-101 2,000-gallon or larger XLPE bulk storage tank
Oxidant Solution Storage Tank Mixer M-101 1 HP electric mixer
Oxidant Solution Storage Tank Recirculation Pump P-101 1/2 HP chemical resisitant centrifugal pump
Injection Flow Meter and Totalizer FE-101, FE-102 0.5 - 5.0 gpm
Notes:1. All injection system equipment and materials that will be in contact with oxidant shall be chemically compatible with type and concentration of the oxidant used and shall be rated for outdoor use. 2. Equipment listed in this table is recommended for operation of the batch oxidant injection system described in the work plan. Alternative equipment may be exchanged or supplemented to this list pending engineering review by the implementation contractor.
Acronyms:gpm = gallon per minuteHDPE = high density polyethyleneHP = horsepowerKMnO4 = potassium permanganatepsig = pounds per square inch gaugeXLPE = cross-linked polyethylene
Table 3 Injection Equip Specs_111411.xls 1 of 1 1/27/2012
WS-14 1 gauging only Conventional Submersible Pump NA Secondary
Total 64
Notes:1. Primary wells are to be monitored for groundwater quality parameters prior to initiation of field experiment, on a weekly basis during field experiment, and weekly for two quarters following completion of injection. Secondary wells will be monitored for groundwater quality parameters if specific conductivity changes or permanganate is visually observed in nearest Primary well. All wells will be sampled quarterly for VOCs and dissolved metals.
Acronyms:btc = below top of casingLUFT = leaking underground fuel tankNASA = National Aeronautical and Space AdministrationRU = regulated unit
Purge/Sample InfoProgram Info
Table 4 MW and Sampling Info.xlsx 1 of 1 1/27/2012
FIGURES
Note: The design shown is draft and subject to
change pending final engineering review by the
implementation contractor.
APPENDICES
Appendix A Steady-State Simulations of Injection Flow Rate in Deepened Well RD-35A
Appendix A
Steady-State Simulations of Injection Flow Rate in Deepened Well RD-35A
In Situ Chemical Oxidation Field Experiment Work Plan Addendum
To evaluate the hydraulic feasibility of injecting 1.5 gallons per minute (gpm) into well
RD-35A after its proposed deepening for the ISCO field experiment, a simple
groundwater flow model was constructed to approximately represent site conditions.
The constructed MODFLOW model has a horizontal domain of 20,000 by 20,000 feet
(Figure 1). The model grid is centered on the simulated location of RD-35A, where the
horizontal cell size is equal to the well’s diameter of 0.67 feet. The model cell
dimensions increase outward from the center by a factor of 1.5. Nearly half of the model
domain is inactive beginning about 400 feet west of the simulated location of RD-35A,
consistent with the observation that the Shear Zone fault acts as a very low permeability
vertical feature as shown by site data.
Vertically, the model consists of four layers (Figure 1). The uppermost layer extends
from the ground surface at 1,910 feet above mean sea level (ft msl) down to an elevation
of 1,820 ft msl, which is representative of recent and historic groundwater elevations.
The second layer represents the unscreened portion of the well below the water table to
an elevation of 1,798 ft msl. The third model layer represents the proposed screen
interval of the modified well from 112 to 150 feet below ground surface (ft bgs). The
fourth, bottom layer extends down to 1,640 ft msl. Thus, the model layer thicknesses
from top to bottom are 90, 22, 38, and 120 ft for layers 1, 2, 3, and 4, respectively.
A constant head boundary set equal to the approximated 1,820 ft msl water table
elevation is assigned to the northern, eastern, and southern boundaries of layers 2 and 3
within the active model domain. All other boundaries are no-flow. Recharge is not
simulated.
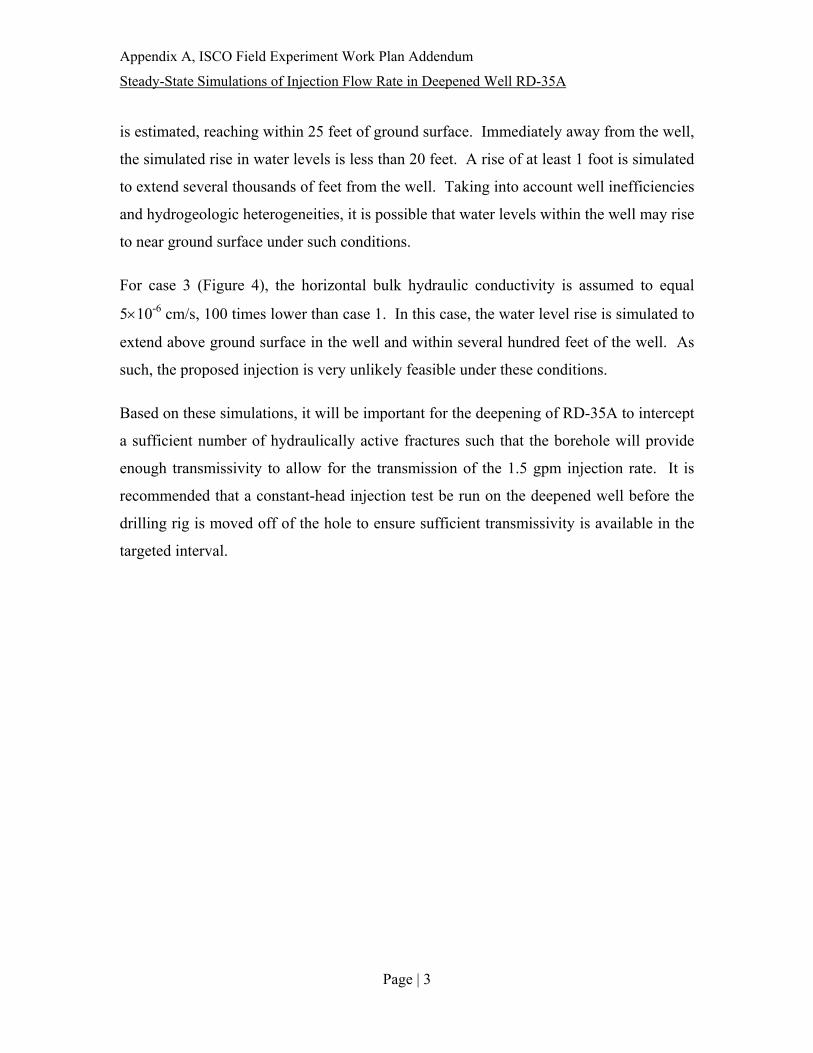
Three steady state simulations were performed with varying values of hydraulic
conductivity (Figures 2, 3, and 4). Because the actual ISCO field experiment plans to
inject 1.5 gpm only 8 hours per day, the steady state simulations of 1.5 gpm of
continuous injection are conservative (i.e., over estimate groundwater level rise). In each
Appendix A, ISCO Field Experiment Work Plan Addendum
Steady-State Simulations of Injection Flow Rate in Deepened Well RD-35A
Page | 2
case, the initial water level is set to equal the ground surface so that the model is able to
saturate as much of layer 1 as the injection rate and assumed hydraulic properties require.
For case 1 (Figure 2), a horizontal bulk hydraulic conductivity of 5×10⁻⁴ centimeters per
second (cm/s) for all layers was chosen. As indicated in the following table, this value is
generally consistent with the result of a previous aquifer test for which RD-35A served as
an observation well. Other tests for RD-35B indicate lower values of hydraulic
conductivity below the bottom elevation of the model.
BP 35° Clay PR 2 mmJT 10° Clay IR 1 mmJT 70° Clay IR 1-3mm35 - 45° CN DB, HBs, BPsDL
BP 45° Clay PR 3-4mm
BP 35° PR 1 mm Fe, clayeyBP 35° Fe PR RF DBJT 50° 1 mm clayey, FeBP 35° Fe PR RF DBJT 35° PR 1 mm Fe, partialclay
JT 35° Fe PR RF DBJT 30° Clay PR 2-3mm
JT 70° Clay DIS 1-2mm
5.50m
6.62
0%LOSS
0.53m
0.73m
0.85m
4.12m
6.15m
6.30m
6.62m
6.94m
7.66m
8.00m
1.12m
SW
EWMW
EWSW
JT 40° Clay PR 1 mm
JT 15° Fe IR RF DBJT 50 - 65° MS DB, DIS, IR,S/RFJT 45° MS PR S/RF, DBJT 25° Clay PR 3-4mm45° Fe PR RF DB, JTs45 - 50° PR 15-20mm claybetween 2 JTsSM 30° ClayJT 40° Clay PR 2-4mmFew vertical and sub-verticalJTs. Clay infilled 1-7mm (coredisturbed, stock in splits)JT 5 - 12° DL, Partial clay2-3mmJT 35° Clay PR 1-2mm45 - 35° Clay PR 2 JTs, 2-4mm
JT 45° Clay PR 2 mm
0.85: BEDROCK
45° Clay PR 1 mm 2 JTsJT 70° Clay PR 1 mm sealedJT 70° Fe PR HB, MSJT 45° Clay PR 2-8mmJT 55° Clay DIS 35-10mmJT 45° Clay 1 mm sealed, IRJT 25° Clay IR 2-3mmJT 50° Clay PR 3-4mm
JT 5 - 10° Clay IR 2-3mmJT 70° Clay DIS 1-3mmJT 70° Clay IR 1 mm
MW
DL advance HQ casing from0.9 to 2.4m
MW
JT 90 - 75° Clay DIS 1 mm
0.73: RESIDUAL
0.53: POSSIBLE FILL
0.00: Several possiblelocations for core loss withindrill run 0-1.2m.
DL Run HQ casing from 0 to0.9m.
HQ
Cas
ing
HQ
Cas
ing
44%LOSS
1.20
0%LOSS
2.27
0%LOSS2.44
0%LOSS
3.90
VIS
UA
L
See Explanatory Notes fordetails of abbreviations& basis of descriptions.
MOUNTING : Truck
0%LOSS
NM
LC
DATE LOGGED : 30/7/06
324
RIG TYPE : Edson
HOLE NO :CORED DRILL HOLE LOG
DRILLER : A SMITH
0%LOSS
DESCRIPTIONROCK TYPE : Colour, Grain size, Structure
(texture, fabric, mineral composition, hardnessalteration, cementation, etc as applicable)
CHECKED BY :LOGGED BY : AAA
SURFACE ELEVATION : 37.687 (AHD66)
DATE COMPLETED : 30/7/06
ANGLE FROM HORIZONTAL : 90°
DATE STARTED : 29/7/06
PROJECT : ASTRA PROJECTLOCATION : CUT BETWEEN SOMEWHERE AND SOME PLACEPOSITION : E: 473998.978, N: 6499916.818 (56 MGA94)
FILE / JOB NO : J221SHEET : 1 OF
CONTRACTOR : Datgel
SA
MP
LES
&FI
ELD
TE
STS
5.47
10%
Pol
ymer
LO
SS
(CA
SIN
G A
T 0.
9m)
Is(50)a=2.06d=6.12MPa
Is(50)a=1.25d=1.56MPa
Is(50)a=1.11d=1.14MPa
Is(50)a=3.18d=3.36MPa
NATURALFRACTURE
(mm)
MATERIAL
0% P
olym
er L
OS
S (C
AS
ING
AT
2.4m
)
Is(50)d=4.64MPa
CARBONACEOUS SILTSTONE: black
CORE LOSS 0.53m (0.00-0.53) (FILL)
GRAVEL AND CLAYEY SAND (GW): Coarse to finegravel. Some quartz. Coarse to fine sand.
SANDY CLAY (CL): Dark brown, low plasticity. with silt.Trace of gravel..SANDSTONE: grey and yellow brown, coarse to finegrained, Bands of colour. Variable weathering, possiblydisturbed materialsSANDSTONE LITHIC: pale grey with orange brown,coarse with medium grained, and fine grains. Pockets,blotches and bands of colour. Possibly Tuffaceous.
SILTSTONE: dark grey, Bedding at 40-45°. Severalclosed fractures; majority Fe stained at 0-70°.
5-10
% P
olym
er L
OS
S (N
O C
AS
ING
)
SILTSTONE: dark grey to grey, Slightly carbonaceous;few closed fractures.
SILTSTONE: grey, Bedding at 40-45°. Several closedfractures, majority Fe stained, at 10-70°.
SILTSTONE AND SILTY SANDSTONEINTERBEDDED: grey to pale grey, Fine grained sand.Bedding at 30-35°. Some closed fractures, majority Festained, at 0-90°. Occasional orange brown pockets andbands. Bedding disturbed in places.
SILTY SANDSTONE: grey to pale grey, fine grained,Bedding at 35-45°. Some closed fractures, majority Festained, at all angles and some patches with severalclosed fractures.
START CORING AT 0.00m
SILTY SANDSTONE /SANDY SILTSTONE: dark grey,fine grained, Some carbonaceous laminae. Beddingpredominantly at 35-40°; some closed fractures, majorityFe stained, at 20-70°. Occasional orange brown andcream bands.
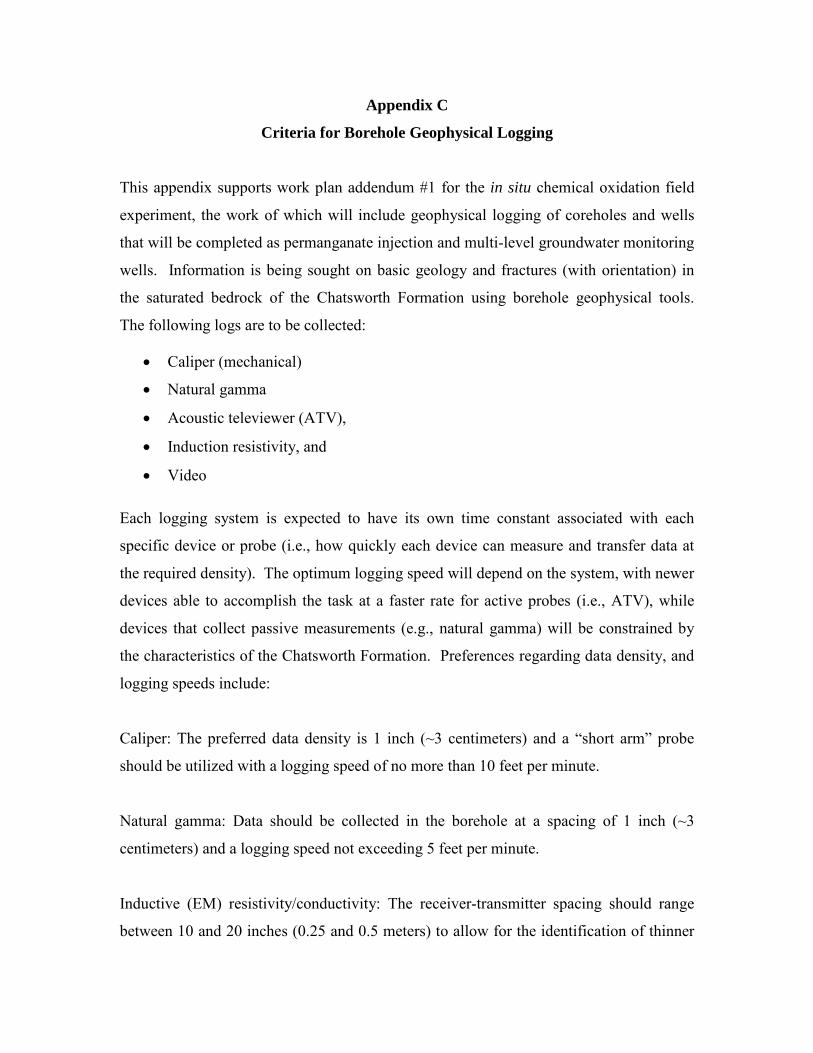
This appendix supports work plan addendum #1 for the in situ chemical oxidation field
experiment, the work of which will include geophysical logging of coreholes and wells
that will be completed as permanganate injection and multi-level groundwater monitoring
wells. Information is being sought on basic geology and fractures (with orientation) in
the saturated bedrock of the Chatsworth Formation using borehole geophysical tools.
The following logs are to be collected:
• Caliper (mechanical)
• Natural gamma
• Acoustic televiewer (ATV),
• Induction resistivity, and
• Video Each logging system is expected to have its own time constant associated with each
specific device or probe (i.e., how quickly each device can measure and transfer data at
the required density). The optimum logging speed will depend on the system, with newer
devices able to accomplish the task at a faster rate for active probes (i.e., ATV), while
devices that collect passive measurements (e.g., natural gamma) will be constrained by
the characteristics of the Chatsworth Formation. Preferences regarding data density, and
logging speeds include:
Caliper: The preferred data density is 1 inch (~3 centimeters) and a “short arm” probe
should be utilized with a logging speed of no more than 10 feet per minute.
Natural gamma: Data should be collected in the borehole at a spacing of 1 inch (~3
centimeters) and a logging speed not exceeding 5 feet per minute.
Inductive (EM) resistivity/conductivity: The receiver-transmitter spacing should range
between 10 and 20 inches (0.25 and 0.5 meters) to allow for the identification of thinner
Appendix C – Criteria for Borehole Geophysical Logging In situ Chemical Oxidation Field Experiment, Work Plan Addendum #1
lithologic beds. Data should be collected at a spacing of 2 inches (~5 centimeters) and a
logging speed at or below 10 feet per minute.
Acoustic televiewer: The ATV tool must provide high resolution results, with logging
speeds no greater than 5 feet per minute to obtain orientated fracture information.
Video logs: Should be collected at a rate no greater than 5 feet per minute to allow for
the interpretation of fractures in the borehole and include slowly-rotating side scan
capabilities to allow for observation of fractures or fracture junctions. The operator will
be required to pause at each fracture and complete a slow rotation of the camera head
within the complete circumference of the borehole.
Appendix D Boeing/DOE Investigation Derived Waste Memorandum
TECHNICAL MEMORANDUM
IDW Procedures for Boeing_DOE final 020810.doc
TO: Dave Dassler, P.E. DATE: August 8, 2008 TO: Phil Rutherford, Boeing DATE: February 8, 2010 Adam Boettner, Boeing
FROM: Dixie Hambrick, MWH CC: Jill Bensen CH2M Hill Beth Vaughan, CH2M Hill Shelby Valenzuela, MWH SUBJECT: Boeing / DOE Investigation Derived Waste (IDW) Memorandum – January 2010
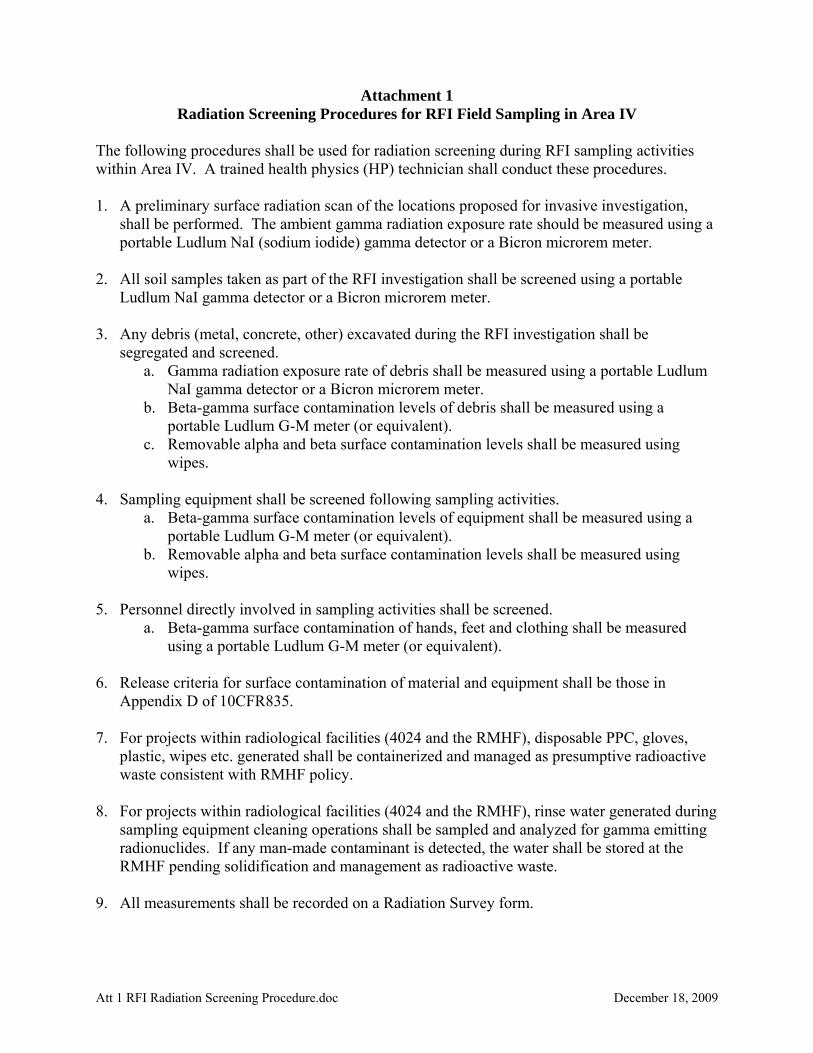
This memorandum was prepared at Boeing request to inform onsite contractors retained by Boeing or the United States Department of Energy (DOE), of current Resource Conservation and Recovery Act (RCRA) Facility Investigation (RFI) waste handling and sampling procedures and contractor responsibilities at the Santa Susana Field Laboratory (SSFL) in Areas I,II, III, or IV. Waste handling and sampling procedures for IDW generated during worked performed by National Aeronautics and Space Administration (NASA) contractors within Area II is documented in a separate NASA IDW memorandum (in progress). This document outlines IDW generated only by contractors retained by Boeing and DOE and supplements previous IDW management standard operating procedures (SOPs) in Department of Toxic Substances Control (DTSC)-approved RFI work plans (Ogden, 1996, 2000) with current SSFL requirements. Additionally, this document has been prepared to incorporate Boeing SOP C-203 (Boeing, 2006) for waste management procedures. The SSFL comprises four administrative areas, Areas I, II, III, and IV, as shown on Figure 1. Hazardous and/or non-hazardous waste from different administrative areas is stored at specific accumulation areas based on client responsibility [Note: In some instances, client responsibility may not correspond to administrative area (e.g. Boeing may be responsible for some wastes generated in Area II and/or Area IV)]:
• Areas I and III - IDW generated at Boeing RFI sites in Areas I and III, or specifically generated by Boeing in any Area, are collected at the Boeing 90 Day Hazardous Waste Accumulation Yard, Building 31-407 in Area I, effective January 4, 2010.
• NASA Area I and Area II – IDW generated at NASA RFI sites in Area II and the Liquid Oxygen Plant (LOX) RFI Site (NASA Area I) are collected at the NASA 90 Day Hazardous Waste Accumulation Yard, Storage Propellant Area (SPA), Building 42-927 in Area II. Please refer to the NASA IDW memorandum for waste handing and sampling procedures to be performed by NASA contractors at NASA RFI Sites.
• Area IV - IDW generated at DOE RFI sites in Area IV are collected at the DOE 90 Day Hazardous Waste Accumulation Yard, Building 44-011 in Area IV.
• RMHF - IDW generated within the DOE Radioactive Materials Handling Facility (RMHF) RFI site, in northern Area IV, are stored in the RMHF hazardous waste accumulation area in Building 44-022.
IDW is securely stored (up to 90 days) in the accumulation areas listed above until transportation offsite for disposal.
Due to former radiologic operations in Area IV, wastes generated during RFI investigations from this area may1 require radiation screening prior to offsite disposal. If required, this screening is conducted by Boeing Radiation Safety Team (RST) or by contract health physics personnel using the procedures 1 Radiation screening of Area IV wastes is at the discretion of Boeing’s Manager of Health, Safety, and Radiation Services.
Boeing/DOE IDW Memorandum – February 2010 PAGE 2
IDW Procedures for Boeing_DOE final 020810.doc
described in Attachment 1 (provided here for informational purposes). If screening indicates radioactivity above acceptable levels, waste will be transported to the RMHF prior to offsite transportation/disposal.
The following sections describe steps to be implemented by Boeing/DOE retained SSFL contractors to ensure proper handling of wastes generated at the facility. Complete contact information for all SSFL personnel discussed in this memorandum is listed at the end of these procedures. I. Before Implementation of Field Activity:
Note: “Field activity” includes any activity where wastes may potentially be generated (e.g. drilling/sampling, remediation, aquifer testing, construction, demolition, excavation, or repair activities).
A. At least 24 hours before field activity (preferably 1 week ahead), contact the appropriate Boeing Site Restoration Contract Coordinator (SRCC) (Dan Trippeda or Gil Fuentes) to request IDW containers and arrange storage. Both SRCCs are located in the Safety, Health and Environmental Affairs (SHEA), Building 31-436 (B31436) in Area I. Provide the following information to the SRCC.
• Scope of field activity • Location of field activity • Type and approximate amount of waste(s) that will be generated • Planned schedule
The SRCC will coordinate with the SSFL hazardous waste subcontractor, Veolia Environmental Services (Danny Cruz or Marc Hunter]) to provide IDW containers at the appropriate accumulation area (as listed above). Determination of suitable container type will be made by Veolia based on information provided by the contractor.
B. If the field activity warrants a satellite accumulation area at the project site, an extended permit is required. This permit will be requested by the SRCC and processed by Environmental Protection Hazardous Waste personnel (Graciela Kawa) (Boeing). Upon receipt of the extended permit, the secured satellite accumulation area will be established by Veolia and labeled waste container(s) will be delivered to the project site. Waste may be stored at the satellite accumulation area for up to 180 days. When the waste reaches the volume or time limits for satellite storage, or when the container is full, the Date of Storage must be entered on the hazardous waste label, and Internal Trucking must ship the container to the appropriate Hazardous Waste Accumulation Yard within 72 hours.
C. Before the first day of field activity, confirm that Veolia has provided container(s) in the appropriate accumulation area.
D. Discuss with Boeing Hazardous Waste Personnel (Tom Armenoff or Tom Venable) the chemical analytical program planned in support of the field activity (e.g. trench sampling) so that they may determine if it is sufficient for waste characterization/profiling. Laboratory analysis, dependent on known/suspected chemical use, may include:
• Volatile Organic Compounds (VOCs) by United States Environmental Protection Agency (EPA) Method 8260B
• Semi-volatile Organic Compounds (SVOCs) by EPA Method 8270C • Total Petroleum Hydrocarbon (TPH) by EPA Method 8015B • Total Recoverable Petroleum Hydrocarbons (TRPH) by EPA Method 418.1 • Polychlorinated bi-phenyls (PCBs) by EPA Method 8082/1668 • Dioxins/furans by EPA Method 8290/1613 • Title 22 metals by EPA Method 6010B/6020B/7470A or 7471A • Herbicides by EPA Method 8151A • Pesticides by EPA Method 8081A • Ignitability/flash point (flammability) by EPA Method 1010 • Corrosivity (as pH) by EPA Method 9045D
Boeing/DOE IDW Memorandum – February 2010 PAGE 3
IDW Procedures for Boeing_DOE final 020810.doc
II. During Field Activities:
A. Inform the SSFL hazardous waste contractor (Veolia) or the RMHF personnel (Mark Spenard or Paul Waite) (for work at RMHF) when field work has started, and when the first waste has been transported into container(s) at the appropriate accumulation area (first time only notification).
B. Unless an extended permit is obtained from the SRCC to leave the container at a satellite accumulation area at the project site, it is the contractor’s responsibility to ensure all wastes are transported to the appropriate accumulation area and placed in designated IDW containers AT THE END OF EACH DAY. The contractor must keep the containers closed and or secured (i.e., bungs wrenched tight, drum rings tightened, latches locked, etc.). [Note: Temporary storage of properly labeled and secured (with lids) decon buckets is allowed in contractor storage bins.]
C. Record keeping: Record keeping must be performed for satellite accumulation areas only. In a field logbook or on a waste container inventory log (Attachment 2), record information for each container, including (i) waste material (e.g. trench soil), (ii) date of first accumulation for each container, (iii) date of storage (i.e., date container is full or the date 180 days after first accumulation), (iv) location of origin (e.g. site name, trench number, etc.), (v) volume (if container is “full” or “half full,” etc.).
D. Waste characterization and appropriate procedures (for each waste type; do not place more than one waste type in a single container):
o Soil waste(s):
• If soil generated during intrusive activities (i.e., drilling, direct-push, or excavation); does not exhibit staining; fuel, oil, or solvent odors; or photoionization detector (PID) measurements > 0 parts per million (ppm); and groundwater is not encountered, then soil may be returned to the boring or excavation.
• If groundwater is encountered, soil shows staining; exhibits fuel or solvent odors, or PID measurements > 0 ppm, then soil waste must be secured in containers, covered with lids or tarp, and transported to the appropriate accumulation area as described above.
o Water waste, including potentially contaminated water from a project site (e.g., purged groundwater, pumped tank water), equipment decontamination water, etc.
• Whenever possible, reduce generated equipment decontamination water volume by using dedicated or disposable equipment that do not require decontamination.
• Water waste must be secured in spill-proof containers with lid(s) and transported to the appropriate accumulation area as described above.
o Personal protective equipment (PPE) and disposable sampling equipment:
• If PPE or disposable sampling equipment is visibly soiled, it is usually considered waste requiring either hazardous or non-hazardous disposal, and should be secured in containers, covered with lid(s) or tarp, and transported to the appropriate accumulation area as described above.
• If PPE or sampling equipment is clean or can be decontaminated, it can be double-bagged and disposed offsite as municipal waste by the contractor (or its subcontractor).
o Excess construction materials:
• Include grout, cement, sand or filter pack, scrap polyvinyl chloride (PVC) materials, used/empty bentonite buckets, concrete/cement/sand bags, etc. that have not come in contact with potentially contaminated soil or groundwater.
• Are considered non-hazardous and do not require special disposal; these materials may be transported and disposed offsite by the contractor (or its subcontractor).
o Construction materials from demolished buildings:
Boeing/DOE IDW Memorandum – February 2010 PAGE 4
IDW Procedures for Boeing_DOE final 020810.doc
• Construction materials containing asbestos require disposal at an appropriate facility and must be handled by a California licensed asbestos abatement contractor. If you encounter any suspect asbestos containing material (ACM), notify your SRCC.
• Construction materials that do not contain asbestos are considered non-hazardous and do not require special disposal; these materials may be transported and disposed offsite by the contractor (or its subcontractor).
o Sample bottles/containers with chemical preservatives. • Excess or expired sample bottles, with or without chemical preservative, should be
shipped back to the laboratory.
Note: IDW volume generated during field activities should be minimized to the extent practical. Some examples of IDW minimization strategies include using drilling or direct-push technologies that reduce waste; leaving excess soil at the source location, and using disposable sampling equipment to avoid generating wastes during decontamination of reusable sampling equipment; etc.
III. Upon Completion of Field Activity
A. Final notifications:
o Inform the SSFL hazardous waste contractor (Veolia) or RMHF personnel (for work at RMHF) when the field activity is complete.
o Provide final label information for each container to the SSFL hazardous waste contractor or RMHF personnel as described above in IIC.
B. Collect any needed composite soil or water samples for waste characterization/profiling; if samples were not collected during the field activity (see Section I.H).
C. Forward all chemical laboratory reports to the Boeing or DOE Project Manager (as appropriate) for processing to determine the appropriate waste disposal facility and obtain profile number(s) for disposal.
D. Once the waste has been characterized/profiled, manifests are generated/initiated by Boeing Hazardous Waste personnel.
E. Boeing will arrange for all waste to be transported offsite to the appropriate disposal facility within 90 days of the first day of waste accumulation/containerization.
F. The completed and signed waste manifests from the disposal facility are sent to Tom Venable (Boeing), who is responsible for manifest files.
G. Any inquiries regarding final disposal or the waste documentation (i.e., manifests, bills of lading, etc.) can be directed to the individual Boeing or DOE project manager who will coordinate with Tom Venable (Boeing).
Figures and Attachments:
Figure 1 - Site Plan Showing Hazardous Waste Accumulation Areas and Select Building Locations Attachment 1 - Radiation Screening Procedures Attachment 2 - Waste Container Inventory Log References:
Boeing. 2006. Hazardous Waste Management Program, May 16, 2006, Thomas Venable, SHEA. May. Ogden Environmental and Energy Services Co., Inc. (Ogden), 1996. RCRA Facility Investigation Work
Plan Addendum, Santa Susana Field Laboratory, Ventura County, California. September. Ogden 2000. RCRA Facility Investigation Work Plan Addendum Amendments, Santa Susana Field
Figure 1 Site Plan Showing Hazardous Waste Accumulation Areas and
Select Building Locations
* Note: The first digit of each building number denotes SSFL administrative area (e.g. Building 3260 denotes Building 260 in Area III).
Building 4034* (inside RMHF)
Building 4011* (Area IV hazardous waste
accumulation area)
Building 3258* & Building 3260*
(main hazardous waste accumulation area)
SHEA Building 1436*
Storage Propellant Area (SPA) Building 2777 and 2769
(NASA hazardous waste accumulation area)
RMHF, Building 4022 (RMHF hazardous waste accumulation area)
Att 1 RFI Radiation Screening Procedure.doc December 18, 2009
Attachment 1 Radiation Screening Procedures for RFI Field Sampling in Area IV
The following procedures shall be used for radiation screening during RFI sampling activities within Area IV. A trained health physics (HP) technician shall conduct these procedures. 1. A preliminary surface radiation scan of the locations proposed for invasive investigation,
shall be performed. The ambient gamma radiation exposure rate should be measured using a portable Ludlum NaI (sodium iodide) gamma detector or a Bicron microrem meter.
2. All soil samples taken as part of the RFI investigation shall be screened using a portable Ludlum NaI gamma detector or a Bicron microrem meter.
3. Any debris (metal, concrete, other) excavated during the RFI investigation shall be segregated and screened.
a. Gamma radiation exposure rate of debris shall be measured using a portable Ludlum NaI gamma detector or a Bicron microrem meter.
b. Beta-gamma surface contamination levels of debris shall be measured using a portable Ludlum G-M meter (or equivalent).
c. Removable alpha and beta surface contamination levels shall be measured using wipes.
4. Sampling equipment shall be screened following sampling activities. a. Beta-gamma surface contamination levels of equipment shall be measured using a
portable Ludlum G-M meter (or equivalent). b. Removable alpha and beta surface contamination levels shall be measured using
wipes.
5. Personnel directly involved in sampling activities shall be screened. a. Beta-gamma surface contamination of hands, feet and clothing shall be measured
using a portable Ludlum G-M meter (or equivalent).
6. Release criteria for surface contamination of material and equipment shall be those in Appendix D of 10CFR835.
7. For projects within radiological facilities (4024 and the RMHF), disposable PPC, gloves, plastic, wipes etc. generated shall be containerized and managed as presumptive radioactive waste consistent with RMHF policy.
8. For projects within radiological facilities (4024 and the RMHF), rinse water generated during sampling equipment cleaning operations shall be sampled and analyzed for gamma emitting radionuclides. If any man-made contaminant is detected, the water shall be stored at the RMHF pending solidification and management as radioactive waste.
9. All measurements shall be recorded on a Radiation Survey form.
Appendix E Permanganate ISCO Laboratory Treatability Study Work Plan
1
Permanganate ISCO Treatability Study Work Plan Santa Susana Field Laboratory, Ventura County, California – USA
Prepared by: Dr. Tom Al1, Amanda Pierce, M.Sc.2, Steven Chapman2, M.Sc. and Dr. Beth Parker2
1 Department of Geology, University of New Brunswick 2 School of Engineering, University of Guelph
Prepared for: The Boeing Company, NASA and DOE
Santa Susana Field Laboratory – Treatability Study Plan – Addendum
Date: December 8, 2011
INTRODUCTION
The purpose of this document is to outline the goals, objectives and to provide an overview of proposed methods for laboratory studies involving Insitu Chemical Oxidation (ISCO) treatment of TCE‐contaminated porous sandstone bedrock. These laboratory studies are designed to complement the proposed field chemical oxidation trial at the SSFL site. In the field, the ISCO treatment method involves injection of aqueous permanganate solutions into contaminated bedrock through boreholes. The permanganate is expected to spread through the sandstone, initially by advective transport in permeable fractures, followed by diffusive transport into the pore space of the matrix blocks adjacent to the fractures (Figure 1).
Figure 1. Conceptual model showing advective and diffusive spreading of permanganate in fractured
porous sandstone.
vadose zone
groundwater zone
Diffusion from fracture to matrix
Fracture Scale
Pore Scale
pyrite
fracture
MnO2
2
Permanganate is a strong oxidant, and in contact with aqueous and sorbed chlorinated ethenes such as trichloroethylene (TCE), it is well known that permanganate will oxidatively degrade the TCE to CO2 and Cl
‐ (e.g. Schnarr et al., 1998):
−+− +++→+ ClHMnOCOHClCMnO s 3222 )(22324
However, in the contaminated bedrock system, permanganate will also contact naturally occurring minerals and solid organic carbon. Reactive minerals present in the Chatsworth Formation sandstone include biotite, chlorite, pyrite, magnetite and ilmenite (Loomer and Al, 2009). Reactions with reactive minerals and solid organic carbon cause additional consumption of permanganate, as illustrated, for example, by the following reactions of permanganate with pyrite and organic carbon:
Such reactions consume some fraction of the total oxidant supplied (referred to as natural oxidant demand or NOD). A large NOD can result in significant depletion of the injected oxidant, thus limiting the amount of oxidant available for reaction with the targeted contaminants, and diminish the efficiency of treatment. In addition, production of precipitates (e.g. manganese oxides, iron hydroxides) has potential to clog up fractures and decrease porosity within the rock matrix (which leads to reduced effective diffusion coefficient), which can also have detrimental effects on ISCO treatment.
OBJECTIVES
The objective of the proposed treatability investigations include: 1) measurement of diffusion properties of representative SSFL sandstone samples (porosity and
diffusion coefficient) before and after treatment by permanganate; 2) identification of mineral‐permanganate reactions that contribute to natural oxidant demand; 3) measurement of permanganate consumption by reaction with naturally occurring minerals and
organic carbon; and 4) assess the potential for detrimental effects of such reactions (e.g. fracture clogging, reduced
matrix porosity, etc.) on treatment efficiency.
LABORATORY METHODS
Laboratory tests will be conducted via different test methods and procedures ranging from:
1) batch tests on crushed rock samples; 2) 1‐D diffusion tests on intact core samples; 3) 1‐D diffusion‐reaction tests on inteact core samples; and
3
4) mineralogical investigations to identify important MnO4‐ consuming reactions, and the
extent of pore clogging by Mn oxides. Measurement of natural oxidant demand is commonly conducted by crushing and disaggregating rock samples, then using batch reaction techniques to measure permanganate consumption normalized to the rock mass. However, this approach artificially enhances the amount of mineral surface area available to react with permanganate compared to the surface area exposed to the permanganate‐containing pore fluid within intact rocks. The batch reaction technique is therefore expected to overestimate the natural oxidant demand. Batch tests also do not provide any insight into potential effects of precipitation reactions that may cause clogging of fractures and reduced porosity within the rock matrix (with commensurate reductions in diffusion coefficient). Therefore, in order to avoid such artifacts, the main thrust of the proposed laboratory investigations involves measurements performed on intact rock samples. However, measurements of NOD via batch tests will be conducted to provide a benchmark for comparison to measurements made on intact samples.
Batch Tests of Natural Oxidant Demand (NOD)
A series of batch tests will be conducted to evaluate the natural oxidant demand (NOD) of SSFL sandstone. Representative samples from rock cores will be crushed and pulverized, and then placed in vials with different initial permanganate concentrations. Crushed rock mass to solution volume ratios will be selected to provide measurable changes in permanganate concentrations. The samples will be kept well‐mixed using a sample rotator, and periodic measurements of MnO4
‐ concentrations made using a HACH DR/2010 spectrophotometer (or similar equipment) at selected time intervals (e.g. at 1 day, 3 days, 1 week, 2 weeks, 3 weeks) until MnO4
‐ concentrations stabilize. NOD can then be estimated based on the mass of rock sample and amount of MnO4
‐ consumed. As discussed above, such tests are expected to overestimate the NOD, such that the results will provide an upper bound on the oxidant loading required to overcome the NOD in the field. Quantification of the various components contributing to the overall NOD will be assessed via before / after measurements on the crushed rock samples (e.g. decline in organic carbon content, mineralogical changes, etc.) and in the solution (e.g. sulfate produced by pyrite oxidation).
Permanganate Diffusion Experiments – 1D
Two types of 1‐D diffusion experiments are envisioned for intact sandstone samples: experiments utilizing inward diffusion of permanganate and a conservative tracer with a sufficient sample length and/or short enough duration to provide essentially semi‐infinite conditions; and experiments utilizing through‐diffusion conditions where shorter length samples are used such that breakthrough occurs and is monitored at the effluent end of the sample (e.g. see Cavé et al, 2009; attached). For the former, small diameter samples (~11 mm diameter) can be utilized, such that multiple samples can be sub‐cored from the same depth interval from a larger diameter core sample, and
4
test conditions can be varied between these ‘replicate’ samples (e.g. use different MnO4‐
concentrations and/or different time periods, etc. At the end of the test period and after non‐destructive testing (e.g. via radiation transmission methods, described below) the samples can be split longitudinally for visual inspection and thin‐sections prepared for optical microscopy and scanning electron microscopy (SEM) imaging to assess MnO2 distribution, porosity changes, etc. For the latter involving through‐diffusion testing, samples would be disks cut from existing cores (e.g. 63.5 mm diameter HQ‐cores) with lengths of 10 to 20 mm. Differences in diffusive transport between the conservative tracer and MnO4
‐ will provide insight into the degree of attenuation due to NOD reactions within the intact rock samples.
Porosity and Diffusion Measurements on Intact Samples
The porosity distribution and diffusion coefficient of sandstone samples will be measured using methods described by Cavé et al (2009). The measurements will be conducted on small subsamples cut from cores or rock slabs prior to the oxidant diffusion and injection experiments, and again following the oxidant injection in order to provide quantitative information on the magnitude of change in the diffusion coefficient due to MnO2 precipitation in the pore spaces.
MnO2 Distribution in the Rock Matrix
The reaction of permanganate in the rock matrix with natural minerals, organic carbon, and TCE is known to produce insoluble Mn(III/IV) oxide solids. The spatial distribution of these secondary solid products will provide an indication of the extent of penetration of the oxidant into the matrix. The distribution of the secondary oxides in the rock matrix will be monitored periodically throughout the 1‐D (semi‐infinite case) diffusion experiments using radiation transmission methods that were recently developed at the University of New Brunswick Cavé et al (2009).
Mineral – Oxidant Reactions
The mineralogy of the rock samples used in the oxidant injection experiments will be determined prior to the injections using powder x‐ray diffraction (XRD), optical microscopy and scanning electron microscopy (SEM) in a manner similar to that described by Loomer and Al (2009). This will establish an understanding of the initial, or baseline conditions. Mineralogical investigations will also follow the permanganate diffusion experiments in order to identify specific mineral‐water reaction processes that contribute significantly to the consumption of permanganate. The post injection mineralogical investigations will involve XRD, SEM and transmission electron microscopy.
PROJECT SCHEDULE
The laboratory studies are proposed for a one year period, ideally beginning in January 2012.
5
REFERENCES
Cavé, L., T. A, Y. Xiang and P. Vilks. 2009. A technique for estimating one‐dimensional diffusion coefficients in low‐permeability sedimentary rock using X‐ray radiography: Comparison with through‐diffusion measurements. Journal of Contaminant Hydrology 103: 1‐12.
Loomer, D. and T. Al. 2009. Mineralogical characterization of drill core samples from the Santa Susana Field Laboratory, Ventura County, California. Report submitted to the University of Guelph, April 2009.
Schnarr, M., C. Truax, G.Farquhar, E. Hood, T. Gonullu and B. Stickney. 1998. Laboratory and controlled field experiments using potassium permanganate to remediate trichloroethylene and perchloroethylene DNAPLs in porous media. Journal of Contaminant Hydrology 29: 205‐224.
Appendix F Protocol for Collecting and Analyzing Rock Core Samples for Volatile Organic Chemical
Concentrations and Physical Properties
APPENDIX F
PROTOCOL FOR COLLECTING AND ANALYZING ROCK CORE SAMPLESFOR VOLATILE ORGANIC CHEMICAL CONCENTRATIONS AND
PHYSICAL PROPERTY MEASUREMENTS
PREPARED FOR: SANTA SUSANA FIELD LABORATORY
Prepared By: Beth L. Parker
Jennifer C. Hurley Bryn Shurmer
Modified By:Maria Gorecka
Richard Andrachek, June 2005
Protocol for Collecting and Analyzing Rock Core Samples for Volatile University of WaterlooOrganic Chemical Concentrations and Physical Property Measurements
LIST OF FIGURESFIGURE 1: Schematic Diagram of the Rock CrusherFIGURE 2: Outline of the Rock Core Sampling Procedure
Protocol for Collecting and Analyzing Rock Core Samples for Volatile University of WaterlooOrganic Chemical Concentrations and Physical Property Measurements
F-1
1 INTRODUCTION
Sedimentary rocks such as the Chatsworth Formation sandstone which underlies the
Santa Susana Field Laboratory (SSFL) in Ventura County, California are referred to as
fractured porous media because of their appreciable primary porosity in the matrix
between fractures. The primary porosity of this formation has been measured on 59 rock
core samples from the site using a variety of methods, with values ranging from 1.0 to
21.6% (Barone, 1997; Chatzis, 1997; Sterling and Parker, 1999). However, it is the
presence of fractures in this rock formation that provide the paths for fluid flow, hence
providing the main pathways for recharge water and dense non-aqueous phase liquid
(DNAPL) flow, especially below the water table where the matrix pores are completely
filled with water. The void space due to the presence of fractures (fracture porosity) is
expected to be several orders of magnitude lower than the matrix porosity and is
estimated at between 10-4 and 5x10⁻⁶ (Montgomery Watson, 2000). This large difference
between fracture and matrix porosities is an important feature of fractured sedimentary
rocks and greatly influences the distribution of chlorinated solvent mass in these deposits
in terms of DNAPL fate as well as solute movement.
The purpose of this document is to recommend and describe a method for measuring
trichloroethylene (TCE) and other volatile organic constituents in a sedimentary rock
matrix. These concentrations will aid in quantifying the extent of contaminant invasion
within these relatively low-permeability zones in the matrix blocks between fractures,
providing data with which to interpret the present-day mass distribution at several TCE
input locations (source areas). The manner in which processes operate in fractured
sandstone and shale is very different from sandy aquifers, but these differences are poorly
understood and are not generally appreciated by the scientific community. The rock
matrix characterization work combined with multi-level monitoring of the coreholes will
assist in validating the conceptual site model for the persistence and stability of
high-concentration zones in the sandstone, trends in monitoring well data, appropriate
frequency of monitoring well sampling, and the nature of solvent fluxes toward receptors.
These issues are at the heart of corrective action and long-term monitoring requirements.
Protocol for Collecting and Analyzing Rock Core Samples for Volatile University of WaterlooOrganic Chemical Concentrations and Physical Property Measurements
F-2
Hence, there is much potential for improvement and associated cost savings regarding
approaches to site characterization at fractured rock sites.
The recommendations presented in this document were prepared from a literature search
for information on such methods, and from a previous study conducted at the SSFL by
the University of Waterloo as a part of Sean Sterling’s MSc. thesis. Review of this
information provided a basis for the recommended field and laboratory protocols that
follow.
1.1 OBJECTIVES AND TECHNICAL APPROACH
The objectives for determining the volatile organic constituent (VOC) concentrations in
the rock matrix at the SSFL facility are several fold:
1. Determine the mass distribution with depth and vertical distance away fromfractures;
2. Assess the extent of matrix invasion, concentration gradients, and direction ofdiffusion into or out of the matrix blocks;
3. Determine the phase of contaminant distribution in the saturated andunsaturated zones;
4. Determine the maximum vertical extent of TCE migration and collectevidence for hydrostratigraphic zones that serve as capillary barriers toDNAPL flow or reduced groundwater flux; and,
The proposed data collection activities will provide data for the characterization of the
groundwater and DNAPL flow and contaminant migration. Determining the nature of
the subsurface zones will be directly useful for making decisions regarding impact to
receptors and plume management. To accomplish these objectives, rock core
sub-samples will be collected from coreholes at regularly spaced depth intervals and
distances away from targeted fractures. The samples will be analyzed for selected
volatile organic compounds including tetrachloroethene, TCE, cis-1,2-dichloroethene
(DCE), trans-1,2-DCE, 1.1-DCE, CFC-113, chloroform and 1,1,1-trichloroethane. Core
samples representing the various physical conditions in the matrix due to changes in
Protocol for Collecting and Analyzing Rock Core Samples for Volatile University of WaterlooOrganic Chemical Concentrations and Physical Property Measurements
F-3
depth and lithologies may be taken and preserved for laboratory measurements for data
permeability, fraction of organic carbon, retardation factors, and diffusion coefficients.
1.2 BACKGROUND
The SSFL is underlain by Cretaceous Age arkosic sandstone with occasional beds of
siltstone and claystone and is referred to as the Chatsworth formation. This sedimentary
rock deposit dips 20-30° to the northwest and has been characterized as having from 10
to 40 fractures per 100 linear feet of core depending on the proximity to major fault or
shear zones (Groundwater Resources Consultants, Inc., 1992). The sandstone is
described as having a brown or blue-grey colour with a non-calcareous and calcareous
matrix, respectively. Porosity, diffusion coefficients, fraction of solid phase organic
carbon, and mercury porosimetry measurements have been made on eleven subsamples
of rock core from the site (Barone, 1997, Chatzis, 1997). Porosity, moisture content and
matrix permeability have also been measured on fourteen samples by
David B. McWhorter at Colorado State University. As previously mentioned, the
primary porosity varies from 1.0 to 21.6%, representing the range in lithologies to depths
of 365-feet below ground surface (bgs), however, a typical value is close to the arithmetic
average of 13.6%. The estimated hydraulic conductivity for the matrix ranges from 1.5 x
10-5 cm/s (described as coarse sandstone) to 8.5 x 10⁻¹¹ cm/s (siltstone). The arithmetic
mean matrix hydraulic conductivity is 2.1 x 10⁻⁵ cm/s (Sean Sterling, 1999). The
aqueous diffusion coefficients for chloride ranged from 0.7 to 2.3 x 10⁻⁶ cm2/s (Barone,
1997; Chatzis, 1997). Based on previous investigations of this type and the site-specific
conditions, the following field and laboratory methods are proposed for collecting and
analyzing subsamples.
Protocol for Collecting and Analyzing Rock Core Samples for Volatile University of WaterlooOrganic Chemical Concentrations and Physical Property Measurements
F-4
2 FIELD METHODS
Plans for coring and well construction are provided in Appendix B. Matrix pore water
chemistry and supporting measurements will be collected from continuous HQ or PQ
cores and will be determined specifically based on the hydrogeologist’s field decisions
with an average sample spacing ranging from one to two feet (see Section 2.2.1 below).
An on-site geologist (supplied by MWH) will be responsible for overseeing the drillers
and preparing a daily log of drill site activities including a complete log of the continuous
core. An on-site hydrogeologist (supplied by the University of Waterloo) will be
responsible for the implementation of the rock core sample collection and analysis plan.
All methanol preserved rock core samples and samples for moisture content/porosity,
diffusion coefficient, and matrix permeability will be analyzed by the University of
Waterloo in the laboratory in Waterloo, Ontario. Aliquots of the methanol extract from
five per cent of the rock core samples will be sent to a commercial laboratory for VOC
analyses.
2.1 ROCK CRUSHER
The rock crusher is based on the Enerpac™ system, which is a commercial hydraulic
press that provides the crushing power necessary to break up the rock samples. The core
sample is placed in crushing cell and crushed with a stainless steel piston head (see
Figure 1). The crushed sample is simultaneously collected in a 40 milliliter (mL) VOA
vial filled with a known volume of purge and trap grade methanol.
Protocol for Collecting and Analyzing Rock Core Samples for Volatile University of WaterlooOrganic Chemical Concentrations and Physical Property Measurements
F-5
Figure 1. Schematic Diagram of the Rock Crusher
2.2 CORE RETRIEVAL, SUBSAMPLE COLLECTION, HANDLING, AND PRESERVATION
Core runs will be in five-foot lengths, and the diameter will be HQ or PQ-sized. The
cores will be placed in aluminum foil-lined PVC trays (made of PVC pipe) and removed
from direct sunlight and windy conditions to minimize volatilization of organic
contaminants. Aluminum foil will also be used to cover the core while the
geologist/hydrogeologist is/are inspecting the core for sample locations based on
lithology, presence of fractures, bedding plane partings, and evidence for groundwater
and/or DNAPL fluid flow. The hydrogeologist will flag/mark the sections of the core to
be subsampled for any of the five following types of samples:
Sample Jar
Dual valveTedlar Bag
Septum Valvefor Sampling
Inlet Fitting
On/Off Valve
Crushing Cell
Rock Crusher
Protocol for Collecting and Analyzing Rock Core Samples for Volatile University of WaterlooOrganic Chemical Concentrations and Physical Property Measurements
F-6
1. VOC analyses
2. Moisture content/porosity
3. Diffusion Coefficient
4. Matrix permeability/hydraulic conductivity
5. foc, mineralogy, thin sections
These sample types will be taken in the priority listed above, which is based upon the
samples’ relative sensitivity to VOC and/or moisture content loss.
2.2.1 VOC Samples
Subsamples of rock core for determining the presence and pore water concentrations of
VOCs will be collected immediately to minimize chemical losses due to volatilization.
Aluminum foil-wrapped sections of the core will be removed from the core box for
subsampling, after which, the rock core will be logged as soon as possible. For future
reference, wooden spacers will be placed in the core boxes where core sections have been
removed. Each spacer will indicate the sample identification (ID), length and depth of
the removed section, the date, and the purpose for which the sample was removed.
There are four criteria for VOC sample selection. First, samples will be taken at a preset
sample spacing of every two feet from the top of bedrock. Second, VOC subsamples will
be taken at 6 and 12 inches away from all identified fractures or partings, both above and
below these features. These samples are intended for measuring the extent of diffusion
into the matrix blocks away from fractures that may have once contained DNAPL phase
or solute. Third, additional VOC subsamples should be collected where there is a distinct
change in lithology that is not represented within the regular sampling interval. Samples
will be collected from both sides of such boundaries, referred to as lithology pairs so that
representative samples are collected from the different matrix materials. Fourth,
duplicate samples will be collected at a frequency of 1/20. These subsamples will be
taken from the same length of core split lengthwise (along the core axis) to provide
Protocol for Collecting and Analyzing Rock Core Samples for Volatile University of WaterlooOrganic Chemical Concentrations and Physical Property Measurements
F-7
samples along the same depth interval, thus ensuring the same lithology and analyte
concentrations in both samples.
2.2.2 Procedures for VOC Subsampling
Figure 2 presents a general schematic of the VOC subsampling procedure. The
description below is a step-by-step outline of the process of rock core sampling.
1. Lay core in an aluminum foil-lined split PVC tray
2. Note top/bottom of core, measure length, and quickly identify features (fractures,breaks, bedding planes partings, lithology/facies changes, evidence of fluid flow (i.e.secondary minerals, precipitates, slickensides, etc.)) to select sample locations
3. Cover with the aluminum foil to minimize volatilization and evaporation of porewater
4. Break off a three-inch section of core using a rock hammer and chisel, inserting awooden spacer that specifies the depth interval that was removed, the type of sampletaken, and the date
5. If a field duplicate is planned, the disc length should be doubled to six inches andsplit lengthwise along the core axis using the chisel to produce two samples of nearlyequal size that cover the same depth interval
6. Wrap each sample in aluminum foil with a sample ID label to minimize volatilizationlosses, and place in a cooler containing ice prior to crushing
7. Using the rock hammer and chisel, chip off the outer 0.5 centimeter (cm) of the corerind to eliminate potential error introduced from flushing with the drilling fluid
8. Place sample in the clean, dry rock crusher and crush sample
9. Empty crushed sample into sample bottle containing a known volume (~15 ml) ofmethanol, taking extreme care to minimize splashing of methanol out of the jar.These sample vials and lids have been previously labeled and weighed both beforeand after filling with methanol, and again, immediately prior to their use in the field.There should be 15 to 20 grams (g) of rock in each sample bottle.
10. Record sample information (including a description (i.e. lithology pair, duplicate), thesample depth, location relative to any nearby fractures, etc.)
11. Clean rock crusher components, rock hammer, and chisel using the four-partdecontamination procedure explained in Section 2.4.
Protocol for Collecting and Analyzing Rock Core Samples for Volatile University of WaterlooOrganic Chemical Concentrations and Physical Property Measurements
F-8
The sample bottles are clear glass sample vials with Teflon-lined septa and open-top
caps. Each labeled sample vial with cap and septum will be weighed empty, and re-
weighed once the purge and trap grade methanol has been added to accurately determine
the weight and volume of methanol extract emplaced in the container before being sent to
the field. Before its use in the field, each container will be re-weighed to verify the
volume of methanol, and will be weighed again immediately after sample collection to
record the exact weight of each rock sample. There should be 15 to 20 g of rock in each
sample bottle. Sample bottles will be stored in a cooler with ice or refrigerator set to 4°C
until being shipped back to the University of Waterloo for analysis. After the appropriate
procedure, aliquots of methanol from the sample containers will be analyzed for VOCs at
the University of Waterloo.
Protocol for Collecting and Analyzing Rock Core Samples for Volatile University of WaterlooOrganic Chemical Concentrations and Physical Property Measurements
F-9
Figure 2. Schematic of the VOC Subsampling Procedure
Break off Sample, wrapping tightly in aluminum foil.If not crushing immediately, place in cooler with ice
Crush Sample
Place rock fragments inMeOH-Filled VOAs
Calculate effective porosity from wet vs dry weights of rock samples
Extraction Period
Place rock fragments inMeOH-Filled VOAs
Analyze MeOH extract usingGC/µECD off-site
Calculate mass concentration ofCOC’s per wet weight of rock
Measure dry solids weight of sample
Re-wet sample with DI water – measure chloride concentration in pore water
Calculate mass concentrations per litre of pore fluid
Trim off Rind
Protocol for Collecting and Analyzing Rock Core Samples for Volatile University of WaterlooOrganic Chemical Concentrations and Physical Property Measurements
F-10
2.3 PHYSICAL PROPERTY MEASUREMENTS ON CORE SAMPLES
Samples for physical property measurements may be collected at any of the coreholes.
Samples will be sent with a copy of the boring logs and field logbook information
concerning the lithology, locations of fractures, and flow zones to the University of
Waterloo. A copy of the geologist’s boring log with descriptions of the lithology and
structural features with depth will also be used to interpret results from the physical
property measurements on core. All samples will be well packed in sturdy boxes with
ample wrapping for protection against breakage.
2.3.1 Moisture Content/Porosity Sample Collection
These samples may be collected at the discretion of the hydrogeologist in the same
manner as the VOC sampling as described above in Section 2.2.1. An effort will be
made to obtain subsamples from different lithologies above and below the water table,
with an occasional duplicate.
Each sample will be a cylindrical disc of the same diameter as the core (PQ) that is
retrieved from the core barrel, with a height of approximately one-inch. These sections
of core will be obtained such that the in-situ moisture conditions are retained: working
quickly, keeping the core covered and out of direct sunlight, and immediately wrapping
and sealing it. The sample will be collected using a hammer and chisel, which will be
decontaminated after each sample is collected as described below in Section 2.4. After
the sample is broken from the main core, it will be immediately tightly wrapped in clean
aluminum foil twice around the circumference for complete coverage of the sample and
smooth seams, followed by plastic wrap and tape. Finally, the sample will be wrapped in
Parafilm. Each sample will be clearly labeled with the sample ID, lithology type, core
location, depth, and date. Details and a full description of each sample will be recorded
in the field notebook.
Protocol for Collecting and Analyzing Rock Core Samples for Volatile University of WaterlooOrganic Chemical Concentrations and Physical Property Measurements
F-11
2.3.2 Diffusion Coefficient Sample Collection
Cylindrical sections of the rock core (full diameter) and approximately one to two feet in
length will be collected and preserved in the same manner as the moisture
content/porosity samples (see Section 2.3). Samples of each of the lithological zones
above and below the water table may be collected from either or both of the two
coreholes at the discretion of the hydrogeologist. As with the porosity samples, these
cores should first be wrapped (two to three times around) with aluminum foil, completely
covering the whole core sample. Plastic wrap and tape follow this, and finally the sample
is wrapped in Parafilm. These samples will also be shipped in a cooler with ice to the
University of Waterloo for storage in the refrigerator at 4°C until use in laboratory
measurements.
2.3.3 Permeability Sample Collection
Samples may be collected from either or both of the coreholes for permeability analysis.
Sample collection will be at the discretion of the hydrogeologist. These samples will be
distributed throughout the length of the cored zone and selected to represent the various
lithologies present over this depth interval. One to three inch lengths of core (full
diameter) will be selected, wrapped in aluminum foil and plastic wrap and taped with a
label indicating the core location, depth interval, and date of collection.
2.3.4 Fraction of Organic Carbon, Mineralogy, and Thin Section SampleCollection
Subsamples for fraction of organic carbon, mineralogy, and thin section studies may be
taken from the permeability, porosity, or diffusion samples as required. Care will be
taken to ensure that these samples are distributed throughout the length of the cored zones
in each corehole and are selected to represent the various lithologies that are encountered.
Protocol for Collecting and Analyzing Rock Core Samples for Volatile University of WaterlooOrganic Chemical Concentrations and Physical Property Measurements
F-12
2.4 DECONTAMINATION OF DRILLING AND SUBSAMPLING EQUIPMENT
Decontamination procedures are designed to remove all traces of contaminants from the
equipment to prevent cross-contamination of samples. Core barrels will be cleaned
between core runs using a 55-gallon drum of clean water and pressure washers. The
hammer and chisel will be wiped down with a clean cloth soaked in methanol, followed
by a clean cloth soaked in distilled water, and dried before re-use.
Only those parts of the rock crusher that came into contact with the subsamples require
cleaning. This includes four components: the crushing cell, the crushing cell insert, the
screw-off piston, and the tubing used to collect air samples (see Figure 2). The procedure
for cleaning these components consists of four steps. First, the parts will be cleaned in a
phosphate-free detergent wash to get rid of the obvious sediment. The second step is full
immersion in a clean (tap) water rinse, followed by a methanol rinse to remove any traces
of contaminants not removed previously. The final step is immersion in distilled (organic
free) water to remove all traces of the methanol. The tools are then dried using clean
paper towels before being used again. All cleaning fluids will be collected and treated or
disposed of in the proper manner.
Samples of the drilling recirculation fluid will also be collected at regular intervals and
analyzed on-site for VOCs. Both rock core screening and drilling fluid analyses results
will be used to determine the frequency of changing out of the drilling fluid.
2.5 FIELD QA/QC
One equipment blank for the rock crusher will be taken after every 20 samples. Trip
blanks equaling five percent of the total sample number or at least one trip blank per
batch of samples being stored in a cooler or box will be brought and stored with the
methanol samples for later analysis at the University of Waterloo.
Protocol for Collecting and Analyzing Rock Core Samples for Volatile University of WaterlooOrganic Chemical Concentrations and Physical Property Measurements
F-13
3 LABORATORY METHODS
The University of Waterloo will conduct the majority of the analyses, with the exception
that five percent of the samples will be sent to a California-certified off-site laboratory for
analysis by EPA Method 8260B.
3.1 SAMPLE ANALYSES METHODS
3.1.1 VOC Sample Extraction
Methanol extraction is expected to remove the sorbed as well as the dissolved phase
contaminants from the matrix and prevent loss of these volatile constituents from the
sample container during the extraction time period required.
Each sample will be shaken to facilitate the extraction of pore water into the methanol.
Samples will be allowed to extract in a cooler/refrigerator at 4°C for a minimum of six
weeks prior to performing the VOC analyses. These time periods have been selected
based on previous studies. This shake-flask technique may be combined with sonication-
or microwave-assisted solvent extraction where sound waves or microwaves are used to
maximize the transfer of the matrix pore water and organic constituents into the
extractant. To check the completeness of the extraction, ten percent of the VOC samples
will be analyzed two weeks following the initial analyses for comparison of the amount
of mass measured in the same samples (replicate analyses with a time lag).
3.1.2 Pore Water VOC Concentrations
Previously, rock samples that were preserved in HPLC grade methanol were sent to a
contract laboratory and analyzed using EPA Method 8021B (EPA, 1996). This provided
a detection limit of 50 micrograms (µg) of TCE per liter of methanol. This protocol has
been modified to provide improved detection limits using equipment and methods
developed at the University of Waterloo for quantification of selected VOC compounds,
specifically, those listed in Table 1. However, five percent of the total number of
samples that are analyzed at the University of Waterloo will also be sent to a commercial
laboratory for laboratory cross-check purposes using EPA Method 8260. The
Protocol for Collecting and Analyzing Rock Core Samples for Volatile University of WaterlooOrganic Chemical Concentrations and Physical Property Measurements
F-14
commercial lab will screen for the complete list of VOC analytes, including CFC-113 and
1,4-dioxane, despite higher detection limits.
Rock subsamples collected in the 40 mL glass sample bottles will be sent to the
University of Waterloo for analysis. After the VOC’s have been completely extracted
into the methanol (a period of at least two weeks), an aliquot of methanol will be injected
directly into a gas chromatograph (GC) for separation and quantification using a micro-
electron capture detector (µ−ECD). The list of analytes to be quantified is provided in
Table 1.
The direct, on-column injection of methanol onto the gas chromatograph has been
currently tailored for analysis of TCE and relevant breakdown products so that the
resulting detection limit and run times are significantly lower than that reported by the
previous contract laboratory. These improved detection limits in methanol have been
converted to equivalent pore water concentrations for those compounds studied in our
method development. The GC specifications for the new methanol direct on-column
injection technique are summarized below:
GC: HP 6890 with autosampler
Column: HP-1 30m, 0.32mm ID, 4µm stationary phase
Injection: 1µL liquid, cold on-column
Carrier gas: Helium
Detector: µ−ECD
Analysis turnaround time: 17 minutes
Protocol for Collecting and Analyzing Rock Core Samples for Volatile University of WaterlooOrganic Chemical Concentrations and Physical Property Measurements
*Note: ρb wet=2.45 g/cm3 ; φm=12.86%; R1-1-DCE=2.2; Rt-DCE=2.1; Rc-DCE=2.6; RTCE=3.3;RPCE=7.6 and assuming 40 cm3 of rock in 60 mL of MeOH.
3.1.3 Moisture Content/Porosity Measurements
The preserved samples will be placed in a cold storage room (4°C) until ready for
gravimetric determinations. The samples will be unwrapped, placed on a pre-weighed
aluminum weighing tray, and weighed. The sampled will then be oven-dried at 105oC for
four days, allowed to cool to room temperature in a desiccator, and a final weight
determined. The volume of the sample will be determined by submerging the oven-dried
sample in a container of mercury and measuring its displacement. This allows
calculation of sample porosity, moisture content, and wet and dry bulk densities. These
data, along with the VOC analyses, will be used for calculating matrix pore water
concentrations.
3.1.4 Laboratory Permeability Measurements
Samples collected for permeability measurements will be measured at the University of
Waterloo. The preserved rock core samples obtained from the field will be sub-cored to
one-inch diameter and variable lengths ranging from one to six centimetres. The samples
will then be oven-dried at 105°C for greater than 24 hours before being placed in a
flexible-walled permeameter cell. A confining pressure of 100 psi will be applied to the
sample cell using nitrogen gas. Sample hydraulic conductivities will be determined from
measuring the permeability of the dried samples to air.
Protocol for Collecting and Analyzing Rock Core Samples for Volatile University of WaterlooOrganic Chemical Concentrations and Physical Property Measurements
F-16
3.1.5 Diffusion Coefficient Measurements
Laboratory methods will be developed to quantify the amount of sorption to rock matrix
solids using batch and/or diffusion transport experiments using TCE as the solute of
interest.
3.2 LABORATORY QA/QC
A minimum of five percent of all methanol preserved subsamples will have aliquots of
the methanol extract removed after the samples have been allowed to fully extract. These
aliquots will be sent to a contract laboratory for independent confirmation of analyte
concentrations. Spiked methanol aliquots of known concentration will also be sent to the
commercial laboratory to test compare the different analytical techniques. A minimum of
five percent of all samples collected in the field will be split duplicates and will be
analyzed by the University of Waterloo.
3.3 DETERMINING DRY WEIGHT OF ROCK SAMPLES FOR POROSITY ESTIMATION
Each sample will be emptied into a pre-weighed filter cone after the rock sample has
been analyzed for VOCs. The sample jar will be rinsed with methanol to ensure that all
the fines have been flushed onto the filer paper, and the filter cone with the sample will
then be allowed to dry under a fume hood. Once dry, the filter paper and sample will be
replaced back into the original sample jar and baked at 40°C until dry. The sample will
then be cooled to room temperature in a desiccator and weighed in order to obtain the dry
bulk density and moisture content of each sample, from which the saturated porosity can
be estimated. During this process, each sample will be described again, and notes will be
kept in the field notebook. These data, along with the VOC analyses, will be used for
calculating matrix pore water concentrations, in order to minimize errors introduced by
assuming a uniform porosity and density for all samples.
Protocol for Collecting and Analyzing Rock Core Samples for Volatile University of WaterlooOrganic Chemical Concentrations and Physical Property Measurements
F-17
4 REFERENCES
Barone, Frank S. 1997. Matrix diffusion testing on rock core samples, Rocketdyne SantaSusana Field Laboratory, Chatsworth, California, Golder Associates Ltd.,Mississauga, Ontario.
Chatzis, John. 1997. Mercury porosimetry testing results, rock core samples,Rocketdyne Santa Susana Field Laboratory, Chatsworth, California. Departmentof Chemical Engineering Porous Media Laboratory Report, University ofWaterloo.
Groundwater Resources Consultants, Inc. 1992. Results of collection and analyses ofrock cores, Santa Susana Field Laboratory. A consulting report prepared forRockwell International Corporation, Rocketdyne Division, Canoga Park,California. Report 8640M-168, May 4, 1992.
Montgomery Watson. 2000. Technical Memorandum, Conceptual Site Model Movementof TCE in the Chatsworth Formation. April.
Sterling, S.N., and B.L. Parker. 1999. Rock core sampling and analysis for volatileorganic concentrations and hydraulic parameters in boreholes RD-35B andRD-46B at the Santa Susana Field Laboratory, California, unpublished report,February 02, 1999, Department of Earth Sciences, University of Waterloo,Waterloo, ON, 164 pages.
U.S. Environmental Protection Agency (EPA). 1996. Test methods for evaluation solidwaste, physical/chemical methods. SW-846, Final Update III, Revision 2.Method 8021B, Aromatic and halogenated volatiles by gas chromatography usingphotoionization and/or electrolytic conductivity detectors.