26
WORK-RELATED INJURIES IN AUSTRALIA, 2005–06 OCTOBER 2009 Retail trade industry

WORK-RELATED INJURIES IN AUSTRALIA, 2005–06
OCTOBER 2009
Retail trade industry

Disclaimer
The information provided in this document can only assist you in the most general way. This document does not replace any statutory requirements under any relevant State and Territory legislation. Safe Work Australia is not liable for any loss resulting from any action taken or reliance made by you on the information or material contained on this document. Before relying on the material, users should carefully make their own assessment as to its accuracy, currency, completeness and relevance for their purposes, and should obtain any appropriate professional advice relevant to their particular circumstances.
To the extent that the material on this document includes views or recommendations of third parties, such views or recommendations do not necessarily refl ect the views of Safe Work Australia or indicate its commitment to a particular course of action.
Online Publication Copyright notice
© Commonwealth of Australia 2009
ISBN 978-0-642-32913-4
This work is copyright. You may download, display, print and reproduce this material for your personal, non-commercial use or use within your organisation, provided that an appropriate acknowledgement is made (retaining this notice), and the material is not altered or subjected to derogatory treatment. Apart from any use as permitted under the Copyright Act 1968, all other rights are reserved. Requests and inquiries concerning reproduction and rights should be addressed to Commonwealth Copyright Administration, Attorney-General’s Department, Robert Garran Offi ces, National Circuit, Barton ACT 2600 or posted at http://www.ag.gov.au/cca

ForewordSafe Work Australia principally uses workers’ compensation claims data to measure occupational health and safety (OHS) performance in Australia. The claims data are collated in the National Data Set for Compensation Based Statistics (NDS) and are published annually in the Compendium of Workers’ Compensation Statistics, Australia. This publication is a key reference documenting patterns of work-related injuries and diseases incurred by Australian workers and the cause of that injury or disease. For the purposes of this report, the expression ‘work-related injury’ will be used to represent all work-related conditions, including work-related diseases.
While the NDS is a valuable tool for monitoring OHS, it does not provide information on work-related injuries for groups not well covered by workers’ compensation schemes, such as self-employed workers. It is estimated that workers’ compensation schemes, and therefore the NDS, covered only 88%1 of the workforce in 2005–06. In addition, the NDS does not contain information on some types of employment conditions, such as shiftwork or access to paid leave entitlements. Finally, the NDS is unable to provide any information on work-related injuries where workers’ compensation was not sought. Therefore, although the NDS generally provides a good picture of the characteristics of work-related injuries, it underestimates the true number of work-related injuries occurring each year.
To address this situation, the National Occupational Health and Safety Commission (now known as Safe Work Australia) agreed to contribute funding towards a national survey of work-related injuries run by the Australian Bureau of Statistics (ABS) as part of the Multi-purpose Household Survey. The Work-Related Injuries Survey (WRIS) was conducted for the period 2005–06 with results released in December 2006. In this survey, participants aged 15 years and over, were asked to recollect and relate a range of details about their most recent work-related injury or illness, no matter how minor, that occurred within the last 12 months. The survey collected information on labour force characteristics (e.g. industry, occupation) and personal demographics (e.g. age, sex) which are useful when making comparisons to the NDS. The WRIS also collected information on employment arrangements, such as whether the worker worked under shift arrangements, worked part-time or had access to paid leave. This type of information is not collected in the NDS. Importantly, the WRIS also collected information about whether or not workers’ compensation was sought, and if not, why not.
Unless otherwise stated, all data presented in this report have relative standard errors (RSEs) less than 25%. Data with RSEs greater than 50% have generally been suppressed. Unfortunately, this has, on occasions, limited the scope of the reports.
This report is one in a series of industry based reports that explore the types and causes of work-related injury and how these compare to those in the NDS.
1 The percentage of employees is calculated from the Australian Bureau of Statistics, Work-related Injuries Australia (Cat. No. 6324.0)
iii


ContentsForeword iii
Summary of fi ndings vii
General Trends 1
Age 1
Sex 2
Full-time/part-time status 3
Shiftwork 4
Duration of absence 6
Employment type 7
Type of injury 7
Mechanism of injury 8
Comparison with NDS 9
Age 9
Sex 10
Type of injury 11
Mechanism of injury 12
Industry profi le 12
Application for workers’ compensation 14
Reasons for not applying for workers’ compensation 14
Conclusion 16
Explanatory Notes 17
v


Summary of fi ndingsThe following key points are contained in this report:
• Retail trade industry workers experienced 74 injuries per 1000 workers in 2005–06, slightly above the incidence rate for all Australian workers of 69 injuries per 1000 workers.
• The Retail trade industry had a younger workforce than any other industry. Workers aged 15-24 years accounted for four in ten workers in the Retail trade industry, twice the proportion who worked in the full Australian workforce. This age group recorded the highest incidence rate of all age groups at 95 injuries per 1000 workers. These workers were the least likely to apply for workers’ compensation.
• Nearly half the workers in the Retail trade industry worked part-time. The injury rate per hour among part-time workers was nearly double that of full-time workers, irrespective of sex.
• Sprains/strains accounted for one-third of all injuries in the Retail trade industry. They also accounted for nearly half of the injuries that required fi ve or more days off work.
• Four in ten injuries were due to Lifting, pushing or pulling objects.
• Male part-time workers were the least likely to apply for workers’ compensation for their serious injury while female part-time workers were the most likely to apply.
• Only three in ten injured employees in the Retail trade industry applied for workers’ compensation. One in fi ve of the employees who did not claim compensation thought they were not eligible.
• Even when their injuries involved fi ve or more days off work only one in two employees claimed compensation. There were therefore 10 000 workers who did not claim compensation for their serious work-related injury. Workers aged 15–24 years were the least likely to apply for workers’ compensation.
• This analysis has shown that the National Data Set for Compensation Based Statistics (NDS) provides good information on the type of injury incurred by workers in the Retail trade industry and also provides reasonable information on the way injuries occurred. The NDS information on serious claims, however, only captures half of the injuries incurred by employees.
vii


RETAIL TRADE... 1
General TrendsThere were 1 473 000 workers in the Retail trade industry in 2005–06, and around 109 000 of these workers experienced a work-related injury. This equates to 74 injuries per 1000 workers: slightly above the rate for all Australian workers of 69 injuries per 1000 workers.
AgeIt is well known that the Retail trade industry employs a high proportion of young part-time workers. Figure 1 shows that in 2005-06, 41% of workers in the Retail trade industry were aged 15–24 years. This was more than twice the percentage in the Australian workforce as a whole (18%). Consequently, the percentages of workers in the other age groups for the Retail trade industry were lower than the percentages for the Australian workforce as a whole.
Figure 1 Workers in the Retail trade industry: Percentage by age group
Figure 2 shows that while there were some differences, it can be said that the pattern of incidence rates by age group for the Retail trade industry was very similar to the Australian pattern.
These data show that the highest work-related incidence rate in the Retail trade industry was recorded by the 15–24 years age group. The rate of 95 injuries per 1000 workers aged 15–24 years in the Retail trade industry was also higher than the Australian rate of 86 injuries per 1000 workers for the same age group.
The only other age group in the Retail trade industry to record a higher incidence rate than the Australian rate was the 55 years and over group. However, since the data for the Retail trade industry for this age is subject to a relative standard error greater than 25%, no conclusive statement can be made on the difference.
From these data, it can be said that the higher overall incidence rate recorded by the Retail trade industry compared to the Australian rate is related to the younger age profi le and the higher incidence rate experienced by these workers.
0%
15%
30%
45%
Age group (years)
Per
cent
age
of w
orke
rs
Retail trade 41% 17% 17% 15% 10%
All industries 18% 22% 24% 22% 14%
15-24 25-34 35-44 45-54 55+*

2 ... SAFE WORK AUSTRALIA
Figure 2 Work-related injuries in the Retail trade industry: Incidence rate by age
* The number of Retail trade workers who experienced a work-related injury in the 55+ age group had RSEs of more than 25% but less than 50% and should be used with caution.
SexIn 2005–06, a greater percentage of workers in the Retail trade industry were female than in the Australian workforce as a whole (53% compared to 45%).
Figure 3 shows that the incidence rate for male Retail trade workers was about 10% higher than the rate recorded by female workers, 78 injuries per 1000 male workers compared to 70 injuries per 1000 female workers. While the rate for male workers in the Retail trade industry was similar to the Australian rate, the rate for female workers was 25% higher than the Australian rate for female workers.
Figure 3 Work-related injuries in the Retail trade industry: Incidence rates by sex
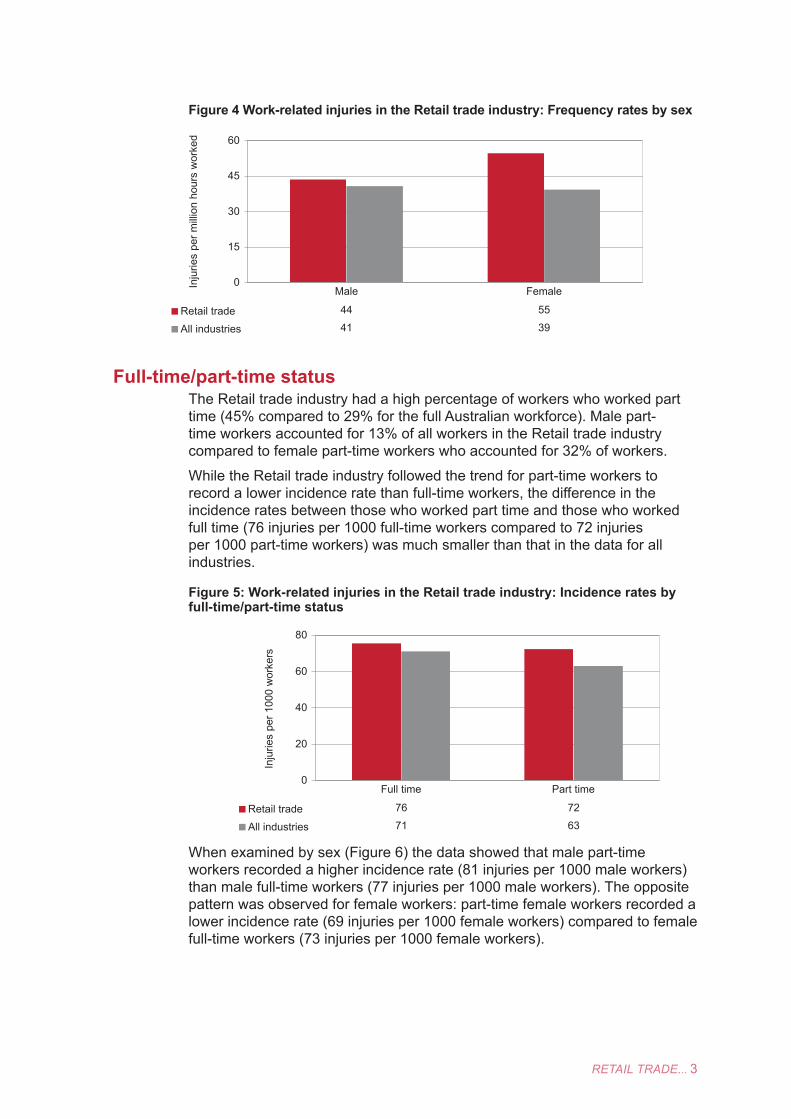
When frequency rates were used to control for the differences in normal working hours between male and female workers, the pattern changed considerably with female workers in the Retail trade industry recording a frequency rate of 55 injuries per million hours worked, 25% higher than the rate of 44 injuries per million hours worked recorded by male workers. In contrast, the Australian data showed that frequency rates were similar between the sexes.
0
25
50
75
100
Age group (years)
Inju
ries
per 1
000
wor
kers
Retail trade 95 59 58 61 61
All industries 86 63 68 71 55
15-24 25-34 35-44 45-54 55+*
0
20
40
60
80
Inju
ries
per 1
000
wor
kers
Retail trade 78 70
All industries 79 56
Male Female
RETAIL TRADE... 3
Figure 4 Work-related injuries in the Retail trade industry: Frequency rates by sex
Full-time/part-time statusThe Retail trade industry had a high percentage of workers who worked part time (45% compared to 29% for the full Australian workforce). Male part-time workers accounted for 13% of all workers in the Retail trade industry compared to female part-time workers who accounted for 32% of workers.
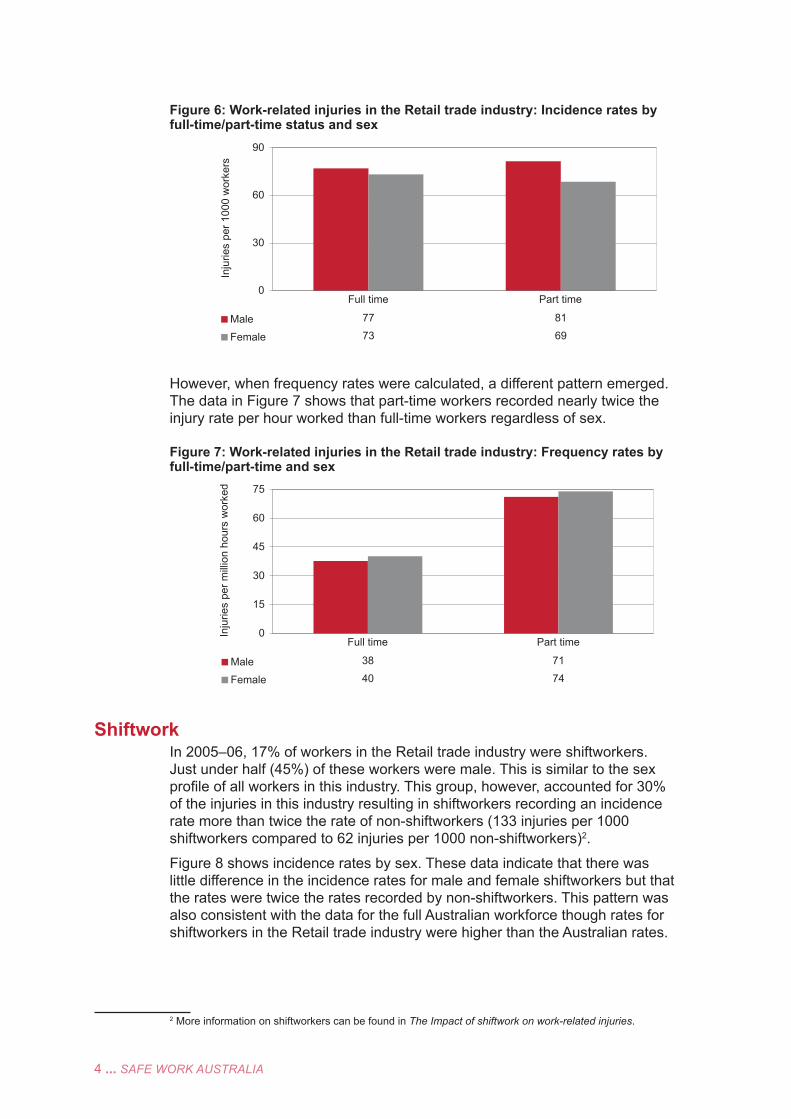
While the Retail trade industry followed the trend for part-time workers to record a lower incidence rate than full-time workers, the difference in the incidence rates between those who worked part time and those who worked full time (76 injuries per 1000 full-time workers compared to 72 injuries per 1000 part-time workers) was much smaller than that in the data for all industries.
Figure 5: Work-related injuries in the Retail trade industry: Incidence rates by full-time/part-time status
When examined by sex (Figure 6) the data showed that male part-time workers recorded a higher incidence rate (81 injuries per 1000 male workers) than male full-time workers (77 injuries per 1000 male workers). The opposite pattern was observed for female workers: part-time female workers recorded a lower incidence rate (69 injuries per 1000 female workers) compared to female full-time workers (73 injuries per 1000 female workers).
0
15
30
45
60
Inju
ries
per m
illion
hou
rs w
orke
d
Retail trade 44 55
All industries 41 39
Male Female
0
20
40
60
80
Inju
ries
per 1
000
wor
kers
Retail trade 76 72
All industries 71 63
Full time Part time
4 ... SAFE WORK AUSTRALIA
Figure 6: Work-related injuries in the Retail trade industry: Incidence rates by full-time/part-time status and sex
However, when frequency rates were calculated, a different pattern emerged. The data in Figure 7 shows that part-time workers recorded nearly twice the injury rate per hour worked than full-time workers regardless of sex.
Figure 7: Work-related injuries in the Retail trade industry: Frequency rates by full-time/part-time and sex
ShiftworkIn 2005–06, 17% of workers in the Retail trade industry were shiftworkers. Just under half (45%) of these workers were male. This is similar to the sex profi le of all workers in this industry. This group, however, accounted for 30% of the injuries in this industry resulting in shiftworkers recording an incidence rate more than twice the rate of non-shiftworkers (133 injuries per 1000 shiftworkers compared to 62 injuries per 1000 non-shiftworkers)2.
Figure 8 shows incidence rates by sex. These data indicate that there was little difference in the incidence rates for male and female shiftworkers but that the rates were twice the rates recorded by non-shiftworkers. This pattern was also consistent with the data for the full Australian workforce though rates for shiftworkers in the Retail trade industry were higher than the Australian rates.
2 More information on shiftworkers can be found in The Impact of shiftwork on work-related injuries.
0
30
60
90
Inju
ries
per 1
000
wor
kers
Male 77 81
Female 73 69
Full time Part time
0
15
30
45
60
75
Inju
ries
per m
illion
hou
rs w
orke
d
Male 38 71
Female 40 74
Full time Part time

RETAIL TRADE... 5
Figure 8 Work-related injuries in the Retail trade industry: Incidence rates by shiftwork arrangement and sex
These data show that both shiftworkers and part-time workers in the Retail trade industry recorded high rates of injury, but are these factors linked? Of the workers employed under shift arrangements, 60% also worked part-time. If we isolate these factors we can see in Figure 9 that part-time working shiftworkers recorded the highest incidence rate of the groups of workers shown, followed by full-time shiftworkers. Interestingly these data show that part-time workers not working under shift arrangements recorded the lowest incidence rate.
Figure 9 Work-related injuries in the Retail trade industry: Incidence rates by shiftwork arrangement and full-time/part-time status
When frequency rates were calculated it was not surprising that part-time shiftworkers recorded signifi cantly higher frequency rates than any of the other worker groups. Figure 10 shows that the frequency rate for part-time shiftworkers was nearly three times the rate of full-time shiftworkers and nearly three and a half times the rate for part-time non-shiftworkers.
0
40
80
120
160
Inju
ries
per 1
000
wor
kers
Retail trade 130 135 68 57
All industries 115 112 72 45
Male Female Male Female
Shiftworkers Non-shiftworkers
0
30
60
90
120
150
Inju
ries
per 1
000
wor
kers
Full time 109 71
Part time 148 50
Shift workers Non-shift workers

6 ... SAFE WORK AUSTRALIA
Figure 10 Work-related injuries in the Retail trade industry: Frequency rates by shiftwork arrangement and full-time/part-time status
Duration of absenceFigure 11 shows that the percentage of injuries corresponding to each period of time lost from work for the Retail trade industry followed the same general pattern as that for injuries incurred by all Australian workers except for injuries involving eleven or more days off work. In the Retail trade industry 8% of injuries required eleven or more days off work compared to 18% of injuries incurred by all Australian workers suggesting that workers in the Retail trade industry incurred less serious injuries than recorded by the Australian workforce as a whole.
Figure 11: Work-related injuries in the Retail trade industry: Percentage of injuries by duration of absence from work
* Data for 11 days or more in the Retail trade industry should be treated with caution due to an RSE >25%
Figure 12 shows that nearly 60% of injuries to part-time workers resulted in no time off work compared to only around 40% of injuries to full-time workers. This may be affected by the hours remaining to be worked on the day and the timing of the next working day, with part-time workers more likely to have longer periods of rest between normal working days.
0
30
60
90
120
150
180
Inju
ries
per m
illion
hou
rs w
orke
d
Full time 57 36
Part time 165 48
Shift workers Non-shift workers
0%
10%
20%
30%
40%
50%
No time off 1-4 days 5-10 days 11 days or more*
Duration of absence from work
Per
cent
age
of in
jurie
s
Retail trade All industries

RETAIL TRADE... 7
Figure 12: Work-related injuries in the Retail trade industry: Percentage of injured workers by full-time/part-time status and duration of absence
Employment typeThe basis of employment was investigated to determine it impacted on incidence rates. In the Retail trade industry, 90% of workers were employees in 2005–06 with the other 10% of workers Owner managers of unincorporated enterprises (OMUEs), basically self-employed workers. OMUEs recorded an incidence rate half the rate of employees: 37 injuries per 10003 OMUEs compared to 78 injuries per 1000 employees.
Type of injuryFigure 13 shows that the injury type profi le of the Retail trade industry closely matched the profi le of the all industries data. The most common type of work-related injury experienced by Retail trade workers was Sprains and strains (36% of all injuries). This was followed by Cuts and open wounds (17%) and Chronic joint or muscle conditions (19%).
Figure 13 Work-related injuries: Percentage of injuries by type of injury
*Other injury includes Crushing injury/internal organ damage, Superfi cial injury and Stress or other mental condition
3 There were 5500 injured workers who identifi ed as an OMUE. The RSE associated with this estimate is 38% and hence should be treated with caution.
0%
15%
30%
45%
60%
No time off 1-4 days 5 days or more
Duration of absence from work
Per
cent
age
of in
jurie
s
Full-time
Part-time
0%
10%
20%
30%
40%
Sprain / strain Cut / open wound Chronic joint ormuscle condition
Fracture Other injury*
Type of injury
Per
cent
age
of in
jurie
s
Retail tradeAll Industries
8 ... SAFE WORK AUSTRALIA
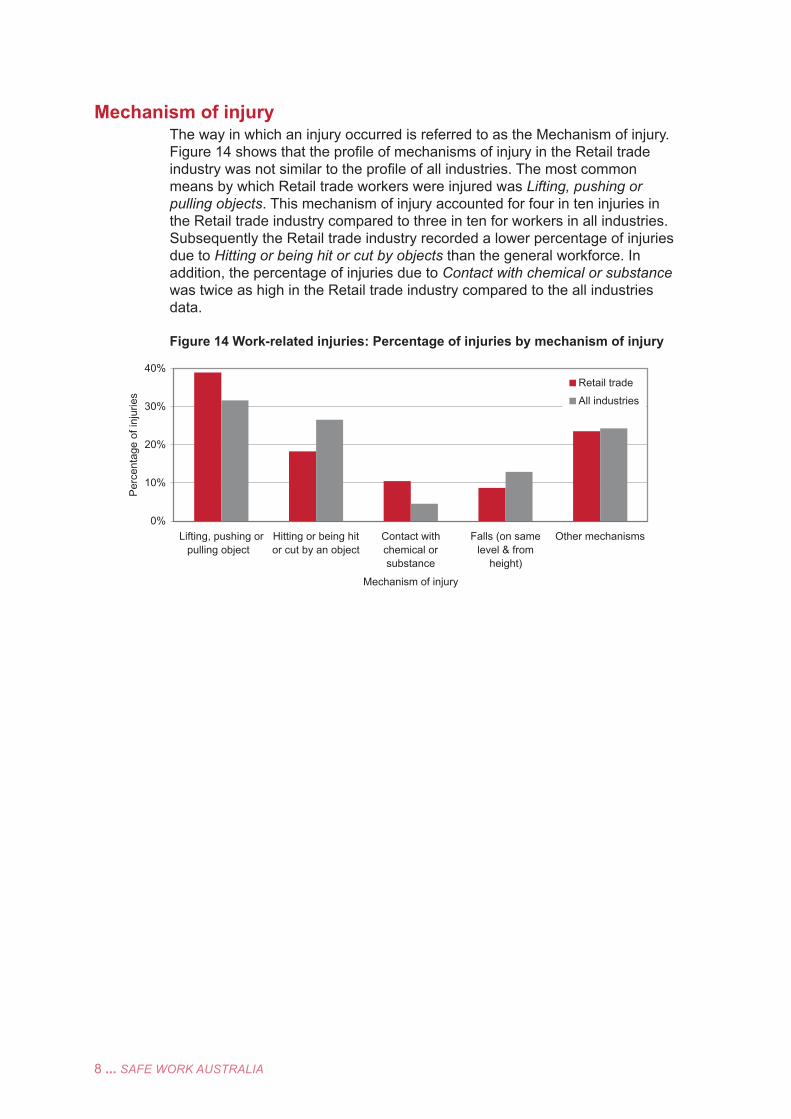
Mechanism of injuryThe way in which an injury occurred is referred to as the Mechanism of injury. Figure 14 shows that the profi le of mechanisms of injury in the Retail trade industry was not similar to the profi le of all industries. The most common means by which Retail trade workers were injured was Lifting, pushing or pulling objects. This mechanism of injury accounted for four in ten injuries in the Retail trade industry compared to three in ten for workers in all industries. Subsequently the Retail trade industry recorded a lower percentage of injuries due to Hitting or being hit or cut by objects than the general workforce. In addition, the percentage of injuries due to Contact with chemical or substance was twice as high in the Retail trade industry compared to the all industries data.
Figure 14 Work-related injuries: Percentage of injuries by mechanism of injury
0%
10%
20%
30%
40%
Lifting, pushing orpulling object
Hitting or being hitor cut by an object
Contact withchemical orsubstance
Falls (on samelevel & from
height)
Other mechanisms
Mechanism of injury
Per
cent
age
of in
jurie
s
Retail trade
All industries

RETAIL TRADE... 9
Comparison with NDSAt the beginning of this report it was stated that the WRIS data produced an incidence rate eight times the rate of serious injuries from the NDS. There are some signifi cant differences in the scope of information published by these two sources which need to be addressed prior to undertaking a comparison.
The published NDS data only includes information on claims lodged by employees with serious injuries. A serious injury is one that requires an absence from work of one week or more or where a permanent incapacity or death has occurred. The WRIS data includes all injuries from all workers.
To undertake an analysis both datasets need to be scoped to only include injuries with similar periods of time lost. For the NDS, the data has been restricted to only include claims where strictly one or more weeks of time lost has been recorded. For the WRIS, the data has been restricted to only include injuries which required fi ve or more days absence from work. The term ‘serious injury’ will be used to represent this restricted scope.
Using these restrictions, there were 12 500 serious claims in the NDS and 25 900 work-related serious injuries in the WRIS4. The WRIS also tells us that 13 000 of these injured workers received workers’ compensation. Since the number of compensated injuries from the two sources produced similar results, this increases confi dence in the other variables of the WRIS data despite the high relative standard errors associated with these data.
When the data were scoped to the same period of time lost the WRIS recorded an incidence rate twice that of the NDS (18 injuries per 1000 workers compared to 9 serious claims per 1000 employees in the NDS). While 10% of workers in the Retail trade industry are not employees and therefore not entitled to workers’ compensation, the WRIS data shows that there were very few injuries to non-employees that involved fi ve or more days off work and hence the difference in incidence rates is due to a large number of Retail trade workers not applying for workers’ compensation. This difference between the WRIS and NDS is the largest of all the industries5.
The next few sections will identify the groups of workers in the Retail trade industry who did not apply for compensation for their serious injury. It should however be noted that since the number of injured workers surveyed in the WRIS is quite small, any breakdown on the numbers is subject to high relative standard errors and information is presented to indicate trends rather than accurate fi gures.
AgeFigure 15 shows that when the data for serious injuries are compared by age, the two datasets showed varying differences in incidence rates by age group. The largest difference in rates was recorded for workers aged 15 to 24 years, indicating that a much larger proportion of these workers did not apply for workers’ compensation. This result is consistent with other reports6 in this series which showed that young people were less likely to apply for compensation even for quite serious injuries.
4 Information on the WRIS adjustment can be found in the report Comparison of compensation data with all incurred work-related injuries
5 ibid6 ibid

10 ... SAFE WORK AUSTRALIA
There is also a considerable difference in the incidence rates for the 45–54 years age group. Further investigation of these data have not been able to suggest possible reasons for this difference. It is therefore concluded that this difference is linked to small sample size of the survey rather than indicating that workers in this age group did not apply for compensation.
Figure 15: Serious work-related injuries in the Retail trade industry: Incidence rates by age and dataset
* the WRIS data have relative standard errors (RSE) between 25% and 50% except for the 55 years and over group which has a RSE greater than 50% and are shown here to indicate trends. These data should be used with caution.
SexWhile the data for all injuries in the Retail trade industry showed that male workers had an incidence rate 11% higher than the rate for female workers, restricting the data to serious injuries shows that male workers had a 25% greater likelihood of a serious injury compared to female workers. Figure 16 shows that male workers recorded 20 serious injuries per 1000 male workers compared to 16 serious injuries per 1000 female workers.
By comparison, the NDS data recorded 11 serious claims per 1000 male employees compared to 7 serious claims per 1000 female employees, indicating a 38% greater risk of injury for male employees over female employees.
Figure 16: Serious work-related injuries in the Retail trade industry: Incidence rates by sex and dataset
0
5
10
15
20
Inju
ries/
clai
ms
per 1
000
wor
kers
/em
ploy
ees
WRIS 5 days or more 20 16
NDS 1 week or more 11 7
Male Female
0
5
10
15
20
25
Age group (years)
Inju
ries/
clai
ms
per 1
000
wor
kers
/em
ploy
ees
WRIS 5 days or more 17 17 14 24 18
NDS 1 week or more 5 10 13 14 12
15-24 25-34 35-44 45-54 55+
RETAIL TRADE... 11
Comparison of these data indicates that male workers had more serious injuries compared to female workers in the Retail trade industry and were more likely to apply for compensation for their injury. This is confi rmed by the WRIS data which showed that less than half of the female workers with serious injuries applied for workers’ compensation compared to nearly three-quarters of male workers.
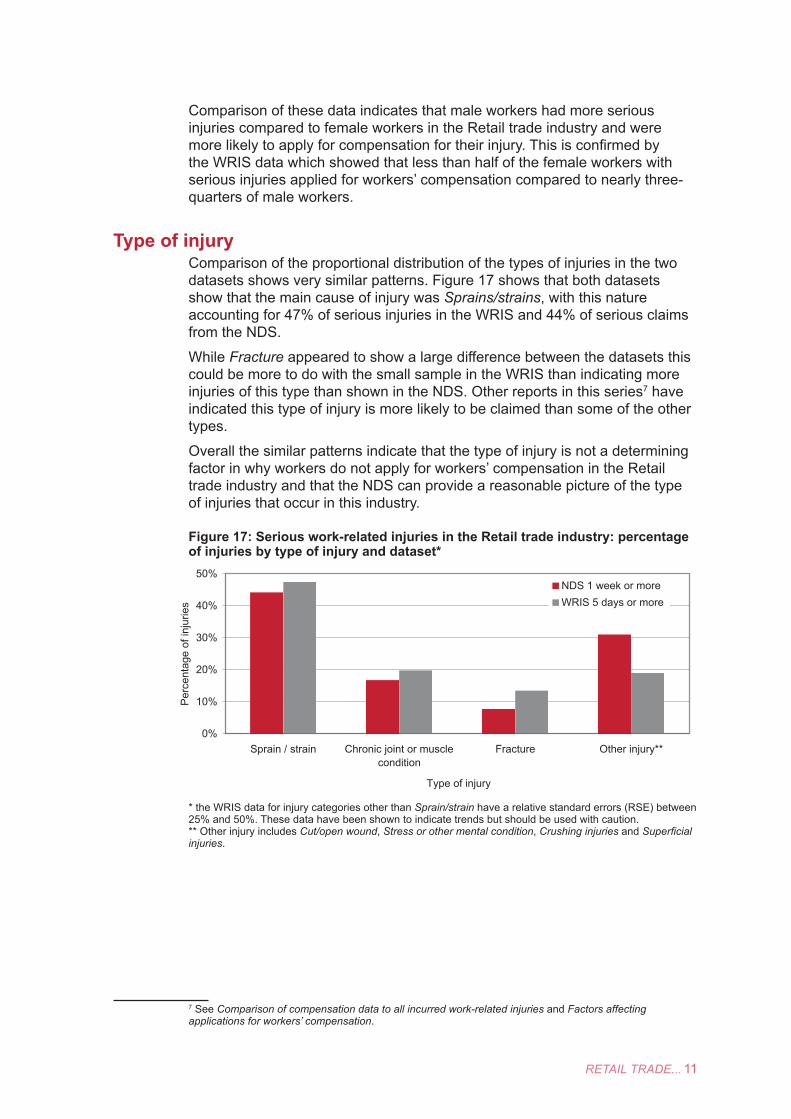
Type of injuryComparison of the proportional distribution of the types of injuries in the two datasets shows very similar patterns. Figure 17 shows that both datasets show that the main cause of injury was Sprains/strains, with this nature accounting for 47% of serious injuries in the WRIS and 44% of serious claims from the NDS.
While Fracture appeared to show a large difference between the datasets this could be more to do with the small sample in the WRIS than indicating more injuries of this type than shown in the NDS. Other reports in this series7 have indicated this type of injury is more likely to be claimed than some of the other types.
Overall the similar patterns indicate that the type of injury is not a determining factor in why workers do not apply for workers’ compensation in the Retail trade industry and that the NDS can provide a reasonable picture of the type of injuries that occur in this industry.
Figure 17: Serious work-related injuries in the Retail trade industry: percentage of injuries by type of injury and dataset*
* the WRIS data for injury categories other than Sprain/strain have a relative standard errors (RSE) between 25% and 50%. These data have been shown to indicate trends but should be used with caution.** Other injury includes Cut/open wound, Stress or other mental condition, Crushing injuries and Superfi cial injuries.
7 See Comparison of compensation data to all incurred work-related injuries and Factors affecting applications for workers’ compensation.
0%
10%
20%
30%
40%
50%
Sprain / strain Chronic joint or musclecondition
Fracture Other injury**
Type of injury
Per
cent
age
of in
jurie
s
NDS 1 week or moreWRIS 5 days or more
12 ... SAFE WORK AUSTRALIA
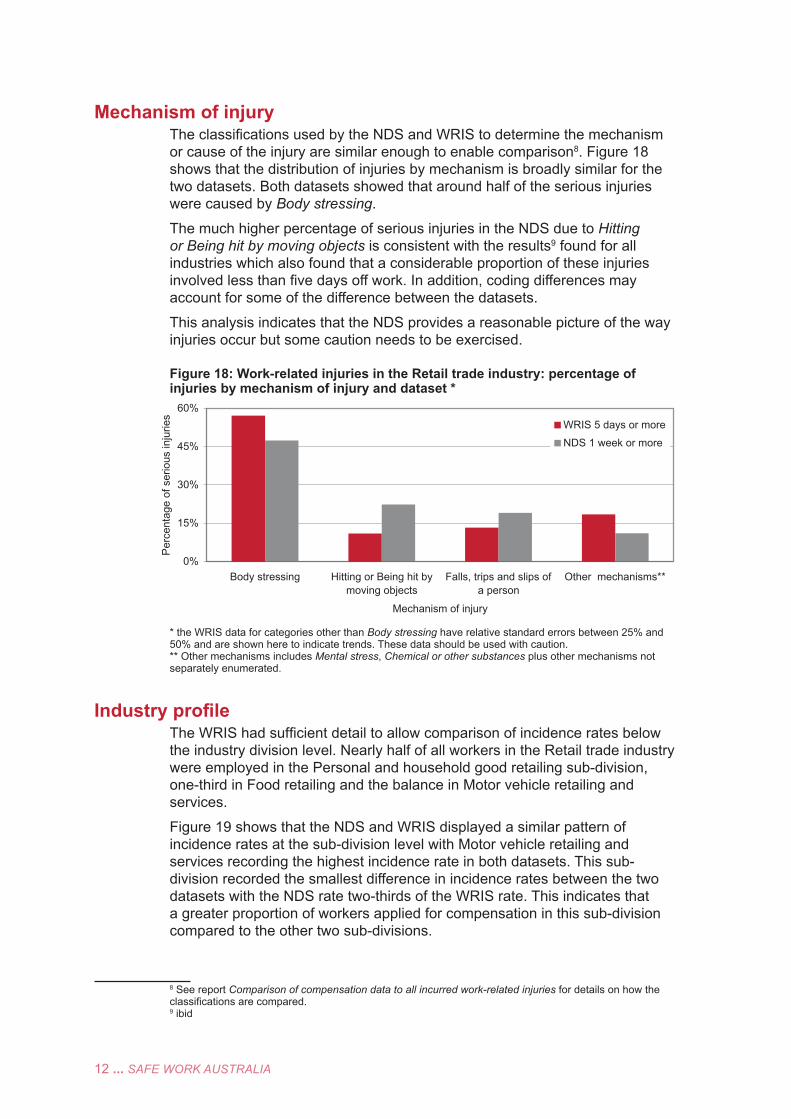
Mechanism of injuryThe classifi cations used by the NDS and WRIS to determine the mechanism or cause of the injury are similar enough to enable comparison8. Figure 18 shows that the distribution of injuries by mechanism is broadly similar for the two datasets. Both datasets showed that around half of the serious injuries were caused by Body stressing.
The much higher percentage of serious injuries in the NDS due to Hitting or Being hit by moving objects is consistent with the results9 found for all industries which also found that a considerable proportion of these injuries involved less than fi ve days off work. In addition, coding differences may account for some of the difference between the datasets.
This analysis indicates that the NDS provides a reasonable picture of the way injuries occur but some caution needs to be exercised.
Figure 18: Work-related injuries in the Retail trade industry: percentage of injuries by mechanism of injury and dataset *
* the WRIS data for categories other than Body stressing have relative standard errors between 25% and 50% and are shown here to indicate trends. These data should be used with caution.** Other mechanisms includes Mental stress, Chemical or other substances plus other mechanisms not separately enumerated.
Industry profi leThe WRIS had suffi cient detail to allow comparison of incidence rates below the industry division level. Nearly half of all workers in the Retail trade industry were employed in the Personal and household good retailing sub-division, one-third in Food retailing and the balance in Motor vehicle retailing and services.
Figure 19 shows that the NDS and WRIS displayed a similar pattern of incidence rates at the sub-division level with Motor vehicle retailing and services recording the highest incidence rate in both datasets. This sub-division recorded the smallest difference in incidence rates between the two datasets with the NDS rate two-thirds of the WRIS rate. This indicates that a greater proportion of workers applied for compensation in this sub-division compared to the other two sub-divisions.
8 See report Comparison of compensation data to all incurred work-related injuries for details on how the classifi cations are compared.9 ibid
0%
15%
30%
45%
60%
Body stressing Hitting or Being hit bymoving objects
Falls, trips and slips ofa person
Other mechanisms**
Mechanism of injury
Per
cent
age
of s
erio
us in
jurie
s
WRIS 5 days or more
NDS 1 week or more

RETAIL TRADE... 13
The greatest difference in incidence rates between the two datasets was recorded by the Personal and household good retailing sub-division where the NDS incidence rate was only 41% of the WRIS rate. This indicates a much lower proportion of workers in this sub-division applied for compensation.
Figure 19: Work-related injuries in the Retail trade industry: incidence rates by industry sub-division*
* the WRIS data have relative standard errors between 25% and 50% and are shown here to indicate trends. These data should be used with caution.
0
7
14
21P
erce
ntag
e of
wor
kers
WRIS 5 days or more 21 17 17
NDS 1 week or more 14 10 7
Motor vehicle retailing and services Food retailing Personal and household
good retailing

14 ... SAFE WORK AUSTRALIA
Application for workers’ compensationThe WRIS shows that of the 109 000 injured workers in the Retail trade industry, 103 700 were employees and were therefore eligible for workers’ compensation. However, only one-third (32%) applied. This is a lower percentage than for all Australian employees (38%). This result is linked to the fact that injuries that involve no time off from work are the least likely to be claimed and 47% of the injuries in the Retail trade industry involved no time off work compared to 42% of injuries incurred by all Australian workers.
Figure 20 shows the number of employees with serious injuries compared to those who applied for workers’ compensation. From these data we can determine which groups of workers did not claim workers’ compensation. While the data have high relative standard errors and should be used as a trend only, they indicate that female part-time workers had a higher rate of application for compensation than all the other groups of workers. Male part-time workers on the other hand, had the lowest application rate, though this conclusion needs to bear in mind the very high relative standard error on this estimate which for most purposes makes this number unusable.
Figure 20: Serious work-related injuries in the Retail trade industry: Number of injured workers and those who applied for workers’ compensation*
* the WRIS data have relative standard errors between 25% and 50% with the exception of the rate for Male part-time workers where the RSE is close to 100%. These data are shown here to indicate trends. These data should be used with caution.
Reasons for not applying for workers’ compensationFigure 21 shows that of the injuries to employees that involved some time lost from work, nearly two in fi ve of the employees who did not apply for workers’ compensation felt that their injury was too minor to claim. In addition, one in fi ve did not think they were eligible for workers’ compensation or were not aware of workers’ compensation. These results are consistent with the data for all industries as is the percentage of workers who felt that making a claim would have a negative impact on their current or future employment.
The Retail trade industry data, however, shows quite a high percentage of injured workers saying that their Employer agreed to pay costs. While the fi gures for the Retail trade and all industries data are subject to high relative standard errors, these data do suggest that employers in the Retail trade
0
3000
6000
9000
Male Female Male Female
Worked full time Worked part time
Num
ber o
f ser
ious
inju
ries
Incurred serious injury
Applied for workers' compensation

RETAIL TRADE... 15
industry are more likely to meet the cost of an injury to their employee than employers in other industries.
Figure 21: Time lost work-related injuries in the Retail trade industry: Percentage of injured employees who did not apply for workers’ compensation by reason*
* the WRIS data for the Retail trade industry has high relative standard errors and are shown here to indicate trends. These data should be used with caution.** Other reasons include Inconvenient/too much effort.
0%
10%
20%
30%
40%
Minor injury/ notnecessary to
claim
Not covered/thought not
eligible
Negative impacton employment
Employeragreed to pay
costs
Other reasons**
Reason did not apply for workers' compensation
Per
cent
age
of ti
me
lost
inju
ries
not c
laim
edRetail tradeAll industries

16 ... SAFE WORK AUSTRALIA
ConclusionThis report has highlighted that young workers in particular are not well represented by the compensation data. These workers typically work part-time. In addition, this analysis has shown that male part-time workers are the least likely to receive workers’ compensation for their serious injury despite the injury requiring them to take fi ve or more days off work.
The data in this analysis showed that one in fi ve injured workers did not apply for workers’ compensation as they were not aware of it. This is particularly concerning since nearly all workers in this industry are employees and hence eligible for workers’ compensation. Employers therefore need to ensure their employees are better informed of their rights to compensation when they have incurred a work-related injury.
Despite the under-reporting by the NDS, analysis of the way in which injuries occurred and types of injuries incurred indicate that the NDS provides a reasonable picture of the characteristics of injuries in the Retail trade industry. Policy makers however, need to be aware that the incidence rates published from NDS data represent only half the true injury rate and that more attention to this industry is warranted.
RETAIL TRADE... 17
Explanatory Notes
Defi nitionsABS Australian Bureau of Statistics
Employees People who work for a public or private employer and receive remuneration, or people who operate their own incorporated enterprise with or without hiring employees
Frequency rate The number of injuries per million hours worked
Full time workers People who worked 35 hours or more a week.
Incidence rate The number of injuries per 1 000 workers
Mechanism of injury The mechanism of injury is the action, exposure or event that was the direct cause of the injury, or how the injury was sustained
NDS National Data Set for Compensation Based Statistics
Type of injury Refers to the type of work-related injury sustained
OMUEs Owner Managers of Unincorporated Enterprise
Part time workers People who worked less than 35 hours a week.
Serious injuries Injuries that resulted in at least fi ve days absence from work
Shiftwork Where working hours are split into at least two set work periods
WRIS ABS Work-related injury survey (ABS Cat. No. 6324.0)
Industry classifi cationThe industry of the worker has been classifi ed in accordance with the Australian and New Zealand Standard Industrial Classifi cation (ANZSIC), 1993 edition (ABS Cat. No.1292.0).
Mechanism of injury classifi cationThe mechanism of injury classifi cation is based on the Type of Occurrence Classifi cations System (TOOCS) used by Safe Work Australia. Refer to Appendix 1 in ABS Cat. No.6324.0 for a detailed breakdown of each mechanism of work-related injury.
Type of injury classifi cationIn the WRIS this variable is referred to as ‘Work-related injury or illness’. This variable’s classifi cation is based on the Nature of injury classifi cation in the Type of Occurrence Classifi cations System (TOOCS) used by Safe Work Australia. Refer to Appendix 1 in ABS Cat. No. 6324.0 for a detailed breakdown of each type of work-related injury.
Relative Standard Errors (RSEs) All data presented in this report conform with the ABS guidelines regarding data quality. Unless otherwise noted, all data presented have RSEs below 25%. Data with RSEs above 50% have not been published. Comprehensive information about RSEs can be found in the ABS Work- related injuries publication (ABS Cat. 6324.0)

InquiresFor further information regarding the contents of this publication contact:
The Data & Analysis SectionSafe Work Australia(02) 6121 9115


