i SOUTH AFRICAN QUALIFICATIONS AUTHORITY WORK-RELATED QUALIFICATIONS AND PART QUALIFICATIONS REGISTERED ON THE NQF: TRENDS 2002 TO 2011 Analysis of the National Learners’ Records Database Report 3
Transcript
i
SOUTH AFRICAN QUALIFICATIONS AUTHORITY
WORK-RELATED QUALIFICATIONS
AND PART QUALIFICATIONS
REGISTERED ON THE NQF:
TRENDS 2002 TO 2011
Analysis of the National Learners’ Records Database
Report 3
1
INTRODUCTION
“What’s my level?”
“Please can you count my credits?”
These are the questions most frequently asked by the people who contact SAQA to find out
whether their records of learning appear on the National Learners’ Records Database (NLRD).
Each qualification registered on the National Qualifications Framework (NQF) does have an
NQF Level and a minimum number of credits that are required in order to achieve the
qualification (with one credit being equal to ten notional hours of learning). However, a person
does not have a level, and one cannot count credits (achieved via various part-qualifications
including unit standards), in order to manufacture a qualification achievement out of these.
Rather, the NLRD – as the repository of the records of learning of all South African institutions
– is the source of transcripts of each person’s achievements of qualifications and part-
qualifications, and also of aggregated analyses of these achievements.
There are twelve Organising Fields on the NQF, from Agriculture to Physical Planning and
Construction: this analysis covers each field separately, as well as the aggregation of all of
them. There are currently ten NQF Levels: this changed from eight levels in 2009, when the
NQF Act of 2008 was promulgated. Because all but three of the years in this analysis fall in
the period of the Pre-2009 NQF Levels, these are the ones referred to, throughout.
Furthermore, all qualifications and unit standards that had been on NQF Levels 1 to 4 before
the changeover, remained at their same levels on the ten-level framework. Approximately
80% of the qualifications, plus 83% of the qualification achievements, plus 80% of the unit
standards that make up this analysis are at Levels 1 to 4: these NQF Levels are thus
substantially in the majority. (When the NQF Levels for 2009 onwards have been in operation
for long enough, future publications will refer to them.)
This publication is the third of its kind. The first two analyses of the NLRD data focused on the
achievements of learners in the Public Higher Education System. The qualifications and unit
standards included in this analysis fall under the former Education and Training Quality
Assurance bodies (ETQAs), now referred to as quality assuring bodies. The achievements
included herein do not fall under the Council on Higher Education (CHE), thus excluding all
2
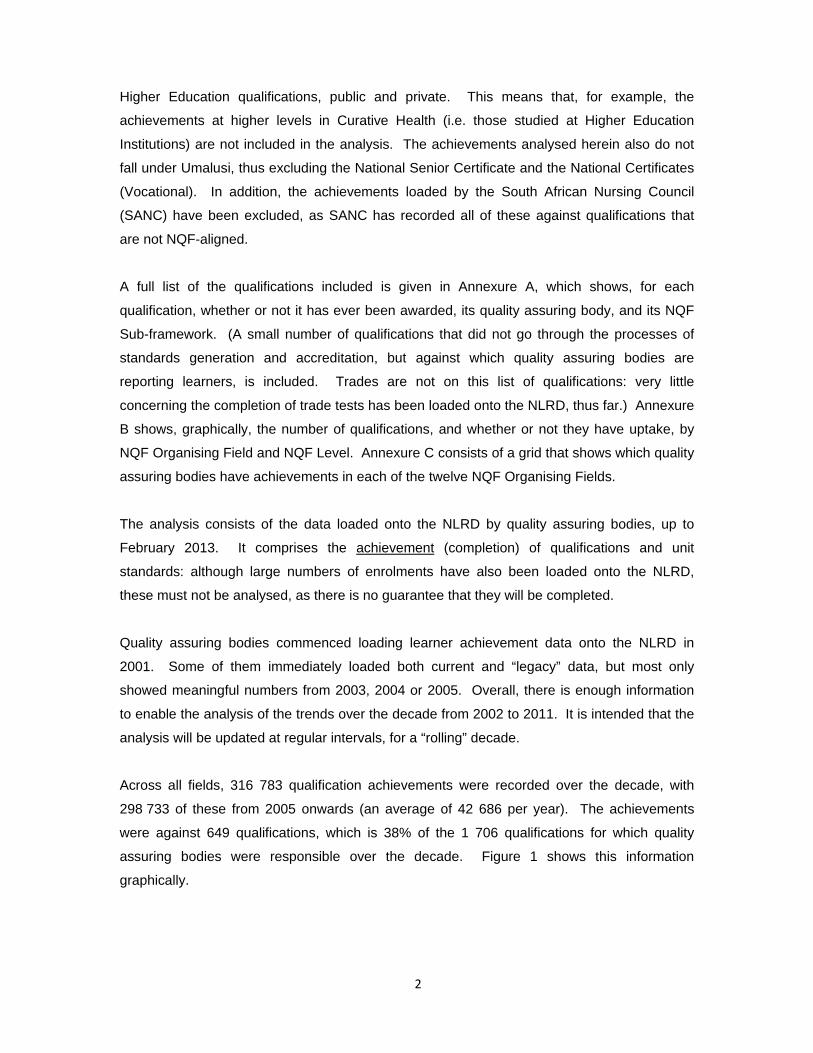
Higher Education qualifications, public and private. This means that, for example, the
achievements at higher levels in Curative Health (i.e. those studied at Higher Education
Institutions) are not included in the analysis. The achievements analysed herein also do not
fall under Umalusi, thus excluding the National Senior Certificate and the National Certificates
(Vocational). In addition, the achievements loaded by the South African Nursing Council
(SANC) have been excluded, as SANC has recorded all of these against qualifications that
are not NQF-aligned.
A full list of the qualifications included is given in Annexure A, which shows, for each
qualification, whether or not it has ever been awarded, its quality assuring body, and its NQF
Sub-framework. (A small number of qualifications that did not go through the processes of
standards generation and accreditation, but against which quality assuring bodies are
reporting learners, is included. Trades are not on this list of qualifications: very little
concerning the completion of trade tests has been loaded onto the NLRD, thus far.) Annexure
B shows, graphically, the number of qualifications, and whether or not they have uptake, by
NQF Organising Field and NQF Level. Annexure C consists of a grid that shows which quality
assuring bodies have achievements in each of the twelve NQF Organising Fields.
The analysis consists of the data loaded onto the NLRD by quality assuring bodies, up to
February 2013. It comprises the achievement (completion) of qualifications and unit
standards: although large numbers of enrolments have also been loaded onto the NLRD,
these must not be analysed, as there is no guarantee that they will be completed.
Quality assuring bodies commenced loading learner achievement data onto the NLRD in
2001. Some of them immediately loaded both current and “legacy” data, but most only
showed meaningful numbers from 2003, 2004 or 2005. Overall, there is enough information
to enable the analysis of the trends over the decade from 2002 to 2011. It is intended that the
analysis will be updated at regular intervals, for a “rolling” decade.
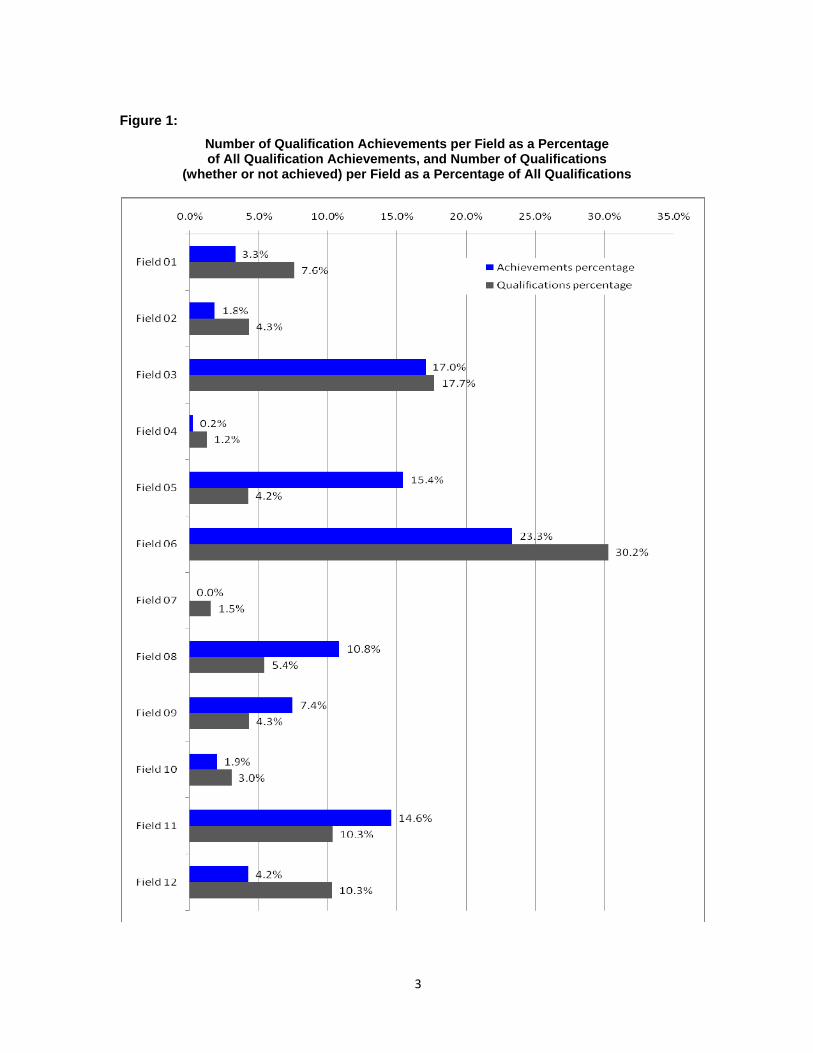
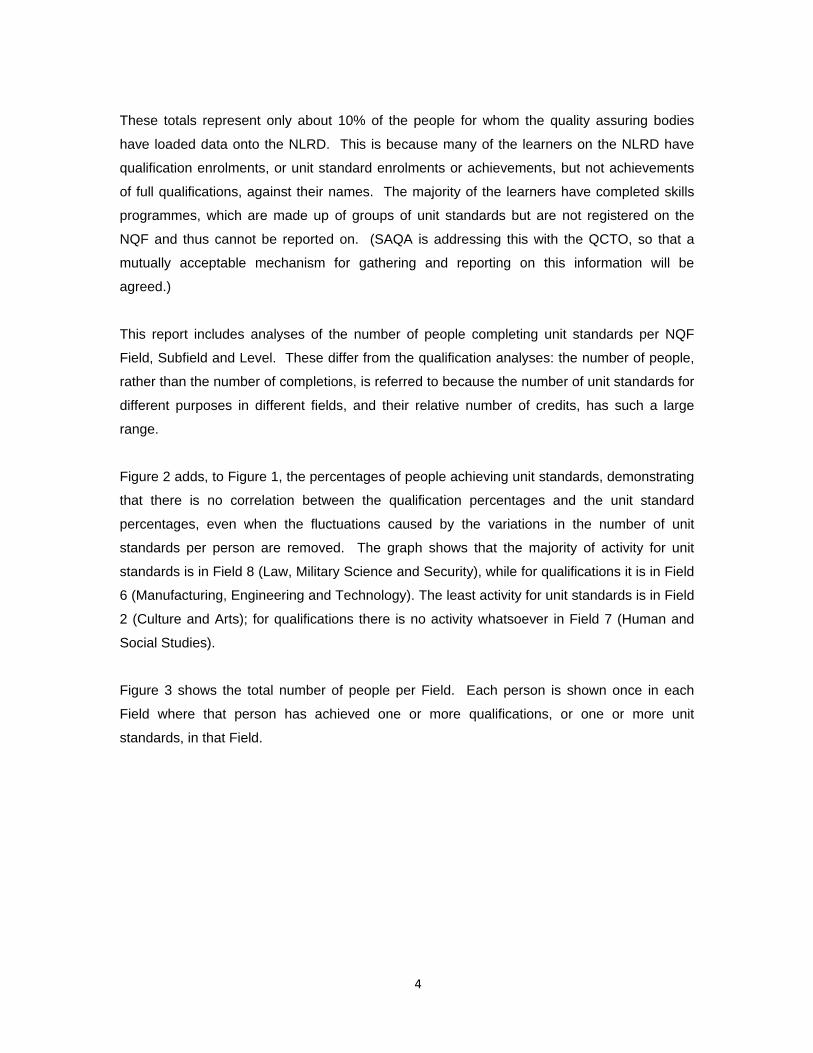
Across all fields, 316 783 qualification achievements were recorded over the decade, with
298 733 of these from 2005 onwards (an average of 42 686 per year). The achievements
were against 649 qualifications, which is 38% of the 1 706 qualifications for which quality
assuring bodies were responsible over the decade. Figure 1 shows this information
graphically.
3
Figure 1:
Number of Qualification Achievements per Field as a Percentage of All Qualification Achievements, and Number of Qualifications
(whether or not achieved) per Field as a Percentage of All Qualifications
4
These totals represent only about 10% of the people for whom the quality assuring bodies
have loaded data onto the NLRD. This is because many of the learners on the NLRD have
qualification enrolments, or unit standard enrolments or achievements, but not achievements
of full qualifications, against their names. The majority of the learners have completed skills
programmes, which are made up of groups of unit standards but are not registered on the
NQF and thus cannot be reported on. (SAQA is addressing this with the QCTO, so that a
mutually acceptable mechanism for gathering and reporting on this information will be
agreed.)
This report includes analyses of the number of people completing unit standards per NQF
Field, Subfield and Level. These differ from the qualification analyses: the number of people,
rather than the number of completions, is referred to because the number of unit standards for
different purposes in different fields, and their relative number of credits, has such a large
range.
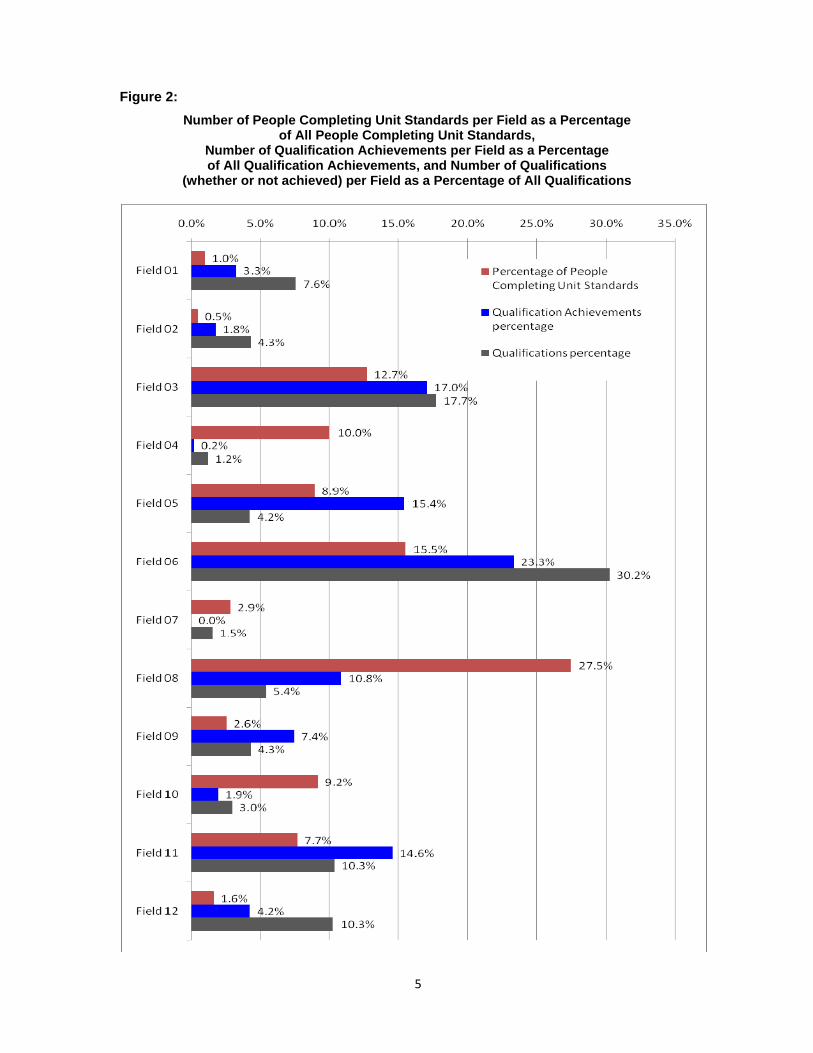
Figure 2 adds, to Figure 1, the percentages of people achieving unit standards, demonstrating
that there is no correlation between the qualification percentages and the unit standard
percentages, even when the fluctuations caused by the variations in the number of unit
standards per person are removed. The graph shows that the majority of activity for unit
standards is in Field 8 (Law, Military Science and Security), while for qualifications it is in Field
6 (Manufacturing, Engineering and Technology). The least activity for unit standards is in Field
2 (Culture and Arts); for qualifications there is no activity whatsoever in Field 7 (Human and
Social Studies).
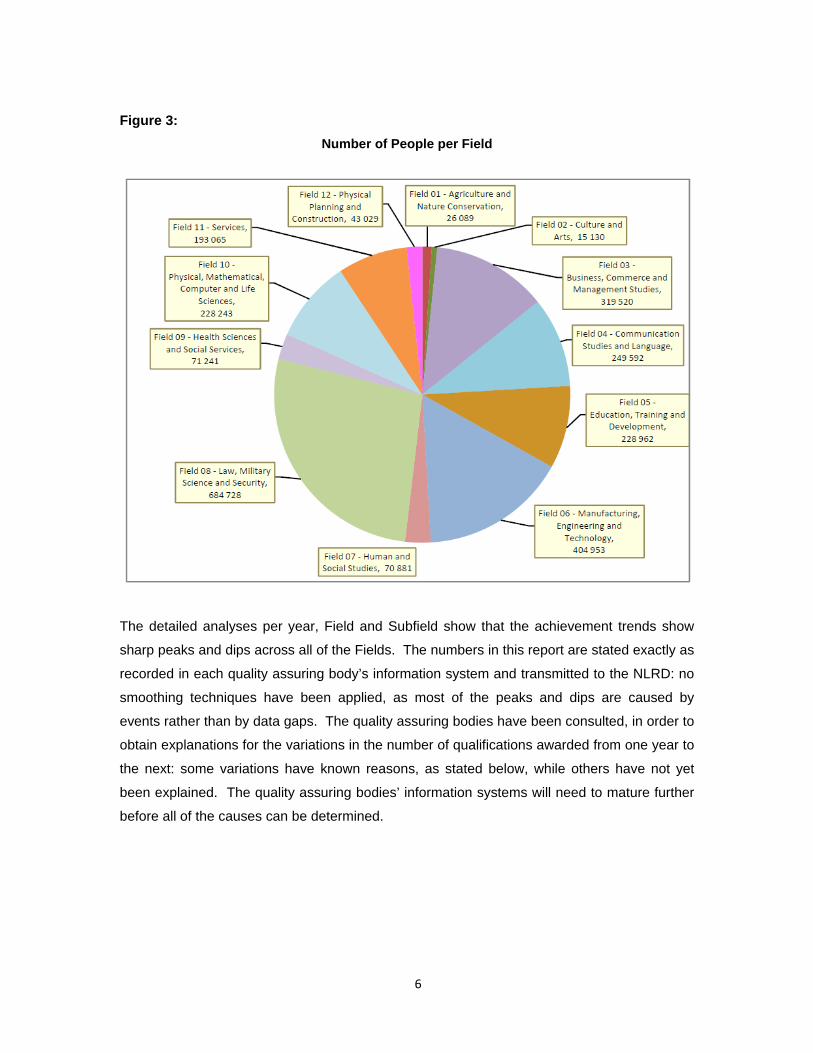
Figure 3 shows the total number of people per Field. Each person is shown once in each
Field where that person has achieved one or more qualifications, or one or more unit
standards, in that Field.
5
Figure 2: Number of People Completing Unit Standards per Field as a Percentage
of All People Completing Unit Standards, Number of Qualification Achievements per Field as a Percentage of All Qualification Achievements, and Number of Qualifications
(whether or not achieved) per Field as a Percentage of All Qualifications
6
Figure 3: Number of People per Field
The detailed analyses per year, Field and Subfield show that the achievement trends show
sharp peaks and dips across all of the Fields. The numbers in this report are stated exactly as
recorded in each quality assuring body’s information system and transmitted to the NLRD: no
smoothing techniques have been applied, as most of the peaks and dips are caused by
events rather than by data gaps. The quality assuring bodies have been consulted, in order to
obtain explanations for the variations in the number of qualifications awarded from one year to
the next: some variations have known reasons, as stated below, while others have not yet
been explained. The quality assuring bodies’ information systems will need to mature further
before all of the causes can be determined.
7
It has also been found that some quality assuring bodies are still submitting Learnership
achievements without submitting the related qualification achievement records. (It is a
requirement that both must be submitted, for accurate cross-checking.) At present, this is
causing the qualification achievements to be understated by approximately 10 000 (3% of the
total number of qualification achievements). The quality assuring bodies concerned have
been asked to correct this in order to load correctly in the future.
Thanks to the nature of the gathering of learner information, it is expected that the number of
recorded achievements shown even for previous years will increase in subsequent reports,
whenever retrospective information is received from some of the providers that the quality
assuring bodies have accredited to offer the qualifications for which they are responsible (and
even after the Learnership issue has been corrected). This is illustrated in Annexure E, which
shows that the data loaded in January-February 2013 has additional records for every year
from 2002 to 2011, especially from 2006 onwards. However, every field – except Fields 8 and
10 – shows a marked decrease for 2011. The quality assuring bodies were asked to comment
on whether this reflects a true downturn, or whether further records are still expected: they
observed that the downturn coincided with the introduction of the new National Skills
Development Strategy (NSDS). Furthermore, several SETAs were placed under
administration at that time, which could have affected their performance.
Future analyses will include a wide range of information, including the number of people with
professional designations and, as mentioned in the preceding pages, the achievement of part-
qualifications such as skills programmes.
All FieldsAll Fields
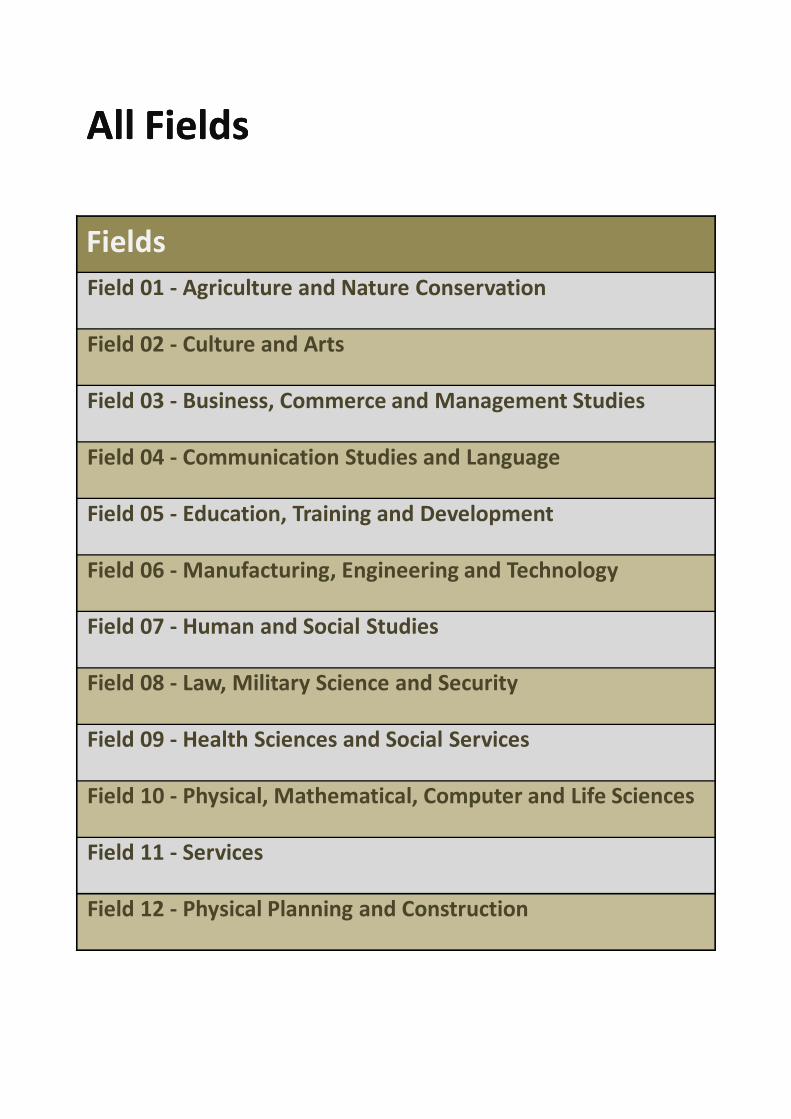
Fields
Field 01 - Agriculture and Nature Conservation
Field 02 - Culture and Arts
Field 03 - Business, Commerce and Management Studies
Field 04 - Communication Studies and Language
Field 05 - Education, Training and Development
Field 06 - Manufacturing, Engineering and Technology
Field 07 - Human and Social Studies
Field 08 - Law, Military Science and Security
Field 09 - Health Sciences and Social Services
Field 10 - Physical, Mathematical, Computer and Life Sciences
Field 11 - Services
Field 12 - Physical Planning and Construction
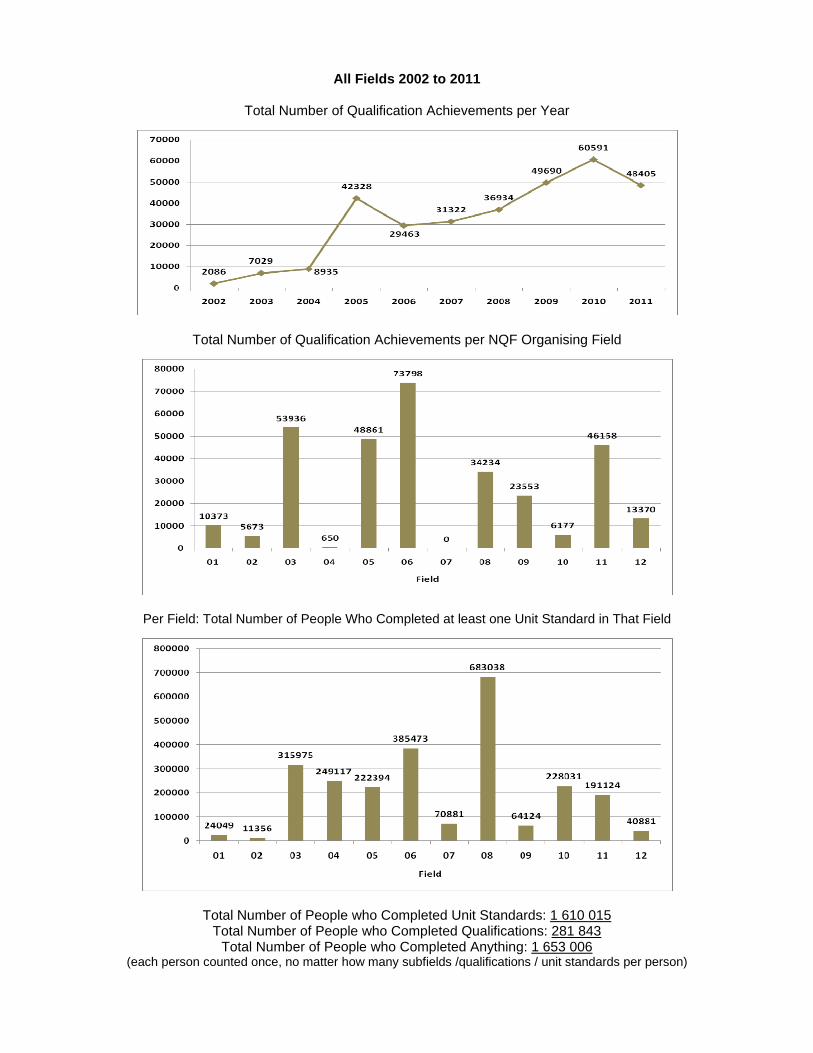
All Fields 2002 to 2011
Total Number of Qualification Achievements per Year
Total Number of Qualification Achievements per NQF Organising Field
Per Field: Total Number of People Who Completed at least one Unit Standard in That Field
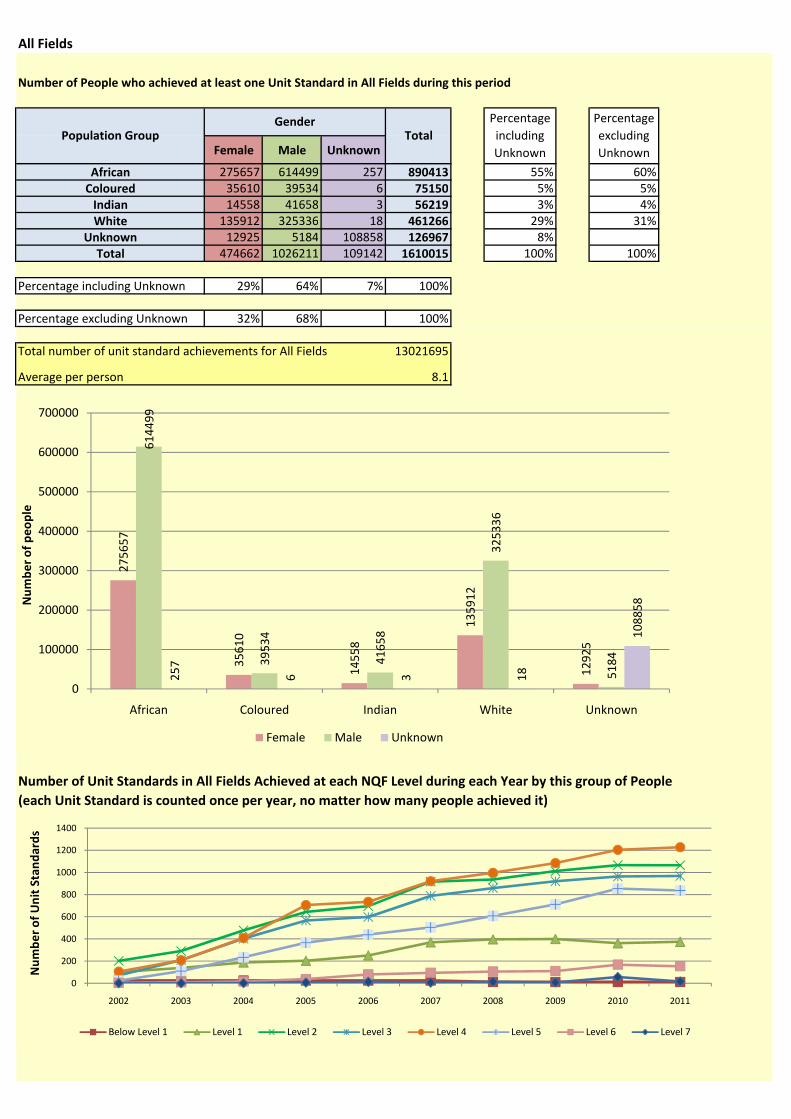
Total Number of People who Completed Unit Standards: 1 610 015 Total Number of People who Completed Qualifications: 281 843
Total Number of People who Completed Anything: 1 653 006 (each person counted once, no matter how many subfields /qualifications / unit standards per person)
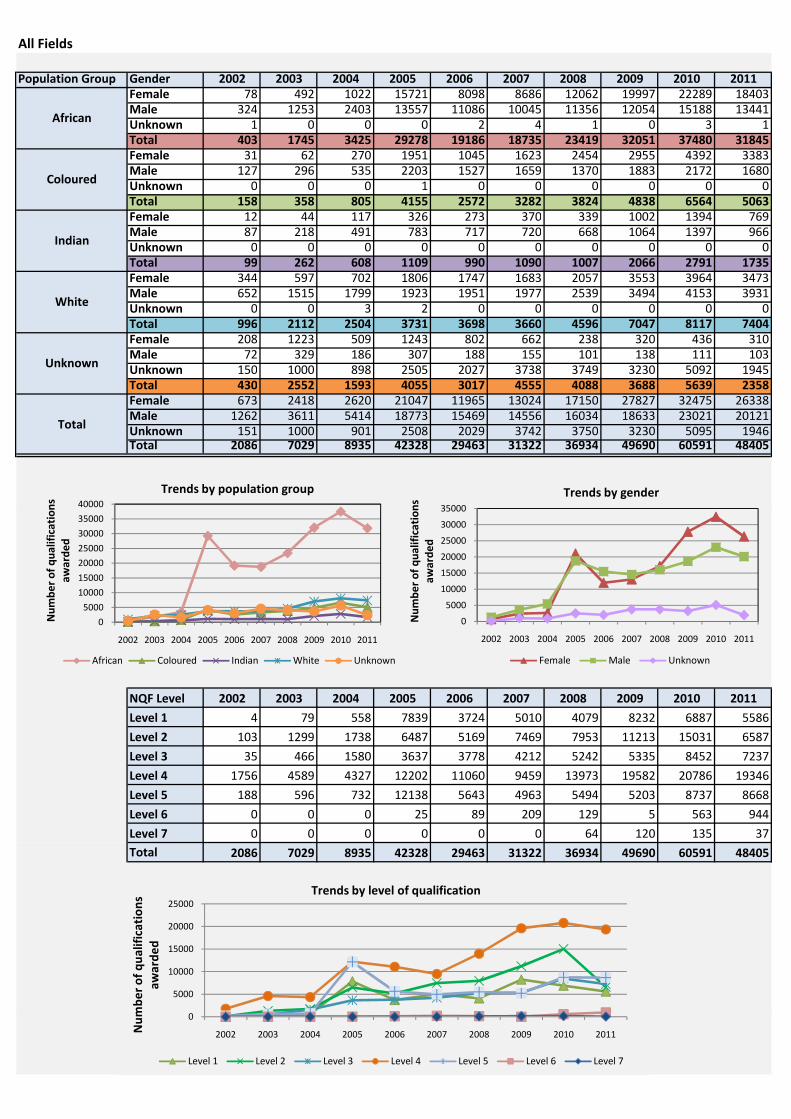
All Fields Fields 6 and 11 were the earliest to show meaningful figures on the NLRD, in 2003, with 2 313 and 3 618 qualification achievements respectively. From 2005, Fields 5, 6, 8 and 11 showed substantial numbers, ranging from 10 454 down to 7 307. The average annual growth rate, from 2003 to 2011, was 54%. The achievements were against 649 qualifications, which is 38% of the 1 706 qualifications for which quality assuring bodies were responsible over the decade. A total of 1 610 015 people each achieved at least one unit standard in the same period; these achievements were against 6 256 unit standards. The total number of unit standard completions was 13 021 695, which amounts to an average of 8.1 unit standards per person. Overall, the number of people included in this analysis, each with one or more qualification or unit standard, is 1 653 006. Most of the qualifications and unit standards were awarded at NQF Level 4: the number of qualification achievements for this level rose steadily from 1 756 in 2002 to 19 346 in 2011, with a peak of 20 786 in 2010. NQF Level 2 followed, increasing from 103 qualification achievements in 2002 to 6 587 in 2011, with a peak of 15 031 in 2010. Wherever known, the explanations for peaks and dips are stated in the introductions to the relevant fields. Until 2003, most of the learners with qualification achievements were recorded as white or with unknown population group, and male. Thereafter, with more substantial numbers present, the ongoing trends for the decade were established: African people were consistently in the majority, followed by white people, and women slightly outnumbered men.
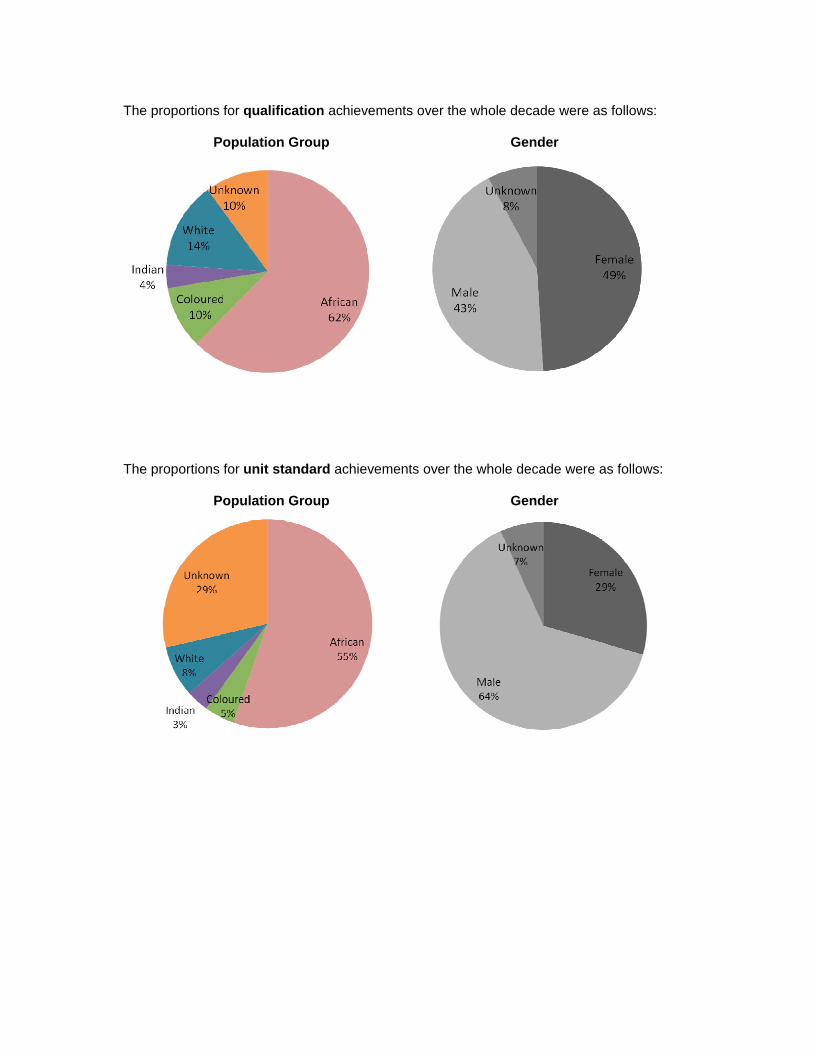
The proportions for qualification achievements over the whole decade were as follows: Population Group Gender
The proportions for unit standard achievements over the whole decade were as follows: Population Group Gender
All Fields
Population Group Gender 2002 2003 2004 2005 2006 2007 2008 2009 2010 2011