Work Session I.J. 61 STATE BOARD FOR COMMUNITY COLLEGES AND OCCUPATIONAL EDUCATION May 11, 2011 TOPIC: Salary Survey Discussion PRESENTED BY: Barbara McDonnell, Executive Vice President RELATIONSHIP TO THE STRATEGIC PLAN: Operational Excellence Goal: The financial stability of the system’s institutions and the physical safety of its students shall be ensured EXPLANATION: The Board requested information on salary comparisons for CCCS personnel. Based on national, regional, and Colorado salary and benefit comparisons for CCCS faculty, administrators and professional/technical staff, CCCS human resources staff prepared a report that outlines key areas of concern, provides some preliminary recommendations regarding salary adjustments, and calculates the potential cost of implementing these recommendations. That report is attached. During the comparison process, two primary areas of concern around salaries within CCCS stood out: average full-time faculty salaries; and average salaries of deans. Consideration of any changes to compensation would be clearer after information on Fall 2011 enrollment is known. RECOMMENDATION: CCCS staff have identified the following options for the Board’s consideration: Maintain the status quo. Implement cost of living increases for all CCCS exempt employees plus: o Develop a 5-year plan to close the gap between CCCS average salaries and national average salaries; or o Develop a 10-year plan to close the salary gaps. Consider a one-time 1% or 2% incentive payment after Fall 2011 enrollments are known.
Transcript
Work Session I.J.
61
STATE BOARD FOR COMMUNITY COLLEGES AND OCCUPATIONAL EDUCATION
May 11, 2011
TOPIC: Salary Survey Discussion PRESENTED BY: Barbara McDonnell, Executive Vice President
RELATIONSHIP TO THE STRATEGIC PLAN: Operational Excellence Goal: The financial stability of the system’s institutions and the physical safety of its students shall be ensured EXPLANATION: The Board requested information on salary comparisons for CCCS personnel. Based on national, regional, and Colorado salary and benefit comparisons for CCCS faculty, administrators and professional/technical staff, CCCS human resources staff prepared a report that outlines key areas of concern, provides some preliminary recommendations regarding salary adjustments, and calculates the potential cost of implementing these recommendations. That report is attached.
During the comparison process, two primary areas of concern around salaries within CCCS stood out: average full-time faculty salaries; and average salaries of deans. Consideration of any changes to compensation would be clearer after information on Fall 2011 enrollment is known. RECOMMENDATION: CCCS staff have identified the following options for the Board’s consideration: Maintain the status quo. Implement cost of living increases for all CCCS exempt employees
plus: o Develop a 5-year plan to close the gap between CCCS average
salaries and national average salaries; or o Develop a 10-year plan to close the salary gaps.
Consider a one-time 1% or 2% incentive payment after Fall 2011 enrollments are known.
Work Session I.J.
62
ATTACHMENTS:
Faculty, Administrator and Professional/Technical Salary and Benefits Comparison Report on Adjunct Instructor Pay
Attachment: Salary and Benefits Comparison Work Session I.J.
63
To: State Board for Community Colleges and Occupational Education From: Cynthia Hier CCCS Executive Director, Human Resources Date: April 29, 2011 Re: Faculty, Administrator and Professional/Technical Salary and Benefits Comparison One year ago, the board requested information on salary comparisons for CCCS personnel. Based on the results of a national, regional, and Colorado salary and benefit comparisons for CCCS faculty, administrator and professional/technical staff, this report outlines the key areas of concern, provides some preliminary recommendations regarding salary adjustments, and calculates the potential cost of implementing these recommendations. In addition, the report provides comparisons of medical, dental, life, and leave benefits. Of course, the timing of implementing these recommendations will be dependent upon the state budget and the timing of the return of salary increases for state government. Key Areas of Concern During our comparison process, two primary areas of concern around salaries within CCCS stood out: average full-time faculty salaries; and average salaries of deans.
Attachment: Salary and Benefits Comparison Work Session I.J.
64
FULL-TIME FACULTY
Average full-time faculty salaries vary across the CCCS institutions based on location, years of service, and full-time faculty reliance. Table 1 outlines these average salaries for each of our colleges. For the system as a whole, the weighted CCCS average full-time (9-month) faculty salary was $46,618 in FY 2009-10. A summary of each college’s faculty pay plan can be found in the Appendix.
Table 1 CCCS Full-Time Average Faculty Salaries by College
FY 2009-10
Average FT (9-month)
Faculty Salary
Average Faculty
Salary w/ Overloads
FT Faculty Average Years of Service
FT
Faculty Head- count
Percent of Credits
Taught by FT Faculty (Fall 2009)
Percent of Credits
Taught by Adjunct Faculty
(Fall 2009)
Arapahoe Community College $ 45,181 $ 47,723 7
101
44.32%
55.68%
Community College of Aurora $ 49,151 $ 49,928 5
44
20.84%
79.16%
Community College of Denver $ 46,603 $ 49,352 8
94
29.97%
70.03%
Colorado Northwestern Community College $ 47,054 $ 47,801
5
36
55.26%
44.74%
Front Range Community College $ 49,750 $ 52,024
7
209
28.69%
71.31%
Lamar Community College $ 36,389 $ 36,629 6
20
69.34%
30.66%
Morgan Community College $ 50,238 $ 51,390 8
34
45.19%
54.81%
Northeastern Junior College $ 45,592 $ 45,698 9
53
70.44%
29.56%
Otero Junior College $ 42,878 $ 44,015 6
34
78.94%
21.06%
Pueblo Community College $ 47,128 $ 50,144 8
103
37.38%
62.62%
Pikes Peak Community College $ 43,858 $ 46,793 7
172
41.31%
64.82%
Red Rocks Community College $ 49,065 $ 51,924 7
80
35.18%
64.82%
Trinidad State Junior College $ 41,545 $ 42,931 9
55
72.76%
27.24%
Weighted FT Faculty Average $ 46,618
Full-Time Faculty/Instructor
Percentage
39.5%
60.5%
Attachment: Salary and Benefits Comparison Work Session I.J.
65
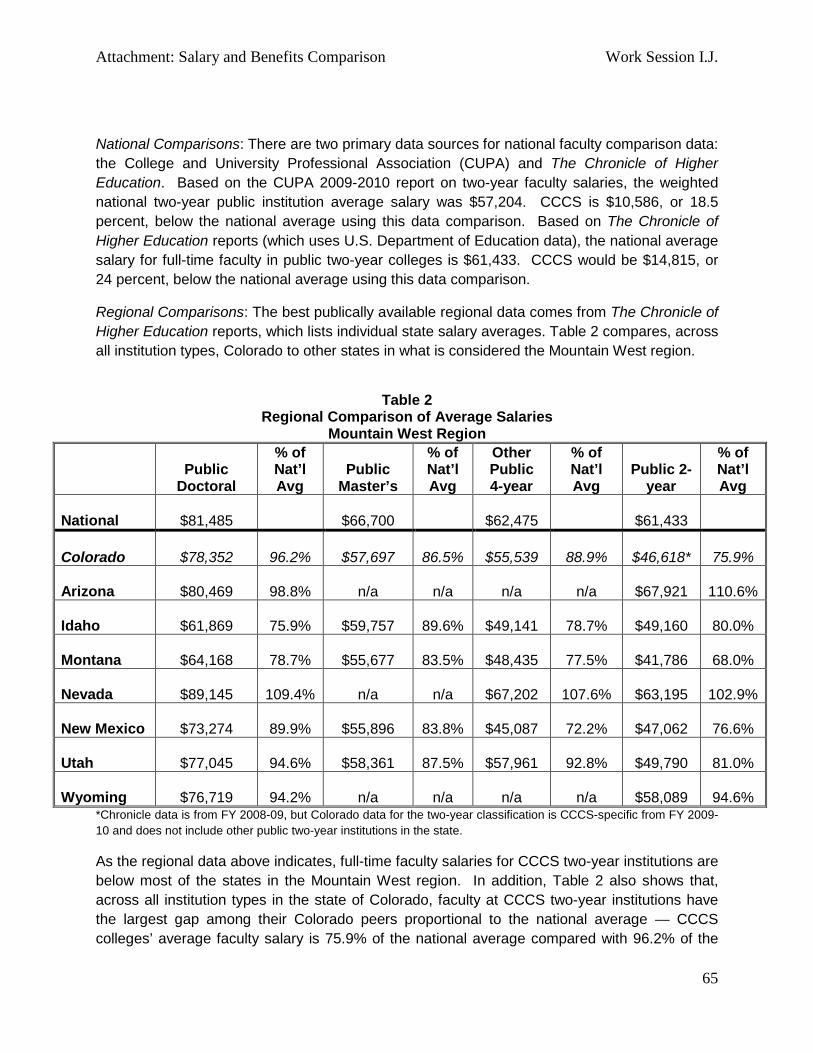
National Comparisons: There are two primary data sources for national faculty comparison data: the College and University Professional Association (CUPA) and The Chronicle of Higher Education. Based on the CUPA 2009-2010 report on two-year faculty salaries, the weighted national two-year public institution average salary was $57,204. CCCS is $10,586, or 18.5 percent, below the national average using this data comparison. Based on The Chronicle of Higher Education reports (which uses U.S. Department of Education data), the national average salary for full-time faculty in public two-year colleges is $61,433. CCCS would be $14,815, or 24 percent, below the national average using this data comparison.
Regional Comparisons: The best publically available regional data comes from The Chronicle of Higher Education reports, which lists individual state salary averages. Table 2 compares, across all institution types, Colorado to other states in what is considered the Mountain West region.
Table 2
Regional Comparison of Average Salaries Mountain West Region
Public
Doctoral
% of Nat’l Avg
Public Master’s
% of Nat’l Avg
Other Public 4-year
% of Nat’l Avg
Public 2-
year
% of Nat’l Avg
National
$81,485 $66,700
$62,475 $61,433
Colorado
$78,352 96.2%
$57,697 86.5%
$55,539 88.9%
$46,618* 75.9%
Arizona
$80,469 98.8%
n/a n/a
n/a n/a
$67,921 110.6%
Idaho
$61,869 75.9%
$59,757 89.6%
$49,141 78.7%
$49,160 80.0%
Montana
$64,168 78.7%
$55,677 83.5%
$48,435 77.5%
$41,786 68.0%
Nevada
$89,145 109.4%
n/a n/a
$67,202 107.6%
$63,195 102.9%
New Mexico
$73,274 89.9%
$55,896 83.8%
$45,087 72.2%
$47,062 76.6%
Utah
$77,045 94.6%
$58,361 87.5%
$57,961 92.8%
$49,790 81.0%
Wyoming
$76,719 94.2%
n/a n/a
n/a n/a
$58,089 94.6% *Chronicle data is from FY 2008-09, but Colorado data for the two-year classification is CCCS-specific from FY 2009-10 and does not include other public two-year institutions in the state.
As the regional data above indicates, full-time faculty salaries for CCCS two-year institutions are below most of the states in the Mountain West region. In addition, Table 2 also shows that, across all institution types in the state of Colorado, faculty at CCCS two-year institutions have the largest gap among their Colorado peers proportional to the national average — CCCS colleges’ average faculty salary is 75.9% of the national average compared with 96.2% of the
Attachment: Salary and Benefits Comparison Work Session I.J.
66
national average for public research universities, 86.5% for public colleges that offer Master’s Degrees, and 88.9% for other 4-year institutions. Colorado Comparisons: There are two public two-year institutions outside of the CCCS with which to compare CCCS colleges: AIMS Community College (AIMS) and Colorado Mountain College (CMC), both of which are funded predominately with local mill levy funding. AIMS Community College average FY 2009-10 full-time (9 month) faculty salary was $51,301, which is $4,683 higher than the CCCS average faculty salary. The data available from CMC is tiered by faculty education level, which CCCS has begun tracking only recently. As a result, we do not have enough data to directly compare with CMC based on faculty education attainment level. However, the average salary for faculty at CMC who have a Bachelor’s degree was $65,413; a Master’s degree was $72,153; and a Doctorate was $77,721—all significantly higher than the CCCS average of $46,618. In addition to public two-year institutions, we sampled full-time faculty salaries at several four-year Colorado institutions. The average full-time faculty salary at Adams State College was $52,506; at Western State College was $57,000; at University of Northern Colorado was $59,008; and at Colorado State University was $73,759. The University of Colorado reports their average faculty salaries by rank, with an assistant professor at $75,207; an associate professor at $88,769; and a full professor at $121,904. Again, all faculty at these institutions have significantly higher salaries than CCCS faculty.
ADMINISTRATOR AND PROFESSIONAL/TECHNICAL STAFF Overall groupings of administrator and professional/technical staff can include a broad range of professional fields, ranging from information technology to accounting to deans to executive management staff. Sometimes, similar positions are coded differently in the banner system depending on where they report in the college. As a result, all of the administrator and professional/technical groups were combined into a single set of data for purposes of this analysis. Table 3 shows the combined average salaries for administrator and professional/technical positions for the CCCS colleges, with the average for all colleges across all groupings at $49,891.
Table 3 Average Administrator and Professional/Technical Salaries by College
FY 2009-10
Administrator & Professional/Technical
Average Salary Arapahoe Community College $53,264 Community College of Aurora $52,334 Community College of Denver $50,934 Colorado Northwestern Community College $46,280 Front Range Community College $53,275 Lamar Community College $40,664 Morgan Community College $45,556 Northeastern Junior College $48,211
Attachment: Salary and Benefits Comparison Work Session I.J.
67
Otero Junior College $53,009 Pueblo Community College $50,064 Pikes Peak Community College $55,844 Red Rocks Community College $46,723 Trinidad State Junior College $40,732 CCCS Overall $49,891
Table 4 shows the various position classes within CCCS, their associated grouping, and the range of salaries within each position class that exist within the system.
Table 4 CCCS Position Class Descriptions with Salary Data
FY 2009-10
Position Class Group
CCCS Average Salary CCCS Salary Range Class Responsibilities
Min Max Dean Administrative $ 74,959 $55,000 $ 99,457 College Dean (Academic or Administrative)
Director III Administrative $ 86,703 $50,000 $125,750
Head of an Administrative Unit responsible for multi-faceted programs/departments through management of subordinate unit managers, supervisors or work leads. Unit is highly complex in nature. Position has extensive scope of authority which may impact entire college or system. Position works under broad administrative direction of Dean, Vice President or President, and broad organizational priorities govern actions/decisions. Position has both internal/external complexity and contact with representatives and officials to whom access is somewhat limited or difficult.
Director II Administrative $ 65,964 $35,000 $100,194
Head of a department, responsible for administering staffing, operations and budget, which has varied and distinct components and several subordinate positions. Scope of authority is typically limited to the college or system office. Position works under general administrative direction and generally defined mission/goals of Director III, Dean, Vice President or President. Decisions generally have legal or fiscal impact for the agency. Position has both internal/external contact with individuals/groups where situations may not be structured, but to whom access is reasonably open.
Director I/ Manager
Professional/ Technical $ 54,394 $25,000 $ 93,870
Head of a program which is typically singular in focus, objective or scope; includes budget oversight and may or may not be a supervisor. Position may be specialized in a particular field, requiring a high level of technical training and as a result may serve as a resource to others within the college. Contacts are generally internal in nature and situations may be unstructured, but access to contacts is reasonably open. Handles a variety of issues, which require independent judgment and discretion within published rules and procedures and under specific administrative direction. Position typically reports to a higher level Director, Dean or Vice President.
Attachment: Salary and Benefits Comparison Work Session I.J.
68
National Comparisons: The best national comparison data available is the CUPA Administrative Compensation Survey for 2009–10. CUPA collects salary and demographic data at colleges and universities based on those positions that are found at most higher education institutions. The salaries by position are reported on a national-level further broken down by affiliation, budget size, enrollment and 2005 Carnegie classification. For the purposes of this comparison, CUPA’s median salary data per position for institutions providing associate’s degree was utilized.
To compare CCCS data to the CUPA report, CCCS’s position class definitions were reviewed against the CUPA position groupings for similarities. Reviewing the two, an overall comparison can be made with the vice president, dean, and director level (CCCS Director I, II and III combined) groupings. Table 5 shows the difference between CCCS and CUPA average salaries for these groupings. Please note that the CCCS average salaries represent weighted averages where the CUPA average salaries are not weighted, due to how the data was reported.
Table 5 CUPA Compared to CCCS Average Salaries for Select Class Definition Groupings
Area of responsibility is singular and/or position is specialized in particular field of training. Responsibilities are mostly operational, but require independent decision-making in analyzing conditions of situation and applying most appropriate rules, regulations and procedures. Decision impact is programmatic. Non - Supervisory or supervises 3 or less staff. Position may or may not have budget oversight. Contact with others is often to advise, counsel or influence decisions or change in people.
Position Class Group
CCCS Average Salary CCCS Salary Range Class Responsibilities
Area of responsibility is singular and position is specialized in particular occupational field. Responsibilities are typically operational and systematic. Assignments are defined and position typically follows established work process and procedures. Typically this is a non-supervisory position.
Para Professional
Professional/ Technical $ 35,618 $19,872 $ 65,000
Area of responsibility is specific to training and/or experience of individual in position. This is a wide range encompassing many positions which have unique, specialized skills which may demand a wide range of compensation based on prevailing market. Assignments are defined and typically follow established work process and procedures.
Attachment: Salary and Benefits Comparison Work Session I.J.
69
Dean
$74,959
$87,613
$(12,654)
Director
$69,020*
$68,503
$517
∗ The CCCS FY10 Average Salary for Director is an average of the Director I, II and III levels combined.
As Table 5 illustrates, there are minimal differences at the vice president and director class definition grouping levels, which on average show that CCCS salaries for these groups remain competitive with national data. However, the $12,654 difference in dean salaries is significantly below the national data averages and is consistent with the level of differences seen with our full-time faculty average salaries. CCCS has a very wide range of deans’ salaries, with a $44,457 difference between the lowest and highest reported salary in this class definition. The national CUPA-reported averages show only a $14,047 difference between the lowest and highest average reported dean’s salaries. As a result, the dean classification would likely benefit from further analysis at the individual college level to understand the reasons for this wide spread and difference in average salaries.
Given the wide variety of professional fields in which the positions in the coordinator, specialist, and para-professional classification groups fall, an overall group analysis is very difficult and will likely not yield valid results. The national salary averages vary greatly by position and professional field depending on the unique educational and experience requirements, demand, and the current market. If there is interest in any particular professional fields, these positions might best be analyzed on a more individualized basis.
Colorado Comparisons: At this point in time, AIMS Community College is the only other two-year public college for which we have overall comparison data. However, AIMS reports their average salaries for administrators and professional/technical staff separately (unlike the combined approach used in the national data above). In order to make a comparison, the CCCS administrator and professional/technical salaries were separated based on the group assignments at each college within Banner. Table 6 shows how the AIMS and CCCS average salaries compared to each other.
Table 6
AIMS and CCCS Average Salaries for Administrators and Professional/Technical (Separated) FY 2009-10
AIMS Community College Averages
Colorado Community
College Averages
Difference Administrators
$85,092
$77,063
$8,029
Professional/Technical
$45,523
$44,497
$1,026
Attachment: Salary and Benefits Comparison Work Session I.J.
70
Preliminary Recommendations and Cost Estimates on Salaries
Based on the key areas of concern identified above, we are making the following preliminary recommendations regarding steps to take to begin addressing these issues. The ability to implement these recommendations, however, is very dependent on the state budget environment over the next 12 to 18 months. In addition, some colleges would be better able to handle these recommendations than others. In particular, some of the rural colleges are not in a financial position to cover these costs.
1) Below market full-time faculty salaries have been a consistent finding over the last several years, with the dollar gap continuing to grow. Our current differential to the FY 2009 - 2010 CUPA two-year public institution national average is 18.5%. CCCS should implement a plan to bring CCCS full-time faculty salaries to the national average within 5 years. Based on CCCS FY 2009-2010 average salaries, this would cost approximately $12.6 million when PERA related expenses are included. Table 7 on the next page shows the percent of salary increase required and cost per college to bring their average faculty salaries to the current CUPA national average of $57,204 within 5 years. This table does not account for an inflation increase on the CUPA national average. It should be noted that there are additional cost considerations related to this measure. For example, if full-time faculty salaries are increased, we would likely also need to increase adjunct instructor pay, which would significantly increase the cost of this recommendation.
Attachment: Salary and Benefits Comparison Work Session I.J.
71
Table 7
Costs by College to Bring Faculty Salaries to FY10 National Average in 5 Years
FY10 Average
Faculty Salary
Yearly %
Increase yr1 yr2 yr3 yr4 yr5
Total Associated
Cost Total Cost
Arapahoe Community College $45,181 104.83% $ 47,363 $ 49,651 $ 52,049 $ 54,563 $ 57,198 $1,320,891
Cost Per Year for Increase - per FY10 FTE $ 207,313 $ 217,326 $ 227,823 $ 238,827 $ 250,362 $ 1,141,652 PERA Cost - per FY10 FTE 95 $ 32,548 $ 34,120 $ 35,768 $ 37,496 $ 39,307 $ 179,239
Community College of Aurora $49,151 103.08% $ 50,665 $ 52,225 $ 53,834 $ 55,492 $ 57,201 $ 405,158 Cost Per Year for Increase - per FY10 FTE $ 65,853 $ 67,881 $ 69,971 $ 72,127 $ 74,348 $ 350,180
Cost Per Year for Increase - per FY10 FTE $ 99,164 $ 105,044 $ 111,274 $ 117,872 $ 124,862 $ 558,216 PERA Cost - per FY10 FTE 39 $ 15,569 $ 16,492 $ 17,470 $ 18,506 $ 19,603 $ 87,640
Pueblo Community College $47,128 103.95% $ 48,990 $ 50,925 $ 52,936 $ 55,027 $ 57,201 $ 1,130,451
Cost Per Year for Increase - per FY10 FTE $ 180,571 $ 187,703 $ 195,118 $ 202,825 $ 210,837 $ 977,054 PERA Cost - per FY10 FTE 97 $ 28,350 $ 29,469 $ 30,633 $ 31,844 $ 33,101 $ 153,397
Pikes Peak Community College $43,858 105.45% $ 46,248 $ 48,769 $ 51,427 $ 54,229 $ 57,185 $ 2,389,989
Cost Per Year for Increase - per FY10 FTE $ 370,490 $ 390,682 $ 411,974 $ 434,427 $ 458,103 $ 2,065,677 PERA Cost - per FY10 FTE 155 $ 58,167 $ 61,337 $ 64,680 $ 68,205 $ 71,922 $ 324,311
Red Rocks Community College $49,065 103.11% $ 50,591 $ 52,164 $ 53,787 $ 55,459 $ 57,184 $ 751,509
Cost Per Year for Increase - per FY10 FTE $ 122,074 $ 125,870 $ 129,785 $ 133,821 $ 137,983 $ 649,533 PERA Cost - per FY10 FTE 80 $ 19,166 $ 19,762 $ 20,376 $ 21,010 $ 21,663 $ 101,977
Trinidad State Junior College $41,545 106.60% $ 44,287 $ 47,210 $ 50,326 $ 53,647 $ 57,188 $ 875,988
Cost Per Year for Increase - per FY10 FTE $ 132,711 $ 141,470 $ 150,807 $ 160,761 $ 171,371 $ 757,120 PERA Cost - per FY10 FTE 48.4 $ 20,836 $ 22,211 $ 23,677 $ 25,239 $ 26,905 $ 118,868
Attachment: Salary and Benefits Comparison Work Session I.J.
73
2) The data on the dean classification salaries being below the national average is consistent
with the data for faculty. The pay of deans should also be considered for upward adjustment. Because of the large spread in dean salaries across the CCCS colleges, an across the board increase may not be appropriate.
Benefits Data
In addition to the salaries for CCCS employees, employees are offered medical, dental, and life insurance benefits. The medical, dental, and life insurance benefits are the same for administrators and professional/technical staff, and faculty. Our yearly employer benefit allowance is shown in Table 8.
Table 8 CCCS Yearly Benefit Allowance
FY 2010-11 Medical Dental Life Total
Employee Only $4,620 $ 252 $ 69 $4,941 Employee + Family $10,290 $ 300 $ 69 $10,659
This employer contribution for medical, dental, and life benefits is above and beyond the employees’ base salary. Seventy nine (79) percent of CCCS administrator and professional/ technical staff and 84 percent of CCCS full-time faculty are awarded at least some of the employer benefit allowance. This means that those employees participate in one or more of the medical, dental, or life benefits. Please see Table 9 that shows the additional corresponding percentage of salary, above their base salary, provided to employees based on the total benefit (medical, dental and life) shown above.
Table 9 CCCS Benefits Percentage above Average Base Salary by Classification
Average Salaries
Total Benefit Allowance Employee
Only
Total Benefit
Allowance Family
CCCS Administrator and Professional/Technical
$49,891 9.9% 21.4%
CCCS Full Time Faculty $46,618 10.6% 22.9%
Attachment: Salary and Benefits Comparison Work Session I.J.
74
AIMS Community College and Colorado Mountain College Benefits Data
Both AIMS Community College and Colorado Mountain College offer medical and dental benefits in excess of CCCS’s benefits.
As part of our group consortium, AIMS Community College participates in the same employee health benefit plan as CCCS. We offer our employees two medical plans: Kaiser Permanente and Anthem Blue Cross and Blue Shield. Of note, all AIMS’s employees are eligible to participate in the Kaiser Permanente plans but not all CCCS employees are, due to their location. The Kaiser Permanente plan premiums are lower than the Anthem Blue Cross and Blue Shield premiums. Table 10 shows the medical and dental benefit allowances AIMS provides to their employees.
Table 10
AIMS Yearly Medical and Dental Benefit Allowances FY 2010-11
Medical Dental Total Employee Only $ 5,664 $ 348 $ 6,012 Employee + Family $13,104 $ 696 $13,800
While AIMS plans and premium rates are the same as those of CCCS, AIMS is able to contribute more toward the premium for their employees. The difference in the benefit is $1,140 for the employee-only plan and $3,210 for the employee plus family plan.
Table 11 shows the additional corresponding percentage of salary, above their average base salary, provided to AIMS’s employees based on the medical and dental benefit shown above.
Table 11 AIMS Benefits Percentage above Average Base Salary by Classification
Average Salaries
Total Benefit Allowance Employee
Only
Total Benefit Allowance
Family AIMS Administrators $85,092 7.1% 16.2%
AIMS Professional/ Technical Staff
$45,523
13.2%
30.3%
AIMS Full-time Faculty
$51,301
11.7%
26.9%
Attachment: Salary and Benefits Comparison Work Session I.J.
75
While CCCS offers our employees two medical plans, Colorado Mountain College offers their employees 3 plans. Each of the Colorado Mountain College plans includes a 4 tier benefits package. The Colorado Mountain College’s fiscal year 10-11 employer insurance contributions are shown in Table 12.
Table 12
CMC Annual Medical and Dental Subsidies FY 2010-11
CMC Yearly Medical Ins
Subsidy
CMC Yearly Dental
Subsidy Total Employee Only $ 9,600.00 $ 9.48 $ 9,609.48 Employee + Children $13,223.76 $ 15.48 $13,239.24 Employee + Spouse $14,296.20 $ 20.52 $14,316.72 Employee + Family $15,767.40 $ 36.96 $15,804.36
Within each benefit tier shown above there is at least one benefit plan option that is covered by the college at 100%. For employee-only coverage, employees are able to utilize any remaining surplus of their subsidy toward other benefit purposes such as supplemental insurance, wellness offerings, or cash. Colorado Mountain College offers a higher benefit contribution than CCCS, with the difference being $4,737 for employee only, up to $5,214 for an employee plus family plan.
In addition, Colorado Mountain College employees are provided a $125 wellness benefit per fiscal year for specific services including, but not limited to, non-credit physical activity classes, mammograms, prostrate screening, vaccinations, and stroke screening.
Finally, Colorado Mountain College provides each full time, benefited employee with life insurance covering 1 ½ times the employee’s salary. All employees also receive a housing stipend of either $100 or $200 per month, depending on their pay grade.
Colorado Higher Education Insurance Benefits Alliance Trust Data
Several higher education institutions within Colorado participate in the Colorado Higher Education Insurance Benefits Alliance Trust (CHEIBA). All of the institutions within CHEIBA have the same plans and premium rates. CHEIBA participants have Anthem Blue Cross and Blue Shield medical and dental plans. The CHEIBA annual premium costs for medical are $5,172 for employee only coverage and $13,488 for employee plus family coverage. The annual premium costs for dental are $432 for employee only coverage and $1,068 for employee plus family coverage. While their plans and premiums are the same, each institution contributes differently toward the cost of the premiums. Table 13 shows the participating CHIEBA institutions and each institution’s 2010 yearly contributions toward medical and dental premiums
Attachment: Salary and Benefits Comparison Work Session I.J.
76
for employee only and employee plus family plans. The table also shows the difference in the contribution rate of the CHIEBA institution from CCCS’s medical and dental contribution rates for employee and employee plus family plans.
Employee Only Contribution Difference from CCCS ($4,872)
CHIEBA Institution Employee + Family Contribution
Employee + Family Contribution Difference from CCCS ($10,590)
Adams State College $ 4,080.00 $ 792.00 $10,415.28 $ 174.72 Auraria Higher Education Center $ 4,596.00 $ 276.00 $ 7,764.00 $2,826.00 Colorado School of Mines $ 5,604.00 $ (732.00)* $14,556.00 $(3,966.00)* Colorado State University - Pueblo $ 3,384.00 $1,488.00 $ 8,802.00 $1,788.00 Fort Lewis College $ 4,063.08 $ 808.92 $ 8,754.00 $1,836.00 Metropolitan State College of Denver $ 3,506.40 $1,365.60 $ 9,112.80 $1,477.20 University of Northern Colorado $ 3,384.00 $1,488.00 $ 8,802.00 $1,788.00 Western State College $ 3,337.20 $1,534.80 $ 8,704.08 $1,885.92 Colorado State University (System and Global Campus) $ 5,604.00 $ (732.00)* $10,920.00 $ (330.00)*
∗ Indicates a higher contribution rate by the CHIEBA institution than CCCS
Benefits Summary
Table 13 shows that in all cases except for the Colorado School of Mines and CSU-Global, CCCS’s medical and dental contribution rate is higher than the contribution of CHIEBA institutions.
Our largest gaps in contribution rates are with AIMS and Colorado Mountain College. Table 14 shows the difference in contributions amounts between CCCS and AIMS and CCCS and Colorado Mountain College based on employee-only and employee plus family medical and dental contribution rates. We were unable to get benefit data from the University of Colorado System.
Attachment: Salary and Benefits Comparison Work Session I.J.
77
Table 14 CCCS Medical and Dental Contributions Compared to AIMS and CMC
Based on current enrollment data, to bring the CCCS contribution rates up to AIMS’s contribution rate would cost approximately $4.2 million. To bring the CCCS contribution rates up to Colorado Mountain College’s contribution rate would cost approximately $9.9 million. We are not recommending any changes to the benefit plan at this point.
Leave Benefits
Administrator and Professional/Technical
Colorado Community College System administrator professional/technical staff accrue 15 hours of annual leave and 10 hours of sick leave per month. CCCS does not provide any personal leave. Table 15 provides a summary of the non-faculty leave benefits provided by other Colorado institutions.
Table 15 Summary of Non-Faculty Leave Benefits – Other Colorado Higher Education Institutions
Annual Leave Accrual
Sick Leave Accrual
Personal Leave Accrual
AIMS Community College
Senior Management/ Administrators
14.67 hours per month 8 hours per month
24 hours per year
Exempt Employees
10 hours per month for 0 – 2 years of service;
13.33 hours per month for 3+ years of service
8 hours per month
24 hours per year
Colorado Mountain College
14 hours per month 8 hours per month
n/a
Colorado State University
16 hours per month 10 hours per month
n/a
University of Colorado 14.67 hours per month 10 hours per month
n/a
Attachment: Salary and Benefits Comparison Work Session I.J.
78
Faculty
Colorado Community College System faculty accrue 90 hours of sick leave per academic year or 10 hours per calendar month covered by their contract of employment, whichever is greater. Faculty do not accrue annual leave but are granted up to 16 hours of their sick leave per year for personal reasons. Table 16 provides a summary of the faculty leave benefits provided by other Colorado institutions.
Annual Leave Accrual Sick Leave Accrual Personal Leave
Accrual AIMS Community College
8 hours per month 16 hours per academic year
Colorado Mountain College
8 hours per month 2 additional days per academic year
Colorado State University
9 month faculty = 0; 12 month faculty = 2 days
per month
1.25 days per month while on full time
appointment
University of Colorado 14.67 hours per month for 12 month appointments;
pro-rated for less
10 hours per month for 12 month appointments; pro-
rated for less
Based on the data above it appears that the leave benefits provided by CCCS for administrators and professional/technical and faculty are comparable or even slightly greater than the leave benefits provided by the other Colorado higher education institutions.
SUMMARY
This report demonstrates that there is a gap in CCCS faculty and dean salaries compared to national and state averages. The data on benefits is less conclusive. There is a gap in the CCCS benefit contribution versus AIMS, Colorado Mountain College, the Colorado School of Mines and CSU Global, but in other college comparisons the CCCS contribution for benefits is higher.
Our recent employee survey found that the CCCS faculty are concerned about their lower salaries and whether or not they will have enough money at retirement. Seventy-four percent (74%) of the faculty who responded to the survey believed that they are not paid appropriately for the work they do. Once the budget environment improves, we are recommending undertaking a five-year effort to get CCCS full-time faculty salaries to national average levels.
Unlike faculty salary comparisons, it is difficult to compare average administrator and professional/technical salaries as a group. This is because our grouping of positions includes such a variety of job descriptions and disciplines from information technology to education services to accounting, etc. The comparisons that we are able to make in the administrator
Attachment: Salary and Benefits Comparison Work Session I.J.
79
professional/technical series show that salaries for this group are competitive with national averages. The exception being the gap found in the dean level salaries discussed in this report.
Finally, in evaluating average salaries, benefits should be considered. This report shows the difference in salaries between CCCS and national averages, but the CUPA data does not allow us to evaluate on the national level the difference in health and life benefits with CCCS. This report does show that the amount that CCCS contributions towards health benefits is significantly lower than the amount contributed by AIMS Community College and Colorado Mountain College. However, CCCS’s contribution rates are consistent with those the other Colorado higher education institutions provide to their employees toward medical and dental benefits. It is important to note that over the last two years, CCCS has increased their contributions to HLD benefits to help offset the rising costs to employees.
Attachment: Salary and Benefits Comparison Work Session I.J.
80
Appendix
Faculty Pay Plans
Arapahoe Community College
Arapahoe’s current starting faculty salary is $42,593 and is adjusted according to the following factors:
• The educational level of the new faculty member. o If a new faculty member has less than a bachelor’s, then the new faculty member
will receive a deduction of 2.6% from the base salary. o Base salary is increased according to graduate courses completed and
education levels above a bachelor’s degree. • The recent and relevant experience (teaching and/or work) of the new faculty
member. o A 1.3% increase to the base salary is added for prorated teaching and work
experience up to five years. • Marketplace demand.
o Arapahoe provides discretion to the VP of Instruction for a marketplace demand factor to be used to keep entry salaries for ACC faculty competitive with salaries for similar teaching positions. In no case can marketplace demand be used to give a new faculty member a greater salary than a continuing faculty member with similar experience and training in the same or similar program area. The maximum marketplace demand factor shall not exceed 4% of the current ACC starting base salary. Teaching and/or work experience used to calculate the adjusted initial faculty salary shall not be considered in establishing marketplace demand.
Community College of Aurora
Aurora’s starting faculty salary is $36,976. Higher starting salary is granted for additional education and experience. A new faculty member with a master’s degree will start at $40,511, a master’s degree + 30 semester hours will start at $42,265, and a doctorate will start at $45,800. Each year of experience, up to a maximum of 8, adds $884. The 8 year maximum can be waived by the VP of Instruction and President.
Community College of Denver
The starting salary for faculty at Denver is $38,500, with the exception of their Dental Hygiene and Nursing programs. The Dental Hygiene and Nursing programs start bachelor degreed faculty at $48,000 and master’s or higher degreed at $51,000.
Colorado Northwestern Community College
CNCC’s starting salary range for Arts & Sciences faculty is $38,000-$40,000, depending on experience and credentials. CNCC’s CTE faculty starting salary is $35,000 depending on
Attachment: Salary and Benefits Comparison Work Session I.J.
81
the program, credentials required to teach in that particular program (Nursing pays more than entry level Equine Studies), and experience.
Front Range Community College
Front Range starts their faculty according to a level and step plan. Level refers to degree level and step refers to years of teaching experience. Step 1 equates to 1 year of experience, step 2 is 2 years, and step 3 is anything 3 years or greater.
Lamar’s starting faculty salary is based on contract type: 9 month faculty start at $35,500, 12 month faculty at $37,500, and Nursing faculty at $45,000.
Morgan Community College
Morgan’s starting salary for faculty is $33,220. New faculty are granted an additional $332.20 per point, up to 40 points, for a maximum starting salary of $46,508. Points are awarded based on years of experience teaching in their hired discipline, certifications, and degree level.
Northeastern Junior College
Northeastern’s starting faculty salary range is $32,500 to $37,700. The actual starting salary within the range is dependent upon degree level and years of experience.
Otero Junior College
Otero’s starting faculty salary is $30,000 for bachelor degreed faculty. New faculty with a master’s degree receive $34,000 and with a PhD receive $35,000. New faculty members with VO Credentials but less than bachelor’s degrees receive $28,500.
Pikes Peak Community College
Pikes Peak’s starting faculty salary is $37,265.
Pueblo Community College
Pueblo’s starting faculty salary is $33,000. Additional pay is granted for degree level, job related work experience, and formal teaching experience.
Red Rocks community College
Attachment: Salary and Benefits Comparison Work Session I.J.
82
Red Rock’s starting faculty salary is between $40,000 and $42,000. Actual placement varies by education and applicable job related experience.
Trinidad State Junior College
Trinidad has established salary ranges for three levels of faculty: Assistant Professor, Associate Professor, and Professor. The minimum salary range for these faculty are $30,876, $34,405, and $40,127, respectively.
Faculty who obtained one of the above rankings previously, or at another CCCS college, will retain their ranking. Rankings are dependent upon qualifications including an established combination of degree level and experience.
Attachment: Report on Adjunct Instructor Pay Work Session I.J.
83
Adjunct Pay Data
The average pay per credit hour for Adjuncts was calculated from course and pay data for fiscal year 2010. This provides an indication of the average cost incurred per credit hour and includes additional payments and deductions made by the colleges for reasons such as non classroom instruction and larger and smaller class sizes. The calculated average rate of pay per credit hour for each college and for the system as a whole is shown in Table 1.
Table 1
Average Rate of Pay per Credit Hour
Average Rate per
Credit Hour Arapahoe Community College $658 Community College of Aurora $704 Community College of Denver $615 Colorado Northwestern Community College $509 Front Range Community College $672 Lamar Community College $534 Morgan Community College $313 Northeastern Junior College $437 Otero Junior College $601 Pueblo Community College $525 Pikes Peak Community College $480 Red Rocks Community College $650 Trinidad State Junior College $536 Overall (weighted) $594
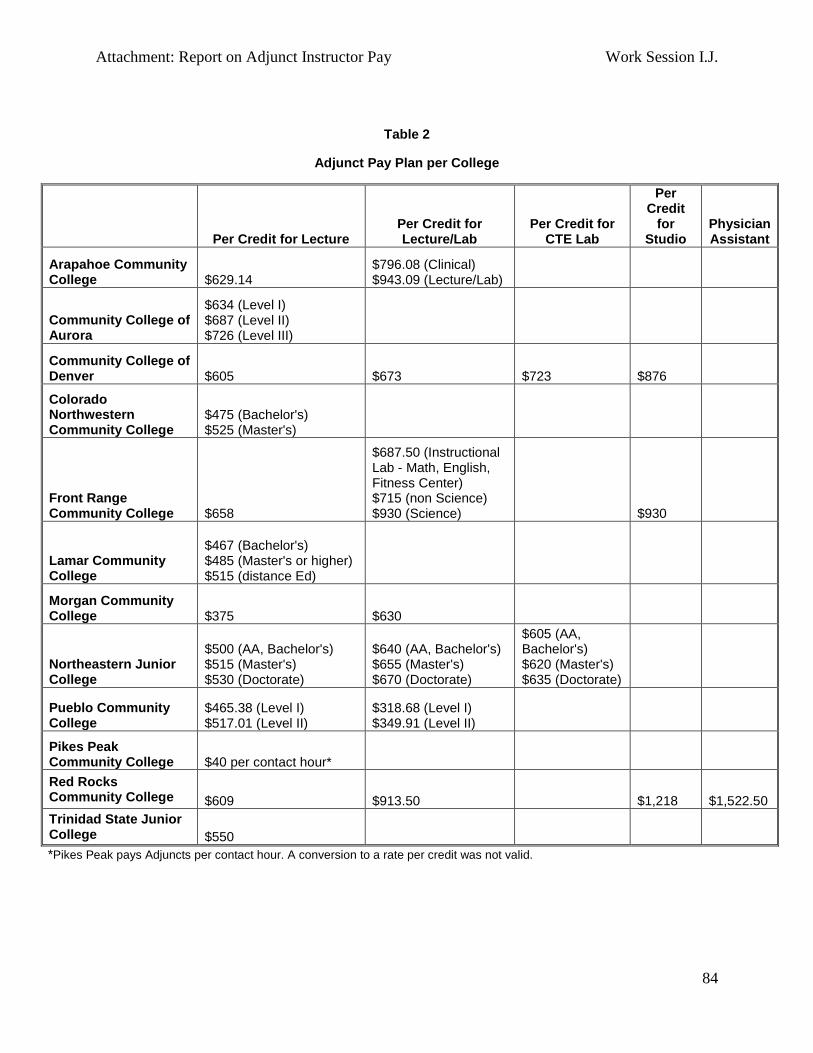
Each of the colleges have their own process for administering Adjunct pay. Most differentiate between course type/subject and Adjunct education level. A few of the colleges differentiate between new and returning Adjuncts with satisfactory returning Adjuncts receiving a higher rate of pay. Beyond these pay plans some of the colleges offer increased payment for larger class sizes and some allow smaller classes to move forward at a lesser pay rate rather than cancelling a course. The rate plans per credit hour by college, except Otero Junior College, are shown in Table 2. Otero Junior College pay is based on the number of students enrolled and education level of the Adjunct. Otero Junior College’s rate schedule is shown in Table 3.
Attachment: Report on Adjunct Instructor Pay Work Session I.J.
Pikes Peak Community College $40 per contact hour* Red Rocks Community College $609 $913.50 $1,218 $1,522.50 Trinidad State Junior College $550 *Pikes Peak pays Adjuncts per contact hour. A conversion to a rate per credit was not valid.
Attachment: Report on Adjunct Instructor Pay Work Session I.J.
Attachment: Report on Adjunct Instructor Pay Work Session I.J.
86
National Comparisons: According to the College and University Professional Association (CUPA) 2009-2010 report on two-year faculty salaries, the average hourly rate per credit/course for Adjuncts ranged from $599 to $854. CCCS’s overall weighted per credit rate of $594 is $5, or 1%, below the low end of the national average range and $260, or 44%, below the top of the national average range using this data comparison. Education, tenure, and college teaching experience are the largest factors impacting Adjunct pay nationally, outside of total number of units taught. This is consistent with the differentiating factors found in the Colorado Community College System pay plans.
In addition to pay rates, CUPA reported that approximately 89% of responding two-year colleges limit the teaching loads of their Adjunct faculty. Of those that limit their Adjunct teaching loads, the average limit is 12 credit hours for regular terms and 9 credit hours for summer terms.
Colorado Comparisons: The local colleges and universities were contacted to gather information about Adjunct pay rates. Responses were received from AIMS Community College, Colorado State University (CSU), University of Colorado at Denver (CU Denver), and Metropolitan State College of Denver (Metro State). AIMS pays Adjuncts $660 per credit hour. CSU pays Adjuncts approximately $1264 per credit. CU Denver considers Lecturers to be the equivalent of Adjuncts and pay rates are at the discretion of each Dean. The lecturer pay rates range from $3,600 to $4,800 per semester, per course. This does not include rates paid for the Health Sciences/Medical courses which pay higher lecture rates. Metro State pays Adjuncts based on credit hours and education level. Adjuncts with a Bachelor’s degree are paid $876 per credit hour, a Master’s degree $984, and a terminal degree in their field $1,030.
SUMMARY
The cost to provide CCCS Adjuncts with a 1 percent pay increase, based on Adjunct payouts for fiscal year 2010, is approximately $500,983. The estimated cost per college for increasing Adjunct pay by 1 percent, including the associated PERA cost is shown in Table 4. These numbers are based on fiscal year 2010 data and the impact of growth in Adjunct FTE during the current fiscal year is therefore not reflected.
Attachment: Report on Adjunct Instructor Pay Work Session I.J.
87
Table 4
Cost per College Due to 1% Increase in Adjunct Pay
Associate Cost
for Increase Arapahoe Community College $ 41,149 Community College of Aurora $ 50,849 CCCOnline $ 56,599 Community College of Denver $ 49,735 Colorado Northwestern Community College $ 7,005 Front Range Community College $117,211 Lamar Community College $ 2,770 Morgan Community College $ 9,525 Northeastern Junior College $ 6,245 Otero Junior College $ 5,890 Pueblo Community College $ 40,328 Pikes Peak Community College $ 58,437 Red Rocks Community College $ 45,462 Trinidad State Junior College $ 9,779 Overall $500,983
In addition to the overall average, Table 1 shows where each college’s per credit rate for Adjunct faculty falls compared to the reported CUPA national average range of $599 to $854. Most of the larger colleges within the system are already paying within this range, the exception being Pueblo and Pikes Peak at $525 (14% below) and $480 (25% below), respectively. While Pikes Peak has increased their Adjunct pay rate since the Fall 2010 semester in which the average per credit rates were calculated, both schools may benefit from a further review of their Adjunct Pay Plans to bring their rates closer to their counterparts within the system.
While the smaller colleges within the system are all below the low end of the CUPA national average range, Morgan is considerably lower. Their average rate per credit of $313 represents Adjunct payments based on small class sizes. If Morgan is having difficulty attracting and retaining quality Adjuncts, they should consider bringing their Adjunct Pay Plan rates more in line with their counterparts within the system.