18
Flow statistics Work towards longitudinal analyses based on the LFS [email protected] [email protected]

Flow statistics
Work towards longitudinal analyses based on the LFS

Labour Force Survey data and flows
The LFS is by design a cross-sectional household sample survey
Most countries (exception: DE, BE, LU) collect data using rotational sampling designs leading to quarterly and annual overlap
� Potential to exploit overlap and produce rich
longitudinal data

Policy interest (DG Employment, ECB)
Labour market status transitions
Transitions education – labour market
Transitions NEET – employment
Job-to-job mobility
•
Who moves where?
• Breakdown by sex, age, education, unemployment duration, type of contract,…

First step:basic issues flow indicators
Second step: improve indicators, longitudinal micro-data
Decide on longitudinal population
Longitudinal data checks
Methodology for longitudinal weights - ILO status
Longitudinal weights – more detail in calibration
Ensure consistency stocks-flows
Tackle attrition bias, non-response bias, population changes via weighting
Yearly flows Role of econometric modelling
Seasonal adjustment Precision requirements

Employment
Unemployment Inactivity
INFLOWS: Movers, enter relevant age group
OUTFLOWS: Movers, death, exit relevant age group
NET FLOWS

Employed Unemployed Inactive
Total longitudinal
population
Employed
Unemployed
Inactive
Total longitudinal
population
Labour status final period
Lab
ou
r st
atu
s in
itia
l p
eri
od
Ind
ivid
ua
ls
en
teri
ng
p
op
ula
tio
n
Individuals leaving
population: age, death, move
To
tal
po
pu
lati
on
in
itia
l pe
rio
d
Total population final period

Employed Unemployed Inactive
Total longitudinal
population
Employedd D
Unemployed
e E
Inactivef F
Total longitudinal
populationa b c
sum(abc) ≠ sum(def) due
to weightssum(DEF)
A B C sum(ABC)
Lab
ou
r st
atu
s in
itia
l p
eri
od
Labour status final period
To
tal
po
pu
lati
on
init
ial p
eri
od
Total population final period

Weighting and calibration
Which weights?
Calibration to
• the initial period (as the respective period is the starting point of the analysis);
• the final period (consistency with most recent data, highest interest);
• both marginal distributions.
How to ensure consistency flows – stocks?

1. Identify matching cases in both quarters, by 10 year age group and sex (nr of cases)

2. Matched cases using final quarter weights (in 1 000s)

3. Matrix calibrated to final quarter distribution

4. Sum over age groups, correct initial quarter value
for inactives to get the same total population
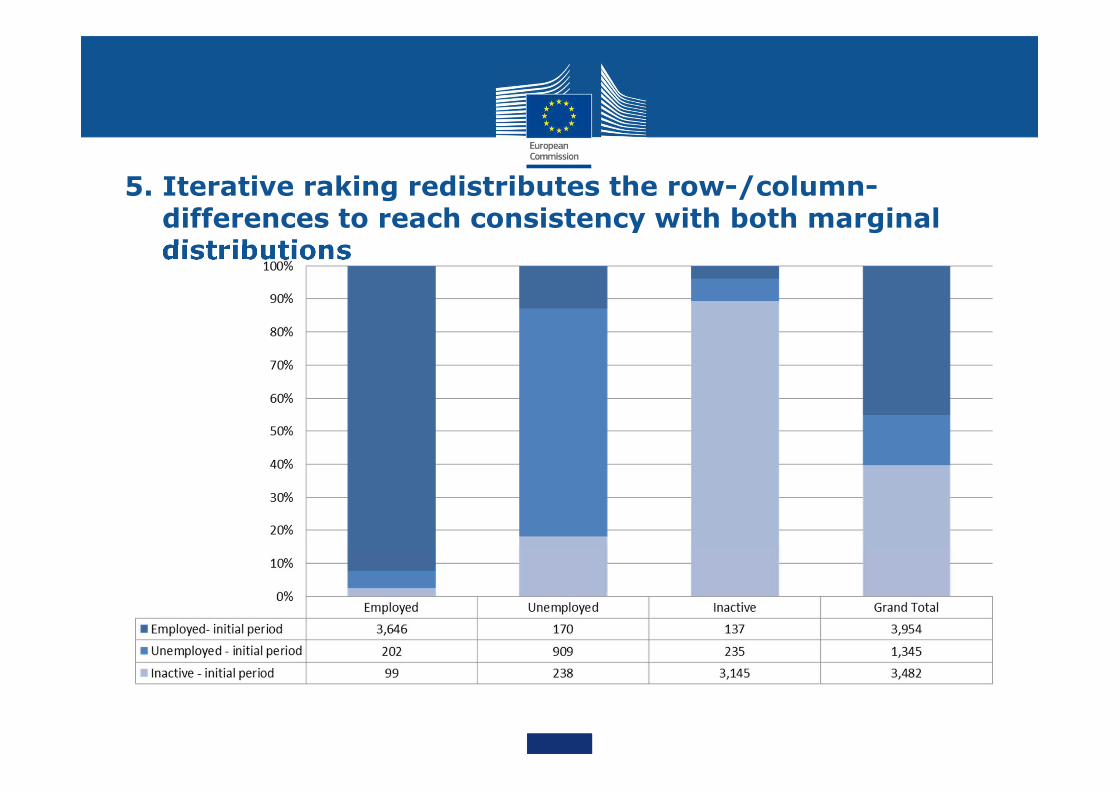
5. Iterative raking redistributes the row-/column-differences to reach consistency with both marginal distributions

Next steps:
• 2nd half of 2015: Publication of 3x3 transition matrices for 15-74, by sex, quarter-on-quarter
• 2016: seasonal adjustment, yearly flows

Longitudinal micro-data
Methodological considerations
• - Investigation of longitudinal weights
• - Consistency checks, longitudinal data validation
Procedural considerations
• - agreement of Member States necessary (access to linked data)
• - assess implications of consistency checks and data validation rules on stocks

Consistency checks: example
Inactivity vs unemployment: unemployment duration
Inactivity = neither employed nor unemployed
Unemployed = not working, wanting to work, actively searching work, available for work
Duration of unemployment = min(search duration, time since last employment)

Initial labour status Final labour status Duration of unemployment
inactive unemployed 2 years
• PROXY interview in one of the quarters?
• Duration of job search, or time since last employment? How do they compare?
• During inactivity, willing to work? Not available, or not searching?
• Situation with regard to activity one year before survey
• Try to match with other overlapping period (q, y)
• DECIDE: "false flow" or not? What about stocks?
Timeline:
• 2nd half of 2015: Publication of 3x3 transition matrices for 15-74, by sex, quarter-on-quarter
• 2016: seasonal adjustment, yearly flows
• Future work (2016-2019):
• Improved weighting
• Role of econometric modelling
• Panel attrition
• Longitudinal micro-data


