Workers' Compensation and Injury Duration: Evidence from a Natural Experiment By BRUCE D. MEYER, W. KIP VISCUSI, AND DAVID L. DURBIN* This paper examines the effect of workers' compensation on time out of work. It introduces a "natural experiment" approach of comparing individuals injured before and after increases in the maximum weekly benefit amount. The increases examined in Kentucky and Michigan raised the benefit amount for high-earnings individuals by approximately 50 percent, while low-earnings individuals, who were unaffected by the benefit maximum, did not experience a change in their incentives. Time out of work increased for those eligible for the higher (benefits and remained unchanged for those whose benefits were constant. The estimated duration elasticities are clustered around 0.3-0.4. (JEE C90, H51, J28) Workers' compensation can infiuence the incentives workers face in several ways. Higher benefit rates may decrease workers' incentives to avoid injuries, may increase the incentives to file for compensation for any given job injury, and may foster more claims for nonwork injuries. In addition, higher benefits may make extending the du- ration of a elaim more attractive. Most pre- vious work on incentive effects of workers' compensation has focused on the program's effect on injury rates or the number of claims rather than the duration of claims.' * Meyer: Department of Economics and Research Faculty, Center for Urban Affairs and Policy Research, Northwestern University, 2()U3 Sheridan Road. Evanston. IL 60208-2600, and NBER; Viscusi: Depart- ment of Economics, Duke University, Durham. NC 27708-0097; Durbin: National Council on Compensa- tion Insurance, Hoboken, NJ 0703(1-5722. We thank Joe Altonji, Tom Downes, Bo [Jonore, Rob Fairlie, Aian Krueger, Bob Reed. Paula Worthington. numer- ous referees, and seminar participants at the Ninth Annual NCCl Seminar on Economic issues in Workers Compensation, Stanford. UCLA, the Annual Mega Universities Workers" Compensation Conference, the NBER Labor Studies and Taxation groups, Texas A&M. MIT, Northwestern, and Duke for their com- ments. We also thank Julie Ho and Anniibel Samaniego for excellent research assistance, and Paula Nielsen for excellent word processing. Meyer acknowledges sup- port for this project from the NSF through grants SES-9024548 and SBR-9310280. 'See Ronald G. Ehrenberg (1988), Alan B. Krueger (1990a), and Michael J. Moore and Viscusi (1990 Ch. 2) for surveys of previous studies. This emphasis may have led to an under- estimation of the extent of the effect of workers' compensation on ineentives. Higher benefits might induce workers to stay out of work longer either to complete medical recovery or to have more leisure.^ Such changes may oceur even if care and injury levels on the job are unaffected by workers' compensation. In this paper, we address one aspect of the incentives created by workers' compensation using data from a natural experiment provided by two large increases in benefit levels in Kentucky and Michigan. This natural experiment enables us to compare the behavior of people who are injured before the benefit increases to those injured after the increases, providing a test of the efifect of benefit changes on the duration of claims. The motivation for our approach is the observation that, within a given state at a point in time, the weekly benefit for tempo- rary total disability is a piecewise linear increasing function of previous earnings. Since previous earnings strongly influence the payoff from returning to work, the eco- nomic benefits of returning to work and the economic gains from reeeiving benefits are Higher benefits may also lead to fraud and over* stated claims. For anecdotal evidence on the extent of such behavior see The New York Times (29 December 199!, p. 1). 322
Transcript
Workers' Compensation and Injury Duration:Evidence from a Natural Experiment
By BRUCE D . MEYER, W . KIP VISCUSI, AND DAVID L. DURBIN*
This paper examines the effect of workers' compensation on time out of work. Itintroduces a "natural experiment" approach of comparing individuals injuredbefore and after increases in the maximum weekly benefit amount. The increasesexamined in Kentucky and Michigan raised the benefit amount for high-earningsindividuals by approximately 50 percent, while low-earnings individuals, whowere unaffected by the benefit maximum, did not experience a change in theirincentives. Time out of work increased for those eligible for the higher (benefitsand remained unchanged for those whose benefits were constant. The estimatedduration elasticities are clustered around 0.3-0.4. (JEE C90, H51, J28)
Workers' compensation can infiuence theincentives workers face in several ways.Higher benefit rates may decrease workers'incentives to avoid injuries, may increasethe incentives to file for compensation forany given job injury, and may foster moreclaims for nonwork injuries. In addition,higher benefits may make extending the du-ration of a elaim more attractive. Most pre-vious work on incentive effects of workers'compensation has focused on the program'seffect on injury rates or the number of claimsrather than the duration of claims.'
* Meyer: Department of Economics and ResearchFaculty, Center for Urban Affairs and Policy Research,Northwestern University, 2()U3 Sheridan Road.Evanston. IL 60208-2600, and NBER; Viscusi: Depart-ment of Economics, Duke University, Durham. NC27708-0097; Durbin: National Council on Compensa-tion Insurance, Hoboken, NJ 0703(1-5722. We thankJoe Altonji, Tom Downes, Bo [Jonore, Rob Fairlie,Aian Krueger, Bob Reed. Paula Worthington. numer-ous referees, and seminar participants at the NinthAnnual NCCl Seminar on Economic issues in WorkersCompensation, Stanford. UCLA, the Annual MegaUniversities Workers" Compensation Conference, theNBER Labor Studies and Taxation groups, TexasA&M. MIT, Northwestern, and Duke for their com-ments. We also thank Julie Ho and Anniibel Samaniegofor excellent research assistance, and Paula Nielsen forexcellent word processing. Meyer acknowledges sup-port for this project from the NSF through grantsSES-9024548 and SBR-9310280.
'See Ronald G. Ehrenberg (1988), Alan B. Krueger(1990a), and Michael J. Moore and Viscusi (1990 Ch.2) for surveys of previous studies.
This emphasis may have led to an under-estimation of the extent of the effect ofworkers' compensation on ineentives.Higher benefits might induce workers tostay out of work longer either to completemedical recovery or to have more leisure.^Such changes may oceur even if care andinjury levels on the job are unaffected byworkers' compensation. In this paper, weaddress one aspect of the incentives createdby workers' compensation using data from anatural experiment provided by two largeincreases in benefit levels in Kentucky andMichigan. This natural experiment enablesus to compare the behavior of people whoare injured before the benefit increases tothose injured after the increases, providinga test of the efifect of benefit changes on theduration of claims.
The motivation for our approach is theobservation that, within a given state at apoint in time, the weekly benefit for tempo-rary total disability is a piecewise linearincreasing function of previous earnings.Since previous earnings strongly influencethe payoff from returning to work, the eco-nomic benefits of returning to work and theeconomic gains from reeeiving benefits are
Higher benefits may also lead to fraud and over*stated claims. For anecdotal evidence on the extent ofsuch behavior see The New York Times (29 December199!, p. 1).
322
VOL. 85 NO. 3 MEYERETAL: WORKERS'COMPENSATION AND INJURY DURATION 323
AHer Increase
Low Earnings Group Higli Earnings Group
FIGURE 1. TEMPCJKARY TOTAL Br.NEriT SCHEDLILF:
BLRJRE AND ArTER AN INCKFASF IN
Tnr. MAXIMUM WEEKLY BENEFIT
each largely influenced by a common vari-able, previous earnings. Regressions of spelllength on weekly benefit.s and previousearnings consequently eannot easily distin-guish between the effect of workers' com-pensation and the highly correlated influ-ence of previous earnings. This result isespecially true if we are uncertain aboutexaetly how previous earnings affect spelllength.^
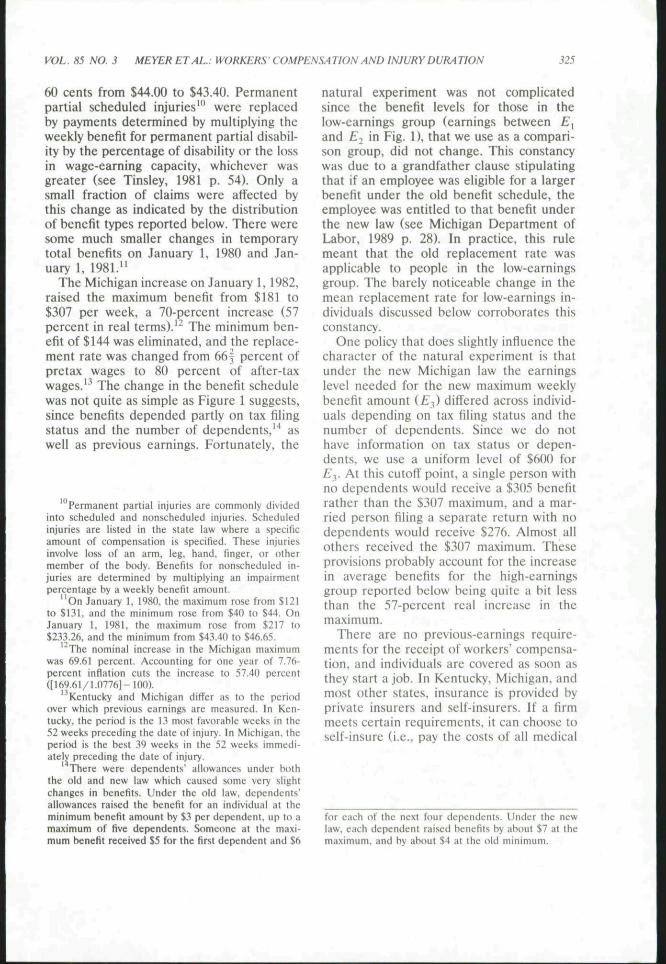
The main idea behind our solution to thisproblem can be seen in Figure 1, whichdisplays a typical state schedule relating theweekly beneflt amount (WBA) for tempo-rary total disability^ to previous weeklyearnings. The solid line is-the schedule priorto a change in the state law that raises themaximum weekly benefit amount. Thedashed line is the schedule after the benefitincrease. For people with previous earningsof at least E, (the high-earnings group), wecompare the weeks of benefits received for
• This identification problem created by the depen-dence of program generosity on an individuaFs previ-ous earnings is common to many social insurance pro-grams. See Meyer (lySM) for a parallel paper on unem-ploymenl insurance that builds on earlier work byKathleen P. Classen (1^79) and Gary Solon (1985).
Temporary lotal disabilities are those where theemployee is unable in work but is expected to recoverfully and return lo work. The types of benefits arediscussed in more detail in Section I.
people injured during the year before andthe year after the change in the benefltschedule. Those whose claims began beforethe increase receive WBA'*.̂ ,̂ ^ while thoseinjured afterwards reeeive WBA'^^^. Thisgroup of workers consequently experiencesthe full effect of the beneflt inerease. Anindividual's injury date determines his tem-porary total disability beneflt amount forthe entire period of the disability.^ For ex-ample, two individuals with previous earn-ings greater than E^ will receive differentweekly benefit amounts for up to severalyears, if one was injured a few days beforeand the other a few days after the effectivedate of the beneflt increase. The effect ofthis difference is the basis of the empiricaltest used in the paper. Most of the remain-ing methodologieal problems involve cor-recting for possible differences between theindividuals who are injured before and afterthe beneflt increase. In much of what fol-lows, we will use as a comparison groupthose with earnings between E\ and E^ (thelow-earnings group) who are injured duringthe year before and after the beneflt in-crease. The beneflts these individuals re-ceive are unaffected by the increase in themaximum weekly beneflt.
Section I briefly outlines the strueture ofworkers' compensation and deseribes thebeneflt changes in Kentucky and Miehiganthat provide the basis for this paper. InSection II we describe the data and outlinethe empirical procedure used to relate thepoliey shifts to the incentive effects. Thetwo modes of analysis, assessment of meaneffects resulting from the policy shifts andregression analysis of durations, appear inSections III and IV. By comparing changesin duration and changes in medical expendi-tures we are also able to distinguish thespell-duration effect of higher beneflts fromthe effect of ehanges in injury severity. Sec-tion IV also reports more preeise estimatesusing all of the available data without mak-
Some states have cost-of-living adjustments whichindex the benefit tor inflation. The two stales examinedhere. Kentucky and Michigan, did not have such ad-justments during ihe period examined.
324 THE AMERICAN ECONOMIC REVIEW JUNE 1995
ing Strong functional-form assumptions. Aswe indieate in the concluding Section V, theincentive effect of the benefit shifts is quitesubstantial. In particular, while we find arange of estimates, the central tendency ofour estimates suggests that a 10-pereent in-erease in the benefit level is associated withan increase in spell durations of 3-4 per-cent.
I. Workers* Compensation Lawsand the Benefit Increases
Workers' compensation programs are runby the individual states and differ widely intheir coverage, types of benefits, levels ofbenefits, and available methods of insuranceunderwriting. Workers' compensation pro-vides both payments for medical care andindemnity (cash) benefits for work-relatedinjuries. By far the most common type ofindemnity payments are those for tempo-rary total disabilities. This paper concen-trates on temporary total disability claims,as do the earlier papers in the literature onthe duration of workers' compensationclaims. A person with a temporary totaldisability is unable to work but is expectedto recover fully and return to work. Theseclaims accounted for more than 80 percentof the recent indemnity claims in the twostates analyzed below.'' However, temporarytotal claims account for a smaller fraction oftotal eosts.^ Most importantly for this study,
See Table 3 for a breakdown of benefit types inKentucky and Michigan. We include a larger fractionof claims in the temporary total classification thanother sources because we use benefit type as of 42months rather than classifying as permanent all claimslonger than one year, as is done In the commonly citedNational Council on Compensation Insurance (NCCI)figures.
Over the two-year period examined, claims wilhonly temporary total benefits accounted for 41 percentof all indemnity and medical payments in Kentuckyand 68 percent of ail such payments in Michigan.These numbers are based on tabulations from theDetailed Claim Information (DCI) data described inSection II. The percentages are much larger than thefraction of costs typically attributed to temporary totalclaims, sinee the commonly cited data classifies aspermanent all claims longer than one year.
temporary total claims have no fixed dura-tion; their length is determined by the in-jured worker, his or her doctor, the em-ployer, and its insurer. While not the case inthe two states analyzed below, some stateshave a maximum duration or maximumamount of total benefits. The vast majorityof other indemnity claims are for perma-nent partial injuries. A person with a per-manent partial injury is permanently im-paired but not completely disabled.
The seleetion of the state benefit in-creases used in this study was relativelystraightforward. There were only three largeincreases in the temporary total maximumbenefit levels in the states and time periodsincluded in the NCCI data base used in thisstudy. These increases occurred in Florida,Kentucky, and Michigan. The Florida in-crease coincided with a major overhaul ofthe workers' compensation law, so that thebefore versus after comparisons refleet mul-tiple aspects of the change in benefit strue-ture." Because of this complication, we ana-lyze only Kentucky and Michigan.
The Kentucky increase of July 15, 1980,raised the maximum benefit from $131 to$217 per week, a 66-percent increase (52percent over one year in real terms).^ Thereplacement rate of 6 6 | percent did notchange. The minimum weekly benefit fell by
Florida raised its maximum benefit amount from$130 per week to $19.5 on August 1, 1979, but thiscoincided with a complete reform of the Florida work-ers' compensation law. A wage-loss system was adoptedwhieh eliminated beneflts if an individual made moreafter reaching maximum medical improvement than heor she had previously. Initial interpretations of the newlaw made it difficult for workers to demonstrate thatthey had certain impairments, particularly those notlisted in American Medical Association (AMA) guides.Many minor permanent partial cases were eliminatedfrom the program. The reform also sought to reduceIhe frequency of lump sum settlements, by not allowingthem to be considered until six months after the workerhad reached maximum medical improvement. For de-scriptions of the Florida reform see Monroe Berkowitzand John F. Burton. Jr. (1987) and LdVerne C. Tinsley(19S0).
The nominal increase in the Kentueky maximumwas 65.65 percent. Accounting for one year of inflationat 8.95 percent cuts Ihe increase to 52.06 percent{[165.65/1.0894]-100).
60 cents from $44.00 to $43.40. Permanentpartial scheduled injuries'" were replacedby payments determined by multiplying theweekly benefit for permanent partial disabil-ity by the percentage of disability or the lossin wage-earning capacity, whichever wasgreater (see Tinsley, 1981 p. 54). Only asmall fraetion of claims were affeeted bythis change as indicated by the distributionof benefit types reported below. There weresome much smaller changes in temporarytotal benefits on January 1, 1980 and Jan-uary 1. 1981."
The Michigan increase on January 1,1982,raised the maximum benefit from $181 to$307 per week, a 70-percent inerease (57percent in real terms).'^ The minimum ben-efit of $144 was eliminated, and the repiaee-ment rate was ehanged from 66f pereent ofpretax wages to 80 percent of after-taxwages.''^ The change in the benefit schedulewas not quite as simple as Figure 1 suggests,since benefits depended partly on tax filingstatus and the number of dependents,'"* aswell as previous earnings. Fortunately, the
Permanent partial injuries are commonly dividedinto scheduled and nonscheduled injuries. Scheduledinjuries are listed in the state law where a specificamount of compensation is specified. These injuriesinvolve loss of an arm, leg, hand, finger, or othermember of the body. Benefits for nonscheduled in-juries are determined by multiplying an impairmentpercentage by a weekly benefit amount.
On January 1, 1980, the maximum rose from $121to $131, and the minimum rose from $40 to S44. OnJanuary 1, 1981, the maximum rose from $217 to$233.26, and the minimum from $43.40 to $46.65.
"The nominal increase in the Michigan maximumwas 69.61 percent. Accounting for one year of 7.76-percent inflation cuts the increase to 57.40 percent([169.61/1.0776]-100).
Kentucky and Michigan dififer as to the periodover which previous earnings are measured. In Ken-tucky, the period is the 13 most favorable weeks in the52 weeks preceding the date of injury. In Michigan, theperiod is the best 39 weeks in the 52 weeks immedi-ately preceding the date of injury.
There were dependents' allowances under boththe old and new law which caused some very slightchanges in benefits. Under the old law. dependents'allowances raised the benefit for an individual at theminimum benefit amount by $3 per dependent, up to amaximum of five dependents. Someone at the maxi-mum benefit received $5 for the first dependent and S6
natural experiment was not complicatedsince the benefit levels for those in thelow-earnings group (earnings between E,and £2 in Fig. 1), that we use as a compari-son group, did not change. This constancywas due to a grandfather clause stipulatingthat if an employee was eligible for a largerbenefit under the old benefit schedule, theemployee was entitled to that benefit underthe new law (see Michigan Department ofLabor, 1989 p. 28). In practice, this rulemeant that the old replacement rate wasapplicable to people in the low-earningsgroup. The barely noticeable change in themean replacement rate for low-earnings in-dividuals discussed below corroborates thisconstancy.
One policy that does slightly infiuence thecharacter of the natural experiment is thatunder the new Michigan law the earningslevel needed for the new maximum weeklybenefit amount (£ \ ) differed across individ-uals depending on tax filing status and thenumber of dependents. Since we do nothave information on tax status or depen-dents, we use a uniform level of $600 forEy At this cutoff point, a single person withno dependents would receive a $305 benefitrather than the $307 maximum, and a mar-ried person filing a separate return with nodependents would receive $276. Almost allothers reeeived the $307 maximum. Theseprovisions probably account for the increasein average benefits for the high-earningsgroup reported below being quite a bit lessthan the 57-percent real increase in themaximum.
There are no previous-earnings require-ments for the receipt of workers' compensa-tion, and individuals are covered as soon asthey start a job. In Kentucky, Michigan, andmost other states, insuranee is provided byprivate insurers and self-insurers. If a firmmeets certain requirements, it can choose toself-insure (i.e., pay the costs of all medical
for each of the next four dependents. Under the newlaw, each dependent raised benefits by about $7 at themaximum, and by about $4 at the old minimum.
326 THE AMERICAN ECONOMIC REVIEW JUNE 1995
and indemnity benefits). In Kentucky aboutone-fourth and in Michigan about one-halfof all dollars of benefits are paid by self-insurers (see Daniel N. Price, 1984; WilliamJ. Nelson, 1988). In Michigan there is also acompetitive state fund that offers insurance.Our data described in Section III includethe Michigan state fund, but not self-insurers.
Other characteristics of state workers'compensation laws that affect the benefitsworkers receive include the waiting period,retroactive period, and the rules on choiceof physician. The waiting period is sevendays in both states, which means that nocompensation for lost work time is paid forinjuries lasting less than seven days. Thereis a two-week retroactive period in bothstates that provides compensation for thosefirst seven days if an injury lasts more thantwo weeks. In Kentucky the employee hasthe right to choose the attending physician,while in Michigan the employer has theinitial choice. After the first ten days oftreatment the employee can choose his orher own physician by giving notice to theemployer.
While workers' compensation benefitscreate an incentive for workers to prolongtheir time out of work, experience-ratingcreates incentives for firms to monitor theduration of their workers' claims. Charac-terizing the incentives that firms face isdifficult, as experience-rating varies by firmsize, industry, and state. While summarymeasures of the distribution of incentivescreated by experience-rating are unavail-able, some broad generalizations can bemade. The incentive to monitor claims riseswith firm size. While small firms pay foronly part of the eost of additional claims,larger firms may pay more than the cost of aclaim through higher premiums (see RichardB. Victor, 1985). The commonly usedexperience-rating formulas (see NationalCouncil on Compensation Insurance, 1988)rely more on the incidence of claims thantheir severity. Claims exceeding $2,000 aretypically downweighted in the calculation ofa firm's past experience. Overall, most em-ployees are at firms with fairly strong incen-tives to monitor the length of claims.
Claims durations are mostly at the discre-tion of an employee and his or her doctor.If an employer or an insurance companyquestions the length of a claim, it can re-quest an updated medical report and evenrequest an examination by its own doctor. Ifthe company is not satisfied with the results,it can give notice that it is terminating thepayment of benefits. This action will veryoften lead to a dispute.
The two states have difi'erent administra-tive procedures to resolve disputes. In Ken-tucky, if the employer and employee areunable to reach an agreement on the natureof compensation, the parties can apply for ahearing. A workers' compensation boardmember renders an opinion, subject to theapproval of the full board. Appeals can bebrought to the Circuit Court, and then theCourt of Appeals. Michigan has a two-tierstructure for decision-making when the em-ployer and employee cannot reach an agree-ment. Initial hearings are conducted by anAdministrative Law Judge. Either party canappeal the judge's decision to the Workers'Compensation Appeal Board.
II. Data and Methods
The data source for this study is the De-tailed Claim Information (DCI) data basecollected by the National Council on Com-pensation Insurance (NCCI) (see NCCI,1984). Data from ten states beginning in1979 are available, with data from six addi-tional states available over a more limitedtime period. The data set contains a ran-dom sample of indemnity claims from agroup of insurance companies which ac-count for over 99.5 percent of the insurancesold in the states. The sampling rates fromthis population of claims are 0.4 for Ken-tucky, and 0.2 for Michigan.
The key variables in the data set that weuse are date injured, duration of temporarytotal benefits, total medical costs, previousearnings, weekly benefit amount, benefittype (i.e., temporary total or permanentpartial), type of injury (body part affectedand the type of damage), whether the claimis settled by a lump sum, age, sex, maritalstatus, and an industry code. A report con-
taining these and additional variables ismade six months after the claim is filed,then at 18 months, 30 months, and 42months after filing, and periodically there-after. We use the information available af-ter 42 months, The measure of duration isweeks of temporary total benefits paid plusanticipated future weeks paid if the claim isstill open. Since less than 0.5 percent ofcases are open, duration is estimatedrarely.'^ Nevertheless, we set the durationof cases still ongoing at 42 months equal to42 months to eliminate any estimated dura-tions. We restrict the sample to excludeclaims with lump-sum payments since it isdifficult to calculate a duration and a weeklybenefit amount in these cases. Claims in-volving payments other than temporary to-tal benefits and those for which previousearnings are unknown are also excluded."'
To make the before and after groupsshown in Figure 1 as comparable as possi-ble, the upper and lower limits (E, and Ej)on previous earnings for the low-earningsgroup and the lower earnings limit iE-^) forthe high-earnings group are indexed usingstate-level average weekly earnings.'^ Dur-ing the year surrounding the benefit in-crease in Kentucky, average earnings rose8.94 percent. The analogous figure forMichigan is 7.76 percent.
• By 42 months, more than 99.5 percent of claimsare recorded as closed in Kenlucky and Michigan.However, (hese numbers seem to confiici wilh theclaims distribution, which indicates that 0.85 percent ofthe Kentucky claims and 3.15 percent of the Michiganclaims are al least 42 months long.
'The frequency of other types of claims can beseen in Table 3. The frequency of claims with unknownprevious earnings was 0.41 percent in Kentucky andI.H4 percent in Michigan.
Those numbers are used because they are at thestate level, have broad coverage, and are available on aquarterly basis so they match the qualifying periodswell. The average wage data are unpublished but wereprovided by Cindy Ambler of the U.S. Department ofLabor. In Kentucky, the nominal values of £ , . E-,, and£ , are $h6.00. $196.50, and $298.79. respectively, be-fore the increase, and $71.90. $214.07. and $325.50after the increase. In Michigan, the values are $216.00,$271.5(1, and $556.79 before the increase and $232.76,$292.57, and $600.lK) after the increase.
Table 1 reports some summary measuresof the change in benefit structure in Ken-tucky and Michigan. In both states, the frac-tion of previous earnings replaced by work-ers' compensation rises dramatically for thehigh-earnings group which received thebenefit increase, but remains constant forlow-earnings individuals who are unaffectedby the increase. A very similar pattern isevident for the real benefit amount. Thepercentage rise for the high-earnings groupin Michigan is not as high as the rise in themaximum benefit for the reasons given inSection I. Previous earnings and the frac-tion of claims filed by males are very similarbefore and after the benefit increases inboth states and earnings groups. There aresome changes in the composition of claimsby industry, but they go in different direc-tions for the two states. Since the empiricalresults are very similar when done sepa-rately for the three industry groups, thechanges in composition did not bias theresults discussed in Section III below.Moreover, the regression analysis in SectionIV explicitly accounts for changes in theindustry mix.
Table 2 reports the composition of thesample by injury type. The large injury cate-gories arc a fairly stable fraction of the totalin Kentucky. Michigan is less stable, with anotable decline in injuries to upper extremi-ties for high-earnings individuals. Again, theregression analysis below controls for injurytype.
As the data in Table 3 indicate, the fre-quency of the different benefit types forhigh-earnings claims relative to low-earn-ings claims does change somewhat, but thechanges are in opposite directions for thetwo states. In Kentucky there is a relativeincrease in the temporary total fraction ofclaims for high-earnings individuals, whilein Michigan there is a relative increase forlow-earnings individuals. A similarly mixedpattern is also evident in the frequency oflump-sum payments in the two states. Thereis no consistent pattern to the changes inclaim composition. Furthermore, since bothof these changes affect a very small percent-age of the sample, they are unlikely to haveappreciable effects on statistics like the
328 THE AMERICAN ECONOMIC REVIEW JUNE 1995
REPLACEMENT RATES. EARNINGS, AND DHMOGRAPHIC CHARACTERISTICS DURING THE YEARS
BEFORE AND AFTER BENEFIT INCREASES
Variable
Maximum benefit (S)
Replacement rale,high earnings (percent)
Replacement rate,low earnings (percent)
Average benefit (1983 S),high earnings
Average benefit (1983 S).low earnings
Average earnings (1983 $),high earnings
Average earnings (1983 S),low earnings
Percentage male,high earnings
Percentage male,low earnings
Percentage manufacturing,high earnings
Percentage manufacturing,low earnings
Percentage construction,high earnings
Percentage construction,low earnings
Sample .sizes:High earningsLow earnings
Beforeincrease
(1)
131.00
32.70(0.25)
66.42(0.20)
151.08(0.96)
118.58(0.64)
475.31(2.45)
179.09(0.89)
94.39(0.66)
64.36(1.16)
15.69(1.04)
30.71(1.12)
20.65(1.15)
9.29(0.70)
1.2331.705
Kentucky
Afterincrease
(2)
217,00
5].02(0.37)
66.66(0.22)
239.09(1.32)
118.26(0.74)
482.41(2.73)
177.54(0.97)
95.78(0.59)
62.88(1,24)
18.80(1.15)
31,52(1.19)
16.55(1,09)
10,48(0,78)
1.1611.527
Percentagechange
(3)
65.65
56.02(1.65)
0.36(0.44)
58.25(1.33)
-0.27(0.82)
1.49(0.78)
-0.86(0.73)
1.47(0.94)
-2.30(2.61)
19.84(10.79)
2.65(5.38)
- 19.85(6.94)
12.81(12.01)
Beforeincrease
(4)
181.00
30.01(0.35)
66.64(0.24)
220.66(1.78)
183.66(0.78)
749.72(7.25)
275.83(0.75)
100.00
73.94(1.81)
36.82(3.12)
44.69(2.06)
34.73(3.08)
12.33(1.36)
239589
Michigan
Afterincrease
(5)
307.00
44.15(0,48)
66,35(0.30)
320.48(2,27)
182.77(0,93)
739.01(7.49)
275.65(0.83)
97,25(1.11)
75,58(1.97)
19.72(2.70)
41.35(2,26)
35.78(3.25)
9.07(1.32)
219477
Percentagechange
(6)
69.61
47.14(2.33)
-0.45(0.58)
45.24(1.56)
-0.45(0.58)
-1.43(1.38)
-0.07(0.40)
-2.75
2.22(3.50)
-46,43(30,01)
-7,48(7,73)
3.03(12.31)
- 26,42(24.81)
Notes: Standard errors are in parentheses. The standard errors for the percentage male in the high-earnings groupcannot be calculated in the usual way. Wages are in 1982 dollars, indexed using state level average weekly earningsfrom the Unemployment Insurance Service.
mean of the natural logarithm of durationwhich is examined below.
One should remember though, that thecomparisons below will be valid as long asany changes in Kentueky and Michigan,other than the inerease in the benefit maxi-mum, affected the high- and low-earningsgroups similarly. In most of the eompar-isons, we examine the durations and medi-cal costs of low-earnings individuals beforeand after the benefit increases in case the
changes we observe for high-earnings indi-viduals were occurring for all groups.
III. Changes in the Distribulionof Injury Durations
In this section we examine whether thelength of receipt of workers' compensationrose after the benefit increases and whetherthere were comparable changes in theseverity of the corresponding injuries.
VOL. 85 NO. 3 MEYERETAL: WORKERS'COMPENSATION AND INJURY DURATION 329
TABLF 2—KENTUCKY AND MICHIGAN: INJURY TYPF_S (PERCENTAGES) DURING THF YEARS BEFOREAND AFTER BENEFIT INC REASES
Injury type
Head, high earnings
Head, low earnings
Neck, high earnings
Neck, low earnings
Upper extremities,high earnings
Upper extremities,low earnings
Trunk, high earnings
Trunk, low earnings
Low back, highearnings
Low back, lowearnings
Lower extremities,high earnings
Lower extremities,low earnings
Other injuries,high earnings
Other injuries,low earnings
Occupational diseases,high earnings
Occupational diseases,low earnings
Sample sizes:High earningsLow earnings
Beforeincrease
(1)
4.38(0.58)
3.40(0.44)
2.27(0.42)
0.88(0.23)
23.76(1.21)
34.13(1,15)
12.41(0.94)
10.26(0.73)
28.71(1.29)
24.69(1.04)
24.98(1,23)
22.99(1.02)
2.51(0.45)
3.05(0.42)
0.97(0,28)
0,59(0.18)
1,2331,705
Kentucky
Afterincrease
(2)
3.36(0,53)
4.32(0.52)
3.19(0.52)
L31(0.29)
23,51(1.24)
33.01(1.20)
12.23(0.96)
9,36(0,75)
28.34(1.32)
26,20(1,13)
24.12(1,26)
21.87(1.06)
4,05(0.58)
3.01(0,44)
1.21(0.32)
0.92(0.24)
1,1611,527
Percentagechange
(3)
- 23.30(15.81)
27,06(22.43)
40,34(34,68)
48.88(50.58)
-1,05(7.27)
-3.31(4,80)
-1.43(10.75)
-8.76(9,77)
-1.30(6.39)
6.09(6.40)
-3.45(6.93)
-4.86(6.24)
61,02(36.67)
-1.23(19.69)
23.90(48,48)
56.32(64.49)
Beforeincrease
(4)
4.18(1,30)
2.72(0.67)
2.51(1,01)
1,19(0.45)
30.96(2.99)
33,11(1,94)
14.23(2.26)
11.38(1.31)
21.34(2.65)
25,64(1.80)
22.59(2.71)
19.35(1.63)
4.18(1,30)
3.74(0.78)
O.(M)
2.89(0.69)
239589
Michigan
Afterincrease
(5)
2.74(1.10)
2.31(0,69)
1.37(0.79)
1,26(0.51)
18.26(2.61)
31.45(2.13)
19.63(2,68)
12,37(1,51)
26.03(2,97)
22.85(1.92)
27.85(3.03)
23,69(1,95)
2,74(1,10)
4.61(0,96)
1,37(0.79)
1,47(0.55)
219477
Percentagechange
(6)
-34.52(33.25)
-15.11(32.84)
-45,43(38.25)
5.84(58.52)
-41.01(10.18)
-5.02(8.50)
38.02(28.92)
8.74(18.22)
21.97(20.56)
-10.87(9,77)
23.28(19.94)
22,40(14.39)
-34.52(33,25)
23,48(36.45)
—
-49.16(22,62)
Notes: Standard errors are in parentheses. The standard errors for the percentage of occupational diseases inMiehigan in the high-earnings group cannot be calculated in the usual way.
330 THE AMERICAN ECONOMIC REVIEW JUNE 1995
TABLE 3- -FREOL'ENCY (PERCENTACIES) OF BF-INEFIT TYPES AND LUMP-SUM PAYMENTS, DIIRING TIIF YEARS
BEFORE AND AFTER BENEFIT INCREASES
Benefit type
Temporary totalHigh earnings
Low earnings
Permanent partialHigh earnings
Low earnings
Other benefitsHigh earnings
Low earnings
Sample sizes:High earningsLow earnings
Temporary total, Itimp sums:High earnings
Low earnings
Sample sizes;High earningsLow earnings
Beforeincrease
(1)
83.63(0.93)
85.74(0,76)
12.06(0.81)
10,04(0.65)
4,31(0.51)
4.22(0.44)
1,6002,132
7.85(0.74)
6.73(0.59)
1,3381,828
Kentucky
Afterincrease
(2)
87.13(0.89)
85.97(0,80)
8.18(0.72)
9.39(0.67)
4.69(0.56)
4.64(0.48)
1,4301,896
6.82(0.71)
6.32(0.60)
1,2461,630
Percentagechange
(3)
4.19(1,57)
0,27(1.28)
-32.17(7.55)
-6 .47(9,02)
8,64(18,21)
9.95(16.11)
-13.07(12.21)
-6.09(12.13)
Beforeincrease
(4)
88.26(1.87)
87.63(L19)
0.67(0,47)
1.05(0.37)
11.07(1.82)
11.32(1.15)
298760
9.13(1.78)
11,56(1.24)
263666
Michigan
Afterincrease
(5)
(1.91)
90.10(1.23)
0.73(0.51)
1.54(0,51)
10.58(1.86)
8,36(1.14)
274586
9.88(1.91)
9.66(1,29)
243528
Percentagechange
(6)
0.49(3,03)
2.82(L99)
8.76(108.38)
45.90(70.44)
-4,42(22,97)
-26.11(12.59)
8.23(29.72)
-16,46(14.28)
Notes: Standard errors are in parentheses. The benefit types require some explanation: "other" includes combina-tions of benefit types, permanent total, temporary partial, and death.
Table 4 reports measures of the durationand the total medical costs of claims inKentucky and Michigan for the year beforeand the year after the benefit increases. Wereport the mean, median, 75th perccntile,and the mean of the natural logarithm ofduration,'*^ We emphasize the mean of the
Approximately 5 percent of the durations arerecorded as zero (see Table 5) because insurance com-panies are instructed to round duration to the nearestwhole number of weeks. Since these durations lie inthe interval (0.0, 0,5), we set their values to the mid-point of the interval (i.e., 0,25) before taking loga-rithms. With this recording, each observation is coded
logarithm of duration because this statisticis hkely to be more precisely measured andless susceptible to the influence of a fewlarge observations. This issue of robustnessis important here since the distribution ofclaim lengths has a few large values, butmost values are small. The median in mostgroups is 5 weeks or less, but 2 percent ofthe observations are at least 182 weeks (3Tyears). The mean of the untransformed data
to the midpoint of its interval of true values, Wben weadd 0.5 to all observations or exclude all zeros theresults are very similar to those reported here.
TABLE 4—KPNTIICKY AND MicniCiAN: DURATION AND MEDICAL COSTS OF TEMPORARY TOTAL DISABILITIESDURING THE YEARS BEEORE AND AFTER BENEFIT INCREASES
Variable
Mean duration (weeks)Kenlucky
Michigan
Median duration (weeks)Kentucky
Michigan
75th percentile. duration (weeks)Kenlucky
Michigan
Mean of log durationKentucky
Michigan
Mean medical cost (dollars)Kentucky
Michigan
Median medical cost (dollars)Kentucky
Michigan
75th percenlile, cost (dollars)
Kentucky
Michigan
Mean of log costKentucky
Michigan
Sannple size:KentuckyMichigan
High earnings
Beforeincrease
(1)
11.16((1.S3)14.76(2.25)
4,on(0.14)5.00
(0.45)
8.00(0.28)10.00(0.74)
1.38(0.04)1.58
(0.09)
3,298.96(1,885.93)2,229.41(293.93)
393.51(19.29)689.73(77.30)
1,335.71(103.08)
2,284.60(178.51)
6.09(0.05)6.56
(0.11)
1,233239
Afterincrease
(2)
12.89(0.83)19.42(2,67)
5,(10(0.20)7,IH)
(0.67)
10.00(0.45)14.00(1.88)
1.58(0.04)1.87
(0.10)
1,688.67(116.59)
2.585.23(364.76)
411.49(22.72)765.00
(134.53)
1,686.40(122.95)
2,379.00(284.80)
6.24(0.05)6.59
(0.13)
1,161219
Low earnings
Beforeincrease
(3)
6.25(0.30)10.94(1,09)
3.00(0.11)4.00
(0.22)
7.00(0.21)8.50
(0.54)
1.13(0.03)1.41
(0.06)
878.20(78.07)
1,538.22(188.49)
238.96(8.48)
390.63(32.80)
864.94(72.24)
1,383.93(155.69)
5.61(0.04)5-85
(0.09)
1,705589
Afterincrease
(4)
7.01(0.41)13.64(1.56)
3.00(0.12)4.00
(0.28)
7.00(0.24)9,00
(0.57)
1.13(0.03)
1.51(0.06)
1,155.98(157.26)
2,017.65(304.83)
254.40(9.11)
435.00(33.09)
867,53(69,78)
1,822.00(145.49)
5.69(0.04)6.10
(0.09)
1,527477
Differences
[(2)-(l)](5)
1.72(1.17)4.66
(3.49)
1.00(0,25)2,00
(0.81)
2,00(0.53)4,00
(2,03)
0.20(0.05)0,29
(0.13)
-1.610,29(l.H89,53)
355.82(468.45)
17,98(29,80)75.27
(155,16)
350,69(160.45)
94.40(336.12)
0.15(0.07)0.03
(0.17)
1(4)-(3)1(6)
0.76(0.51)2.70
(l.W)
0.00(0.16)0.00
(0.35)
0,00(0.32)0.50
(0.79)
0.01(0.04)0.10
(0.08)
277.78(175.57)479,43
(358.40)
15,44(12,44)44,38
(46,59)
2.59(100.44)438.07
(213.09)
0,08(0,06)0,25
(0,12)
Differencein differences
[(5)-(6)](7)
0.96(1.28)1.96
(3.97)
1.00(0.29)2.00
(0.89)
2.00(0.62)3.50
(2.17)
0,19(0,07)0,19
(0,16)
- 1,888.07(1,897.67)- 123.61(589.83)
2,55(32.30)30.89
(162.00)
348.10(189.29)
-343,67(397.98)
0.07(0.09)
-0.22(0,21)
Notes: Standard errors are in parentheses. Medical costs are in 1982 dollars, indexed using the medical-carecomponent of the CPI, The standard errors of the median and 75th percentile are calculated using the formulareported in Bickel and Doksum (1977 p. 400). The density functions of the duration and medical-cost distributionsare estimated using a histogram wilh intervals of 3 weeks and 5 weeks around the median and 75th percentile ofduration, re.spectively, and $200 and S400 around the median and 75th percentile of costs, respectively.
332 THE AMERICAN ECONOMIC REVIEW JUNE 1995
is susceptible to large changes due to a fewobservations.'^
Column 5 of the upper panel of Table 4reports the change in duration for high-earnings individuals after the increase, asindicated by each of the summary statisticsfor the two states. There are large increasesin the mean duration in both states, but thestandard errors are almost as large as thechanges. The imprecision of the mean is notsurprising in this data set given the skew-ness of the data. Similar increases occur inthe median and 75th percentile of the dura-tion distribution. While the standard errorson these percentiles suggest that thesechanges are significant, the standard errorsare only approximate, as they assume a con-tinuous distribution while the duration dis-tribution is discrete and coarse.^" The meanof the logarithm avoids the problems of themean and percentiles: it has fairly smallstandard errors that can be estimated well.There are large and statistically significantincreases in the logarithm of duration oftemporary total claims after the benefit in-creases for the high-earnings group in bothstates. In Kentucky, mean durations rise by20 percent and in Michigan by 29 percent.Both of these increases are significant at the0.05 percent level.
In case there were events common toboth high- and low-earnings groups we re-port changes over the same period for thelow-earnings group in column 6, which wasnot subject to the benefit increases. Thepoint estimates for the mean of durationindicate increases about half as large asthose for high-earnings claims, but again theestimates are very imprecise. The mean ofthe logarithm, median, and 75th percentileindicate that the low-earnings group did notexperience any significant change in dura-tion. All of the statistics in both states indi-cate that there was only the slightest change,
For an excellent introduction to robustness andthe sensitivity of the mean see Peter J. Bickel and KjellDoksum (1977 pp. 369-78). Also see Takeshi Amemiya(1985 pp. 70-9),
' The standard errors of the median and 75th per-centile are calculated using the formula reported inBickel and Doksum (1977 p. 4(X)),
if any, for the low-earnings group, exceptfor a moderate 10-percent change in thelogarithm of duration in Michigan that isstatistically insignificant.
Difference-in-diiference estimates, whileless precise, can be used to remove any biasdue to changes over time in factors that arecommon to the high- and low-earningsgroups. Column 7 reports Ihe change induration for high-earnings individuals minusthe comparable change for low-earnings in-dividuals. These numbers indicate a largeand significant relative increase in the loga-rithm of duration for the high-earningsgroup in Kentucky, with a similar magni-tude but insignificant increase in Michigan.There are moderate increases for both statesin the untransformed mean, but they areimprecisely measured. The median and 75thpercentile indicate changes slightly largerthan those for the logarithm of duration,but the standard errors should be inter-preted with caution, as indicated earlier.
These changes in duration do not appearto be the result of changes in the severity ofinjuries. The comparability of the claimsfrom the year before the increases to thosethe year after the benefit increases is gener-ally supported by the numbers on total med-ical costs associated with the claims. Thesenumbers, reported in the second panel ofTable 4, show that the high- and low-earn-ings groups experience similar increases inmedian costs, probably due to a general risein medical costs.^' The mean of the loga-rithm^^ and the 75th percentile of totalmedical cost show a relative increase incosts for the high-earnings group in Ken-tucky, but a relative decrease in Michigan.The mean of costs in Kentucky shows arelative decrease in severity for the high-earnings group. We should emphasize,though, that none of the d iff ere nee-in-difference estimates is significantly differentfrom zero. Overall, while the duration of
' While the medical-cost figures are indexed usingthe medical-care component of the Consumer PriceIndex, there may be local variation in medicai-costinflation for which we do not adequately control.
^^Before taking logarithms, we set all total medicalexpenses less than $1 equal to $1.
VOL. 85 NO. 3 MEYER ET AL.: WORKERS' COMPENSA TION AND INJURY DURA TION 333
claims subject to the benefit increases rosesubstantially, their average severity as indi-cated by the medical-cost statistics in Table4 does not rise.'-*
The elasticity of the duration of claimswith respect to the temporary total benefitcan be calculated by dividing the changein duration by the percentage change inthe replacement rate for high-earningsclaimants reported in Table 1. Using theestimates for the change in the mean ofthe logarithm of duration in column 5 ofTable 4, the implied elasticities are 0.36 forKentucky and 0.62 for Michigan. ThedifTerence-in-differences estimates of col-umn 7 imply elasticities of 0.34 and 0.40 forthe two states."" These estimates suggestlarge benefit effects on the length of timepeople take to return to work after beinginjured.
Results from Altemative Methodsand Samples
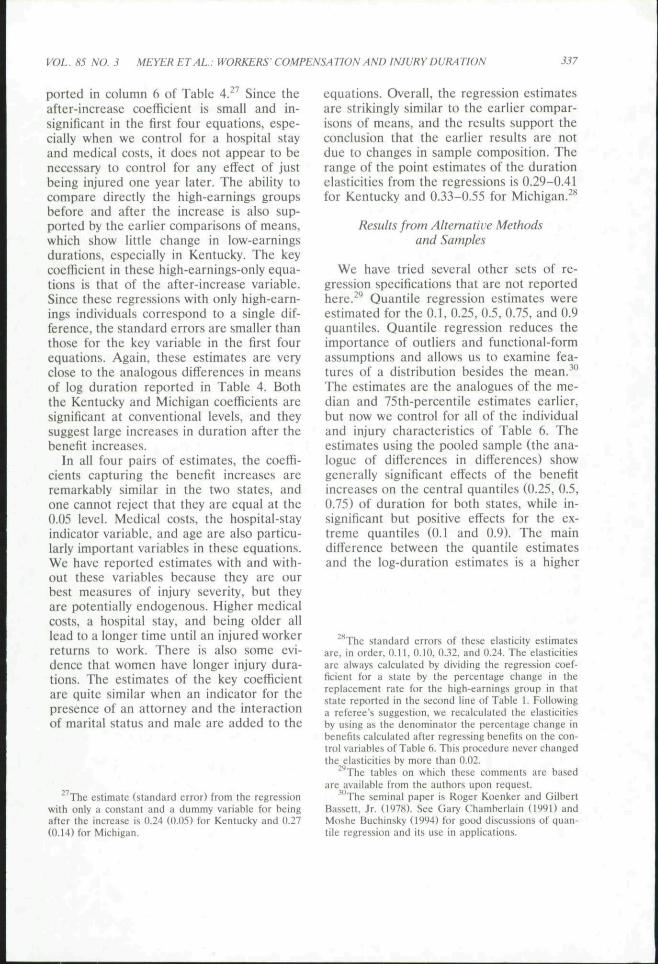
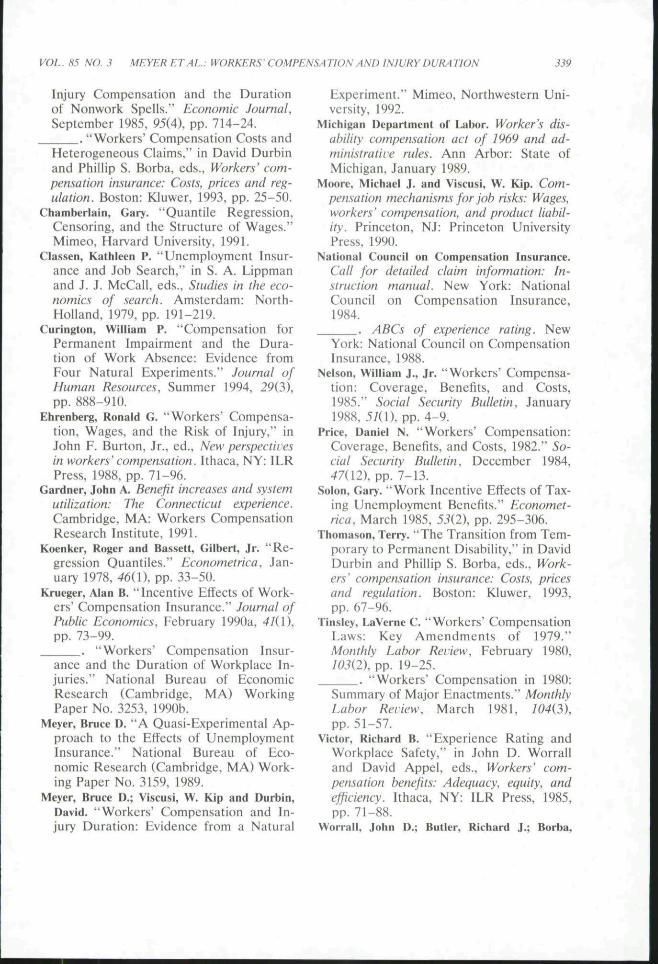
Table 5 reports the change in the entiredistribution of claim lengths after the bene-fit increases for both the high-earnings andlow-earnings groups. The numbers indicatelarge and significant changes through mostof the cumulative distribution for the high-earnings individuals in both states. There islittle change for the low-earnings groups,though some of the small changes are sig-nificant at conventional levels.^^ Figures 2and 3 graphically display the distributionof claim durations for the high-earnings
• If there is any bias in the comparisons of medicalcosts, it would likely go in ihe direction of findingincreases in medical costs for the high-earnings groupif a longer duration mechanically means more doctorvisits independent of severity. It is possible (but un-likely), however, that greater medical costs might meanbetter rehabilitation and thus a speedier return towork. The regression estimates reported here suggestthat this effect is not the dominant one.
"''The standard errors for these four elasticity esti-mates are. in order, 0.09. 0.28, 0.12, and 0,34.
"• While coarse discrete data make it problematic toestimate standard errors of quantiles. the standarderrors of points on the cumulative distribution functionare easily estimated.
individuals before and after the benefit in-creases. Figure 2 is the cumulative distribu-tion of claim durations in Kentucky, whileFigure 3 is the distribution in Michigan.Both states show an increase in all per-centiles of the injury distribution. We per-form Wilcoxon two-sample rank tests to testnonparametrically whether the injury dura-tion distributions are different after thebenefit increases. For high-earnings individ-uals, the test statistics have the significant Pvalues of 0.0004 in Kentucky and 0.0240 inMichigan. The corresponding statistics forthe low-earnings groups are 0.9373 and0.6170. Thus, nonparametric comparisons ofthe distribution of spell lengths show evi-dence of changes in the distribution forhigh-earnings individuals, but no change forlow-earnings individuals.
The changes in duration reported in Table4 are nearly identical when we exclude indi-viduals with injury dates between two weeksbefore and two weeks after the increases.We checked this slightly different sample ofclaims in case there was some ability todelay reporting injuries to receive a higherweekly benefit. The ability to delay report-ing might be possible in the case of somecumulative injuries.
A possible confounding factor in anyanalysis of the effects of benefits is thathigher benefits might induce changes in thecomposition of the population examined. Ifhigher benefits lead more people to makeindemnity claims, then our estimates arelikely to understate the effects of higherbenefits on claim durations. The additionalpeople who file claims when benefits riseare likely to have suffered minor injurieswith short durations, since they had notplanned to submit a claim previously. Onthe other hand, the structure of benefitsmight affect transitions frorri temporarytotal to permanent disability as suggestedby Terry Thomason (1993) and John D.Worrall et al. (1993). The direction in whichour results would be biased by such aneffect is not clear, as we exclude permanentdisabilities from the sample we analyze.Since this effect is likely to apply to a smallnumber of claims relative to the total num-ber of permanent partial claims, there is
334 THE AMERICAN ECONOMIC REVIEW JUNE 1995
~>-Before Increase -o-After Increase
FIGURE 2. KENTUCKY CUMULATIVEDISTRIBUTION OF INJURY DURATION FOR
HIGH-EARNINGS INDIVIDUALS, BEFORE ANDAFTER BENEFIT INCREASE
- • - Before Increase - D - After Increase
F I G U R E 3. M I C H I G A N CUMULATIVI : DISTRIBUTION
OF INJURY D U R A T I O N F O R H I G H - E A R N I N G S
INDIVIDUALS, B E F O R E AND A F T E R B E N E F I T
INCREASE
TABLE 5—CUMULATIVE DISTRIBUTION FUNCTIONS OF CLAIM DURATION, DURING THE YEAR AFTER BENEFITINCREASES, AND THE DIFFERENCE FROM THE YEAR BEFORE
unlikely to be an appreciable effect on themean of the natural logarithm emphasizedabove. While a few large observations cangreatly affect a mean, they will likely haveless of an effect on the mean of the naturallogarithm or the median. One should alsonote that there is very little evidence of anincrease in the severity of the claims asmeasured by medical costs. Therefore, wethink that any effects of changes in thecomposition of the population examined arelikely to be small. In addition, we can adjustfor the effects of changes in observablecharacteristics of claimants. We turn to thisissue in the next section.
IV. Regression Estimates ofthe Changesin Duration
To account for possible changes in thecomposition of the sample after the benefitincreases, we estimate a series of regressionequations that control for all of the avail-able characteristics of the worker, the job,and the injury. Specifically, the estimates inTable 6 control for worker age, marital sta-tus, sex, industry, and the severity of theinjury as measured by medical costs, hospi-tal days, and type of injury. The specifica-tions that we try are the regression ana-logue of the differences and difference indifferences of Table 4. In all of the equa-tions, the dependent variable is the natu-ral logarithm of duration, measured inweeks. In the absence of censoring and time-varying explanatory variables, the commonlyused exponential, Weibull, and log-logistichazard models with and without unobservedheterogeneity are special cases of log-duration regression. These listed hazardmodels assume particular distributions forthe error term which log-duration regres-sion allows us to leave unspecified. Thesample sizes are slightly smaller than thoseearlier because of missing variables. In al-most all cases the missing variable is maritalstatus.
Two sets of specifications are estimated:specifications (i)-(iv), which pool high- andlow-earnings individuals, and specifications(v)-(vili) with only high-earnings workers.Variables in the pooled estimates explicitly
take into account two possibly confoundingdeterminants of spell lengths in the sample.An indicator variable for whether the obser-vation is after the benefit increase ("after-increase" variable) removes any effect ofbeing after the increase that is common toboth the high-earnings and low-earningsgroups. The high-earnings variable and theln(previous earnings) x high-earnings-groupinteraction variable net out any time-in-variant differences between the high-earn-ings and low-earnings groups. The key vari-able to interpret in these pooled estimatesis the third variable appearing in Table6—the interaction between an observation'sbeing after the increase and in the high-earnings group. This dummy variable is anindicator for the group which experiencedthe increase in benefits, and it measures thepercentage change in duration associatedwith the benefit increase. The coefficienthas the expected positive sign in both statesand is significant at conventional levels inKentucky.
It is important to note that these esti-mates are quite similar in size and signifi-cance to the difference of the differences inmean log duration reported in Table 4. Thesimilarity is not surprising since the after-increase X high-earnings-group coefficient isthe regression analogue of the difference incolumn 5 minus the difference in column 6in that table. If only a constant and the firstthree dummy variables are included, theregression should reproduce this differenceof differences.^**
For the second set of estimates, reportedin columns (v)-(viii) of Table 6, we use onlythe high-earnings observations. These esti-mates correspond to the difference in themean of the logarithm of duration as re-
" The standard error will only be Ihe same if oneallows the four groups to have different error vari-ances. There will be some slight differences since ourregressions assume homoscedasticity and use a slightlysmaller sample because of missing values of somevariables. For tbe key coefficient, tbe estimate (stan-dard error) from tbe regression with only dummy vari-ables is 0.23 (0,07) for Kentucky and 0.20 (0.16) forMichigan.
336 THE AMERICAN ECONOMIC REVIEW JUNE 1995
TABLE 6- -RF_GRF-SSI(>N EQUATIONS FOR NATURAL LOGARITHM OF DURATION. HIGH- AND LOW-EARNINGS
Notes: The dependent variable is In(duration). A constant is included in each equation. Standard errors are inparentheses. The omitled industry is "other industries," and the omitted injury is "other injuries." The sample sizesare slightly smaller than those in the earlier tables because of missing data for marital status. PTevious wage andmedical costs are in 1982 dollars.
VOL NO. 3 MEYERETAL: WORKERS COMPENSATION AND INJURY DURATION 337
ported in column 6 of Table 4 . " Since theafter-increase coefficient is small and in-significant in the first four equations, espe-cially when we control for a hospital stayand medical costs, it does not appear to benecessary to control for any effect of justbeing injured one year later. The ability tocompare directly the high-earnings groupsbefore and after the increase is also sup-ported by the earlier comparisons of means,which show little change in low-earningsdurations, especially in Kentucky. The keycoefficient in these high-earnings-only equa-tions is that of the after-increase variable.Since these regressions with only high-earn-ings individuals correspond to a single dif-ference, the standard errors are smaller thanthose for the key variable in the first fourequations. Again, these estimates are veryclose to the analogous differences in meansof log duration reported in Table 4. Boththe Kentucky and Michigan coefficients aresignificant at conventional levels, and theysuggest large increases in duration after thebenefit increases.
In ail four pairs of estimates, the coeffi-cients capturing the benefit increases areremarkably similar in the two states, andone cannot reject that they are equal at the0.05 level. Medical costs, the hospital-stayindicator variable, and age are also particu-larly important variables in these equations.We have reported estimates with and with-out these variables because they arc ourbest measures of injury severity, but theyare potentially endogenous. Higher medicalcosts, a hospital stay, and being older alllead to a longer time until an injured workerreturns to work. There is also some evi-dence that women have longer injury dura-tions. The estimates of the key eoefficientare quite similar when an indicator for thepresence of an attorney and the interactionof marital status and male are added to the
The estimate (standard error) from tbe regressionwith only a constant and a dummy variable for beingafter ihe increase is 0.24 (0.05) for Kentucky and 0.27(0.14) for Michigan.
equations. Overall, the regression estimatesarc strikingly similar to the earlier compar-isons of means, and the results support theconclusion that the earlier results are notdue to changes in sample composition. Therange of the point estimates of the durationelasticities from the regressions is 0.29-0.41for Kentucky and 0.33-0.55 for Michigan.̂ **
Results from Alternative Methodsand Samples
We have tried several other sets of re-gression specifications that are not reportedhere.^'' Quantile regression estimates wereestimated for the 0.1, 0.25, ().5, 0.75, and 0.9quantiles. Quantile regression reduces theimportance of outliers and functional-formassumptions and allows us to examine fea-tures of a distribution besides the mean."^"The estimates are the analogues of the me-dian and 75th-percentile estimates earlier,but now we control for all of the individualand injury characteristics of Table 6. Theestimates using the pooled sample (the ana-logue of differences in differences) showgenerally significant effects of the benefitincreases on the central quantiles (0.25, 0.5,0.75) of duration for both states, while in-significant but positive effects for the ex-treme quantiles (0.1 and 0.9). The maindifference between the quantile estimatesand the log-duration estimates is a higher
The standard errors of tbese elasticity estimatesare, in order, O.I I, 0.10. 0.32. and 0.24. The elasticitiesare always calculated by dividing the regression coef-ticienl for a state by the percentage change in thereplacement rate for ihe high-earnings group In tbatstate reported in Ihe second line of Table 1. Followinga referee's suggestion, we recalculated the elasticitiesby using as the denominator the percentage change inbenefits calculated after regressing benefits on the con-trol variables of Table 6. Tbis procedure never changedtbe elasticities by more than 0.02.
The tables on which ihese comments are basedare available from the authors upon requcsl.
' Tbe seminal paper is Roger Koenker and GilbertBassett, Jr. (1978). See Gary Chamberlain (IMQl) andMoshe Bucbinsky (1994) for good discussions of quan-tite regression and its use in applications.
338 THE AMERICAN ECONOMIC REVIEW JUNE 1995
degree of significance for the Michigan esti-mates under quantile regression.
We also tried an alternative sample ofclaims which includes the large number ofindividuals who receive higher benefits un-der the new workers' compensation laws butless than the maximum (those with previousearnings between £ . and £ , in Fig. 1). InMichigan, this group is over seven times aslarge as the high-earnings group, and inKentucky it is slightly larger than the high-earnings group. These observations are usedto provide much more precise estimates ofthe elasticity of injury duration with respectto the benefit amount. The cost of thisapproach is that we assume a linear rela-tionship between the amount of the benefitincrease and the change in duration. Esti-mates with the same individual control vari-ables as in Table 6 are reported in Meyeret al. (1992) and indicate similar elasticityestimates to those reported above, but witha much higher degree of significance, espe-cially in Michigan.
V. Conclusions
The results of this study suggest a sub-stantial effect of the level of temporary totalbenefits on the duration of workers' com-pensation claims. The Kentucky estimatesare generally significantly different fromzero., while the Michigan estimates are simi-lar in magnitude to the Kentucky estimatesbut are less precisely measured and gener-ally not significantly different from zero.The elasticities range from 0.27 to 0.62, withmost clustering between 0.3 and 0.4. Over-all, the elasticity estimates are very similarin the two states. These results suggest sub-stantial labor-supply effects of workers'compensation benefits. Our elasticity esti-mates tend to be toward the high end ofthose found in work which does not rely ona natural-experiment approach such asRichard J. Butler and Worrali (1985, 1993)and Worrall et al. (1988). These authorsexamined low-back injuries in Illinois andfound elasticities between 0.2 and 0.4, de-pending on the statistical technique used.When they examined data pooled from 13
states, however, they did not find a consis-tent relationship between the level of bene-fits and the length of spells.
On the other hand, subsequent paperswhich have followed our approach and ex-amined the effects of benefit increases tendto find larger duration elasticities. Krueger(199()b) examines a period nine months be-fore and three months after a 5-percentincrease in the benefit minimum and maxi-mum in Minnesota and finds elasticities ofover 1.5. John A. Gardner (1991) examinesa three-year period before and after a 50-perccnt increase in Connecticut and findsan elasticity of nearly 1. William P. Curing-ton (1994) examines four increases in bene-fits over a 14-year period in New York state.He focuses on permanent partial claims andfinds elasticities near 1 for severe impair-ments, but much lower estimates for minorimpairments.
We should caution the reader that thelonger durations that we find after benefitincreases may not indicate a loss in socialwelfare, as longer recovery times may im-prove subsequent health. Higher benefitsmay enable injured workers to completetheir recovery before returning to work. Toexamine this question, we would like to beable to examine health status after an indi-vidual returns to work. Unfortunately, suchan analysis is not possible with availabledata.
Berkowitz, Monroe and Burton, John F., Jr.Permanent disability benefits in workers'compensation. Kalamazoo, MI: UpjohnInstitute. 1987.
Bickel, Peter J. and Doksum, Kjell. Mathemati-cal statistics. Oakland, CA: Holden-Day,1977.
Buchinsky, Moshe. "Changes in the U.S.Wage Structure 1963-^1987: Applicationof Quantile Regression." tconometrica.,March 1994, 62(2), pp. 405-58.
Butler, Richard J. and Worrall, John D. Work
VOL- 85 NO. 3 MEYER ET AL.: WORKERS COMPENSATION AND INJURY DURATION 339
Injury Compensation and the Durationof Nonwork Spells." Economic Journal,September 1985, 9.5(4), pp. 714-24.
. "Workers' Compensation Costs andHeterogeneous Claims," in David Durbinand Phillip S. Borba, eds., Workers' com-pensation insurance: Costs, prices and reg-ulation. Boston: Kluwer, 1993, pp. 25-50.
Chamberlain, Gary. "Ouantile Regression,Censoring, and the Structure of Wages."Mimeo, Harvard University, 1991.
Classen, Kathleen P. "Unemployment Insur-ance and Job Search," in S. A. Lippmanand J. J. McCall, eds.. Studies in the eco-nomics of search. Amsterdam: North-Holland, 1979, pp. 191-219.
Curington, William P. ''Compensation forPermanent Impairment and the Dura-tion of Work Absence: Evidence fromFour Natural Experiments." Journal ofHuman Resources, Summer 1994, 29(3),pp. 888-910.
Ehrenberg, Ronald G. "Workers' Compensa-tion, Wages, and the Risk of Injury," inJohn F. Burton, Jr., ed.. New perspectivesin workers' compensation. Ithaca, NY: ILRPress, 1988, pp. 71-96.
Gardner, John A. Benefit increases and systemutilization: The Connecticut experience.Cambridge, MA: Workers CompensationResearch Institute, 1991.
Koenker, Roger and Bassett, Gilbert, Jr. "Re-gression Ouantiles." Econometrica, Jan-uary 1978, 46(1), pp. 33-50.
Krueger, Alan B. "Incentive Effects of Work-ers' Compensation Insurance." Journal ofPublic Economics, February 1990a, 4I(\),pp. 73-99.
. "Workers' Compensation Insur-ance and the Duration of Workplace In-juries." National Bureau of EconomicResearch (Cambridge, MA) WorkingPaper No. 3253, 1990b.
Meyer, Bruce D. "A Quasi-Experimental Ap-proach to the Effects of UnemploymentInsurance." National Bureau of Eco-nomic Research (Cambridge, MA) Work-ing Paper No. 3159, 1989.
Meyer, Bruce D.; Viscusi, W. Kip and Durbin,David. "Workers' Compensation and In-jury Duration: Evidence from a Natural
Michigan Department of Lahor. Worker's dis-ability compensation act of 1969 and ad-ministrative rules. Ann Arbor: State ofMichigan, January 1989.
Moore, Michael J. and Viscusi, W. Kip. Com-pensation mechanisms for job risks: Wages,workers' compensation, and product liabil-ity. Princeton, NJ: Princeton UniversityPress, 1990.
National Council on Compensation Insurance.Call for detailed claim information: In-struction manual. New York: NationalCouncil on Compensation Insurance,1984.
. ABCs of experience rating. NewYork: National Council on CompensationInsurance. 1988.
Nelson, William J., Jr. "Workers' Compensa-tion; Coverage, Benefits, and Costs,1985." Social Security Bulletin, January1988, 5/(1), pp. 4-9.
Price, Daniel N. "Workers' Compensation:Coverage, Benefits, and Costs, 1982." So-cial Security Bulletin, December 1984,47(12), pp. 7-13.
Solon, Gary. "Work Incentive Effects of Tax-ing Unemployment Benefits." Eeonomet-rica, March 1985, 53(21 pp. 295-306.
Thomason, Terry. "The Transition from Tem-porary to Permanent Disability," in DavidDurbin and Phillip S. Borba, eds.. Work-ers' compensation insurance: Costs, pricesand regulation. Boston: Kluwer, 1993,pp. 67-96.
Tinsley, LaVerne C. "Workers' CompensationLaws: Key Amendments of 1979."Monthlv Labor Review, February f980,!03{2), pp. 19-25.
. "Workers" Compensation in 1980:Summary of Major Enactments." MonthlyEabor Review, March 1981, 704(3),pp. 51-57.
Victor, Richard B. "Experience Rating andWorkplace Safety," in John D. Worralland David Appel, eds.. Workers' com-pensation benefits: Adequacy, equity, andefficiency. Ithaca, NY: ILR Press, 1985,pp. 71-88.
Worrall, John D.; Butler, Richard J.; Borba,
340 THE AMERICAN ECONOMIC REVIEW JUNE 1995
Phillip and Durbin, David. "Estimating the Temporary Total to Permanent Disabil-Exit Rate from Workers' Compensation: ity: A Longitudinal Analysis," in DavidNew Hazard Rate Estimates." Mimeo, Durbin and Phillip S. Borba, eds., Work-Rutgers University, 1988. ers^ compensation insurance: Costs, prices
Worrall, John D.; Durbin, David; Appel, David and regulation. Boston: Kluwer, 1993,and Butler, Richard J. "The Transition from pp. 51-66.