Workers Compensation Insurance: The Role of State Funds, Market Trends and Economic Influences October 12, 2010 Robert P. Hartwig, Ph.D., CPCU, President & Economist Insurance Information Institute 110 William Street New York, NY 10038 Tel: 212.346.5520 Cell: 917.453.1885 [email protected]
Transcript
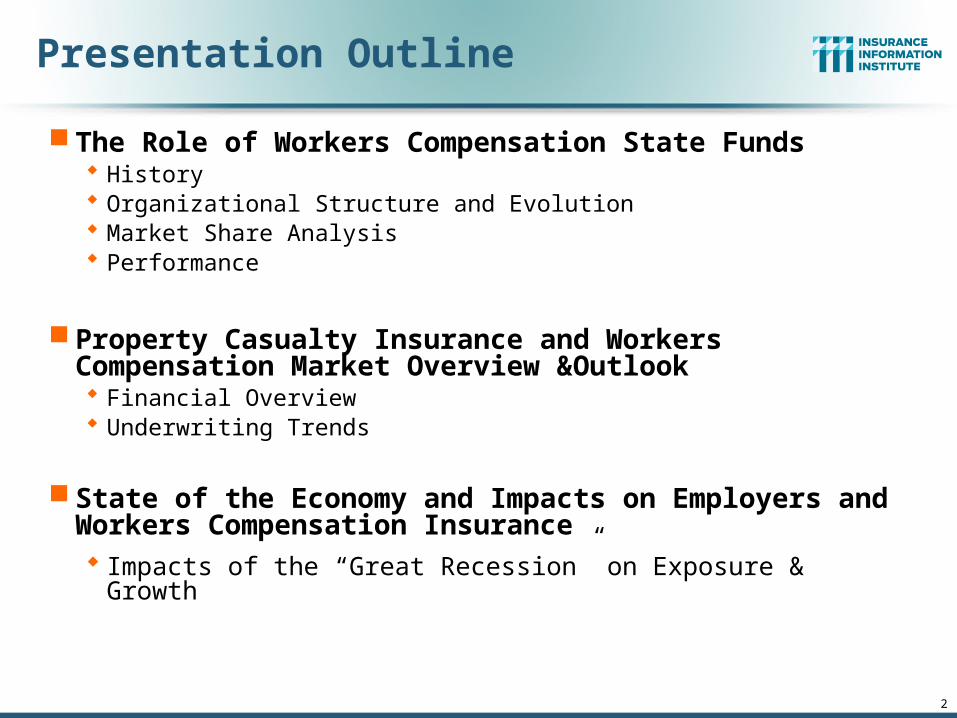
Workers Compensation Insurance: The Role of State Funds, Market
Trends and Economic Influences
October 12, 2010
Robert P. Hartwig, Ph.D., CPCU, President & EconomistInsurance Information Institute 110 William Street New York, NY 10038
State of the Economy and Impacts on Employers and Workers Compensation Insurance Impacts of the “Great Recession” on Exposure & Growth
A Brief History: The Role of Workers
Compensation State Funds
3
Social Policy, History, Economics, Insurance Market Forces and Politics
All Played Important Roles in the Development of Modern WC Systems,
State Funds and Their Structure
4
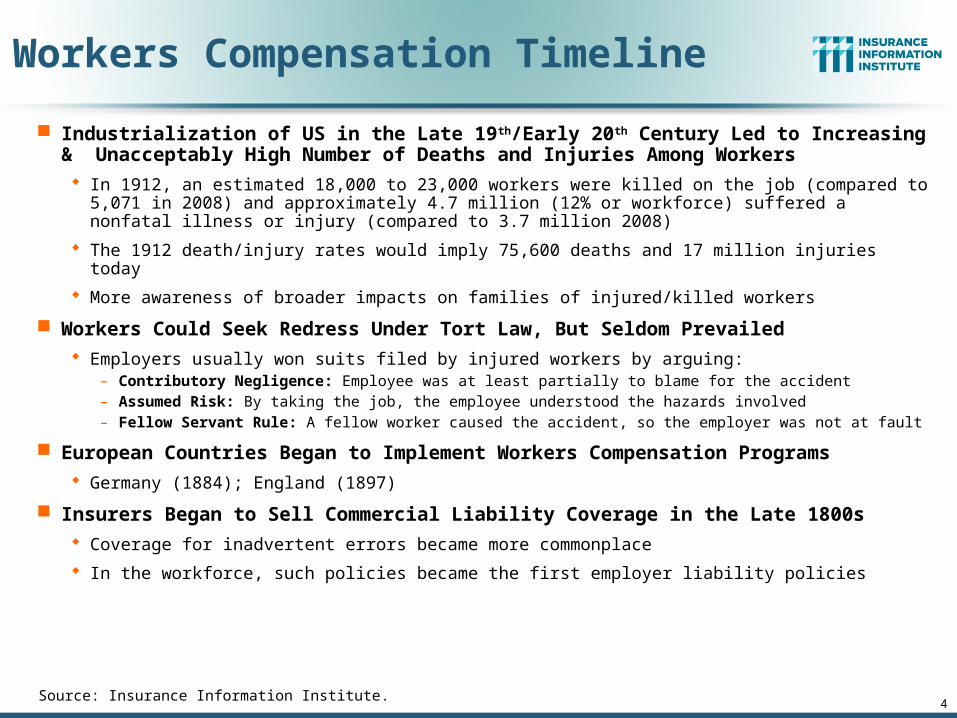
Workers Compensation Timeline
Industrialization of US in the Late 19th/Early 20th Century Led to Increasing & Unacceptably High Number of Deaths and Injuries Among Workers
In 1912, an estimated 18,000 to 23,000 workers were killed on the job (compared to 5,071 in 2008) and approximately 4.7 million (12% or workforce) suffered a nonfatal illness or injury (compared to 3.7 million 2008)
The 1912 death/injury rates would imply 75,600 deaths and 17 million injuries today
More awareness of broader impacts on families of injured/killed workers
Workers Could Seek Redress Under Tort Law, But Seldom Prevailed
Employers usually won suits filed by injured workers by arguing:– Contributory Negligence: Employee was at least partially to blame for the accident– Assumed Risk: By taking the job, the employee understood the hazards involved– Fellow Servant Rule: A fellow worker caused the accident, so the employer was not at fault
European Countries Began to Implement Workers Compensation Programs
Germany (1884); England (1897)
Insurers Began to Sell Commercial Liability Coverage in the Late 1800s
Coverage for inadvertent errors became more commonplace
In the workforce, such policies became the first employer liability policies
Source: http://eh.net/encyclopedia/article/fishback.workers.compensation; Insurance Information Institute.
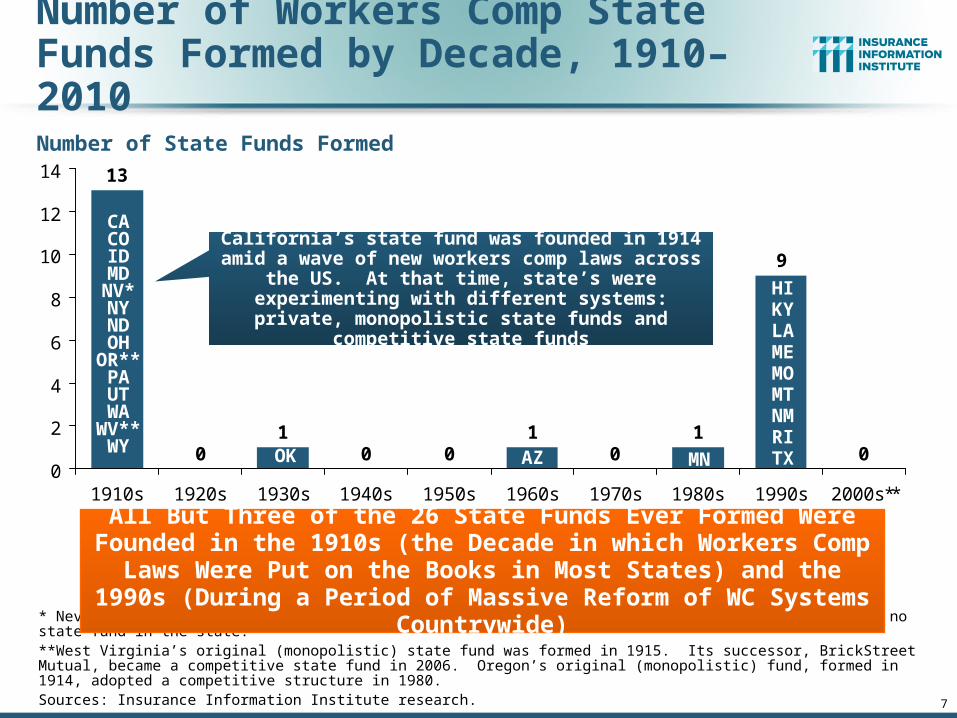
California’s state fund was founded in 1914 amid a wave of new workers comp laws across the US.
New York was the first state to pass a WC law in 1910.
6
The Role of Workers Compensation State Funds: Public Policy & Economic Missions
The Core Public Policy Mission of WC State Funds is to Assure the Availability of Affordable Workers Compensation Coverage to Employers The original catalyst for WC was the recognition that the rapidly increasing number of occupational
injuries and deaths were exacting a high and unfair physical and financial toll on injured workers and their families
Prior to 1920, there was some question whether the private insurance sector could meet the demand and affordably supply this new type of coverage on its own. State funds were a tool for meeting this new public policy objective.
States adopted differing strategies for assuring this obligation was met: competitive and monopolistic state funds whereas others allowed the private sector to satisfy demand (subject to state oversight and regulation)
For the state funds formed in the late 1980s and 1990s, states sought to bring stability to a market where costs were rising rapidly and residual market shares exploding
Secondary Core Public Policy Mission: Reduce Workplace Injuries/Deaths Provision of loss control services and loss sensitive pricing help achieve this goal
Core Economic Mission: Support of the State Economy The availability of affordable WC coverage is a key consideration in many business location and
expansion decisions
This issue is likely increase in importance in the job-starved 2010s
To Operate Self-Sufficiently (i.e., Minimal Public Financial Support)
Source: Insurance Information Institute; Conning.
7
Number of Workers Comp State Funds Formed by Decade, 1910–2010
* Nevada’s monopolistic state fund, founded in 1913, was privatized in 1999. There is currently no state fund in the state.**West Virginia’s original (monopolistic) state fund was formed in 1915. Its successor, BrickStreet Mutual, became a competitive state fund in 2006. Oregon’s original (monopolistic) fund, formed in 1914, adopted a competitive structure in 1980.Sources: Insurance Information Institute research.
Number of State Funds Formed
All But Three of the 26 State Funds Ever Formed Were Founded in the 1910s (the Decade in which Workers Comp Laws Were Put on
the Books in Most States) and the 1990s (During a Period of Massive Reform of WC Systems Countrywide)
California’s state fund was founded in 1914 amid a wave of new workers comp laws across the US. At that time, state’s were experimenting with different
systems: private, monopolistic state funds and competitive state funds
CACOID
MDNV*NYNDOH
OR**PAUTWA
WV**WY OK AZ MN
HIKYLAMEMOMTNMRITX
8
Monopolistic State Funds: Where Are they Today?
State Date started StatusOhio 1911 Still monopolistic
Washington 1911 Monopolistic; referendum sought in 2010
Nevada 1913 State fund privatized in 1999
Oregon 1913 Allowed competition in 1980
West Virginia 1913 Allowed competition in 2008
Wyoming 1915 Still monopolistic
North Dakota 1919 Still monopolistic
Source: Economic History Association, http://eh.net/encyclopedia/article/fishback.workers.compensation, Insurance Information Institute research.
9
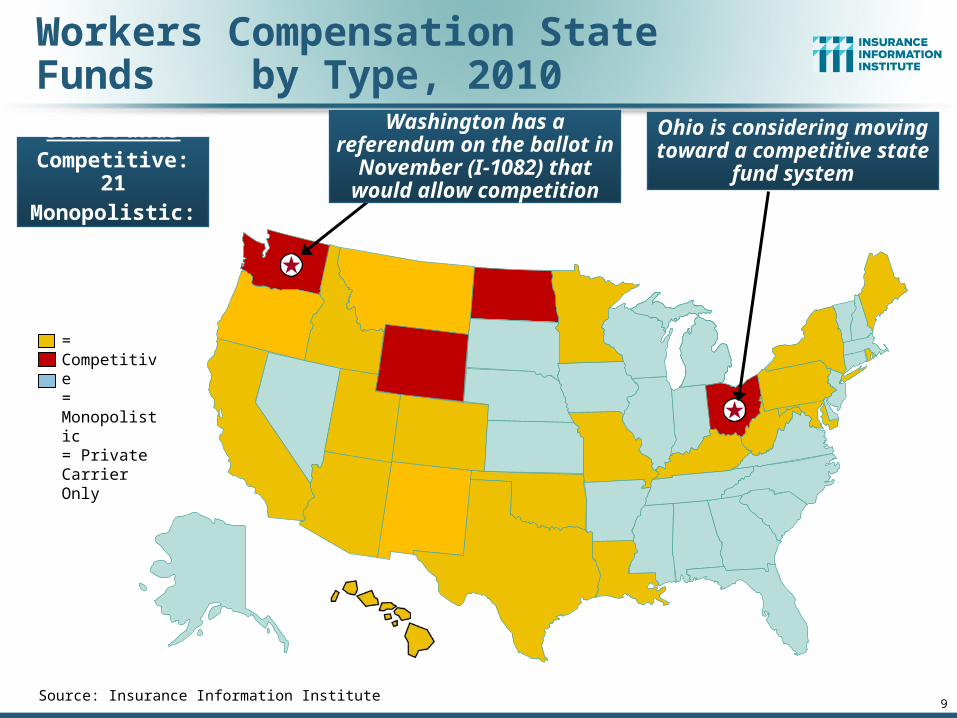
Workers Compensation State Funds by Type, 2010
Source: Insurance Information Institute
Ohio is considering moving toward a competitive state
fund systemState Funds
Competitive: 21Monopolistic: 4
= Competitive= Monopolistic= Private Carrier Only
Washington has a referendum on the ballot in
November (I-1082) that would allow competition
10
Identity Crisis: The Role of State Funds in 2010 and Beyond
The Role and Need for State Funds Is Being Questioned from Within and from Without
Two monopolistic state funds have disappeared in recent years (NV and WV); OH and WA are being challenged.
AZ will convert to a mutual structure by 2013
A number of state funds can write WC risk for companies domiciled in their home state
Several state funds now own subsidiaries that allow them to write risks with no ties to their home state (breach of core mission?)
Factors that Can Lead to Questioning of the Role of WC State Funds
Shrinking Residual Markets
Intense Private Insurer Competition
Prolonged Soft Market
Increasing Options (e.g., Captives, Large Deductible Programs)
Passage of Time Since Last WC Crisis (early 1990s)
State Budget Woes
Source: Insurance Information Institute.
11
The Curious Case of Arizona: Conversion of State Fund to a Mutual Insurer
Arizona Seems to Have Decided it Doesn’t Need a State Fund (As Did NV)
Excerpts from Arizona Senate Bill 1045 (2010 Second Regular Session)
On or before January 1, 2013, the state compensation fund board of directors, which terminates on July 1, 2012 pursuant to section 41-3012.19, Arizona Revised Statutes, shall perform all acts necessary to establish a successor mutual insurer corporation. The successor mutual insurer corporation shall operate to the same extent as any mutual casualty insurer that is licensed and authorized to write insurance in this state, subject to the authority and regulation by the department of insurance pursuant to title 28 20, chapter 4, article 1, Arizona Revised Statutes, and with all the powers and subject to all the laws, rules and requirements of a mutual insurer corporation that is organized under the laws of this state.
The successor mutual insurer corporation is not an agency of this state or a public entity of this state. The successor mutual insurer corporation shall not use the term "state compensation fund" or "SCF" in its new name or logo from and after June 30, 2014.
Source: State of Arizona; Insurance Information Institute.
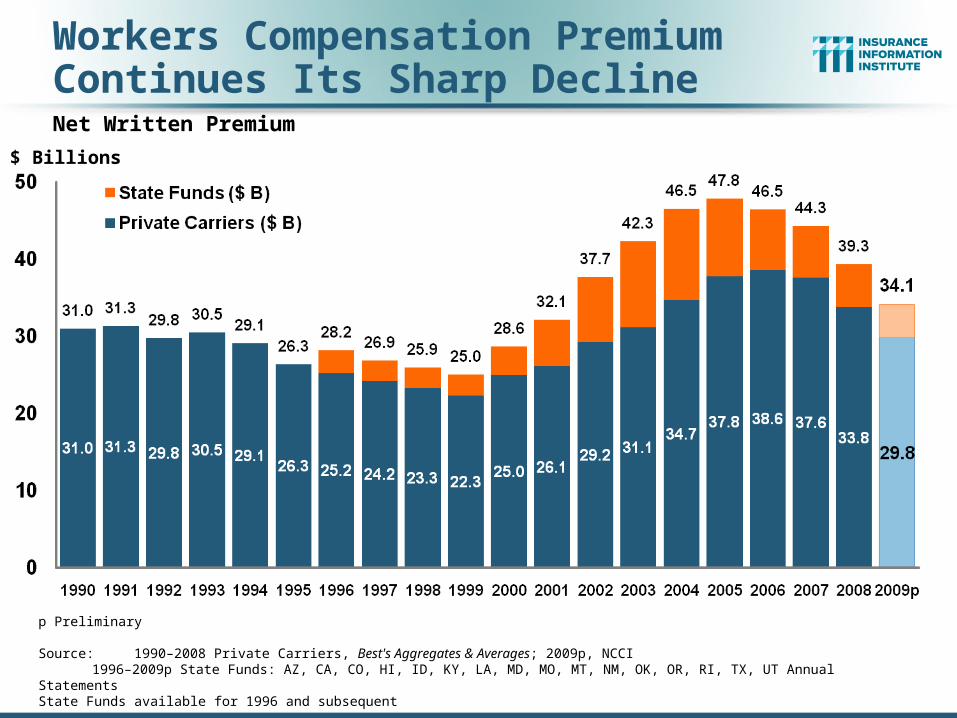
Workers Compensation Premium Continues Its Sharp DeclineNet Written Premium
$ Billions
Calendar Yearp Preliminary
Source: 1990–2008 Private Carriers, Best's Aggregates & Averages; 2009p, NCCI1996–2009p State Funds: AZ, CA, CO, HI, ID, KY, LA, MD, MO, MT, NM, OK, OR, RI, TX, UT Annual Statements
State Funds available for 1996 and subsequent
13
WC Competitive State Fund Market Share,1996 – 2009p
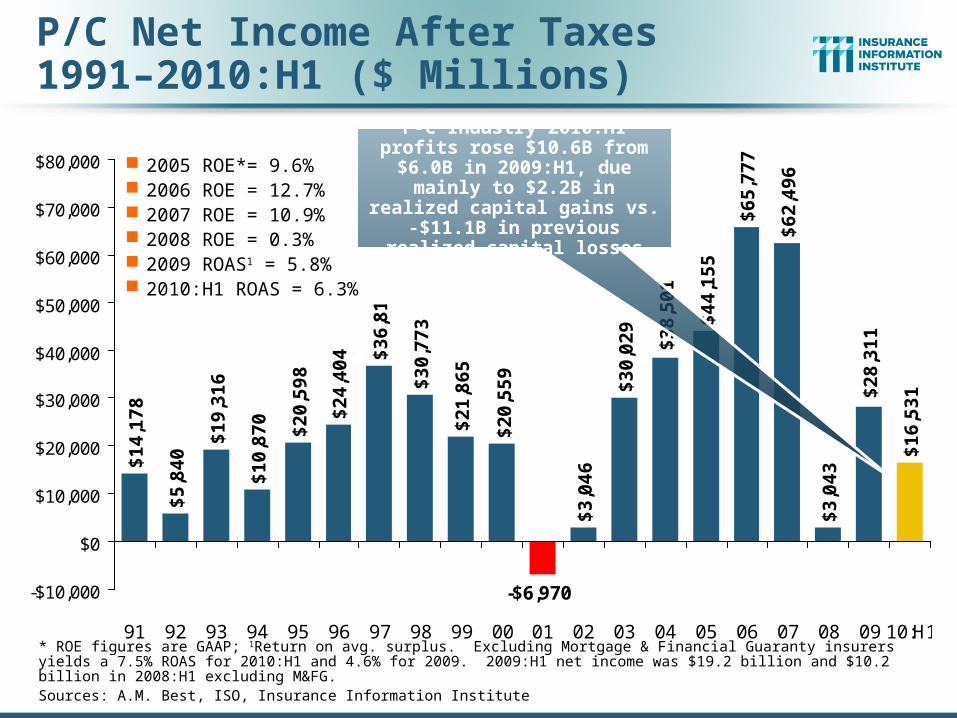
* ROE figures are GAAP; 1Return on avg. surplus. Excluding Mortgage & Financial Guaranty insurers yields a 7.5% ROAS for 2010:H1 and 4.6% for 2009. 2009:H1 net income was $19.2 billion and $10.2 billion in 2008:H1 excluding M&FG.Sources: A.M. Best, ISO, Insurance Information Institute
P-C Industry 2010:H1 profits rose $10.6B from $6.0B in 2009:H1, due mainly to $2.2B in realized
capital gains vs. -$11.1B in previous realized capital losses
20
ROE: P/C vs. All Industries1987–2009*
* Excludes Mortgage & Financial Guarantee in 2008 and 2009.Sources: ISO, Fortune; Insurance Information Institute.
A 100 Combined Ratio Isn’t What ItOnce Was: 90-95 Is Where It’s At Now
Combined Ratio / ROE
* 2009 and 2010:Q1 figures are return on average statutory surplus. 2008, 2009 and 2010:H1figures exclude mortgage and financial guaranty insurersSource: Insurance Information Institute from A.M. Best and ISO data.
97.5
100.6 100.1 100.7
92.6
99.5 100.1101.0
7.5%7.3%
9.6%
15.9%
14.3%
12.7%
4.4%
8.9%
80
85
90
95
100
105
110
1978 1979 2003 2005 2006 2008* 2009* 2010:H1*0%
3%
6%
9%
12%
15%
18%
Combined Ratio ROE*
Combined Ratios Must Be Lower in Today’s DepressedInvestment Environment to Generate Risk Appropriate ROEs
A combined ratio of about 100 generated a 7% ROE in 2009,10% in 2005 and 16% in 1979
P/C Insurer Impairments, 1969–20098
15
12
71
19
34
91
31
21
99
16
14
13
36
49
31 3
45
04
85
56
05
84
12
91
61
23
11
8 19
49 50
47
35
18
14 15
7 65
0
10
20
30
40
50
60
70
69
70
71
72
73
74
75
76
77
78
79
80
81
82
83
84
85
86
87
88
89
90
91
92
93
94
95
96
97
98
99
00
01
02
03
04
05
06
07
08
09
Source: A.M. Best; Insurance Information Institute.
The Number of Impairments Varies Significantly Over the P/C Insurance Cycle, With Peaks Occurring Well into Hard Markets
*Includes $22.5B of paid-in capital from a holding company parent for one insurer’s investment in a non-insurance business
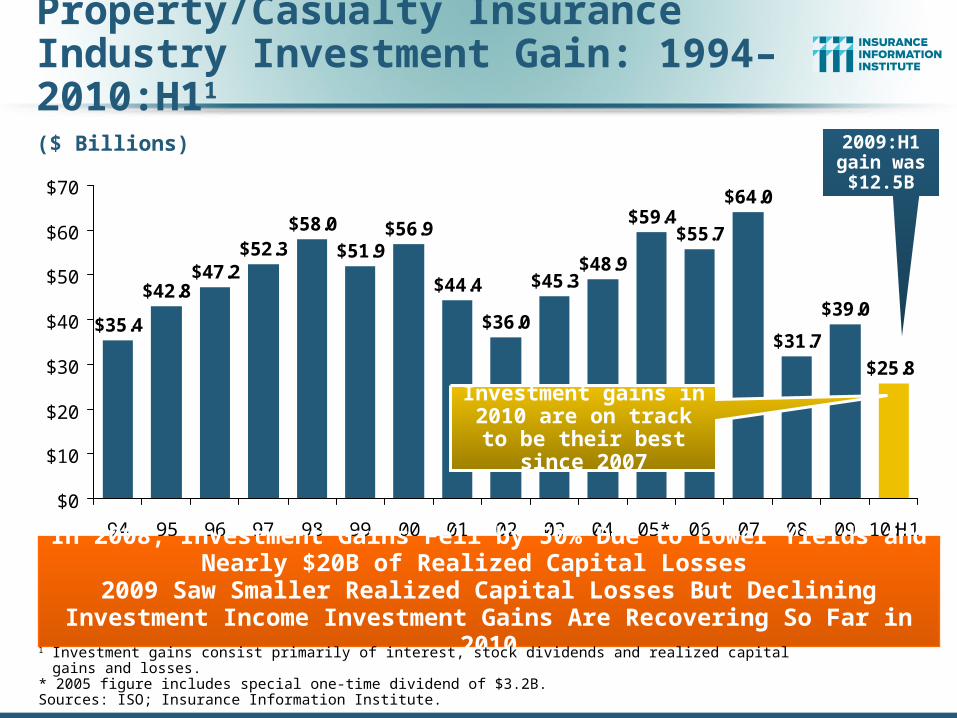
Investment Performance
32
Investments Are a PrincipleSource of Declining Profitability
Property/Casualty Insurance Industry Investment Gain: 1994–2010:H11
$35.4
$42.8$47.2
$52.3
$44.4
$36.0
$45.3$48.9
$59.4$55.7
$64.0
$31.7
$39.0
$25.8
$58.0
$51.9$56.9
$0
$10
$20
$30
$40
$50
$60
$70
94 95 96 97 98 99 00 01 02 03 04 05* 06 07 08 09 10:H1In 2008, Investment Gains Fell by 50% Due to Lower Yields and
Nearly $20B of Realized Capital Losses 2009 Saw Smaller Realized Capital Losses But Declining Investment Income
Investment Gains Are Recovering So Far in 20101 Investment gains consist primarily of interest, stock dividends and realized capital gains and losses.* 2005 figure includes special one-time dividend of $3.2B.Sources: ISO; Insurance Information Institute.
($ Billions) 2009:H1 gain was $12.5B
Investment gains in 2010 are on track to be their best since 2007
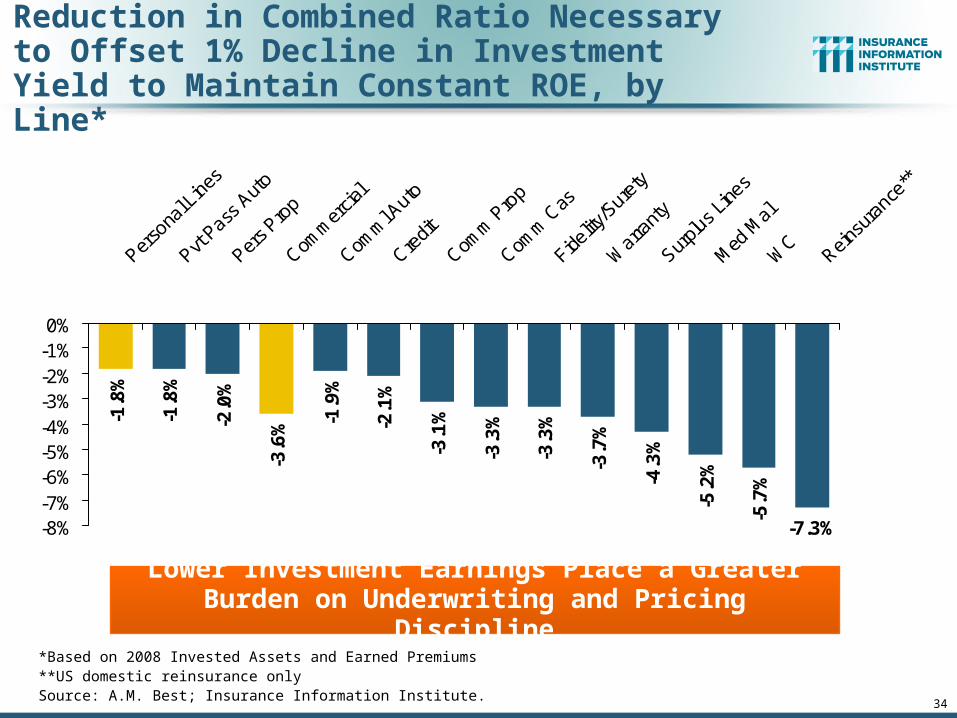
34
-1.8
%
-1.8
%
-2.0
%
-3.6
%
-3.3
%
-3.3
%
-3.7
%
-4.3
%
-5.2
%
-5.7
%
-7.3%
-1.9
%
-2.1
%
-3.1
%
-8%-7%-6%-5%-4%-3%-2%-1%0%
Perso
nal L
ines
Pvt Pass
Aut
o
Pers P
rop
Comm
ercia
l
Comm
l Auto
Credit
Comm
Pro
p
Comm
Cas
Fidelity
/Sure
ty
War
rant
y
Surplu
s Line
s
Med
Mal
WC
Reinsu
ranc
e**
Lower Investment Earnings Place a Greater Burden on Underwriting and Pricing Discipline
*Based on 2008 Invested Assets and Earned Premiums**US domestic reinsurance onlySource: A.M. Best; Insurance Information Institute.
Reduction in Combined Ratio Necessary to Offset 1% Decline in Investment Yield to Maintain Constant ROE, by Line*
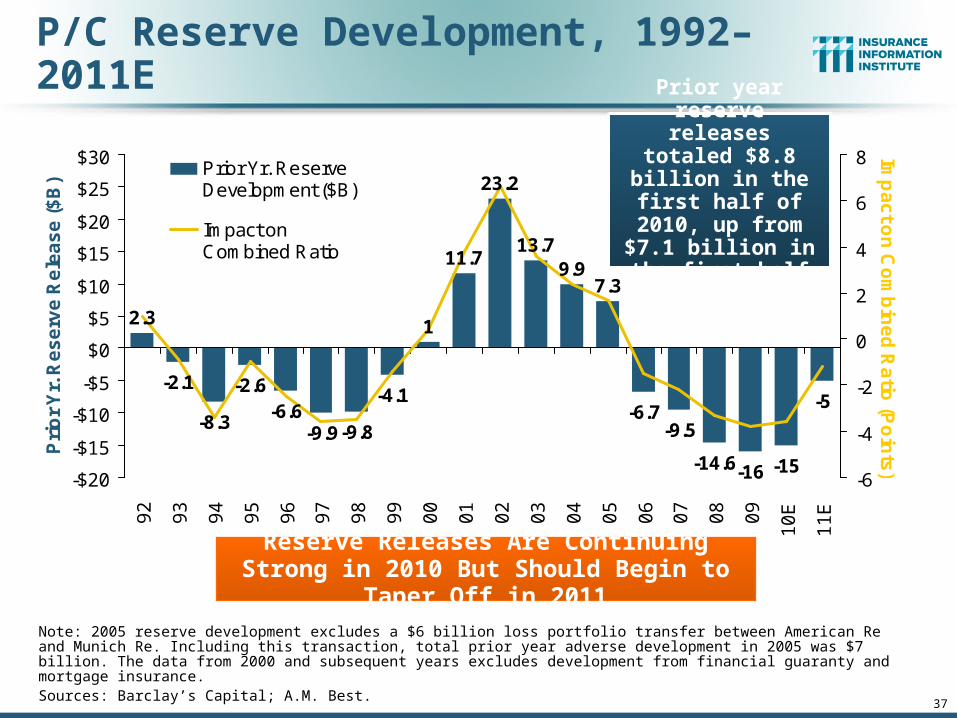
Reserve Releases Are Continuing Strong in 2010 But Should Begin to Taper Off in 2011
Note: 2005 reserve development excludes a $6 billion loss portfolio transfer between American Re and Munich Re. Including this transaction, total prior year adverse development in 2005 was $7 billion. The data from 2000 and subsequent years excludes development from financial guaranty and mortgage insurance. Sources: Barclay’s Capital; A.M. Best.
Prior year reserve releases totaled $8.8 billion in the
first half of 2010, up from $7.1 billion in
the first half of 2009
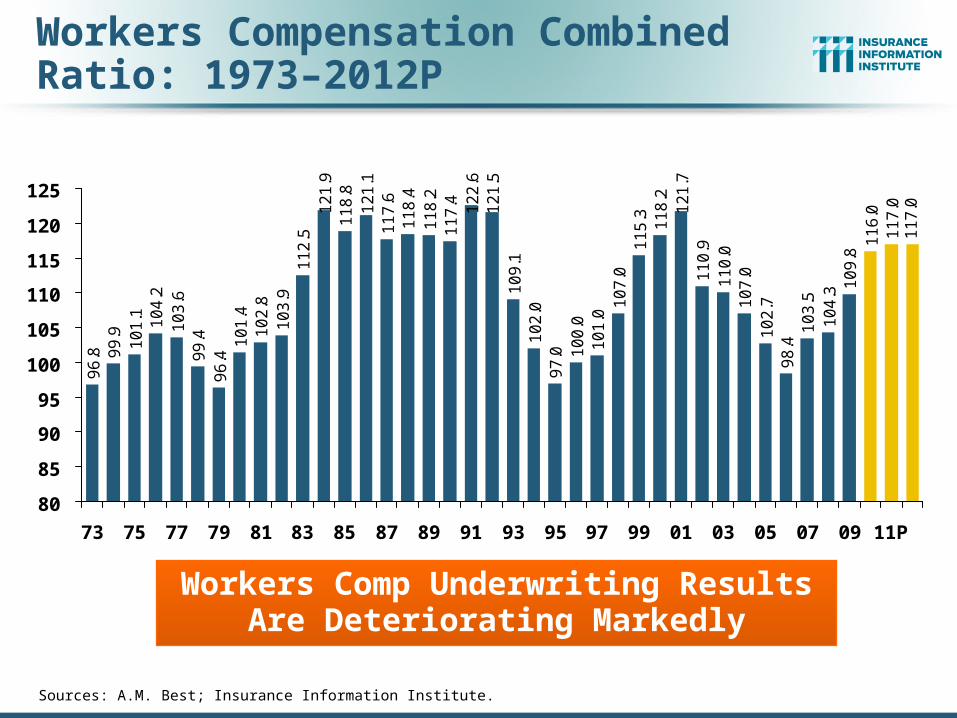
Workers Compensation Operating Environment
38
The Weak Economy and Soft Market Have Made the Workers Comp Operating
Considers all reserve discounts as deficienciesLoss and LAE figures are based on NAIC Annual Statement data for each valuation date and NCCI latest selectionsSource: NCCI analysis
WC Loss and LAE Reserve Deficiency: Private Carriers
Calendar Year Reserve Deficiency Increased in 2009
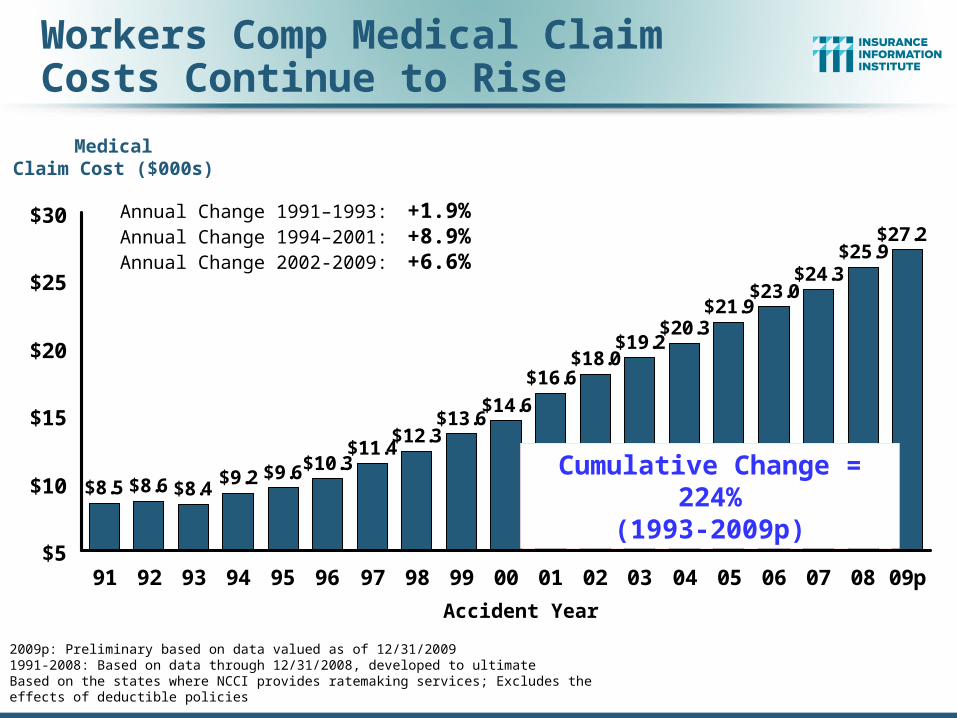
Workers Compensation Medical & Indemnity Claim Cost Trends
41
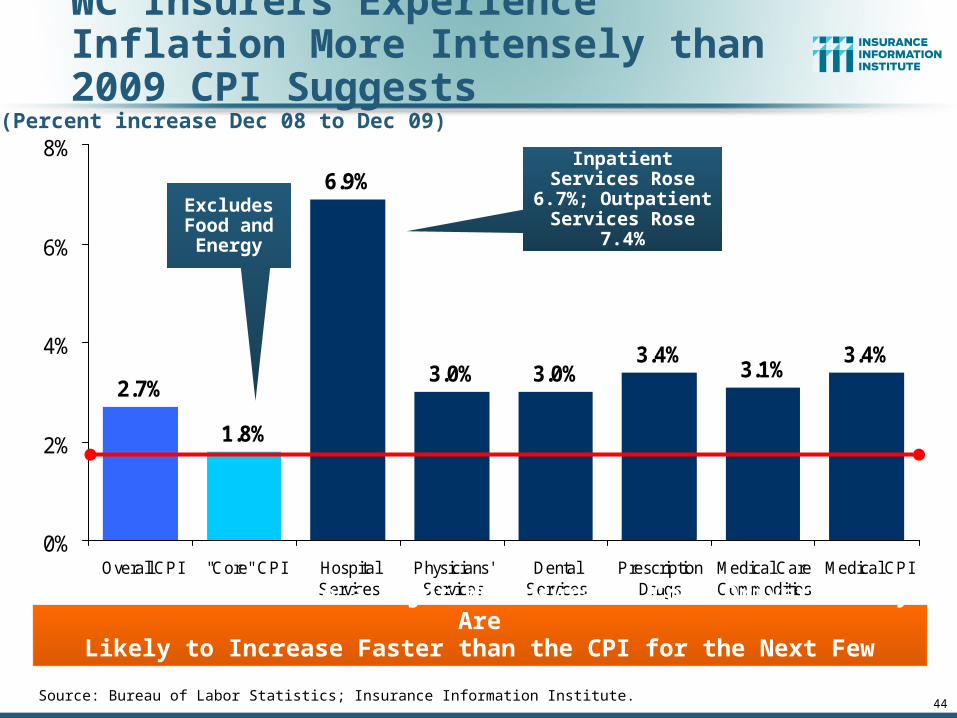
Rising Medical Costs Exert Pressure While Indemnity Costs Rise Well Ahead of
2009p: Preliminary based on data valued as of 12/31/20091991-2008: Based on data through 12/31/2008, developed to ultimateBased on the states where NCCI provides ratemaking services; Excludes the effects of deductible policies
Claim frequency fell in 4.0% in 2009, in part due to the recession
Cumulative Change of -54.7%
(1991 – 2008)
2009p: Preliminary based on data valued as of 12/31/2009; *Frequency is defined as the number of lost-time claims per 100,000 workers.1991-2008: Based on data through 12/31/2008, developed to ultimateBased on the states where NCCI provides ratemaking services including state funds; Excludes the effects of deductible policies
Med Costs Share of Total Costs is Increasing Steadily
Indemnity53%
Medical47%
Source: NCCI (based on states where NCCI provides ratemaking services).
Indemnity48%
Medical52%
Indemnity42%
Medical58%1989
1999
2009p
WC Med Cost Will Equal 2/3 of Total by 2019 if Trends Hold
Source: Insurance Information Institute.
Indemnity33%
Medical67%
2019 Estimate
This trend will likely be
supported by the increased labor
force participation of workers age 55
and older.
Indemnity Claim Cost Trends
48
Indemnity Costs Continue to Rise at a Pace Above Wage Inflation
2009p: Preliminary based on data valued as of 12/31/20091991–2008: Based on data through 12/31/2008, developed to ultimateBased on the states where NCCI provides ratemaking servicesExcludes the effects of deductible policies
Accident Year
+4.5
Workers Comp Indemnity Claim Costs Continue to Grow
+5.8
4.2%
5.2%5.6%
4.7%
6.3%
2.3%
1.1%
2.7%
1.7%
4.7% 4.6%
2.3%
5.9%
7.7%
9.0%
10.1%
4.1%
1.7%
3.1%
5.0% 5.0%5.8%
4.5%
-1.0%
3.5%
3.6%
1.7%
10.1%
9.2%
3.1%
-2%
0%
2%
4%
6%
8%
10%
12%
1995 1997 1999 2001 2003 2005 2007 2009p
Change in CPS Wage Change in Indemnity Cost per Lost-Time Claim
WC Indemnity Severity vs. Wage Inflation
2009p: Preliminary based on data valued as of 12/31/2009; 1991-2008: Based on data through 12/31/2008, developed to ultimate. Based on the states where NCCI provides ratemaking services. Excludes the effects of deductible policies. CPS = Current Population Survey.Source: NCCI
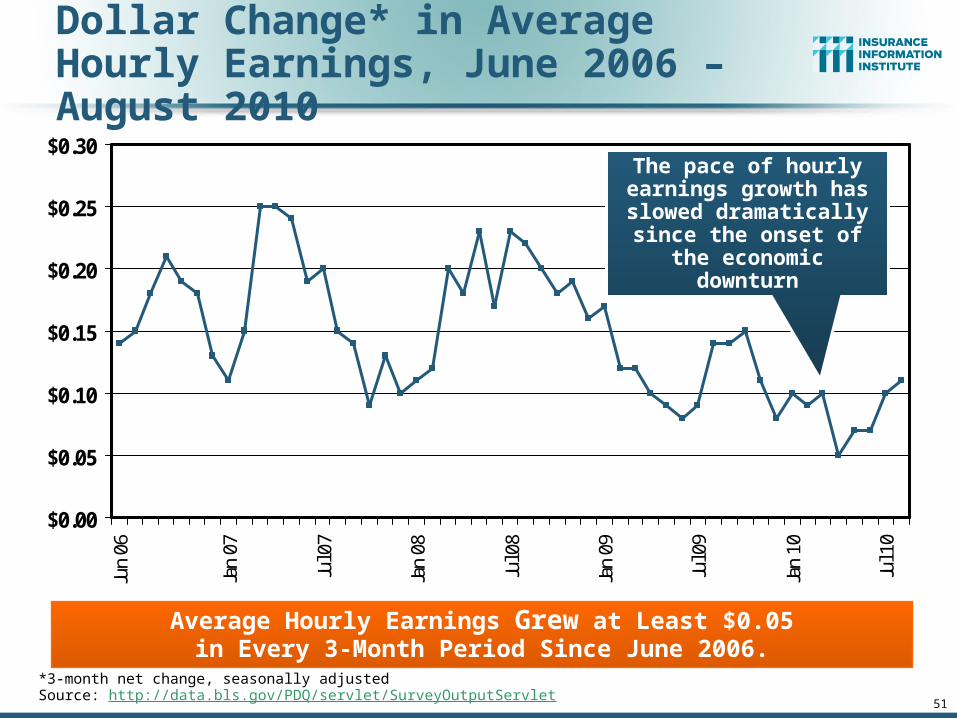
WC indemnity severity is once again outpacing
wage inflation
51
Dollar Change* in Average Hourly Earnings, June 2006 – August 2010
$0.00
$0.05
$0.10
$0.15
$0.20
$0.25
$0.30Ju
n 06
Jan
07
Jul 0
7
Jan
08
Jul 0
8
Jan
09
Jul 0
9
Jan
10
Jul 1
0
*3-month net change, seasonally adjustedSource: http://data.bls.gov/PDQ/servlet/SurveyOutputServlet
Average Hourly Earnings Grew at Least $0.05in Every 3-Month Period Since June 2006.
What the Financial Crisis and Recession Mean for the Industry’s
Exposure Base, Growth and Profitability
58
US Real GDP Growth*
* Estimates/Forecasts from Blue Chip Economic Indicators.Source: US Department of Commerce, Blue Economic Indicators 7/10; Insurance Information Institute.
2.7
%
0.9
%
3.2
%
2.3
%
2.9
%
-0.7
%
0.6
%
-4.0
%
-6.8
% -4.9
%
-0.7
%
1.6
%
5.0
%
3.7
%
1.6
%
1.8
%
2.3
%
2.5
%
2.8
%
3.0
%
3.2
%
4.1
%
1.1
%
1.8
%
2.5
% 3.6
%
3.1
%
-8%
-6%
-4%
-2%
0%
2%
4%
6%
2
00
0
2
00
1
2
00
2
2
00
3
2
00
4
2
00
5
2
00
6
07
:1Q
07
:2Q
07
:3Q
07
:4Q
08
:1Q
08
:2Q
08
:3Q
08
:4Q
09
:1Q
09
:2Q
09
:3Q
09
:4Q
10
:1Q
10
:2Q
10
:3Q
10
:4Q
11
:1Q
11
:2Q
11
:3Q
11
:4Q
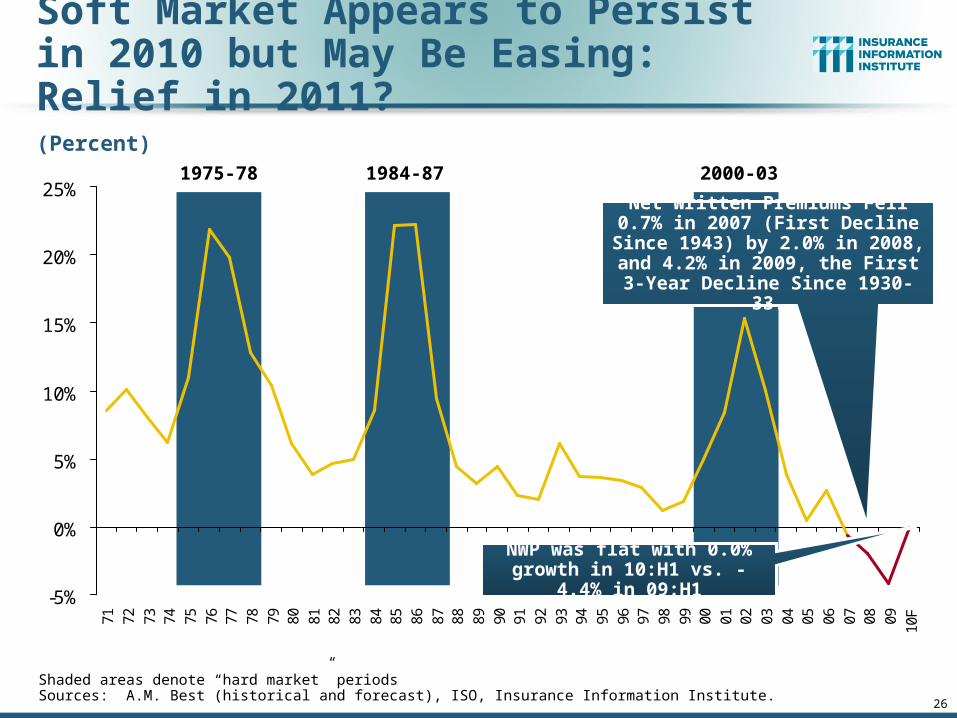
Demand Commercial Insurance Continues To Be Impacted by Sluggish Economic Conditions
Real GDP Growth (%)
Recession began in Dec. 2007. Economic toll of credit
crunch, housing slump, labor market contraction has
been severe but modest recovery is underway
The Q4:2008 decline was the steepest since the Q1:1982 drop of 6.8%
Economic growth up sharply in late 2009 with rebuilding
of inventories and stimulus. More moderate growth
expected in 2010/11 but no “double dip”
59
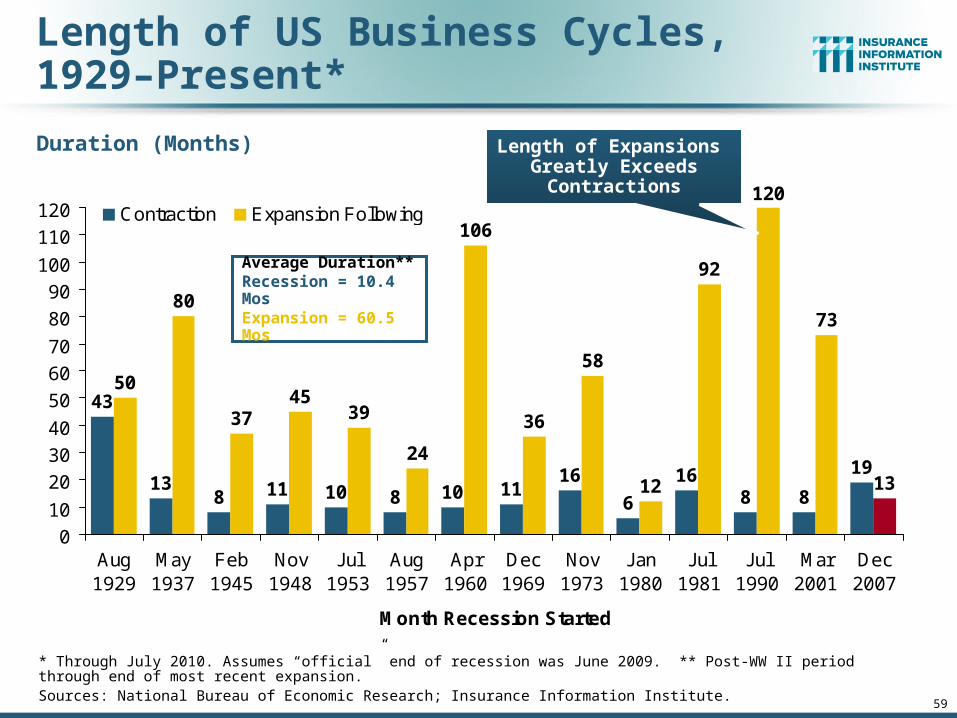
Length of US Business Cycles,1929–Present*
10 1116
6
168 8
19
50
80
3745
39
24
106
36
58
12
92
120
73
13
43
138 11 10 8
0
10
20
30
40
50
60
70
80
90
100
110
120
Aug1929
May1937
Feb1945
Nov1948
Jul1953
Aug1957
Apr1960
Dec1969
Nov1973
Jan1980
Jul1981
Jul1990
Mar2001
Dec2007
Month Recession Started
Contraction Expansion Following
* Through July 2010. Assumes “official” end of recession was June 2009. ** Post-WW II period through end of most recent expansion. Sources: National Bureau of Economic Research; Insurance Information Institute.
Average Duration**Recession = 10.4 MosExpansion = 60.5 Mos
Length of Expansions Greatly Exceeds
Contractions
Duration (Months)
60
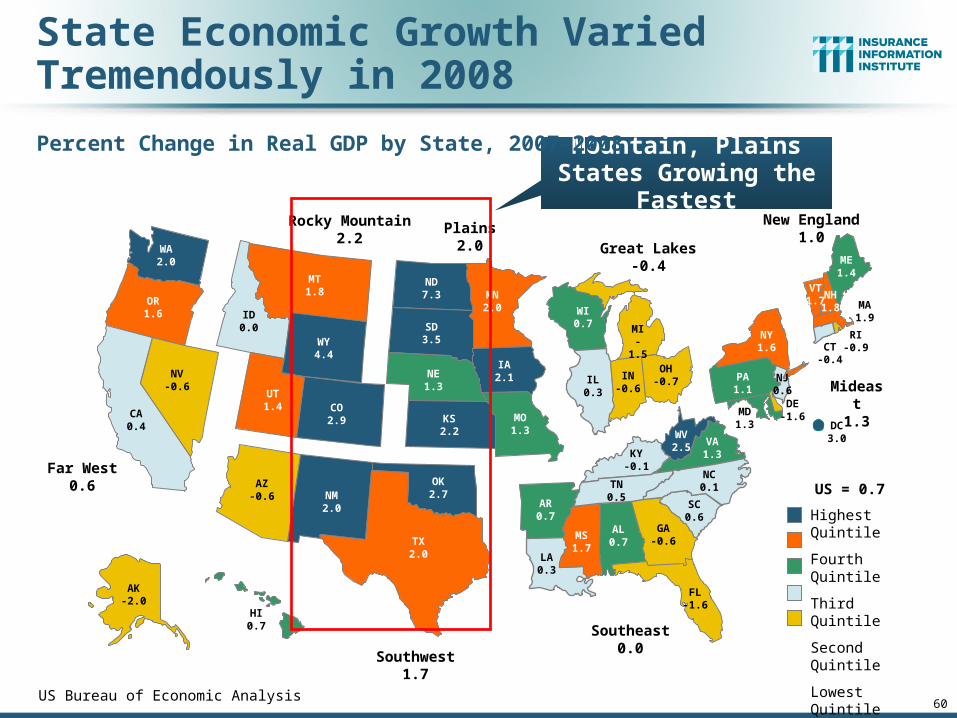
State Economic Growth Varied Tremendously in 2008
US Bureau of Economic Analysis
Highest Quintile
Fourth Quintile
Third Quintile
Second Quintile
Lowest Quintile
Far West0.6
Rocky Mountain2.2
Southwest1.7
Plains2.0 Great Lakes
-0.4
New England1.0
Mideast1.3
Southeast0.0
US = 0.7
WA2.0
OR1.6
CA0.4
NV-0.6
ID0.0
MT1.8
WY4.4
UT1.4 CO
2.9
AZ-0.6 NM
2.0
TX2.0
OK2.7
KS2.2
NE1.3
SD3.5
ND7.3 MN
2.0
IA2.1
MO1.3
WI0.7
IL0.3
MI-1.5
IN-0.6
OH-0.7
NY1.6
PA1.1
NJ0.6
MD1.3
DE-1.6
DC3.0VA
1.3
WV2.5
KY-0.1
NC0.1
SC0.6
TN0.5
AR0.7
LA0.3
MS1.7
AL0.7
GA-0.6
FL-1.6
AK-2.0
HI0.7
ME1.4
NH1.8
VT1.7 MA
1.9
RI-0.9CT
-0.4
Mountain, Plains States Growing the Fastest
Percent Change in Real GDP by State, 2007–2008
61
Labor Market Trends
Massive Job Losses Sapped the Economy and Commercial/Workers
Comp Exposure, But Trend is Improving
62
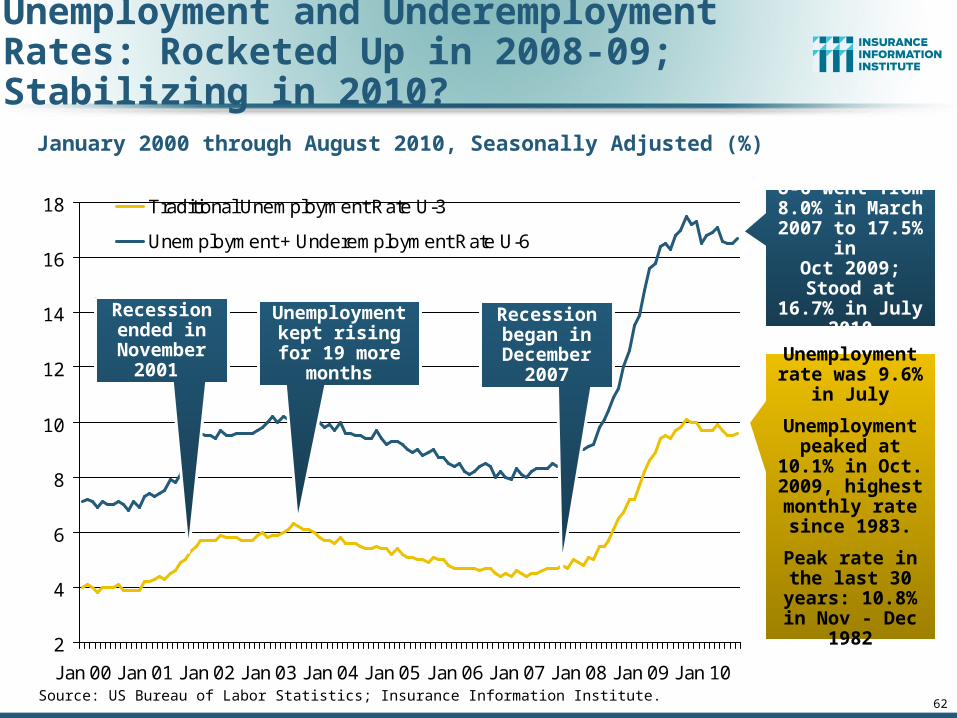
Unemployment and Underemployment Rates: Rocketed Up in 2008-09; Stabilizing in 2010?
2
4
6
8
10
12
14
16
18
Jan 00 Jan 01 Jan 02 Jan 03 Jan 04 Jan 05 Jan 06 Jan 07 Jan 08 Jan 09 Jan 10
Traditional Unemployment Rate U-3
Unemployment + Underemployment Rate U-6
Aug10
Unemployment rate was 9.6% in
July
Unemployment peaked at 10.1%
in Oct. 2009, highest monthly rate since 1983.
Peak rate in the last 30 years: 10.8% in Nov -
Dec 1982
Source: US Bureau of Labor Statistics; Insurance Information Institute.
U-6 went from 8.0% in March
2007 to 17.5% in Oct 2009; Stood at 16.7% in July
2010
January 2000 through August 2010, Seasonally Adjusted (%)
Recession ended in
November 2001
Unemployment kept rising for
19 more months
Recession began in
December 2007
63
US Unemployment Rate
4.5
%
4.5
%
4.6
%
4.8
%
4.9
% 5.4
% 6.1
%
6.9
%
8.1
%
9.3
%
9.6
% 10
.0%
9.7
%
9.7
%
9.6
%
9.5
%
9.4
%
9.2
%
9.0
%9.6
%
4.0%
5.0%
6.0%
7.0%
8.0%
9.0%
10.0%
11.0%
07
:Q1
07
:Q2
07
:Q3
07
:Q4
08
:Q1
08
:Q2
08
:Q3
08
:Q4
09
:Q1
09
:Q2
09
:Q3
09
:Q4
10
:Q1
10
:Q2
10
:Q3
10
:Q4
11
:Q1
11
:Q2
11
:Q3
11
:Q4
Rising unemployment eroded payrolls
and workers comp’s exposure base.
Unemployment likely peaked at 10% in late 2009.
* = actual; = forecastsSources: US Bureau of Labor Statistics; Blue Chip Economic Indicators (9/10); Insurance Information Institute
2007:Q1 to 2011:Q4F*
Unemployment forecasts remain stubbornly high
through 2011
64
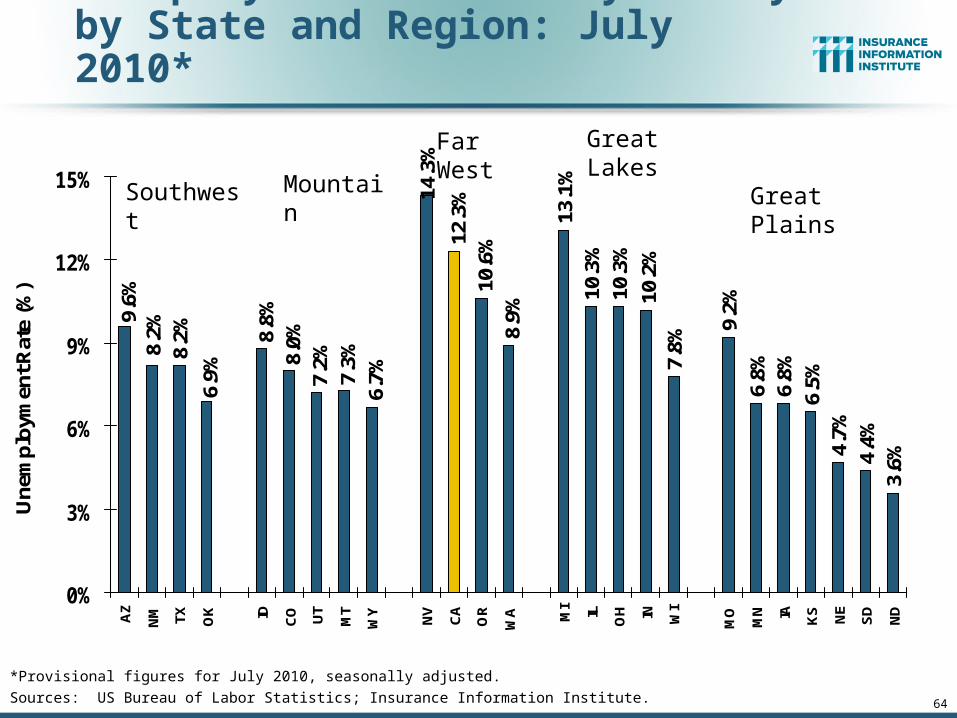
Unemployment Rates Vary Widelyby State and Region: July 2010*
14.3
%
13.1
%
6.5%
4.7%
4.4%
3.6%
8.9%
10.6
%12.3
%
10.2
%7.
8%
6.8%
10.3
%
6.8%
9.2%
10.3
%
8.0%
6.7%7.
3%7.
2%
8.8%
8.2%
8.2%
6.9%
9.6%
0%
3%
6%
9%
12%
15%
AZ
NM TX OK ID CO UT
MT
WY
NV
CA
OR
WA MI IL O
H IN WI
MO
MN IA KS NE
SD
ND
Une
mpl
oym
ent R
ate
(%)
*Provisional figures for July 2010, seasonally adjusted.
Sources: US Bureau of Labor Statistics; Insurance Information Institute.
Southwest Mountain
Far West
Great Plains
Great Lakes
65
Unemployment Rates Vary Widelyby State and Region: July 2010* (cont’d)
11.5
%10
.8%
10.8
%9.
9%9.
9%9.
8%9.
8%9.
7%8.
6%7.
4%7.
2%7.
0%
9.7%
9.3%
8.4%
8.2%
7.1%
11.9
%9.
0%8.
9%8.
1%6.
0%5.
8%
7.7%
6.3%
0%
3%
6%
9%
12%
15%
FL MS
SC
GA KY
TN NC AL
WV AR LA VA NJ
PA DE
NY
MD RI
MA CT
ME
VT
NH
AK HI
Une
mpl
oym
ent R
ate
(%)
*Provisional figures for July 2010, seasonally adjusted.
Sources: US Bureau of Labor Statistics; Insurance Information Institute.
Southeast Mid-Atlantic New England
66
Monthly Change Employment*-7
2-1
44
-12
2-1
60
-13
7-1
61
-12
8-1
75
-32
1-3
80
-59
7-6
81
-77
9-7
26
-75
3-5
28 -3
87
-51
5 -34
6 -21
2-2
25
-22
46
4-1
09
14 39
20
8 31
3 43
2-1
75 -5
4-5
4
-1,000
-800
-600
-400
-200
0
200
400
600
Jan
08
Fe
b 0
8M
ar
08
Ap
r 0
8M
ay
08
Jun
08
Jul 0
8A
ug
08
Se
p 0
8O
ct 0
8N
ov
08
De
c 0
8Ja
n 0
9F
eb
09
Ma
r 0
9A
pr
09
Ma
y 0
9Ju
n 0
9Ju
l 09
Au
g 0
9S
ep
09
Oct
09
No
v 0
9D
ec
09
Jan
10
Fe
b 1
0M
ar
10
Ap
r 1
0M
ay
10
Jun
10
Jul 1
0A
ug
10
Monthly Losses in Dec. 08–Mar. 09 Were
the Largest in the Post-WW II Period
*Estimate based on Reuters poll of economists.Source: US Bureau of Labor Statistics: http://www.bls.gov/ces/home.htm; Insurance Information Institute
Job Losses Since the Recession Began in Dec. 2007 Peaked at 8.4 Mill in Dec. 09; Stands at 7.7 Million Through August 2010;
14.9 Million People are Now Defined as Unemployed
January 2008 through August 2010* (Thousands)
The job gain and loss figures in 2010 are severely distorted by the hiring and
termination of temporary Census workers. So far in 2010, 763,000 private sector jobs
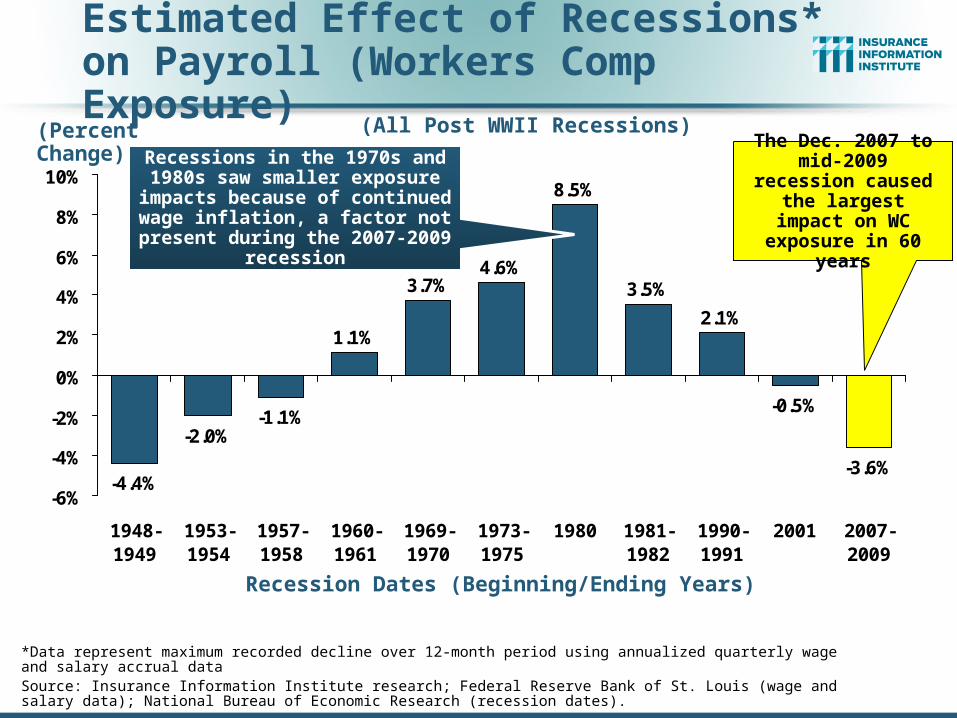
Estimated Effect of Recessions* on Payroll (Workers Comp Exposure)
*Data represent maximum recorded decline over 12-month period using annualized quarterly wage and salary accrual dataSource: Insurance Information Institute research; Federal Reserve Bank of St. Louis (wage and salary data); National Bureau of Economic Research (recession dates).
-4.4%
-2.0%-1.1%
1.1%
3.7%4.6%
8.5%
3.5%
2.1%
-0.5%
-3.6%
-6%
-4%
-2%
0%
2%
4%
6%
8%
10%
1948-1949
1953-1954
1957-1958
1960-1961
1969-1970
1973-1975
1980 1981-1982
1990-1991
2001 2007-2009
Recessions in the 1970s and 1980s saw smaller exposure impacts
because of continued wage inflation, a factor not present
during the 2007-2009 recession
The Dec. 2007 to mid-2009 recession
caused the largest impact on WC
exposure in 60 years
(Percent Change)
(All Post WWII Recessions)
Recession Dates (Beginning/Ending Years)
68
Frequency: 1926–2009A Long-Term Drift Downward
Note: Recessions indicated by gray bars.Sources: NCCI from US Bureau of Labor Statistics; National Bureau of Economic Research.
Manufacturing – Total Recordable CasesRate of Injury and Illness Cases per 100 Full-Time Workers