96
Benefits, Coverage, and Costs October 2016 Washington, DC Workers’ Compensation:

Benefits, Coverage, and Costs
October 2016
Washington, DC
Workers’ Compensation:

The National Academy of Social Insurance (the Academy) is a non-profit, non-partisan organization made up of the nation’s leadingexperts on social insurance. Its mission is to advance solutions to challenges facing the nation by increasing public understanding of howsocial insurance contributes to economic security. Social insuranceencompasses broad-based systems that help workers pool risks to avoidloss of income due to retirement, death, disability, or unemployment,and to ensure access to health care. The Academy convenes steeringcommittees and study panels that are charged with conducting research,issuing findings, and, in some cases, reaching recommendations basedon their analysis. Members of these groups are selected for their recog-nized expertise and with due consideration for the balance of disciplinesand perspectives appropriate to the project.
This research report presents new data on workers’ compensation benefits, coverage, and costs in 2014. It was prepared with the guidanceof the Study Panel on Workers’ Compensation Data. In accordancewith procedures of the Academy, the report has been reviewed for completeness, accuracy, clarity, and objectivity by a committee selectedby the Board of Directors. The purposes of the report are to present the data and describe trends over time, but not to make policy recommendations.
The Social Security Administration provides partial funding to supportthe collection, processing, and validation of data that are also used intables for its Annual Statistical Supplement to the Social Security Bulletin.The Centers for Medicare & Medicaid Services provide funding to produce selected tables for this report that are also used in its own esti-mates. The project also receives financial support from the Office ofWorkers’ Compensation Programs in the U.S. Department of Laborand in-kind support from the National Council on CompensationInsurance and the National Association of Insurance Commissioners.
© 2016 National Academy of Social InsuranceISBN: 1-884902-64-2
Board of Directors
William M. Rodgers III, Chair
Renée Landers, Vice Chair
Chris O’Flinn, Treasurer
Marty Ford, Secretary
G. Lawrence Atkins
Robert A. Berenson
Ngina Chiteji
Judy Feder
Howard Fluhr
Michael J. Graetz
Alexander W. Hertel-Fernandez
G. William Hoagland
Charles N. Kahn III
Kilolo Kijakazi
Shaun C. O’Brien
Maya Rockeymoore
Rebecca Vallas
Founding ChairRobert M. Ball
Chief Executive OfficerWilliam J. Arnone
1200 New Hampshire Ave., NW
Suite 830
Washington, DC 20036
Telephone (202) 452-8097
Facsimile (202) 452-8111
www.nasi.org Twitter: @socialinsurance
Workers’ Compensation:
Benefits, Coverage, and Costs,
(2014 data)
by
Marjorie L. Baldwin and Christopher F. McLaren
with advice from the
Study Panel on Workers’ Compensation Data
Washington, DC
October 2016


Workers’ Compensation: Benefits, Coverage, and Costs • i
Workers’ compensation provides medical care, reha-bilitation, and cash benefits for workers who areinjured on the job or who contract work-related ill-nesses. The program also pays benefits to families ofworkers who die of work-related injuries or illnesses.Unlike most other U.S. social insurance programs,workers’ compensation programs are regulated bythe states, with no federal financing or administra-tion. No federal laws set standards for “tax-qualified”workers’ compensation plans or require comprehen-sive reporting of workers’ compensation coverageand costs.
The lack of uniform reporting of states’ experienceswith workers’ compensation makes it difficult toprovide national estimates of amounts of benefitspaid, costs to employers, and numbers of workerscovered. To produce national summary statistics onthe program, it is necessary to piece together datafrom various sources.
Until 1995, the U.S. Social Security Administration(SSA) produced the only comprehensive nationaldata on workers’ compensation benefits, coverage,and costs with annual estimates dating back to 1946.SSA discontinued the series in 1995 after publishingdata for 1992–1993. The National Academy ofSocial Insurance assumed the task of reportingnational data on workers’ compensation in 1997.The Academy published its first report that year,extending the data series from 1993 through 1995,and has produced the report annually ever since.
This is the 19th annual report of the NationalAcademy of Social Insurance on workers’ compensa-tion benefits, coverage, and costs. This reportpresents new data on workers’ compensation pro-grams for 2014 and updated estimates for2010–2013 with newly available data. The revisedestimates in this report replace estimates in theAcademy’s prior reports.
The Academy and its expert advisors are continuallyseeking ways to improve the report and to adapt esti-mation methods to track new developments inworkers’ compensation programs. Detailed descrip-tions of the methods used to produce the estimates
in this report are available online atwww.nasi.org/research/workers-compensation.
Despite the Academy’s continued efforts to improvethe quality of its estimates, some limitations shouldbe acknowledged: First, there may be some workers’compensation costs not captured in the estimates ofemployer costs. We may, for example, miss someunreported expenditures, such as those for legal ser-vices. There may also be costs associated with jobaccommodations to promote early return to work, orsafety improvements after an injury has occurred,that are not be captured in this report. Second, wedo not capture all of the costs of claim litigation instates where the appeals structure is subsidized by taxrevenues. We do capture litigation costs in stateswhere the appeals structure is fully funded by theworkers’ compensation premium, so there is a sys-tematic variation in the cost estimates between thetwo types of states. Finally, our estimates of mone-tary costs cannot capture the full economic andhuman costs of work-related injuries, illnesses, andfatalities. These costs – borne by workers, familiesand communities – are significant but are beyondthe scope of the report.
The audience for the Academy’s reports on workers’compensation includes insurers, journalists, businessand labor leaders, employee benefit specialists, actu-aries, federal and state policymakers, and researchersworking in universities, government, and privateconsulting firms. The data from some tables arepublished by the National Safety Council (in InjuryFacts), by the Employee Benefit Research Institute(in Employee Benefit News, Fundamentals of EmployeeBenefit Programs) and by the SSA (in the AnnualStatistical Supplement to the Social Security Bulletin).
The Academy’s estimates inform state and federalpolicymakers in numerous ways. The federal Centersfor Medicare & Medicaid Services, for example, usethe data in estimates and projections of health carespending in the United States. The NationalInstitute for Occupational Safety and Health usesthe data to track the costs of workplace injuries inthe United States. The International Association ofIndustrial Accident Boards and Commissions (theorganization of state and provincial agencies thatadminister workers’ compensation in the United
Preface

States and Canada) uses the information to track andcompare the performance of workers’ compensationprograms in the United States with similar systemsin Canada.
AcknowledgementsThe Academy expresses its deep appreciation to staffmembers in the 50 states and District of Columbiaworkers’ compensation offices who provide data ontheir jurisdictions each year. While there are toomany individuals to name here, we are grateful forthe time they spent responding to our survey andanswering clarification questions when needed.Without support from these sources, constructingthis annual data series would not be possible. TheAcademy also acknowledges the U.S. Social SecurityAdministration (SSA), Centers for Medicare &Medicaid Services (CMS), and the Office ofWorkers’ Compensation Programs of the U.S.Department of Labor (DOL) for their support.
Members of the Academy’s Study Panel on Workers’Compensation Data generously gave their time andknowledge in advising on data sources and presenta-tion, interpreting results, and reviewing the draftreport. Members of the Panel are listed on page iii,but we would like to especially acknowledge the con-tributions of Christine Baker (CaliforniaDepartment of Industrial Relations); Les Boden(Boston University); Terry Bogyo (IndependentWorkers’ Compensation Researcher, Canada); JohnBurton (Rutgers and Cornell University); ChuckDavoli (Louisiana Governor’s Workers’Compensation Advisory Council); Doug Holmes(UWC Strategic Services); Mike Manley (OregonDepartment of Business and Consumer Services);Frank Neuhauser (University of California,Berkeley); Seth Seabury (University of Southern
California); and Hilery Simpson (Bureau of LaborStatistics). Special thanks are also due to John Ruser(Workers’ Compensation Research Institute) for hishelpful comments on the draft report.
We thank the Academy’s workers’ compensationsummer intern, McCayla Sica, whose help wasinvaluable in producing the final report and healthpolicy analyst Alexandra Bradley (the Academy) forreviewing an earlier draft. We also thank JeffEddinger (National Council on CompensationInsurance), Benjamin Washington (CMS), JudithBinder, Emily Hunter and Anatoli Sznoluch (DOL),and Cherice Jeffries (SSA) for providing private andfederal level data.
Finally, this report benefited greatly from helpfulcomments during Board review by Monica Galizzi(University of Massachusetts, Lowell); GregoryKrohm (Workcomp Strategies, Inc.); and IshitaSengupta (Mercer). We appreciate the time andeffort all of these individuals devoted to reviewingthe report.
For 16 years this report has benefitted from the capa-ble and conscientious work of Ishita Sengupta, whowas responsible for all data collection and program-ming, as well as co-authoring the final report. Ishitaleft the Academy last fall to take a new position withMercer. We were sad to part with a dear colleagueand friend, but wish her the best in her new career.
Marjorie Baldwin Chair, Study Panel on Workers’ Compensation Data
ii NATIONAL ACADEMY OF SOCIAL INSURANCE

Workers’ Compensation: Benefits, Coverage, and Costs • iii
Marjorie Baldwin, ChairProfessor, W. P. Carey School of Business, Department of Economics,Arizona State University
Christine BakerDirector, California Departmentof Industrial Relations
Leslie BodenProfessor, School of PublicHealth, Boston University
Terry BogyoIndependent Workers’Compensation Researcher,Canada
John F. Burton, Jr.Professor Emeritus, School ofManagement & Labor Relations,Rutgers University, and School ofIndustrial and Labor Relations,Cornell University
Aaron CatlinDeputy Director, NationalHealth Statistics Group, Officeof the Actuary, Centers forMedicare & Medicaid Services
Chuck DavoliLouisiana Workers’ AdvocateLabor Representative of theGovernor’s Workers’Compensation Advisory Council
Jeff EddingerSenior Division ExecutiveRegulatory ServicesNational Council onCompensation Insurance
Douglas J. HolmesPresident, UWC StrategicServices on Unemploymentand Workers’ Compensation
Jennifer Wolf HorejshExecutive Director, InternationalAssociation of IndustrialAccident Boards andCommissions
John JankowskiProject Officer, Social SecurityAdministration
Kate KimpanVice President, Workers’Compensation Programs, Dade Moeller & Associates
Mike ManleyResearch Coordinator, OregonDepartment of Consumer andBusiness Services
Frank NeuhauserExecutive Director, Center forthe Study of Social Insurance,University of California, Berkeley
Eric NordmanDirector of Regulatory Services& the CIPR, NationalAssociation of InsuranceCommissioners
Seth A. SeaburyAssociate Professor, Departmentof Emergency Medicine andLeonard D. Schaeffer Center forHealth Policy and Economics, University of Southern California
Hilery SimpsonAssistant Commissioner, Office of Safety, Health, andWorking Conditions, U.S.Bureau of Labor Statistics
Emily A. SpielerProfessor of Law, NortheasternUniversity School of Law
Robert Steggert Retired, Marriott International, Inc.
Gary SteinbergDeputy Director, Office ofWorkers’ CompensationPrograms, U.S. Department of Labor
Alex SwedlowPresident, California Workers’Compensation Institute
Ramona TanabeExecutive Vice President,Workers Compensation Research Institute
Benjamin WashingtonEconomist, National HealthStatistics Group, Office of theActuary, Centers for Medicare& Medicaid Services
William J. WiatrowskiDeputy Commissioner, Bureau of Labor Statistics, U.S. Department of Labor
Study Panel on Workers’ Compensation Data

iv NATIONAL ACADEMY OF SOCIAL INSURANCE

Workers’ Compensation: Benefits, Coverage, and Costs • v
Table of ContentsHighlights . . . . . . . . . . . . . . . . . . . . . . . . . . . . . . . . . . . . . . . . . . . . . . . . . . . . . . . . . . . . . . . . . . . . . . . . . . . . . 1
National Trends. . . . . . . . . . . . . . . . . . . . . . . . . . . . . . . . . . . . . . . . . . . . . . . . . . . . . . . . . . . . . . . . . . . . 1
State Trends . . . . . . . . . . . . . . . . . . . . . . . . . . . . . . . . . . . . . . . . . . . . . . . . . . . . . . . . . . . . . . . . . . . . . . 1
Trends in Workers’ Compensation Benefits and Costs . . . . . . . . . . . . . . . . . . . . . . . . . . . . . . . . . . . 1
Background on Workers’ Compensation. . . . . . . . . . . . . . . . . . . . . . . . . . . . . . . . . . . . . . . . . . . . . . . . . . . . 4
History of Workers’ Compensation. . . . . . . . . . . . . . . . . . . . . . . . . . . . . . . . . . . . . . . . . . . . . . . . . . . . 4
Workers’ Compensation Benefits . . . . . . . . . . . . . . . . . . . . . . . . . . . . . . . . . . . . . . . . . . . . . . . . . . . . . 7
Sources of Workers’ Compensation Insurance. . . . . . . . . . . . . . . . . . . . . . . . . . . . . . . . . . . . . . . . . . 9
Estimates for 2014 . . . . . . . . . . . . . . . . . . . . . . . . . . . . . . . . . . . . . . . . . . . . . . . . . . . . . . . . . . . . . . . . . . . . . 11
Covered Employment and Wages . . . . . . . . . . . . . . . . . . . . . . . . . . . . . . . . . . . . . . . . . . . . . . . . . . . . . . . . 16
Methods for Estimating Covered Employment and Wages . . . . . . . . . . . . . . . . . . . . . . . . . . . . . . 16
Estimates of Covered Wages and Workers . . . . . . . . . . . . . . . . . . . . . . . . . . . . . . . . . . . . . . . . . . . . 16
Workers’ Compensation Benefits Paid . . . . . . . . . . . . . . . . . . . . . . . . . . . . . . . . . . . . . . . . . . . . . . . . . . . . 17
Data Sources for Estimating Benefits Paid . . . . . . . . . . . . . . . . . . . . . . . . . . . . . . . . . . . . . . . . . . . . 17
National Estimates of Benefits Paid . . . . . . . . . . . . . . . . . . . . . . . . . . . . . . . . . . . . . . . . . . . . . . . . . . 18
State Estimates of Benefits Paid . . . . . . . . . . . . . . . . . . . . . . . . . . . . . . . . . . . . . . . . . . . . . . . . . . . . . 24
Employer Costs for Workers’ Compensation . . . . . . . . . . . . . . . . . . . . . . . . . . . . . . . . . . . . . . . . . . . . . . . 35
Data Sources for Estimating Employer Costs . . . . . . . . . . . . . . . . . . . . . . . . . . . . . . . . . . . . . . . . . . 35
National and State Estimates of Employer Costs . . . . . . . . . . . . . . . . . . . . . . . . . . . . . . . . . . . . . . . 36
Benefits Paid Relative to Employer Costs . . . . . . . . . . . . . . . . . . . . . . . . . . . . . . . . . . . . . . . . . . . . . 40
Estimates of Employer Costs from Other Sources . . . . . . . . . . . . . . . . . . . . . . . . . . . . . . . . . . . . . . 41
Direct and Indirect Costs to Workers . . . . . . . . . . . . . . . . . . . . . . . . . . . . . . . . . . . . . . . . . . . . . . . . . 42
Estimates of Workplace Injuries and Claims. . . . . . . . . . . . . . . . . . . . . . . . . . . . . . . . . . . . . . . . . . . . . . . . 43
Incidence of Work-Related Injuries. . . . . . . . . . . . . . . . . . . . . . . . . . . . . . . . . . . . . . . . . . . . . . . . . . . 43
Incidence of Workers’ Compensation Claims . . . . . . . . . . . . . . . . . . . . . . . . . . . . . . . . . . . . . . . . . . 47
Addendum . . . . . . . . . . . . . . . . . . . . . . . . . . . . . . . . . . . . . . . . . . . . . . . . . . . . . . . . . . . . . . . . . . . . . . . . . . . 48
Other Disability Benefit Programs . . . . . . . . . . . . . . . . . . . . . . . . . . . . . . . . . . . . . . . . . . . . . . . . . . . 48
Benefits Incurred vs. Benefits Paid . . . . . . . . . . . . . . . . . . . . . . . . . . . . . . . . . . . . . . . . . . . . . . . . . . . 50
Glossary . . . . . . . . . . . . . . . . . . . . . . . . . . . . . . . . . . . . . . . . . . . . . . . . . . . . . . . . . . . . . . . . . . . . . . . . . . . . . 53
Appendix A: Coverage Estimates. . . . . . . . . . . . . . . . . . . . . . . . . . . . . . . . . . . . . . . . . . . . . . . . . . . . . . . . . 56
Appendix B: Federal Programs. . . . . . . . . . . . . . . . . . . . . . . . . . . . . . . . . . . . . . . . . . . . . . . . . . . . . . . . . . . 60
Federal Employees. . . . . . . . . . . . . . . . . . . . . . . . . . . . . . . . . . . . . . . . . . . . . . . . . . . . . . . . . . . . . . . . 60
Longshore and Harbor Workers . . . . . . . . . . . . . . . . . . . . . . . . . . . . . . . . . . . . . . . . . . . . . . . . . . . . . 60
Coal Miners with Black Lung Disease . . . . . . . . . . . . . . . . . . . . . . . . . . . . . . . . . . . . . . . . . . . . . . . . 61
Energy Employees . . . . . . . . . . . . . . . . . . . . . . . . . . . . . . . . . . . . . . . . . . . . . . . . . . . . . . . . . . . . . . . . 63
Workers Exposed to Radiation . . . . . . . . . . . . . . . . . . . . . . . . . . . . . . . . . . . . . . . . . . . . . . . . . . . . . . 63
Veterans of Military Service . . . . . . . . . . . . . . . . . . . . . . . . . . . . . . . . . . . . . . . . . . . . . . . . . . . . . . . . 63
Railroad Employees and Merchant Seamen. . . . . . . . . . . . . . . . . . . . . . . . . . . . . . . . . . . . . . . . . . . 66
Federal Programs not Included in National Totals . . . . . . . . . . . . . . . . . . . . . . . . . . . . . . . . . . . . . . 66
Appendix C: Workers’ Compensation under State Laws. . . . . . . . . . . . . . . . . . . . . . . . . . . . . . . . . . . . . . 67
References. . . . . . . . . . . . . . . . . . . . . . . . . . . . . . . . . . . . . . . . . . . . . . . . . . . . . . . . . . . . . . . . . . . . . . . . . . . . 77
TablesTable 1: Overview of Workers’ Compensation Benefits, Coverage, and Costs, 2010-2014 . . . . . . . .2
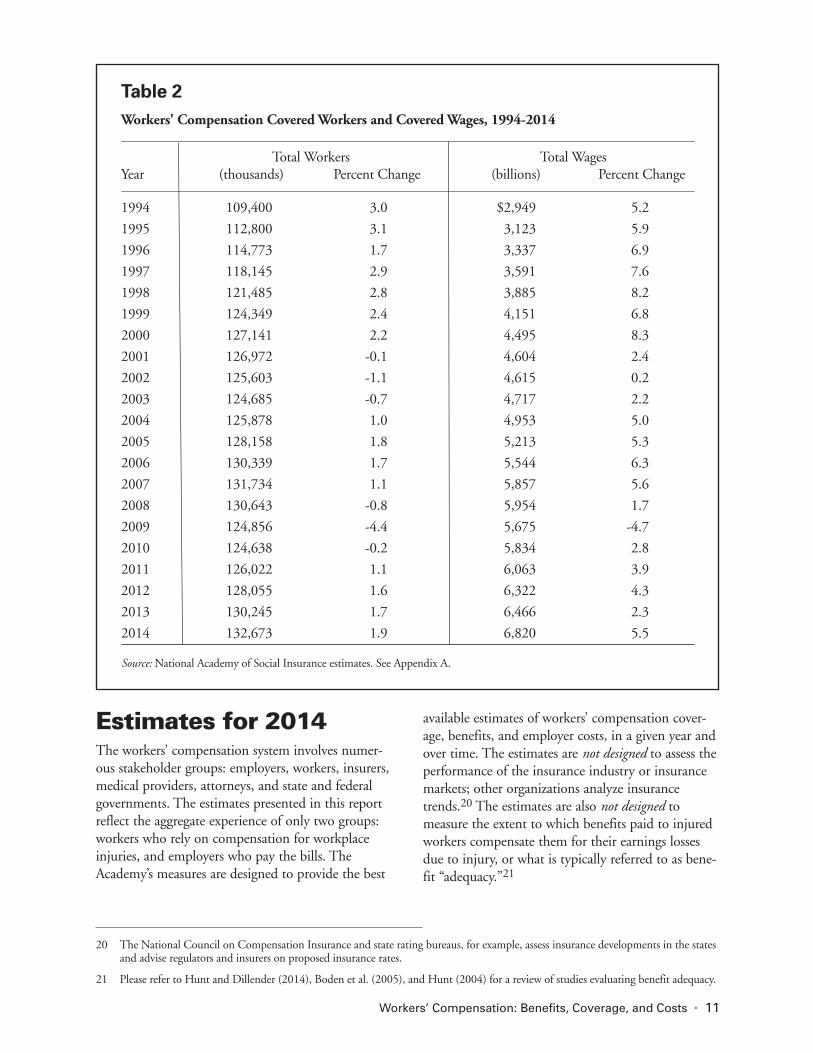
Table 2: Workers’ Compensation Covered Workers and Covered Wages, 1994-2014 . . . . . . . . . . .11
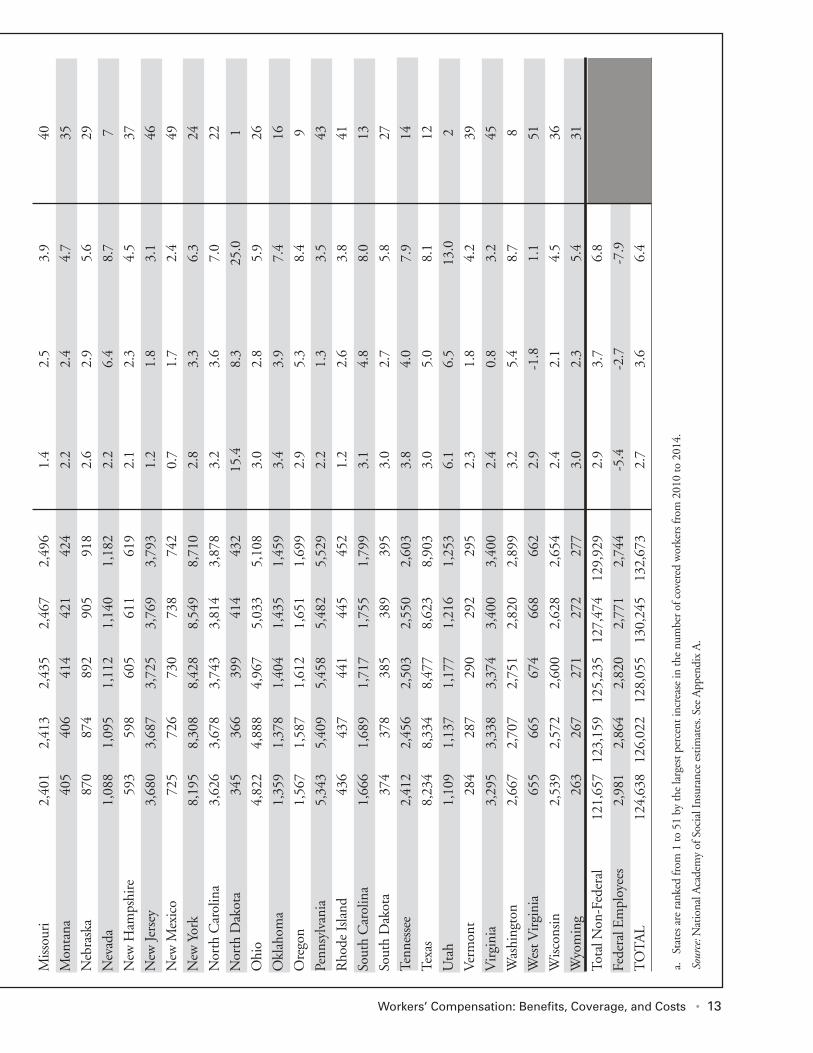
Table 3: Workers’ Compensation Covered Workers, by State, 2010-2014 . . . . . . . . . . . . . . . . . . . . .12
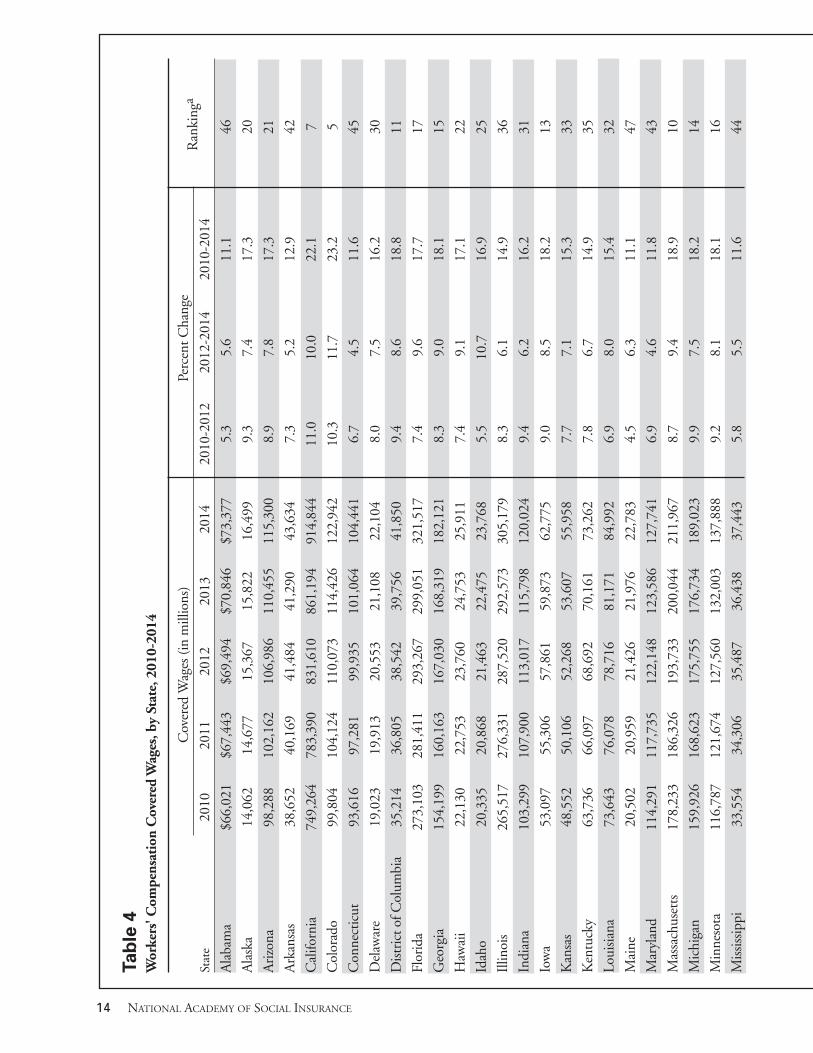
Table 4: Workers’ Compensation Covered Wages, by State, 2010-2014 . . . . . . . . . . . . . . . . . . . . . . .14
Table 5 Workers’ Compensation Benefits Paid, by Type of Coverage, 1994-2014 . . . . . . . . . . . . . .19
Table 6: Workers’ Compensation Employer-Paid Benefits Under Deductible Provisions, 1994-2014 . . . . . . . . . . . . . . . . . . . . . . . . . . . . . . . . . . . . . . . . . . . . . . . . . . . . . . . . . . . . . . . . . .20
Table 7: Percentage Distribution of Workers’ Compensation Benefit Payments, by Type of Coverage: With and Without Deductibles, 1994-2014 . . . . . . . . . . . . . . . . . . . .21
Table 8: Workers’ Compensation Benefits, by Type of Coverage and State, 2014 . . . . . . . . . . . . . .22
Table 9: Workers’ Compensation Total Benefits Paid and Five-Year Percent Change, by State, 2010-2014 . . . . . . . . . . . . . . . . . . . . . . . . . . . . . . . . . . . . . . . . . . . . . . . . . . . . . . . . . .26
Table 10: Workers’ Compensation Medical Benefits Paid and Five-Year Percent Change, by State, 2010-2014 . . . . . . . . . . . . . . . . . . . . . . . . . . . . . . . . . . . . . . . . . . . . . . . . . . . . . . . . . .28
Table 11: Workers’ Compensation Cash Benefits Paid and Five-Year Percent Change, by State, 2010-2014 . . . . . . . . . . . . . . . . . . . . . . . . . . . . . . . . . . . . . . . . . . . . . . . . . . . . . . . . . .30
Table 12: Workers’ Compensation Total Benefits Paid Per $100 of Covered Wages, by State, 2010-2014 . . . . . . . . . . . . . . . . . . . . . . . . . . . . . . . . . . . . . . . . . . . . . . . . . . . . . . . . . .32
Table 13: Workers’ Compensation Employer Costs, by Type of Coverage, 1994-2014 . . . . . . . . . . .37
Table 14: Workers’ Compensation Employer Costs Per $100 of Covered Wages, by State, 2010-2014 . . . . . . . . . . . . . . . . . . . . . . . . . . . . . . . . . . . . . . . . . . . . . . . . . . . . . . . . . . . . . . . . . . .38
Table 15: Workers’ Compensation Benefit/Cost Ratios, 1994-2014 . . . . . . . . . . . . . . . . . . . . . . . . . . . .40
Table 16: Fatal Occupational Injuries: All and Private Industry, 1994-2014 . . . . . . . . . . . . . . . . . . . . . .43
Table 17: Non-Fatal Occupational Injuries and Illnesses Among Private Industry Employers, 1994-2014 . . . . . . . . . . . . . . . . . . . . . . . . . . . . . . . . . . . . . . . . . . . . . . . . . . . . . . . . . . . . . . . . . . .45
Table 18: Number of Workers’ Compensation Claims per 100,000 Insured Workers: Private Carriers in 37 Jurisdictions, 1994-2012 . . . . . . . . . . . . . . . . . . . . . . . . . . . . . . . . . . . .46
Table 19: Dual Eligible Individuals: Social Security Disability Insurance Beneficiaries with Workers’ Compensation or Public Disability Benefits, 2014 . . . . . . . . . . . . . . . . . . . . . . . . .50
Table A: Documenting Workers’ Compensation Coverage Estimates, 2014 Annual Averages . . . .58
Table B1: Federal Employees’ Compensation Act, Benefits and Costs, 2003–2014 . . . . . . . . . . . . . . .61
Table B2: Longshore and Harbor Workers’ Compensation Act, Benefits, Costs, and Number of Defense Base Act Death Claims, 2003–2014 . . . . . . . . . . . . . . . . . . . . . . . . . . . . . . . . . . . .62
Table B3: Black Lung Benefits Act, Benefits and Costs, 2003–2014 . . . . . . . . . . . . . . . . . . . . . . . . . . .64
Table B4: Energy Employees Occupational Illness Compensation Program Act, Part B and Part E Benefits and Costs, 2003-2014 . . . . . . . . . . . . . . . . . . . . . . . . . . . . . . . . . . . . . . . . . . . .65
Table B5: Radiation Exposure Compensation Act, Benefits Paid as of June 30, 2014 . . . . . . . . . . . .66
Table B6: Federal Veterans’ Compensation Program, Compensation Paid in Fiscal Year 2014 . . . . .66
Table C: Workers’ Compensation State Laws as of January 2016 . . . . . . . . . . . . . . . . . . . . . . . . . . . .68
vi NATIONAL ACADEMY OF SOCIAL INSURANCE

Workers’ Compensation: Benefits, Coverage, and Costs • vii
FiguresFigre 1: Workers’ Compensation Benefits and Costs Per $100 of Covered Wages, 1980–2014 . . . . .3
Figure 2: Workers’ Compensation Medical and Cash Benefits per $100 of Covered Wages, 1980–2014 . . . . . . . . . . . . . . . . . . . . . . . . . . . . . . . . . . . . . . . . . . . . . . . . . . . . . . . . . . . . . . . . . . .4
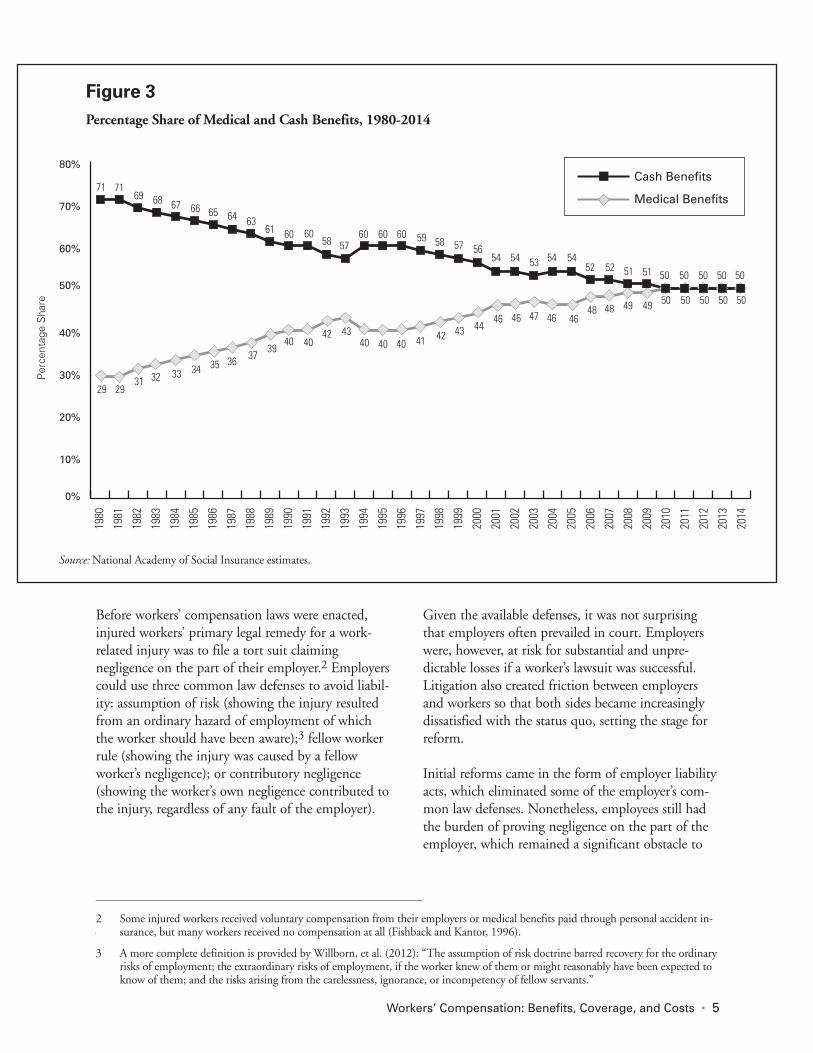
Figure 3: Percentage Share of Medical and Cash Benefits, 1980–2014 . . . . . . . . . . . . . . . . . . . . . . . . .5
Figure 4: Types of Disabilities in Workers’ Compensation Cases with Cash Benefits, 1994-2012, Percent of Cases and Percent of Benefits . . . . . . . . . . . . . . . . . . . . . . . . . . . . . . . . . . . . . . . . .8
Figure 5: Private Industry Occupational Injuries and Illnesses: Incidence Rates 1980-2014 . . . . . . .44
Additional Appendices Additional appendices are published in Sources and Methods: A Companion to Workers’ Compensation: Benefits, Coverage, and Costs, available on the Academy’s website at www.nasi.org.These appendices provide more information on:
� Methods used to estimate workers’ compensation benefits and costs by type of coverage;
� Trends in second injury funds, special funds, and guaranty funds;
� Updated version of Table 9.B1 of the Annual Statistical Supplement to the Social Security
Bulletin; and
� Data sources for each state.

viii NATIONAL ACADEMY OF SOCIAL INSURANCE

HighlightsThis report provides data on benefits, costs, and coverage for state and federal workers’ compensationprograms in 2014. Its purpose is to facilitate policy-making and comparisons with other social insuranceand employee benefit programs. The report has beenproduced annually by the National Academy ofSocial Insurance since 1997. Key trends observed inthis year’s data are summarized below:
National Trends Covered employment increased.� In 2014, workers’ compensation covered an
estimated 132.7 million U.S. workers, a 1.9percent increase in coverage from 2013. Across the five years reported in the study(2010-2014), the number of covered workersincreased by 6.4 percent (Table 1). The increasein coverage reflects increases in employmentacross the country after the recession of 2008-2009.
Benefits decreased. � In 2014, workers’ compensation benefits paid
decreased for the second year in a row. The two-year downturn followed a trend of increasingbenefits paid between 2010 and 2012 (Table 9).
� Total benefits paid were $62.3 billion, adecrease of 0.3 percent from 2013 (Table 9).Medical benefits paid for health care were $31.4billion, a decrease of 0.1 percent from 2013(Table 10). Cash benefits paid for lost worktime were $30.9 billion, a decrease of 0.6 percent from 2013 (Table 11).
� Total benefits paid were $0.91 per $100 of covered wages, down by 5.5 percent from 2013(Table 12).
Employer costs increased. � In 2014, employers’ costs for workers’ compen-
sation increased for the fourth year in a row(Table 13). Total costs to employers were $91.8billion, a 4.9 percent increase from 2013 (Table13).
� Costs increased by 15.9 percent in the period 2010-2012 and by 8.8 percent in the period2012-2014 (Table 1).
� Employers’ costs were $1.35 per $100 of covered wages in 2014, unchanged from 2013(Table 15).
State Trends (2010 – 2014)� Workers’ compensation covered employment
and wages increased in every state. The largestpercentage increases were in North Dakota(25% increase in covered employment; 68%increase in covered wages) and Utah (13% and24%) (Tables 3 and 4).
� Benefits per $100 of covered wages decreased inevery state except Connecticut, Delaware, NewYork, Virginia, and Wyoming (Table 12).Benefits decreased by more than $0.20 per $100of covered wages in 12 jurisdictions and bymore than $0.40 in Montana, Oklahoma, andWest Virginia.
� Employers’ costs per $100 of covered wagesincreased in 31 jurisdictions. However, costsdecreased by more than $0.20 per $100 of covered wages in Montana, Ohio, Oklahoma,and West Virginia (Table 14).
Trends in Workers’ CompensationBenefits and Costs The Academy’s measures of benefits and costs aredesigned to reflect the aggregate experience of twostakeholder groups: workers who rely on compensa-tion for workplace injuries and employers who paythe bills. Between 2010 and 2014, workers’ compen-sation benefits, coverage, and costs increased inabsolute terms. However, as a share of covered pay-roll over the same time period, employer costsincreased but benefits to injured workers decreased(Table 1 and Figure 1).
Total workers’ compensation benefits (cash benefitspaid to injured workers and medical payments fortheir health care) were $62.3 billion in 2014, a 5.7percent increase from 2010. Medical paymentsincreased by 7.2 percent to $31.4 billion, and cashbenefits increased by 4.3 percent to $30.9 billionover the period 2010-2014. Controlling for changesin covered wages, total benefits decreased by $0.10(to $0.91 per $100 of covered wages), medical payments decreased by $0.04 (to $0.46 per $100 of
Workers’ Compensation: Benefits, Coverage, and Costs • 1

covered wages), and cash benefits decreased by $0.06(to $0.45 per $100 of covered wages) in the period.
Historically, cash benefits have been a larger share ofworkers’ compensation benefits than medical pay-ments to injured workers. For example, in 1981,cash benefits accounted for 71 percent of total bene-fits (Figure 3). Since 1995, however, cash benefitsper $100 of covered wages have declined, while medical payments have increased or remained constant (Figure 2). As a result, workers’ compensa-tion benefits have been almost equally dividedbetween medical payments and cash benefits since2010 (Figure 3).
Workers’ compensation costs to employers were$91.8 billion in 2014, an increase of 26.1 percent inthe period 2010-2014. Over the same period, thenumber of workers covered by workers’ compensa-
tion increased by 6.4 percent, and covered wagesincreased by 16.9 percent. When measured relativeto $100 of covered wages, employer costs increasedby $0.10 (8%) over the period 2010-2014 to $1.35in 2014.
Despite two consecutive years of declining workers’compensation benefit payments, the increases incosts and coverage reflect, at least in part, the U.S.economy recovering from the Great Recession. As employment increases, the number of workers
2 NATIONAL ACADEMY OF SOCIAL INSURANCE
Medical and cash benefits have accounted for almost equal shares of total workers’ compensation
benefits since 2010.
Table 1Overview of Workers' Compensation Benefits, Coverage, and Costs, 2010-2014
Percent Change
Aggregate Benefits, Coverage, and Costs 2014 2010-2012 2012-2014 2010-2014
Covered Workers (in thousands) 132,673 2.7 3.6 6.4
Covered Wages (in billions) $6,820 8.4 7.9 16.9
Total Benefits (billions) 62.3 7.0 -1.2 5.7
Medical Benefits 31.4 7.6 -0.4 7.2
Cash Benefits 30.9 6.4 -2.0 4.3
Employer Costs (billions) 91.8 15.9 8.8 26.1
Benefits and Costs per $100 of Dollar Change
Covered Wages 2014 2010-2012 2012-2014 2010-2014
Total Benefits $0.91 -$0.01 -$0.09 -$0.10
Medical Benefits 0.46 0.00 -0.04 -0.04
Cash Benefits 0.45 -0.01 -0.05 -0.06
Employer Costs 1.35 0.08 0.02 0.10
Notes: Benefits are calendar-year payments to injured workers (cash benefits) and to providers of their medical care (medicalbenefits). Costs for employers who purchase workers' compensation insurance include calendar-year insurance premiums paidplus benefits paid by the employer to meet the annual deductible, if any. Costs for self-insuring employers are calendar-yearbenefits paid plus the administrative costs associated with providing those benefits.
Source: National Academy of Social Insurance estimates.

covered by workers’ compensation increases alongwith the number of work-related injuries. Thus,workers’ compensation benefits and costs increase aswell. However, employer costs increase more rapidlyat first while benefits increase more slowly. Thisoccurs because employer costs immediately reflectthe increases in premiums paid to cover additionalworkers. Benefits, on the other hand, lag behindincreases in costs and coverage because they com-mence when an injury occurs and sometimes extendinto subsequent years. Because benefits and costs areso sensitive to covered employment, it is best to con-trol for growth in covered wages to identify trendsover time and when making comparisons acrossstates.
Figure 1 shows long-term trends in benefits andcosts per $100 of covered wages. Employer costssteadily increased between 2010 and 2013 with theeconomic recovery and stabilized at $1.35 in both2013 and 2014. Despite the recent increases,employer costs per $100 covered wages remain atsome of the lowest levels of the past 35 years.Benefits per $100 of covered wages, which have beenfairly constant since 2006, fell from $0.97 in 2013to $0.91 in 2014 (Figure 1), the lowest level since1980, when the data series began.
Figure 1Workers’ Compensation Benefits and Costs Per $100 of Covered Wages, 1980-2014
Notes: Benefits are calendar-year payments to injured workers and to providers of their medical care. Costs for employers who purchase workers' compensation insurance include calendar-year insurance premiums paid plus benefits paid by the employer to meet the annual deducible, if any. Costs forself-insuring employers are calendar-year benefits paid plus the administrative costs associated with providing those benefits.
Source: National Academy of Social Insurance estimates.
$0.00
$0.50
$1.00
$1.50
$2.00
$2.50
1980
1981
1982
1983
1984
1985
1986
1987
1988
1989
1990
1991
1992
1993
1994
1995
1996
1997
1998
1999
2000
2001
2002
2003
2004
2005
2006
2007
2008
2009
2010
2011
2012
2013
2014
1.861.76
1.671.58
1.94
1.50
1.64
1.49
1.79
2.04
2.18 2.16 2.172.132.05
1.83
1.621.51
1.421.36 1.35
1.46
1.61
1.74 1.74 1.72
1.581.48
1.351.30
1.25 1.281.33 1.35 1.35
0.96 0.971.04 1.05 1.09
1.171.23
1.291.34
1.461.57
1.65 1.65
1.531.47
1.351.26
1.171.13 1.121.06 1.10 1.13 1.16 1.13 1.09
0.99 0.96 0.991.041.01 1.00 1.00 0.97
0.91
Workers’ Compensation: Benefits, Coverage, and Costs • 3
Employer Costs
Benefits

Background on Workers’ CompensationThis section of the report, covering backgroundmaterial that is repeated annually, describes the histo-ry of workers’ compensation insurance in the UnitedStates; the current structure of state workers’ com-pensation programs; types of benefits paid; and howworkers’ compensation is financed. Reporting ofdetailed program data for 2014 begins on page 18.
History of Workers’ CompensationWorkers’ compensation was the first social insuranceprogram adopted in most developed countries.Germany enacted the first modern workers’ compen-sation laws, known as Sickness and Accident Laws,
in 1884 under Chancellor Otto von Bismarck(Clayton, 2004). The next such laws were enacted inEngland in 1897.
The first workers’ compensation law in the UnitedStates was enacted in 1908 to cover certain federalcivilian workers. Most states adopted workers’ com-pensation laws in a relatively short period between1910 and 1920. The first state laws that survivedconstitutional challenges were passed in 1911 byNew Jersey and Wisconsin.1 Of the contiguous 48states, the last to pass a workers’ compensation lawwas Mississippi in 1948. Today, workers’ compensa-tion coverage is more than 100 years old in 32 states(Fishback and Kantor, 1996).
4 NATIONAL ACADEMY OF SOCIAL INSURANCE
Figure 2Workers’ Compensation Medical and Cash Benefits Per $100 of Covered Wages, 1980-2014
Source: National Academy of Social Insurance estimates.
$0.00
$0.20
$0.40
$0.60
$0.80
$1.00
$1.20
19
80
1981
1982
1983
1984
1985
1986
1987
1988
1989
1990
1991
1992
1993
1994
1995
1996
1997
1998
1999
2000
2001
2002
2003
2004
2005
2006
2007
2008
2009
2010
2011
2012
2013
2014
0.68 0.68 0.70 0.710.73
0.78 0.80 0.82 0.840.89
0.940.99
0.96
0.87 0.89
0.810.76
0.680.65 0.63
0.60 0.60 0.61 0.61 0.61
0.28 0.29
0.34 0.360.39
0.430.47
0.50
0.570.62
0.660.69
0.580.54
0.50 0.48 0.48 0.48 0.470.50 0.52
0.550.53 0.51
0.59
0.520.50 0.50
0.53 0.51 0.50 0.50 0.480.45
0.34
0.66
0.47 0.460.46 0.49 0.50 0.50 0.50 0.49
0.46
1 The New Jersey law was enacted on April 3, 1911, signed by Governor Woodrow Wilson on April 4, and took effect on July 4,1911 (Calderone, 2011). The Wisconsin law was enacted and took effect on May 3, 1911 (Krohm, 2011).
Cash Benefits
Medical Benefits
Before workers’ compensation laws were enacted,injured workers’ primary legal remedy for a work-related injury was to file a tort suit claimingnegligence on the part of their employer.2 Employerscould use three common law defenses to avoid liabil-ity: assumption of risk (showing the injury resultedfrom an ordinary hazard of employment of whichthe worker should have been aware);3 fellow workerrule (showing the injury was caused by a fellowworker’s negligence); or contributory negligence(showing the worker’s own negligence contributed tothe injury, regardless of any fault of the employer).
Given the available defenses, it was not surprisingthat employers often prevailed in court. Employerswere, however, at risk for substantial and unpre-dictable losses if a worker’s lawsuit was successful.Litigation also created friction between employersand workers so that both sides became increasinglydissatisfied with the status quo, setting the stage forreform.
Initial reforms came in the form of employer liabilityacts, which eliminated some of the employer’s com-mon law defenses. Nonetheless, employees still hadthe burden of proving negligence on the part of theemployer, which remained a significant obstacle to
Workers’ Compensation: Benefits, Coverage, and Costs • 5
2 Some injured workers received voluntary compensation from their employers or medical benefits paid through personal accident in-surance, but many workers received no compensation at all (Fishback and Kantor, 1996).
3 A more complete definition is provided by Willborn, et al. (2012): “The assumption of risk doctrine barred recovery for the ordinaryrisks of employment; the extraordinary risks of employment, if the worker knew of them or might reasonably have been expected toknow of them; and the risks arising from the carelessness, ignorance, or incompetency of fellow servants.”
Figure 3Percentage Share of Medical and Cash Benefits, 1980-2014
Source: National Academy of Social Insurance estimates.
0%
10%
20%
30%
40%
50%
60%
70%
80%
19
80
1981
1982
1983
1984
1985
1986
1987
1988
1989
1990
1991
1992
1993
1994
1995
1996
1997
1998
1999
2000
2001
2002
2003
2004
2005
2006
2007
2008
2009
2010
2011
2012
2013
2014
71 7169 68 67 66 65 64 63
61 60 6058 57
60 60 60 59 58 57 5654 54 53 54 54
52 52 51 50505051 50 50
4241404040
29
505050 50 5049494848464646 4746
4443
2931 32 33 34 35 36 37
3940 40
42 43
Per
cent
age
Sha
re
Cash Benefits
Medical Benefits

recovery of damages (Burton and Mitchell, 2003).4
Ultimately, both employers and employees favoredworkers’ compensation legislation to ensure thatworkers who sustained occupational injuries or con-tracted occupational diseases received predictable andtimely compensation. As a quid pro quo, workers’compensation became the “exclusive remedy” foroccupational injuries and diseases, and an employer’sliability was limited to the statutory benefits speci-fied in a state workers’ compensation act.5
The adoption of state workers’ compensation pro-grams has been called a significant event in thenation’s economic, legal, and political history.Passage of the laws required prodigious efforts on thepart of business and labor leaders in each state toreach agreements on the specifics of the laws.Essentially, business and labor reached a grand com-promise: Injured workers gave up the right to suetheir employers in return for guaranteed benefits.Employers agreed to pay compensation for coveredinjuries on a no-fault basis in return for statutorylimits on coverage.
Today, each of the 50 states, the District of Columbia,and the U.S. territories has its own workers’ compen-sation program. Separate U.S. government programscover federal civilian employees, long shore and har-bor workers, and specific high-risk workers (e.g., coalminers with black lung disease, energy employeesexposed to certain materials such as beryllium, work-ers exposed to radiation, and veterans of militaryservice). State workers’ compensation programs varyin terms of who is allowed to provide insurance,which injuries or illnesses are compensable, and thelevel of benefits provided. However, there is consisten-cy across states in central features of the programs:
� With the exception of Texas, workers’ compen-sation insurance coverage is mandatory for pri-vate-sector employers in all states, with limitedexemptions for small employers and for workersin specific classifications, such as agricultural ordomestic employees.6 Oklahoma adopted a law,implemented in 2014, that allows employers toopt-out of a traditional workers’ compensationplan by adopting an alternative benefit plan.7
� Workers’ compensation pays 100 percent ofinjury-related medical costs for injured workersand cash benefits for lost work time. Lost-timecompensation may be subject to a waitingperiod (typically three to seven days) that maybe waived retroactively if the disability involveshospitalization or a lengthy duration of workabsence. Wage-replacement rates vary by statebut are, on average, about two-thirds of aworker’s pre-injury gross wage.
4 As a result, the employers’ liability approach wasabandoned in all jurisdictions and industries exceptthe railroads, where it still exists.
6 NATIONAL ACADEMY OF SOCIAL INSURANCE
4 As a result, the employers’ liability approach was abandoned in all jurisdictions and industries except the railroads, where it still exists.
5 Under the exclusive remedy concept, the worker accepts workers’ compensation as payment in full and gives up the right to sue.There are limited exceptions to the exclusive remedy concept in some states, such as when there is an intentional injury of the em-ployee or when an employer violates a safety regulation. A suit is also possible if the employer is illegally insured.
6 In addition, many states allow specific classes of employers to voluntarily purchase workers’ compensation coverage or to opt-out ofstatutory coverage, e.g., independent contractors, corporate officers, and local governments.
7 Oklahoma passed sweeping workers’ compensation reforms in 2013 when Senate Bill 1062 was signed into law. The bill, which be-came effective January 1, 2014, allows employers to provide insurance for injured workers under alternative benefit systems based onthe Federal Employee Retirement Income Security Act (Postal, 2013). Under the Oklahoma Employee Injury Benefit Act (OEIBA)a “qualified employer” may opt out of the state workers’ compensation system if it provides the state Insurance Commissioner with awritten private benefit plan that offers comparable coverage consistent with the state constitution and shows proof that the employeris financially capable of paying the required compensation. Although it is described as an “opt-out” provision, employers in Okla-homa must still insure their workers against work-related injuries. This is in contrast to Texas, which places no coverage requirementson employers who decide to opt-out of the workers’ compensation system. In Texas, employers who opt-out of workers’ compensa-tion face the possibility of tort suits from injured workers, whereas in Oklahoma, employers are protected against tort suits whetherthey remain in the state regulated workers’ compensation system or choose an optional private benefit plan (Krohm, 2016). In Feb-ruary 2016 the Oklahoma Workers’ Compensation Commission ruled that the employer opt-out was unconstitutional but the deci-sion has been appealed to the Oklahoma Supreme Court (Berkes and Grabell, 2016).
Each of the 50 states, the District ofColumbia, and the U.S. territories has
its own workers’ compensation program. Separate U.S. government
programs cover federal civilian employees and specific high-risk
occupations.

� With a few exceptions, workers’ compensationis financed exclusively by employers. Employerspurchase workers’ compensation insurancefrom private insurers or a state insurance fund,or some large employers may self-insure.8 Inthree states, workers pay part of the cost ofworkers’ compensation benefits and servicesthrough direct payroll deductions or charges.9
Workers’ Compensation Benefits There are three basic types of workers’ compensationclaims: (1) medical-only, (2) temporary disability,and (3) permanent disability, which are determinedby the severity of injury and whether or not theclaim involves an injury-related work absence. Medical-only claims are the most common, but permanent disability claims impose the greatest costs.
Medical-only claims. Most workers’ compensationclaims do not involve lost work time in excess of thewaiting period for cash benefits, so only medicalbenefits (and not cash benefits) are paid for theseclaims. “Medical-only” claims are the most commontype of workers’ compensation claim, but they represent only a small share of overall payments.According to the National Council onCompensation Insurance (NCCI), between 1994and 2012, medical-only claims accounted for 75 per-cent of all workers’ compensation claims, but only 7percent of total benefit payments, in the 37 stateswhere NCCI is licensed (NCCI, 2016b).10
Temporary disability claims. Temporary total dis-ability (TTD) benefits are paid when a work-relatedinjury or illness temporarily prevents a worker fromreturning to their pre-injury job or to another jobfor the same employer. Temporary total disability
claims accounted for more than 61 percent of allclaims involving cash benefits but less than 30 per-cent of cash benefits paid in 2012 (Figure 4).In most states, weekly benefits for temporary totaldisability claims are tax exempt. The benefits replaceapproximately two-thirds of the worker’s gross, pre-injury weekly earnings from the time-of-injuryemployer. If the worker had concurrent employmentat the time of injury (an additional job (or jobs) withanother employer) earnings from a second or otherjob may not be covered by temporary disability benefits.
Compensation for temporary disability is subject tomaximum and minimum benefit levels that varyfrom state to state. As of January 2016, the maxi-mum weekly TTD benefit ranged from a high of$1,628 in Iowa to a low of $469 in Mississippi. Theminimum weekly benefit ranged from a high of$585 in North Dakota to a low11 of $20 in Arkansasand Florida.12
Most workers who receive TTD benefits fully recov-er and return to work, at which time benefits end. In many cases, however, employers make accommo-dations allowing injured workers to return to workbefore they are physically able to resume some or allof their former job duties. In these cases, a workermay be assigned to restricted duties or shorter hoursat lower wages. When injured workers return towork at less than their pre-injury wage, they may be eligible for temporary partial disability (TPD) benefits.
Permanent disability claims. Some injured workersexperience work-related injuries or illnesses thatresult in permanent impairments. These workersmay be entitled to either permanent partial or per-manent total disability benefits. Eligibility forpermanent disability benefits is determined after the
Workers’ Compensation: Benefits, Coverage, and Costs • 7
8 Some economists argue that workers pay a substantial portion of program costs indirectly in the form of lower wages (Leigh, et al.2000).
9 In Washington, workers pay part of workers’ compensation premium costs through payroll deductions. (See footnote to Table 14.)Oregon has special funds for some workers’ compensation benefits that are financed in part by workers. New Mexico has a very smallassessment per covered worker.
10 The most current year reported in the NCCI Annual Statistical Bulletin (NCCI, 2016b) is 2012.
11 Colorado, Iowa, Maine, Michigan, Montana, Nevada, Oklahoma, and Rhode Island do not have a specified minimum weekly TTDbenefit.
12 Details on benefit and coverage provisions of state laws are compiled in Workers’ Compensation Laws as of January 2016, issued jointlyby the International Association of Industrial Accident Boards and Commissions and the Workers Compensation Research Instituteand summarized in Appendix C.

Figure 4Types of Disabilities in Workers’ Compensation Cases with Cash Benefits, 1994-2012
Percent of Cases
0.5% 0.5% 0.6%0.6%0.6%0.6%0.6%0.6%0.6% 0.7%0.6%1.0%0.7% 0.8% 0.8% 0.8% 0.8% 0.8% 0.9%
69%72% 72% 72%
68% 66%64% 63% 62%
66% 65% 64% 63%61%
58%60%59%
62%60%
30%27% 28%
31%
37% 36% 37%35%
33%
39%41% 40%40%
38%40%
27%
33% 34% 35%
Percent of Benefits
Notes: Cases classified as permanent partial include cases that are closed with lump sum settlements. Benefits paid in cases classified as permanent partial, permanent total and fatalites can include any temporary total disability benefits also paid in such cases. The data are from the first report fromthe NCCI Annual Statistical Bulletin.
Source: NCCI (1995-2016), Annual Statistical Bulletin, Exhibits X and XII.
8 NATIONAL ACADEMY OF SOCIAL INSURANCE
Temporary Total
Permanent Partial
Permanent Total & Fatalities
1994 1995 1996 1997 1998 1999 2000 2001 2002 2003 2004 2005 2006 2007 2008 2009 2010 2011 2012
64%
60% 58% 58% 59%62% 61%
65%63% 63%
57% 58% 58%60%59%
25%22%
20%
24%26%
23% 24%26%25%
30%28%
24%
19%
25%
8%
59%57%
58%
53%
24% 24%
20% 19% 19%
10% 9% 9% 9% 9%11%11%11%10%10%11%
12% 13%12%11%11% 11%12%
Permanent Partial
Temporary Total
Permanent Total & Fatalities
1994 1995 1996 1997 1998 1999 2000 2001 2002 2003 2004 2005 2006 2007 2008 2009 2010 2011 2012
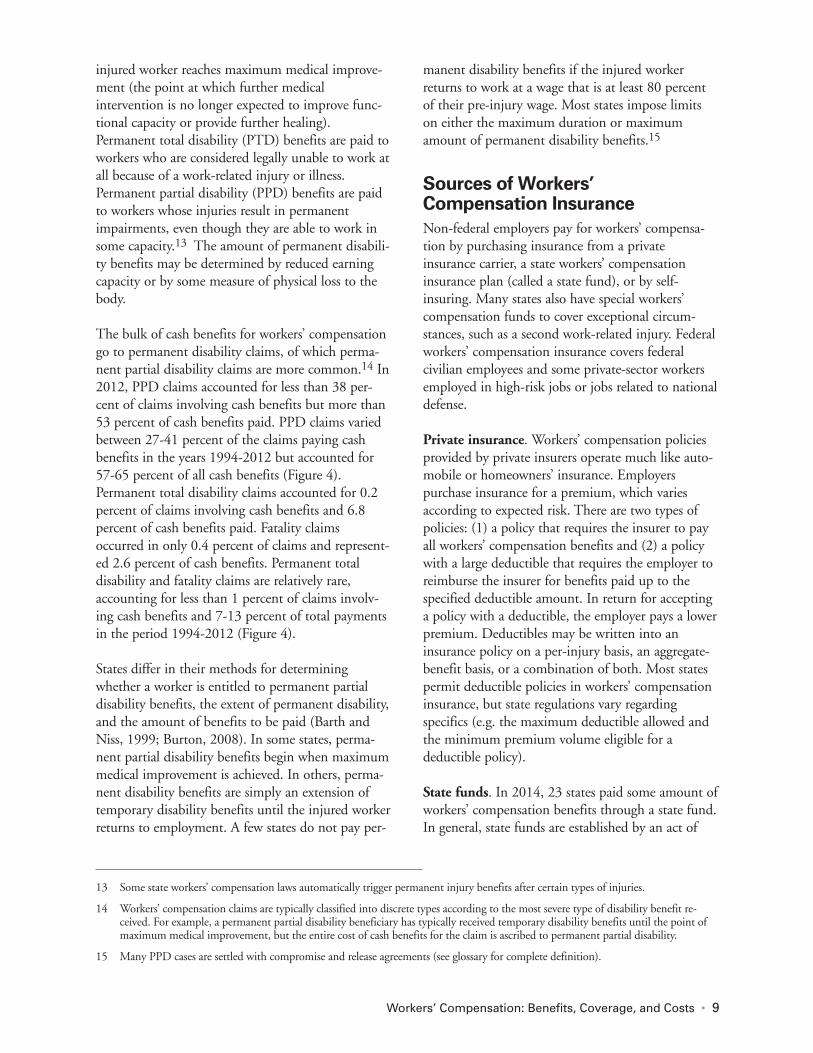
injured worker reaches maximum medical improve-ment (the point at which further medicalintervention is no longer expected to improve func-tional capacity or provide further healing).Permanent total disability (PTD) benefits are paid toworkers who are considered legally unable to work atall because of a work-related injury or illness.Permanent partial disability (PPD) benefits are paidto workers whose injuries result in permanentimpairments, even though they are able to work insome capacity.13 The amount of permanent disabili-ty benefits may be determined by reduced earningcapacity or by some measure of physical loss to thebody.
The bulk of cash benefits for workers’ compensationgo to permanent disability claims, of which perma-nent partial disability claims are more common.14 In2012, PPD claims accounted for less than 38 per-cent of claims involving cash benefits but more than53 percent of cash benefits paid. PPD claims variedbetween 27-41 percent of the claims paying cashbenefits in the years 1994-2012 but accounted for57-65 percent of all cash benefits (Figure 4).Permanent total disability claims accounted for 0.2percent of claims involving cash benefits and 6.8percent of cash benefits paid. Fatality claimsoccurred in only 0.4 percent of claims and represent-ed 2.6 percent of cash benefits. Permanent totaldisability and fatality claims are relatively rare,accounting for less than 1 percent of claims involv-ing cash benefits and 7-13 percent of total paymentsin the period 1994-2012 (Figure 4).
States differ in their methods for determiningwhether a worker is entitled to permanent partialdisability benefits, the extent of permanent disability,and the amount of benefits to be paid (Barth andNiss, 1999; Burton, 2008). In some states, perma-nent partial disability benefits begin when maximummedical improvement is achieved. In others, perma-nent disability benefits are simply an extension oftemporary disability benefits until the injured workerreturns to employment. A few states do not pay per-
manent disability benefits if the injured workerreturns to work at a wage that is at least 80 percentof their pre-injury wage. Most states impose limitson either the maximum duration or maximumamount of permanent disability benefits.15
Sources of Workers’ Compensation Insurance Non-federal employers pay for workers’ compensa-tion by purchasing insurance from a privateinsurance carrier, a state workers’ compensationinsurance plan (called a state fund), or by self-insuring. Many states also have special workers’ compensation funds to cover exceptional circum-stances, such as a second work-related injury. Federalworkers’ compensation insurance covers federal civilian employees and some private-sector workersemployed in high-risk jobs or jobs related to nationaldefense.
Private insurance. Workers’ compensation policiesprovided by private insurers operate much like auto-mobile or homeowners’ insurance. Employerspurchase insurance for a premium, which variesaccording to expected risk. There are two types ofpolicies: (1) a policy that requires the insurer to payall workers’ compensation benefits and (2) a policywith a large deductible that requires the employer toreimburse the insurer for benefits paid up to thespecified deductible amount. In return for acceptinga policy with a deductible, the employer pays a lowerpremium. Deductibles may be written into an insurance policy on a per-injury basis, an aggregate-benefit basis, or a combination of both. Most statespermit deductible policies in workers’ compensationinsurance, but state regulations vary regardingspecifics (e.g. the maximum deductible allowed andthe minimum premium volume eligible for adeductible policy).
State funds. In 2014, 23 states paid some amount ofworkers’ compensation benefits through a state fund.In general, state funds are established by an act of
Workers’ Compensation: Benefits, Coverage, and Costs • 9
13 Some state workers’ compensation laws automatically trigger permanent injury benefits after certain types of injuries.
14 Workers’ compensation claims are typically classified into discrete types according to the most severe type of disability benefit re-ceived. For example, a permanent partial disability beneficiary has typically received temporary disability benefits until the point ofmaximum medical improvement, but the entire cost of cash benefits for the claim is ascribed to permanent partial disability.
15 Many PPD cases are settled with compromise and release agreements (see glossary for complete definition).

state legislature and are designated as exclusive orcompetitive. An exclusive state fund is, by statute, thesole provider of workers’ compensation insurance ina state (although some states with an exclusive statefund allow employers to self-insure). A competitivestate fund competes with other workers’ compensa-tion insurers, making them sometimes difficult todifferentiate from private insurers. For this report, wedefine an insurer as a competitive state fund if: (1) theinsurer sells workers’ compensation policies to pri-vate-sector employers in the voluntary insurancemarket and (2) the insurer is exempt from federaltaxes. In 2014, four states had exclusive state fundsand, according to our criteria, 17 states had competi-tive state funds.16 In addition, South Carolina had anonexclusive state fund that provided workers’ com-pensation insurance for state and local governmentemployees but did not write policies for privateemployers. West Virginia discontinued its state fundin 2009, but was still paying benefits on some claimsin 2014.
Self-insurance. Many large employers choose to self-insure for workers’ compensation.17 Whereself-insurance is permitted, employers must apply forpermission to self-insure from the regulatory authori-ty, and demonstrate that they have the financialresources to cover their expected workers’ compensa-tion losses.18 Some states permit groups ofemployers in the same industry or trade associationto self-insure through group self-insurance.
Guaranty funds. State guaranty funds ensure benefitpayments to injured workers in cases where a privateinsurance carrier or self-insured employer becomesinsolvent and does not have sufficient assets ear-marked to pay outstanding benefits. The benefitpayments and administrative costs of guaranty fundsfor private insurers are typically funded throughassessments on workers’ compensation insurers, andfor self-insured employers through assessments onself-insuring employers.
Second injury funds reimburse employers or insur-ance carriers in cases where an employee with apre-existing condition related to a work-relatedinjury experiences another work-related injury or ill-ness. The second injury fund pays the costsassociated with the prior condition to reduce the costburden on the current employer. The funds encour-age employers to hire injured workers with residualimpairments who want to return to work. The cur-rent employer is responsible only for workers’compensation benefits associated with the secondinjury or illness. Second injury funds are financedthrough assessments on employers, and, in limitedjurisdictions, with general fund monies.19
Federal programs. The federal government coversworkers’ compensation benefits for federal civilianemployees under the Federal EmployeesCompensation Act (FECA). Federal programs alsocover some private-sector workers, including coalminers with black lung disease, employees of over-seas contractors with the U.S. government, energyemployees exposed to certain hazardous materials,workers engaged in manufacturing atomic bombs,and veterans injured while on active duty in thearmed forces. The federal government also providesoversight for workers’ covered under the Longshoreand Harbor Workers’ Compensation Act (LHWCA),but employers are still required to purchase privateinsurance or self-insure. (More details about thesefederal programs are provided in Appendix B.)
10 NATIONAL ACADEMY OF SOCIAL INSURANCE
16 In 2014, North Dakota, Ohio, Washington, and Wyoming had exclusive state funds. Competitive state funds operated in California,Colorado, Hawaii, Idaho, Kentucky, Louisiana, Maryland, Missouri, Montana, New Mexico, New York, Oklahoma, Oregon, Penn-sylvania, Rhode Island, Texas, and Utah.
17 Employers are allowed to self-insure in all states except for North Dakota and Wyoming, which both require all employers to obtainworkers’ compensation insurance from their exclusive state funds.
18 Nearly all self-insured firms are required to post some type of financial security (e.g. surety bonds) so that workers’ compensationbenefits are paid even if the employer experiences financial distress.
19 See Sources and Methods 2014 on the Academy’s website for further details on special funds, second injury funds, and guaranty funds.
Employers purchase workers’ compensation insurance from privateinsurers, a state fund, or some largefirms choose to self-insure. Just as
with other forms of insurance, policieswith deductibles are available at
lower premium rates.
Workers’ Compensation: Benefits, Coverage, and Costs • 11
Estimates for 2014The workers’ compensation system involves numer-ous stakeholder groups: employers, workers, insurers,medical providers, attorneys, and state and federalgovernments. The estimates presented in this reportreflect the aggregate experience of only two groups:workers who rely on compensation for workplaceinjuries, and employers who pay the bills. TheAcademy’s measures are designed to provide the best
available estimates of workers’ compensation cover-age, benefits, and employer costs, in a given year andover time. The estimates are not designed to assess theperformance of the insurance industry or insurancemarkets; other organizations analyze insurancetrends.20 The estimates are also not designed to measure the extent to which benefits paid to injuredworkers compensate them for their earnings lossesdue to injury, or what is typically referred to as bene-fit “adequacy.”21
Table 2Workers' Compensation Covered Workers and Covered Wages, 1994-2014
Total Workers Total Wages Year (thousands) Percent Change (billions) Percent Change
1994 109,400 3.0 $2,949 5.2
1995 112,800 3.1 3,123 5.9
1996 114,773 1.7 3,337 6.9
1997 118,145 2.9 3,591 7.6
1998 121,485 2.8 3,885 8.2
1999 124,349 2.4 4,151 6.8
2000 127,141 2.2 4,495 8.3
2001 126,972 -0.1 4,604 2.4
2002 125,603 -1.1 4,615 0.2
2003 124,685 -0.7 4,717 2.2
2004 125,878 1.0 4,953 5.0
2005 128,158 1.8 5,213 5.3
2006 130,339 1.7 5,544 6.3
2007 131,734 1.1 5,857 5.6
2008 130,643 -0.8 5,954 1.7
2009 124,856 -4.4 5,675 -4.7
2010 124,638 -0.2 5,834 2.8
2011 126,022 1.1 6,063 3.9
2012 128,055 1.6 6,322 4.3
2013 130,245 1.7 6,466 2.3
2014 132,673 1.9 6,820 5.5
Source: National Academy of Social Insurance estimates. See Appendix A.
20 The National Council on Compensation Insurance and state rating bureaus, for example, assess insurance developments in the statesand advise regulators and insurers on proposed insurance rates.
21 Please refer to Hunt and Dillender (2014), Boden et al. (2005), and Hunt (2004) for a review of studies evaluating benefit adequacy.

12 NATIONAL ACADEMY OF SOCIAL INSURANCE
Tabl
e 3
Wor
kers' C
ompe
nsation Cov
ered
Wor
kers, b
y State, 201
0-20
14
Num
ber of
Wor
kers (i
n th
ousa
nds)
Perc
ent C
hang
eRan
king
aSt
ate
2010
2011
2012
2013
2014
2010
-201
220
12-2
014
2010
-201
4
Alaba
ma
1,68
11,
683
1,69
71,
717
1,73
61.
02.
33.
344
Alask
a29
930
531
131
331
54.
01.
45.
430
Arizo
na2,
295
2,32
62,
374
2,43
12,
485
3.4
4.7
8.3
11
Ark
ansa
s1,
083
1,09
01,
098
1,09
81,
103
1.4
0.5
1.9
50
Califo
rnia
14,1
7114
,310
14,6
7415
,139
15,5
673.
66.
19.
95
Col
orad
o2,
110
2,14
72,
200
2,27
12,
353
4.3
6.9
11.5
3
Con
nect
icut
1,57
61,
594
1,61
11,
623
1,63
62.
21.
63.
842
Delaw
are
392
396
398
407
417
1.7
4.7
6.5
23
District o
f Col
umbi
a48
349
450
651
953
24.
95.
110
.34
Flor
ida
6,64
46,
727
6,86
57,
045
7,24
93.
35.
69.
16
Geo
rgia
3,56
63,
608
3,65
83,
737
3,82
92.
64.
77.
417
Haw
aii
551
558
569
583
593
3.3
4.3
7.7
15
Idah
o59
259
560
261
863
41.
85.
37.
118
Illin
ois
5,39
75,
467
5,53
75,
590
5,66
92.
62.
45.
033
Indi
ana
2,65
52,
705
2,76
22,
799
2,84
24.
02.
97.
019
Iow
a1,
402
1,41
91,
443
1,46
41,
483
2.9
2.8
5.8
28
Kan
sas
1,26
11,
268
1,28
51,
303
1,32
21.
92.
94.
834
Ken
tuck
y1,
665
1,68
91,
718
1,73
81,
765
3.2
2.7
6.0
25
Loui
sian
a1,
796
1,81
11,
833
1,85
81,
889
2.1
3.1
5.2
32
Mai
ne55
956
256
556
957
31.
11.
42.
548
Mar
ylan
d2,
310
2,33
02,
363
2,38
42,
406
2.3
1.8
4.2
38
Mas
sach
uset
ts3,
098
3,13
63,
190
3,24
43,
315
3.0
3.9
7.0
21
Michi
gan
3,62
13,
705
3,78
63,
873
3,92
44.
53.
68.
410
Min
neso
ta2,
506
2,55
32,
597
2,64
32,
682
3.6
3.3
7.0
20
Mississip
pi99
61,
000
1,00
81,
018
1,02
71.
11.
93.
147
Workers’ Compensation: Benefits, Coverage, and Costs • 13
Miss
ouri
2,40
12,
413
2,43
52,
467
2,49
61.
42.
53.
940
Mon
tana
405
406
414
421
424
2.2
2.4
4.7
35
Neb
rask
a87
087
489
290
591
82.
62.
95.
629
Nev
ada
1,08
81,
095
1,11
21,
140
1,18
22.
26.
48.
77
New
Ham
pshi
re59
359
860
561
161
92.
12.
34.
537
New
Jersey
3,68
03,
687
3,72
53,
769
3,79
31.
21.
83.
146
New
Mex
ico
725
726
730
738
742
0.7
1.7
2.4
49
New
Yor
k8,
195
8,30
88,
428
8,54
98,
710
2.8
3.3
6.3
24
Nor
th C
arol
ina
3,62
63,
678
3,74
33,
814
3,87
83.
23.
67.
022
Nor
th D
akot
a34
536
639
941
443
215
.48.
325
.01
Ohi
o4,
822
4,88
84,
967
5,03
35,
108
3.0
2.8
5.9
26
Okl
ahom
a1,
359
1,37
81,
404
1,43
51,
459
3.4
3.9
7.4
16
Ore
gon
1,56
71,
587
1,61
21,
651
1,69
92.
95.
38.
49
Penn
sylv
ania
5,34
35,
409
5,45
85,
482
5,52
92.
21.
33.
543
Rho
de Is
land
436
437
441
445
452
1.2
2.6
3.8
41
Sout
h C
arol
ina
1,66
61,
689
1,71
71,
755
1,79
93.
14.
88.
013
Sout
h D
akot
a37
437
838
538
939
53.
02.
75.
827
Tenn
esse
e2,
412
2,45
62,
503
2,55
02,
603
3.8
4.0
7.9
14
Texa
s8,
234
8,33
48,
477
8,62
38,
903
3.0
5.0
8.1
12
Uta
h1,
109
1,13
71,
177
1,21
61,
253
6.1
6.5
13.0
2
Ver
mon
t28
428
729
029
229
52.
31.
84.
239
Virgi
nia
3,29
53,
338
3,37
43,
400
3,40
02.
40.
83.
245
Was
hing
ton
2,66
72,
707
2,75
12,
820
2,89
93.
25.
48.
78
Wes
t Virgi
nia
655
665
674
668
662
2.9
-1.8
1.1
51
Wisco
nsin
2,53
92,
572
2,60
02,
628
2,65
42.
42.
14.
536
Wyo
min
g26
326
727
127
227
73.
02.
35.
431
Tota
l Non
-Fed
eral
121,
657
123,
159
125,
235
127,
474
129,
929
2.9
3.7
6.8
Fede
ral E
mpl
oyee
s2,
981
2,86
42,
820
2,77
12,
744
-5.4
-2.7
-7.9
TO
TAL
124,
638
126,
022
128,
055
130,
245
132,
673
2.7
3.6
6.4
a.St
ates
are
ran
ked
from
1 to
51
by th
e larg
est p
erce
nt in
crea
se in
the nu
mbe
r of
cov
ered
wor
kers fr
om 2
010
to 2
014.
Source:N
atio
nal A
cade
my
of S
ocia
l Ins
uran
ce estim
ates
. See
App
endi
x A.
14 NATIONAL ACADEMY OF SOCIAL INSURANCE
Tabl
e 4
Wor
kers' C
ompe
nsation Cov
ered
Wag
es, b
y State, 201
0-20
14
Cov
ered
Wag
es (i
n m
illio
ns)
Perc
ent C
hang
eRan
king
aSt
ate
2010
2011
2012
2013
2014
2010
-201
220
12-2
014
2010
-201
4
Alaba
ma
$66,
021
$67,
443
$69,
494
$70,
846
$73,
377
5.3
5.6
11.1
46
Alask
a14
,062
14,6
7715
,367
15,8
2216
,499
9.3
7.4
17.3
20
Arizo
na98
,288
102,
162
106,
986
110,
455
115,
300
8.9
7.8
17.3
21
Ark
ansa
s38
,652
40,1
6941
,484
41,2
9043
,634
7.3
5.2
12.9
42
Califo
rnia
749,
264
783,
390
831,
610
861,
194
914,
844
11.0
10.0
22.1
7
Col
orad
o99
,804
104,
124
110,
073
114,
426
122,
942
10.3
11.7
23.2
5
Con
nect
icut
93,6
1697
,281
99,9
3510
1,06
410
4,44
16.
74.
511
.645
Delaw
are
19,0
2319
,913
20,5
5321
,108
22,1
048.
07.
516
.230
District o
f Col
umbi
a35
,214
36,8
0538
,542
39,7
5641
,850
9.4
8.6
18.8
11
Flor
ida
273,
103
281,
411
293,
267
299,
051
321,
517
7.4
9.6
17.7
17
Geo
rgia
154,
199
160,
163
167,
030
168,
319
182,
121
8.3
9.0
18.1
15
Haw
aii
22,1
3022
,753
23,7
6024
,753
25,9
117.
49.
117
.122
Idah
o20
,335
20,8
6821
,463
22,4
7523
,768
5.5
10.7
16.9
25
Illin
ois
265,
517
276,
331
287,
520
292,
573
305,
179
8.3
6.1
14.9
36
Indi
ana
103,
299
107,
900
113,
017
115,
798
120,
024
9.4
6.2
16.2
31
Iow
a53
,097
55,3
0657
,861
59,8
7362
,775
9.0
8.5
18.2
13
Kan
sas
48,5
5250
,106
52,2
6853
,607
55,9
587.
77.
115
.333
Ken
tuck
y63
,736
66,0
9768
,692
70,1
6173
,262
7.8
6.7
14.9
35
Loui
sian
a73
,643
76,0
7878
,716
81,1
7184
,992
6.9
8.0
15.4
32
Mai
ne20
,502
20,9
5921
,426
21,9
7622
,783
4.5
6.3
11.1
47
Mar
ylan
d11
4,29
111
7,73
512
2,14
812
3,58
612
7,74
16.
94.
611
.843
Mas
sach
uset
ts17
8,23
318
6,32
619
3,73
320
0,04
421
1,96
78.
79.
418
.910
Michi
gan
159,
926
168,
623
175,
755
176,
734
189,
023
9.9
7.5
18.2
14
Min
neso
ta11
6,78
712
1,67
412
7,56
013
2,00
313
7,88
89.
28.
118
.116
Mississip
pi33
,554
34,3
0635
,487
36,4
3837
,443
5.8
5.5
11.6
44

Workers’ Compensation: Benefits, Coverage, and Costs • 15
Miss
ouri
96,5
4398
,885
102,
878
105,
160
109,
410
6.6
6.4
13.3
41
Mon
tana
13,6
5814
,169
15,0
0815
,492
16,1
599.
97.
718
.312
Neb
rask
a32
,089
33,0
8534
,687
35,8
2137
,450
8.1
8.0
16.7
27
Nev
ada
45,8
8346
,824
48,1
6049
,922
52,4
915.
09.
014
.439
New
Ham
pshi
re27
,065
28,1
0629
,005
29,7
6231
,506
7.2
8.6
16.4
28
New
Jersey
206,
476
211,
059
217,
495
223,
167
229,
085
5.3
5.3
11.0
48
New
Mex
ico
27,6
3828
,147
28,8
3228
,549
30,3
004.
35.
19.
651
New
Yor
k49
2,98
351
2,32
352
7,11
153
8,41
857
2,92
36.
98.
716
.229
Nor
th C
arol
ina
147,
851
153,
526
160,
039
161,
676
173,
060
8.2
8.1
17.1
23
Nor
th D
akot
a13
,004
15,1
5218
,187
19,6
9321
,884
39.9
20.3
68.3
1
Ohi
o19
9,44
720
7,77
521
7,77
322
2,97
323
2,92
49.
27.
016
.826
Okl
ahom
a50
,855
54,2
3857
,387
59,9
0562
,867
12.8
9.5
23.6
4
Ore
gon
64,6
3967
,704
70,7
0773
,690
78,3
939.
410
.921
.38
Penn
sylv
ania
242,
270
252,
338
262,
207
267,
201
277,
707
8.2
5.9
14.6
38
Rho
de Is
land
19,1
3919
,674
20,2
5420
,964
22,0
045.
88.
615
.034
Sout
h C
arol
ina
61,8
9964
,182
66,7
0668
,227
72,6
617.
88.
917
.418
Sout
h D
akot
a12
,575
13,1
3513
,820
14,2
6315
,065
9.9
9.0
19.8
9
Tenn
esse
e98
,992
102,
905
108,
730
110,
967
116,
163
9.8
6.8
17.3
19
Texa
s38
3,23
540
2,83
542
5,76
043
8,47
147
0,77
511
.110
.622
.86
Uta
h42
,894
44,9
2847
,795
50,0
8153
,039
11.4
11.0
23.7
2
Ver
mon
t11
,055
11,3
9111
,739
12,1
3312
,533
6.2
6.8
13.4
40
Virgi
nia
157,
873
163,
092
168,
671
167,
008
174,
289
6.8
3.3
10.4
50
Was
hing
ton
128,
028
134,
609
141,
613
148,
233
158,
274
10.6
11.8
23.6
3
Wes
t Virgi
nia
24,0
2625
,336
26,1
0325
,575
26,6
118.
61.
910
.849
Wisco
nsin
100,
999
104,
948
108,
660
109,
533
115,
813
7.6
6.6
14.7
37
Wyo
min
g10
,924
11,4
6511
,964
12,1
4312
,781
9.5
6.8
17.0
24
Tota
l Non
-Fed
eral
$5,6
26,8
86$5
,854
,426
$6,1
15,0
40$6
,263
,554
$6,6
13,5
108.
78.
217
.5
Fede
ral E
mpl
oyee
s$2
07,1
62$2
09,0
59$2
06,8
23$2
02,0
17$2
06,8
77-0
.20.
0-0
.1
TO
TAL
$5,8
34,0
48$6
,063
,485
$6,3
21,8
63$6
,465
,571
$6,8
20,3
878.
47.
916
.9
a.St
ates
are
ran
ked
from
1 to
51
by th
e larg
est p
erce
nt in
crea
se in
cov
ered
wag
es fr
om 2
010
to 2
014.
Source:N
atio
nal A
cade
my
of S
ocia
l Ins
uran
ce estim
ates
. See
App
endi
x A.

16 NATIONAL ACADEMY OF SOCIAL INSURANCE
Covered Employmentand Wages
Methods for Estimating CoveredEmployment and Wages Because there is no national system for counting thenumber of workers covered by workers’ compensa-tion, covered workers and wages must be estimated.The Academy’s methodology (for all states exceptTexas) is designed to count the number of workerswho are legally required to be covered by workers’compensation under state laws. We use the numberof workers and amount of wages covered by unem-ployment insurance (UI) in each state as the startingpoint for our estimates (Table 2).22 From thesebases, we subtract the number of workers and corre-sponding amount of wages that are not required tobe covered by workers’ compensation according toeach state’s statute (e.g. workers in small firms andagricultural workers). In Texas, where coverage isoptional for employers, we apply the proportion ofworkers employed in firms that opt-in to workers’compensation to the UI base.
Oklahoma also adopted a provision allowing certainemployers to opt-out of the state workers’ compensa-tion system and purchase an alternative privatebenefit insurance plan. However, there are no reliableestimates of the total number of workers who havebeen covered under this alternative arrangement.Current evidence suggests that the opt-out programonly affects a small number of workers, so we havenot adjusted for the opt-out in estimating workers’compensation coverage in Oklahoma in 2014.23
The Academy’s methodology may undercount theactual number of workers (and wages) coveredbecause some employers that are not required tocarry workers’ compensation do so anyway. Forexample, self-employed persons are not typically
required to carry unemployment or workers’ com-pensation insurance, but, in some states,self-employed persons may voluntarily elect to becovered. In states with exemptions for small firms,some small firms may voluntarily purchase workers’compensation insurance.
On the other hand, our methodology may overesti-mate the number of workers (and wages) coveredbecause some employers are not in compliance withtheir state’s workers’ compensation or unemploy-ment insurance laws. Every state has a program todetect and penalize employers who fail to report orcover employees under state labor statutes, but nodefinitive national study has documented the extentof noncompliance. (For more details on theAcademy’s methods for estimating coverage refer toAppendix A.)
Estimates of Covered Wages andWorkers In 2014, workers’ compensation covered an estimat-ed 132.7 million U.S. workers, a 1.9 percent increasefrom the previous year (Table 2). The number ofworkers covered increased steadily between 2010 and2014, as the economy pulled out of the recession,such that 6.4 percent more workers were covered in2014 than in 2010 (Table 3). Overall, workers’ com-pensation coverage extended to an estimated 91percent of the employed workforce and 97 percentof workers covered by unemployment insurance in2014.24
Between 2010 and 2014, the numberof U.S. workers covered by workers’compensation increased 6.5 percent,and the amount of covered wages
increased 17.0 percent.
22 Unemployment Insurance (UI) programs, under the U.S. Department of Labor, provide cash benefits to workers who become un-employed (through no fault of their own) and meet specific eligibility requirements.
23 There is preliminary evidence that roughly 22,500 employees were covered by alternative plans (Grabell and Berkes, 2015). If cor-rect, this would represent 1.5 percent of Oklahoma’s workforce, although some officials believe even that number to be high. Hence,we do not adjust for the opt-out provision in Oklahoma in our estimates of covered workers in 2014. A constitutional challenge tothe opt-out law is now being appealed to the Oklahoma Supreme Court. If the law is found to be constitutional, the number of em-ployers opting out of traditional coverage is likely to increase.
24 According to the Bureau of Labor Statistics (BLS), the total employed workforce in the United States was 146.3 million in Decem-ber 2014. According to unpublished estimates provided by the BLS, 2 percent of civilian workers represented by the BLS National
Workers’ Compensation: Benefits, Coverage, and Costs • 17
Between 2010 and 2014, every state experienced anincrease in the number of workers covered by work-ers’ compensation, with the largest increases inNorth Dakota (25.0%), Utah (13.0%), andColorado (11.5%) (Table 3). States with the smallestincreases in coverage (lagging behind in the recovery)were West Virginia (1.1%), Arkansas (1.9%), andMaine (2.5%). In fact, West Virginia was unique inexperiencing a decline in the number of coveredworkers between 2012 and 2014, the years followingthe dissolution of its state fund.
Total wages of covered workers were $6.8 trillion in2014, a 5.5 percent increase from 2013, and a 16.9percent increase from 2010 (Tables 2 and 4). Allstates experienced an increase in covered wagesbetween 2010 and 2014, but there was tremendousvariation in the rates of increase. Covered wagesincreased most dramatically (68.3%) in NorthDakota, along with the boom in energy productionin the state (Table 4). No other state experienced anincrease anywhere near that rate, but seven statesachieved growth in covered wages in excess of 20percent: Utah (23.7%), Washington (23.6%),Oklahoma (23.6%), Colorado (23.2%), Texas(22.8%), and California (22.1%). At the other endof the spectrum, the smallest growth in coveredwages occurred in New Mexico (9.6%), Virginia(10.4%), West Virginia (10.8%), and New Jersey(11.0%).
While the number of U.S. workers and wages cov-ered by workers’ compensation increased broadly
between 2010 and 2014, there were significantdeclines among federal employees. The total numberof federal employees covered by workers’ compensa-tion declined 7.9 percent and covered wages fell 0.1percent across the same time period.
Workers’ CompensationBenefits Paid Data Sources for Estimating Benefits Paid This section describes the primary data sources thatwe used to estimate workers’ compensation benefitsnationally and for each state. A detailed, state-by-state explanation of how the benefit estimates in thisreport are produced is provided in Sources andMethods: A Companion to Workers’ Compensation:Benefits, Coverage, and Costs, 2014, and is availableon the Academy’s website (www.nasi.org).
The Academy’s estimates of workers’ compensationbenefits paid are based on three main data sources:1) data from the annual questionnaire distributed bythe Academy to state agencies and from annualreports published by the states; 2) data purchasedfrom A.M. Best, a private company that specializesin collecting insurance data and rating insurancecompanies; and 3) data from the National Councilon Compensation Insurance (NCCI). Together, thedata from state agencies, A.M. Best, and NCCIallow us to piece together estimates of workers’ com-pensation benefits paid by private insurance carriers,state funds, and self-insured employers. The U.S.Department of Labor provides data on benefits paidthrough federal programs.
Academy questionnaire. The primary sources ofdata on benefits paid to injured workers are stateagencies’ responses to the Academy’s questionnaireon workers’ compensation benefits and costs. Thequestionnaire is distributed annually to state agenciesoverseeing workers’ compensation programs. This
footnote 24 continued...
Compensation Survey (NCS) were employed in establishments reporting zero annual workers’ compensation costs in March 2015(DOL, 2016). Civilian workers are those employed in private industry or state and local governments. Excluded from private industry are the self-employed and farm and private household workers. Federal government workers are excluded from the publicsector. The private industry series and the state and local government series provide data for the two sectors separately. The Academy’s estimate of legally required workers’ compensation coverage is 97.1 percent of all UI covered workers in 2014, which isvirtually identical to the workers ’ compensation coverage shown by the NCS.
All states experienced increases in covered wages and employmentbetween 2010 and 2014, in contrastto the Federal government where
covered workers and wages declined.

year, responses were received from 37 out of 51 juris-dictions, for a response rate of 73 percent. Sevenstates did not reply specifically to the Academy’squestionnaire because they published reports con-taining the workers’ compensation informationnormally included in the questionnaire. Includingthese reports, the total number of jurisdictions pro-viding data increases to 44 out of 51, for a responserate of 86 percent.
States vary in their ability to provide complete pro-gram data. The most common problems are inreporting amounts of benefits paid by employersunder deductible policies and by self-insuredemployers. If states do not report benefits paid byself-insured employers, these amounts are imputedbased on estimates of self-insured payrolls in thestate. Benefits provided under group self-insuranceare included with self-insured benefits in this report.
A.M. Best data. The A.M. Best data supplement thestate survey data in cases where the survey data areincomplete, missing, or determined to be incorrect.The A.M. Best data used for this report show bene-fits paid in each state for 2010 through 2014 (A.M.Best, 2015). The data include information for allprivate carriers in every state and for 17 of the 23state funds. The data do not include informationabout benefits paid by the other six state funds, byself-insured employers, by employers underdeductible policies, or by special funds.25
NCCI data. The primary source of data on medicalbenefits is NCCI (2016a). Where NCCI data arenot available, estimates of medical benefits are basedon reports from the states. Benefits paid throughspecial funds, second injury funds, and guarantyfunds are estimated from state survey data and fromdata on the websites of state workers’ compensationagencies. NCCI also provides data on reimburse-ments paid through deductible policies.
National Estimates of Benefits Paid This section summarizes key findings from ournational estimates of workers’ compensation benefitspaid. It includes a brief overview of total benefitspaid, benefits by type of coverage (private carriers,self-insured, state funds, and the federal govern-
ment), as well as a discussion on payments madethrough deductible policies.
Total benefits paid. Table 5 shows total workers ’compensation benefits paid and benefits by type ofcoverage, since 1994. In 2014, workers’ compensa-tion coverage paid $62.3 billion in benefits, a 1.2percent decrease from the total paid in 2013. Privatecarriers were the largest single payer, followed by self-insured employers, state funds, and the federalgovernment.
Benefits by type of coverage. Over the 20-yearperiod shown in Table 5, private insurance carrierswere the largest single payer in workers’ compensa-tion, accounting for 48 to 57 percent of all benefitspaid. In 2014, private insurers paid $34.4 billion inbenefits, 55.1 percent of the total.
Self-insured employers have consistently been thesecond largest payer of workers’ compensation bene-fits, accounting for approximately one-fourth of totalbenefits paid in most years since 1994. In 2014, self-insured employers paid $15.1 billion in benefits,24.2 percent of the total.
State funds are the third largest payer in workers’compensation, but their share of the market hasdeclined since 2004, when the funds accounted fornearly 20 percent of total benefits paid. In 2014,state funds paid $9.2 billion in benefits, less than 15percent of the total. The decline in relative impor-tance of state funds in recent years largely reflects thedecline in coverage of the California State Fund(which accounted for 50 percent of California’s
18 NATIONAL ACADEMY OF SOCIAL INSURANCE
25 A. M. Best does not provide data on the four exclusive state funds (Ohio, North Dakota, Washington, Wyoming), or the state fundin South Carolina that only provides benefits to government workers.
Total workers’ compensation benefitspaid in 2014 declined by 1.2 percentfrom 2013. Private insurers continued
to be the single largest payer ofworker’s compensation benefits,
although part of these payments arereimbursed by employers under
deductible policies.

Workers’ Compensation: Benefits, Coverage, and Costs • 19
workers’ compensation insurance market in 2004but only 10 percent more recently) and, to a lesserextent, the dissolution of funds in West Virginia (in2009) and Arizona (in 2012).
The federal government has always been a relativelysmall payer of workers’ compensation benefits,because the number of workers covered under federalprograms represents such a small fraction of total
covered employment. In 2014, the federal govern-ment paid $3.7 billion in workers’ compensationbenefits, or 5.9 percent of total benefits paid.
Deductibles. Table 6 shows the estimated dollaramount of benefits that employers reimbursed underdeductible provisions since 1994. In 2014, employ-ers paid $10 billion under deductibles, or 16.1percent of total benefits paid. The share of benefits
Table 5Workers' Compensation Benefits Paid by Type of Coverage, 1994-2014
Private Insured State Fund Insured Federal Self-Insured TotalMedical
Benefits % Benefits % Benefits % Total % Benefits % Benefits %Year (millions) Share (millions) Share (millions) Share (millions) Share (millions) Change (millions) Medical
1994 $21,391 49.2 $7,398 17.0 $3,166 7.3 $11,527 26.5 $43,482 1.3 $17,194 39.5
1995 20,106 47.7 7,681 18.2 3,103 7.4 11,232 26.7 42,122 -3.1 16,733 39.7
1996 21,024 50.1 8,042 19.2 3,066 7.3 9,828 23.4 41,960 -0.4 16,739 39.9
1997 21,676 51.6 7,157 17.1 2,780 6.6 10,357 24.7 41,971 0.0 17,397 41.5
1998 23,579 53.6 7,187 16.3 2,868 6.5 10,354 23.5 43,987 4.8 18,622 42.3
1999 26,383 57.0 7,083 15.3 2,862 6.2 9,985 21.6 46,313 5.3 20,055 43.3
2000 26,874 56.3 7,388 15.5 2,957 6.2 10,481 22.0 47,699 3.0 20,933 43.9
2001 27,905 54.9 8,013 15.8 3,069 6.0 11,839 23.3 50,827 6.6 23,137 45.5
2002 28,085 53.7 9,139 17.5 3,154 6.0 11,920 22.8 52,297 2.9 24,203 46.3
2003 28,395 51.9 10,442 19.1 3,185 5.8 12,717 23.2 54,739 4.7 25,733 47.0
2004 28,632 51.0 11,146 19.9 3,256 5.8 13,115 23.4 56,149 2.6 26,079 46.4
2005 29,039 50.9 11,060 19.4 3,258 5.7 13,710 24.0 57,067 1.6 26,361 46.2
2006 27,946 50.9 10,555 19.2 3,270 6.0 13,125 23.9 54,896 -3.8 26,206 47.7
2007 29,410 52.2 10,153 18.0 3,340 5.9 13,482 23.9 56,385 2.7 27,105 48.1
2008 30,725 52.3 10,347 17.6 3,424 5.8 14,255 24.3 58,750 4.2 28,987 49.3
2009 31,330 53.3 9,907 16.9 3,543 6.0 13,972 23.8 58,752 0.0 27,561 46.9
2010 31,654 53.7 9,751 16.5 3,672 6.2 13,861 23.5 58,939 0.3 29,278 49.7
2011 32,715 53.7 9,828 16.1 3,777 6.2 14,636 24.0 60,956 3.4 30,519 50.1
2012 34,387 54.5 10,021 15.9 3,776 6.0 14,878 23.6 63,062 3.5 31,512 50.0
2013 34,585 55.3 9,509 15.2 3,691 5.9 14,725 23.6 62,510 -0.9 31,395 50.2
2014 34,350 55.1 9,224 14.8 3,681 5.9 15,052 24.2 62,307 -1.2 31,375 50.4
Notes: Benefits are calendar-year payments to injured workers and to providers of their medical care, including benefits paid by employers through deductible policies. Federal benefits include benefits paid under the Federal Employees’ Compensation Act and employer-financed benefits paid throughthe Federal Black Lung Disability Trust Fund. In years before 1997, federal benefits also include the part of the black lung program financed by federalfunds. In 1997–2014, federal benefits include a portion of employer-financed benefits under the Longshore and Harbor Workers' Compensation Act. SeeAppendix B for more information about federal programs.
Source: National Academy of Social Insurance estimates, SSA (2015), and DOL (2016).

20 NATIONAL ACADEMY OF SOCIAL INSURANCE
Table 6Workers' Compensation Employer-Paid Benefits Under Deductible Provisions, 1994-2014
Deductibles (millions) Deductibles as a % ofYear Total Private Insured State Fund Insured Total Benefits
1994 $2,834 $2,645 $189 6.51995 3,384 3,060 324 8.01996 3,716 3,470 246 8.91997 3,994 3,760 234 9.51998 4,644 4,399 245 10.61999 5,684 5,452 232 12.32000 6,201 5,931 270 13.02001 6,388 6,085 303 12.62002 6,922 6,511 411 13.22003 8,020 7,547 474 14.72004 7,645 7,134 510 13.62005 7,798 7,290 508 13.72006 7,575 7,052 524 13.82007 8,217 7,684 533 14.62008 8,603 8,095 508 14.62009 8,582 8,118 464 14.62010 8,904 8,466 438 15.12011 8,837 8,412 425 14.52012 10,485 9,942 544 16.62013 9,936 9,512 424 15.92014 10,045 9,656 389 16.1
Notes: Benefits paid under deductible provisions were either provided directly (or could be calculated directly from data pro-vided) by 18 states. Five states do not allow workers' compensation policies with deductibles. For the other 28 states and theDistrict of Columbia, benefits paid under deductibles were imputed using a ratio of the manual equivalent premiums.
Source: National Academy of Social Insurance estimates.
paid by employers under deductible provisions dou-bled between 1994 and 2000 (from 6.5% to 13%),reflecting the increasing popularity of deductibles asa means to reduce workers’ compensation insurancepremiums. The vast majority of benefits paid underdeductible provisions are through private insurers,which accounted for 96 percent of all deductiblepayments in 2014.
Employers who have policies with deductibles are, ineffect, self-insured up to the amount of the deductible
(whether that amount represents a specified numberof injuries and the corresponding benefits paid, or aspecified amount of aggregate-benefits paid). If weallocate the amount of benefits paid underdeductibles to self-insurance (instead of to private carriers as in Table 5) we obtain a better picture of theshare of the workers’ compensation market for whichemployers are assuming primary financial risk. Theresult indicates that, in 2014, private carriers andemployers each accounted for about 40 percent oftotal benefits paid (Table 7, columns 3 and 9).26 The
26 The Academy estimates of employer costs do not include the costs borne by employers who pay injured workers full salary duringperiods of light duty or other post-injury job accommodation. Some of this voluntary payment is a loss to the employer because ofthe reduced productivity of the workers being accommodated.

Workers’ Compensation: Benefits, Coverage, and Costs • 21
Table 7Percentage Distribution of Workers' Compensation Benefit Payments, by Type of Coverage: With and Without Deductibles, 1994-2014
Private Insured State Fund Insured
Total Employer Insurer Employer InsurerBenefits Paid Paid After Paid Paid After Self- Total
Year (millions) Total Deductibles Deductibles Total Deductibles Deductibles Federal Insured Employer Paid
(1) (2) (3) (4) (5) (6) (7) (8) (9) = (2) + (5) + (8)
1994 $43,482 49.2 6.1 43.1 17.0 0.4 16.6 7.3 26.5 33.0
1995 42,122 47.7 7.3 40.5 18.2 0.8 17.5 7.4 26.7 34.7
1996 41,960 50.1 8.3 41.8 19.2 0.6 18.6 7.3 23.4 32.3
1997 41,971 51.6 9.0 42.7 17.1 0.6 16.5 6.6 24.7 34.2
1998 43,987 53.6 10.0 43.6 16.3 0.6 15.8 6.5 23.5 34.1
1999 46,313 57.0 11.8 45.2 15.3 0.5 14.8 6.2 21.6 33.8
2000 47,699 56.3 12.4 43.9 15.5 0.6 14.9 6.2 22.0 35.0
2001 50,827 54.9 12.0 42.9 15.8 0.6 15.2 6.0 23.3 35.9
2002 52,297 53.7 12.4 41.3 17.5 0.8 16.7 6.0 22.8 36.0
2003 54,739 51.9 13.8 38.1 19.1 0.9 18.2 5.8 23.2 37.9
2004 56,149 51.0 12.7 38.3 19.9 0.9 18.9 5.8 23.4 37.0
2005 57,067 50.9 12.8 38.1 19.4 0.9 18.5 5.7 24.0 37.7
2006 54,896 50.9 12.8 38.1 19.2 1.0 18.3 6.0 23.9 37.7
2007 56,385 52.2 13.6 38.5 18.0 0.9 17.1 5.9 23.9 38.5
2008 58,750 52.3 13.8 38.5 17.6 0.9 16.7 5.8 24.3 38.9
2009 58,752 53.3 13.8 39.5 16.9 0.8 16.1 6.0 23.8 38.4
2010 58,939 53.7 14.4 39.3 16.5 0.7 15.8 6.2 23.5 38.6
2011 60,956 53.7 13.8 39.9 16.1 0.7 15.4 6.2 24.0 38.5
2012 63,062 54.5 15.8 38.8 15.9 0.9 15.0 6.0 23.6 40.2
2013 62,510 55.3 15.2 40.1 15.2 0.7 14.5 5.9 23.6 39.5
2014 62,307 55.1 15.5 39.6 14.8 0.6 14.2 5.9 24.2 40.3
Notes: Shaded columns sum to 100%. Total employer paid benefits include employer-paid deductibles under private carriers and statefunds, as well as benefits paid by self-insured employers.
Source: National Academy of Social Insurance estimates based on Tables 5 and 6.

22 NATIONAL ACADEMY OF SOCIAL INSURANCE
Tabl
e 8
Wor
kers' C
ompe
nsation Ben
efits Pa
id by Ty
pe of C
overag
e, and
State, 2
014
Priv
ate In
sure
dSt
ate Fu
nd In
sure
dSe
lf-In
sure
da
Tota
lM
edical
Ben
efits
Perc
ent
Ben
efits
Perc
ent
Ben
efits
Perc
ent
Ben
efits
Pai
dBen
efits
Pai
d Pe
rcen
tRan
king
a
Stat
e(tho
usan
ds)
Shar
e(tho
usan
ds)
Shar
e(tho
usan
ds)
Shar
e(tho
usan
ds)b
(tho
usan
ds)c
Med
ical
Alaba
ma
$305
,002
47.9
- -
$331
,573
52.1
$636
,575
$437
,327
68.7
6
Alask
a16
7,11
177
.7-
- 47
,883
22.3
214,
995
152,
431
70.9
2
Arizo
na58
3,71
279
.2-
-15
3,38
320
.873
7,09
548
8,69
466
.310
Ark
ansa
s15
3,22
472
.4-
- 58
,409
27.6
211,
633
138,
831
65.6
11
Califo
rnia
7,25
8,05
660
.0$1
,231
,947
10.2
3,60
3,23
829
.812
,093
,241
6,98
2,58
357
.720
Col
orad
o23
0,69
328
.939
8,04
049
.816
9,97
821
.379
8,71
145
6,86
357
.221
Con
nect
icut
640,
139
72.2
- -
245,
877
27.8
886,
015
418,
199
47.2
38
Delaw
are
199,
431
80.0
- -
49,9
5420
.024
9,38
514
2,39
957
.122
District o
f Col
umbi
a85
,196
84.2
- -
16,0
1115
.810
1,20
734
,916
34.5
49
Flor
ida
2,26
2,87
071
.9-
- 88
4,89
828
.13,
147,
769
2,12
7,89
267
.68
Geo
rgia
1,04
3,23
872
.8-
- 39
0,00
427
.21,
433,
242
709,
455
49.5
34
Haw
aii
140,
092
51.7
33,1
6712
.397
,461
36.0
270,
720
121,
553
44.9
44
Idah
o84
,470
33.2
161,
190
63.4
8,39
13.
325
4,05
016
1,32
263
.513
Illin
ois
2,06
6,70
475
.1-
- 68
5,64
024
.92,
752,
343
1,24
1,30
745
.143
Indi
ana
524,
001
88.9
- -
65,2
2411
.158
9,22
543
1,90
273
.31
Iow
a50
6,08
077
.9-
- 14
3,63
922
.164
9,71
934
1,10
252
.530
Kan
sas
273,
810
72.2
- -
105,
602
27.8
379,
413
234,
857
61.9
15
Ken
tuck
y34
7,39
852
.910
9,73
516
.719
9,47
830
.465
6,61
136
5,07
655
.625
Loui
sian
a47
9,50
860
.389
,464
11.2
226,
527
28.5
795,
499
429,
569
54.0
28
Mai
ne17
3,61
868
.6-
79,5
9931
.425
3,21
712
0,53
147
.637
Mar
ylan
d52
3,58
954
.816
6,92
617
.526
4,95
827
.795
5,47
444
6,20
646
.739
Mas
sach
uset
ts81
5,08
271
.0-
- 33
3,30
129
.01,
148,
384
386,
970
33.7
50
Michi
gan
630,
059
60.9
- -
404,
713
39.1
1,03
4,77
243
2,14
841
.845
Min
neso
ta82
1,95
376
.2-
- 25
7,31
023
.81,
079,
263
596,
802
55.3
26
Mississip
pi23
1,10
268
.6-
- 10
5,58
731
.433
6,68
919
8,98
359
.119
Misso
uri
512,
214
60.0
120,
810
14.2
220,
070
25.8
853,
094
485,
411
56.9
23
Mon
tana
85,0
4034
.611
9,31
248
.541
,557
16.9
245,
909
160,
086
65.1
12
Neb
rask
a25
9,36
679
.7-
- 65
,897
20.3
325,
263
202,
639
62.3
14
Nev
ada
248,
431
67.3
- -
120,
965
32.7
369,
396
183,
590
49.7
33
New
Ham
pshi
re15
2,15
872
.4-
- 58
,067
27.6
210,
224
140,
640
66.9
9
New
Jersey
1,77
1,02
078
.0-
- 49
8,13
622
.02,
269,
156
1,17
4,56
051
.832

Workers’ Compensation: Benefits, Coverage, and Costs • 23
New
Mex
ico
146,
299
55.8
22,1
798.
593
,905
35.8
262,
383
142,
736
54.4
27
New
Yor
k2,
551,
035
45.7
1,23
0,05
122
.01,
800,
209
32.3
5,58
1,29
51,
940,
983
34.8
48
Nor
th C
arol
ina
993,
730
75.8
317,
395
24.2
1,31
1,12
660
8,36
246
.441
Nor
th D
akot
ad15
50.
119
1,29
399
.919
1,44
810
8,93
056
.924
Ohi
od14
,939
0.7
1,65
7,87
881
.835
5,14
817
.52,
027,
964
746,
816
36.8
46
Okl
ahom
a37
2,54
552
.220
1,35
028
.214
0,47
219
.771
4,36
733
2,18
146
.540
Ore
gon
213,
618
32.6
306,
526
46.7
135,
827
20.7
655,
971
350,
944
53.5
29
Penn
sylv
ania
2,13
5,14
170
.922
3,30
57.
465
2,34
421
.73,
010,
790
1,44
3,82
248
.036
Rho
de Is
land
67,0
6340
.974
,368
45.3
22,6
5413
.816
4,08
457
,265
34.9
47
Sout
h C
arol
inae
604,
418
68.0
71,1
088.
021
3,32
424
.088
8,85
040
4,42
745
.542
Sout
h D
akot
a94
,355
96.0
- -
3,91
14.
098
,266
66,9
1968
.17
Tenn
esse
e57
9,40
981
.6-
- 13
0,65
318
.471
0,06
243
3,13
861
.017
Texa
s78
9,27
651
.044
7,25
828
.931
2,11
120
.21,
548,
645
933,
833
60.3
18
Uta
h95
,365
35.1
127,
047
46.7
49,5
5618
.227
1,96
919
1,46
670
.44
Ver
mon
t13
2,59
686
.8-
-20
,154
13.2
152,
749
79,5
8252
.131
Virgi
nia
727,
990
78.0
- -
205,
069
22.0
933,
059
575,
697
61.7
16
Was
hing
tond
25,5
041.
11,
866,
286
78.0
501,
129
20.9
2,39
2,91
976
2,48
631
.951
Wes
t Virgi
niaf
165,
746
39.1
192,
329
45.4
65,4
5215
.542
3,52
720
7,52
849
.035
Wisco
nsin
1,06
4,40
591
.5-
- 98
,967
8.5
1,16
3,37
280
2,01
768
.95
Wyo
min
gd2,
343
1.3
182,
054
98.7
184,
398
130,
452
70.7
3
Tota
l Non
-Fed
eral
$34,
350,
298
58.6
$9,2
23,6
2415
.7$1
5,05
1,60
925
.7$5
8,62
5,53
1$3
0,26
4,42
951
.6
All
Fede
ralg
- -
- -
- -
$3,6
81,2
05$1
,110
,621
30.2
Fede
ral E
mpl
oyee
sh-
- -
--
- $2
,940
,811
$1,0
11,4
5034
.4
TO
TAL
- -
- -
- -
$62,
306,
736
$31,
375,
050
50.4
a.
Stat
es are
ran
ked
from
1 to
51
by th
e larg
est p
erce
nt o
f med
ical b
enef
its as a
shar
e of
tota
l ben
efits
in 2
014.
b.T
hese
dat
a m
ay n
ot in
clud
e be
nefit
s pai
d un
der se
cond
inju
ry fu
nds f
or so
me stat
es and
may
, the
refo
re, b
e an
und
erstat
emen
t of t
otal b
enef
its p
aid.
c.
For fu
rthe
r de
tails
see Sources and M
ethods 2014
avai
labl
e at
ww
w.n
asi.o
rg.
d. St
ates
with
exc
lusiv
e stat
e fu
nds (
Ohi
o, N
orth
Dak
ota, W
ashi
ngto
n, and
Wyo
min
g) m
ay h
ave sm
all a
mou
nts o
f ben
efits
pai
d in
the pr
ivat
e in
sure
d ca
tego
ry, b
ecau
se: s
ome em
ploy
ers d
oing
busine
ss in
thes
e stat
es m
ay n
eed
to o
btai
n co
vera
ge fr
om p
riva
te car
rier
s und
er th
e Lo
ngsh
ore an
d H
arbo
r Wor
kers’ A
ct; a
nd so
me em
ploy
ers c
arry
liab
ility
cov
erag
e th
at th
e stat
e fu
nd is
not a
utho
rize
d to
pro
vide
; and
som
e em
ploy
ers o
btai
n ex
cess com
pens
atio
n co
vera
ge fr
om p
riva
te car
rier
s. e.
Sout
h C
arol
ina’s
Sta
te A
ccid
ent F
und
is n
ot a com
petit
ive stat
e fu
nd.
f. W
est V
irgi
nia co
mpl
eted
the tran
sitio
n from
mon
opol
istic st
ate fu
nd to
com
petit
ive in
sura
nce stat
us o
n Ju
ly 1
, 200
8.
g.
Fede
ral b
enef
its in
clud
e: th
ose pa
id u
nder
the Fe
dera
l Em
ploy
ees’
Com
pens
atio
n Act
for civi
lian
empl
oyee
s; th
e po
rtio
n of
the Black
Lun
g be
nefit
pro
gram
that
is fi
nanc
ed b
y em
ploy
ers;
and
a po
rtio
n of
ben
efits
und
er th
e Lo
ngsh
ore an
d H
arbo
r Wor
kers’ C
ompe
nsat
ion
Act
that
are
not
refle
cted
in st
ate da
ta, n
amely, b
enef
its p
aid
by se
lf-in
sure
d em
ploy
ers a
nd b
y sp
ecia
lfu
nds u
nder
the LH
WC
A. S
ee A
ppen
dix
B fo
r m
ore in
form
atio
n ab
out f
eder
al p
rogr
ams.
h. In
clud
ed in
the fe
dera
l ben
efits
tota
l.
Notes:B
enef
its are
calen
dar-ye
ar p
aym
ents to
inju
red
wor
kers and
to p
rovi
ders o
f the
ir m
edical car
e. B
enef
its p
aid
unde
r sp
ecia
l fun
ds, s
econ
d in
jury
fund
s, an
d gu
aran
ty fu
nds,
are pr
orat
edac
ross p
riva
te in
sure
d, st
ate fu
nd in
sure
d an
d se
lf-in
sure
d em
ploy
ers.
Source:N
atio
nal A
cade
my
of S
ocial I
nsur
ance
estim
ates
bas
ed o
n da
ta re
ceiv
ed fr
om st
ate ag
encies
, the
U.S
. Dep
artm
ent o
f Lab
or, A
.M. B
est,
and
the N
atio
nal C
ounc
il on
Com
pens
atio
n In
sura
nce.

remaining 20 percent of benefits were paid by federal(6 percent) and state funds (14 percent).
State Estimates of Benefits PaidThis section elaborates on the national estimates ofbenefits paid by assessing variations in paymentsacross states. Key findings in benefits paid by type ofcoverage (private, self-insured, state fund) and in theshare of medical and cash payments across states aresummarized. Additionally, this section reports theAcademy’s standardized benefits measure, which con-trols for wage growth and discusses state outliers andimportant factors to consider when interpretingthese results.
Benefits by type of coverage. Table 8 shows theshares of workers’ compensation benefits paid byeach type of coverage in each state in 2014. Theshares vary considerably across states because not allstates have a state fund and, where state funds exist,their legal status varies.
Private carriers. The share of benefits paid by pri-vate carriers is more than 85 percent in somejurisdictions with no state fund: South Dakota(96.0%), Wisconsin (91.5%), Indiana (88.9%), andVermont (86.8%). In contrast, the share paid by pri-vate carriers is 1 percent or less in the four stateswith exclusive state funds: North Dakota (0.1%),Ohio (0.7%), Washington (1.1%), and Wyoming(1.3%).27
Self-insured. Among those states that allow employ-ers to self-insure, the share of workers’ compensationbenefits paid by self-insured employers ranged from
a high of 52.1 percent in Alabama to a low of 3.3percent in Idaho. There are several explanations forthe tremendous variation in take-up rates for self-insurance: 1) Large employers are more likely toself-insure, and some states (e.g., Michigan) have adisproportionate share of large employers relative toother states. 2) Financial incentives to self-insurevary across states because of differences in stateworkers’ compensation statutes. Some states, forexample, do not collect assessments for special work-ers’ compensation funds from self-insured employers,thereby increasing the incentive to self-insure.28 3)Self-insurance and private insurance are substitutes,so the self-insured market share is, all else equal,inversely related to the premiums charged in the pri-vate insurance market. When workers’ compensationpremium rates are rising in a state, employers tend toshift to self-insurance. When premium rates aredeclining, employers tend to shift to private insur-ance. 4) Measurement error may account for some ofthe observed variation in the share of benefits paidby self-insured employers, because our methods forestimating benefits paid under self-insurance varyacross states, depending on responses to theAcademy’s survey and the availability of A.M. Bestdata.
State funds. The share of benefits paid by a statefund varies widely across those states that have sucha fund. In North Dakota and Wyoming (states thatdo not allow self-insurance), the state fund paidapproximately 99 percent of benefits in 2014.Among those states with competitive state funds, theshare of benefits paid by the state fund ranged from
24 NATIONAL ACADEMY OF SOCIAL INSURANCE
When benefits paid under deductiblesare counted as self-insurance, privatecarriers and employers assume a
nearly equal share (40%) of the risk ofworkplace injuries and illnesses.
The share of workers’ compensationbenefits attributed to different payersvaries widely across states, so the national estimates of payer shares
are not representative of any individual state.
27 Private carrier workers’ compensation benefit payments occur in states with exclusive state funds for a few possible reasons. First,some policies sold to employers provide multistate coverage whereas the exclusive state fund may be restricted to providing benefitsonly in the state where it operates. Second, the exclusive state fund might not be permitted to offer employers liability coverage, federal LHWCA coverage, or excess coverage for authorized self-insurers.
28 Special funds include second injury funds, and funds that pay for certain types of claims, such as claims from commercial fishermen,coal workers with pneumoconiosis, and others. For a detailed list of the special funds included in this report, please refer to theSources and Methods appendix.

Workers’ Compensation: Benefits, Coverage, and Costs • 25
a high of 63.4 percent in Idaho, to a low of 7.4 percent in Pennsylvania.
Share of medical benefits. Table 8 also shows, foreach state, the share of workers’ compensation benefits going to medical care for injured workers.Historically, medical benefits have been a smallershare of workers’ compensation benefits than cashbenefits. Since 2008, however, the national experience has been for medical and cash benefits to account for almost equal shares of total benefits (as shown in Figure 3). In 2014, medical benefitsaccounted for half (50.2%) of workers’ compensa-tion benefits nationally.
Across states, however, the share of benefits attributed to medical care ranged from nearly three-fourths of total benefits in Indiana (73.3%), Alaska(70.9%), Wyoming (70.7%), and Utah (70.4%) toapproximately one-third in Washington (31.9%),Massachusetts (33.7%), District of Columbia(34.5%), and New York (34.8%). The tremendousinterstate variation in the share of total benefitsgoing to medical care reflects between-state differ-ences in: average weekly wages; the nature andseverity of work-related injuries; the quantity andprices of medical services provided to injured work-ers; and the dollar value of cash benefits (driven byfactors such as benefit replacement rates, maximumand minimum weekly benefits, the waiting period,and duration of TTD benefits). If, therefore, changesto the workers’ compensation law in a given statereduce the dollar value of cash benefits, but medicalbenefits are stable, the share of benefits accountedfor by medical care increases.
State benefit trends. Table 9 shows total workers’compensation benefits paid in each state in the years2010 to 2014. Total (non-Federal) benefits increased6.1 percent over the five years covered in the data,with just over half (26) of the states experiencing anincrease in total benefits. The largest percentageincreases occurred in North Dakota (59.1%), NewYork (20.9%) and California (19.8%). Benefitsdeclined in the remaining 25 jurisdictions (includingthe District of Columbia) across the same time-period. The largest percentage decreases occurred inWest Virginia (-22.0%), Michigan (-18.6%), andNew Hampshire (-16.5%).
The within-state totals of workers’ compensationbenefits paid vary from year to year for a number of
reasons. Benefits change as within-state employmentchanges, although much of the impact occurs with alag. For example, the large decline in benefits inMichigan from 2010 to 2014 follows a period ofsteadily declining employment in the state (1999-2010). The large increase in benefits in NorthDakota over the same period is associated with 20years of sustained employment growth there.
Benefits are also affected by modifications to a state’slegal system for processing claims, such as changes instatutory rules, legal decisions, administrativeprocesses, or reporting requirements (as in WestVirginia, which changed its compensability rules anddefinitions of permanent disability in 2005). Otherexplanatory factors include changes in the number ofwork-related injuries and illnesses, fluctuations inwage rates, changes in the mix of occupations/industries, changes in the costs of medical care, anddifferences in the ways stakeholders interact withinthe system over time (e.g., if employees have the initial choice of physician, or if special exclusionsexist for small employers or agricultural employers).
Table 10 shows trends in medical benefits in each statebetween 2010 and 2014. Across all non-federal jurisdictions, medical benefits increased by 7.4 per-cent. The states with the highest percentage increasesin medical benefits across the five years reported inthe study were North Dakota (49.8%), Wyoming(27.8%), Virginia (22.5%), and California (20.6%).The states with the largest percentage decreases inmedical benefits paid between 2010 and 2014 wereWest Virginia (-25.0%), Ohio (-20.9%), Michigan (-15.0%), and Illinois (-13.0%). Many different factors contribute to the variation in medical benefittrends across states. For example, strong employmentgrowth contributed to the increase in medical benefits
In the United States as a whole, med-ical benefits account for 50 percent oftotal workers’ compensation benefitspaid. Across states, however, the
share of benefits attributed to medicalcare varies from approximately
one-third to nearly three-fourths oftotal benefits paid.

26 NATIONAL ACADEMY OF SOCIAL INSURANCE
Tabl
e 9
Wor
kers' C
ompe
nsation To
tal B
enefits Pa
id and
Percent
Cha
nge, by State, 201
0-20
14
Perc
ent C
hang
e
Stat
e20
1020
1120
1220
1320
1420
10-2
012
2012
-201
420
10-2
014
Ran
king
a
Alaba
ma
$629
,069
$616
,022
$649
,682
$639
,311
$636
,575
3.3
-2.0
1.2
24
Alask
a22
1,95
523
9,63
524
8,03
825
3,08
121
4,99
511
.8-1
3.3
-3.1
37
Arizo
na70
1,62
471
9,61
675
5,44
071
6,08
773
7,09
57.
7-2
.45.
117
Ark
ansa
s21
3,97
019
9,25
420
7,16
520
8,11
021
1,63
3-3
.22.
2-1
.133
Califo
rnia
10,0
98,7
3410
,838
,580
11,5
18,0
9012
,125
,026
12,0
93,2
4114
.15.
019
.83
Col
orad
o80
0,29
476
2,55
987
9,67
582
6,78
879
8,71
19.
9-9
.2-0
.227
Con
nect
icut
794,
728
867,
539
920,
041
916,
977
886,
015
15.8
-3.7
11.5
11
Delaw
are
211,
921
220,
830
216,
588
240,
313
249,
385
2.2
15.1
17.7
6
District o
f Col
umbi
a10
4,94
811
0,31
690
,511
110,
307
101,
207
-13.
811
.8-3
.639
Flor
ida
2,77
7,20
72,
858,
363
3,08
5,22
53,
131,
293
3,14
7,76
911
.12.
013
.38
Geo
rgia
1,45
8,62
61,
397,
574
1,57
4,99
31,
417,
566
1,43
3,24
28.
0-9
.0-1
.735
Haw
aii
242,
400
246,
780
248,
433
260,
352
270,
720
2.5
9.0
11.7
10
Idah
o23
9,54
924
9,29
223
7,09
924
7,28
425
4,05
0-1
.07.
16.
116
Illin
ois
3,00
2,99
13,
026,
105
2,95
2,90
82,
623,
840
2,75
2,34
3-1
.7-6
.8-8
.345
Indi
ana
598,
678
627,
671
653,
189
644,
445
589,
225
9.1
-9.8
-1.6
34
Iow
a56
3,59
262
2,05
966
0,23
663
8,92
464
9,71
917
.1-1
.615
.37
Kan
sas
405,
400
436,
122
427,
871
383,
633
379,
413
5.5
-11.
3-6
.442
Ken
tuck
y66
3,24
767
9,65
468
5,71
367
6,13
265
6,61
13.
4-4
.2-1
.031
Loui
sian
a80
2,38
484
2,53
285
3,68
582
1,44
079
5,49
96.
4-6
.8-0
.930
Mai
ne25
1,59
325
2,73
524
5,92
625
2,60
725
3,21
7-2
.33.
00.
625
Mar
ylan
d95
3,53
31,
006,
998
970,
734
944,
612
955,
474
1.8
-1.6
0.2
26
Mas
sach
uset
ts1,
015,
984
1,00
3,88
498
1,89
01,
061,
981
1,14
8,38
4-3
.417
.013
.09
Michi
gan
1,27
1,89
21,
301,
061
1,18
9,48
31,
134,
005
1,03
4,77
2-6
.5-1
3.0
-18.
650
Min
neso
ta1,
034,
661
1,01
1,89
01,
042,
478
1,06
4,68
41,
079,
263
0.8
3.5
4.3
18
Mississip
pi33
7,63
333
4,43
033
6,20
833
2,79
033
6,68
9-0
.40.
1-0
.329
Misso
uri
800,
789
807,
121
869,
429
838,
134
853,
094
8.6
-1.9
6.5
15
Mon
tana
266,
364
251,
577
248,
778
248,
217
245,
909
-6.6
-1.2
-7.7
43
Tota
l Ben
efits
(tho
usan
ds)

Workers’ Compensation: Benefits, Coverage, and Costs • 27
Neb
rask
a31
5,72
732
1,27
730
0,41
930
6,54
432
5,26
3-4
.88.
33.
021
Nev
ada
429,
686
395,
320
367,
302
370,
384
369,
396
-14.
50.
6-1
4.0
47
New
Ham
pshi
re25
1,68
223
1,96
122
5,45
422
1,43
021
0,22
4-1
0.4
-6.8
-16.
549
New
Jersey
2,06
7,38
02,
220,
424
2,24
6,39
82,
232,
645
2,26
9,15
68.
71.
09.
813
New
Mex
ico
276,
126
275,
783
306,
304
273,
448
262,
383
10.9
-14.
3-5
.041
New
Yor
k4,
617,
084
5,09
7,55
95,
370,
910
5,54
3,75
05,
581,
295
16.3
3.9
20.9
2
Nor
th C
arol
ina
1,35
7,14
11,
427,
123
1,56
9,12
61,
426,
991
1,31
1,12
615
.6-1
6.4
-3.4
38
Nor
th D
akot
a12
0,35
513
1,09
915
1,03
319
3,97
519
1,44
825
.526
.859
.11
Ohi
o2,
209,
404
2,20
0,69
22,
168,
947
2,07
0,02
22,
027,
964
-1.8
-6.5
-8.2
44
Okl
ahom
a84
2,55
384
0,34
592
2,53
381
3,07
371
4,36
79.
5-2
2.6
-15.
248
Ore
gon
681,
001
683,
452
663,
181
668,
686
655,
971
-2.6
-1.1
-3.7
40
Penn
sylv
ania
2,93
5,25
22,
919,
283
2,93
0,08
62,
992,
437
3,01
0,79
0-0
.22.
82.
622
Rho
de Is
land
159,
988
169,
735
171,
242
169,
436
164,
084
7.0
-4.2
2.6
23
Sout
h C
arol
ina
891,
283
874,
227
905,
405
878,
428
888,
850
1.6
-1.8
-0.3
28
Sout
h D
akot
a10
0,34
890
,844
87,0
4399
,699
98,2
66-1
3.3
12.9
-2.1
36
Tenn
esse
e78
0,80
577
1,90
583
8,38
876
1,11
471
0,06
27.
4-1
5.3
-9.1
46
Texa
s1,
491,
115
1,59
4,99
91,
838,
191
1,62
2,33
01,
548,
645
23.3
-15.
83.
919
Uta
h27
4,89
427
2,69
028
3,30
128
2,12
227
1,96
93.
1-4
.0-1
.132
Ver
mon
t13
7,35
713
8,14
013
8,52
315
0,18
515
2,74
90.
810
.311
.212
Virgi
nia
785,
652
891,
945
979,
539
896,
845
933,
059
24.7
-4.7
18.8
5
Was
hing
ton
2,30
8,74
82,
316,
713
2,31
1,29
92,
331,
783
2,39
2,91
90.
13.
53.
620
Wes
t Virgi
nia
543,
317
520,
769
475,
952
437,
894
423,
527
-12.
4-1
1.0
-22.
051
Wisco
nsin
1,07
1,87
71,
099,
950
1,12
3,86
11,
126,
058
1,16
3,37
24.
83.
58.
514
Wyo
min
g15
4,07
716
2,96
016
2,30
419
1,82
518
4,39
85.
313
.619
.74
Tota
l Non
-Fed
eral
$55,
266,
619
$57,
179,
393
$59,
286,
249
$58,
819,
042
$58,
625,
531
7.3
-1.1
6.1
All
Fede
rala
$3,6
72,0
58$3
,776
,993
$3,7
75,5
19$3
,691
,014
$3,6
81,2
052.
8-2
.50.
2
Fede
ral E
mpl
oyee
sb$2
,889
,321
$2,9
94,1
22$3
,006
,009
$2,9
48,1
32$2
,940
,811
4.0
-2.2
1.8
TO
TAL
$58,
938,
677
$60,
956,
387
$63,
061,
768
$62,
510,
056
$62,
306,
736
7.0
-1.2
5.7
a.St
ates
are
ran
ked
from
1 to
51
by th
e larg
est p
erce
nt in
crea
se in
tota
l ben
efits
from
201
0 to
201
4.b.
In
clud
ed in
the fe
dera
l ben
efits
tota
l.
Notes:B
enef
its are
calen
dar-ye
ar p
aym
ents to
inju
red
wor
kers and
to p
rovi
ders o
f the
ir m
edical car
e. D
ata so
urce
s for
eac
h stat
e ar
e de
scribe
d in
det
ail i
n Sources and M
ethods 2014
avai
labl
e at
ww
w.n
asi.o
rg.
Source: N
atio
nal A
cade
my
of S
ocia
l Ins
uran
ce estim
ates
bas
ed o
n da
ta fr
om st
ate ag
encies
, A.M
. Bes
t, N
atio
nal A
ssoc
iatio
n of
Insu
ranc
e C
omm
ission
ers,
the U
.S. D
epar
tmen
t of L
abor
, and
the So
cial
Secu
rity
Adm
inist
ratio
n.

28 NATIONAL ACADEMY OF SOCIAL INSURANCE
Tabl
e 10
Wor
kers' C
ompe
nsation M
edical B
enefits Pa
id and
Percent
Cha
nge, by State, 201
0-20
14
Perc
ent C
hang
e
Stat
e20
1020
1120
1220
1320
1420
10-2
012
2012
-201
420
10-2
014
Ran
king
a
Alaba
ma
$434
,057
$417
,047
$438
,535
$439
,846
$437
,327
1.0
-0.3
0.8
33
Alask
a14
5,60
315
6,48
216
7,92
117
7,66
315
2,43
115
.3-9
.24.
727
Arizo
na43
9,21
745
6,95
649
6,32
447
1,90
248
8,69
413
.0-1
.511
.314
Ark
ansa
s13
7,79
712
7,72
213
5,90
013
7,14
413
8,83
1-1
.42.
20.
834
Califo
rnia
5,78
8,97
36,
290,
837
6,64
6,74
47,
038,
721
6,98
2,58
314
.85.
120
.64
Col
orad
o40
4,14
842
7,79
650
0,53
548
2,01
745
6,86
323
.8-8
.713
.010
Con
nect
icut
360,
012
404,
273
426,
899
415,
391
418,
199
18.6
-2.0
16.2
6
Delaw
are
122,
914
130,
731
130,
169
142,
986
142,
399
5.9
9.4
15.9
7
District o
f Col
umbi
a35
,682
37,7
2831
,317
40,3
7234
,916
-12.
211
.5-2
.139
Flor
ida
1,82
4,62
51,
869,
370
2,04
2,41
92,
082,
310
2,12
7,89
211
.94.
216
.65
Geo
rgia
732,
230
704,
377
796,
946
717,
289
709,
455
8.8
-11.
0-3
.142
Haw
aii
105,
444
110,
804
108,
069
111,
431
121,
553
2.5
12.5
15.3
8
Idah
o15
0,67
715
9,79
615
3,87
716
0,48
716
1,32
22.
14.
87.
121
Illin
ois
1,42
6,42
11,
443,
452
1,29
6,32
61,
180,
728
1,24
1,30
7-9
.1-4
.2-1
3.0
48
Indi
ana
428,
654
459,
455
479,
441
472,
378
431,
902
11.8
-9.9
0.8
32
Iow
a30
6,59
433
2,80
237
2,37
334
3,10
234
1,10
221
.5-8
.411
.315
Kan
sas
222,
159
244,
665
250,
305
227,
495
234,
857
12.7
-6.2
5.7
23
Ken
tuck
y37
7,38
838
2,64
538
1,25
736
9,84
436
5,07
61.
0-4
.2-3
.343
Loui
sian
a43
2,48
544
7,38
444
9,89
244
1,93
542
9,56
94.
0-4
.5-0
.737
Mai
ne12
3,02
912
3,58
711
4,60
112
1,25
212
0,53
1-6
.95.
2-2
.038
Mar
ylan
d43
5,76
546
5,23
344
0,71
344
1,13
444
6,20
61.
11.
22.
428
Mas
sach
uset
ts34
6,31
234
4,65
334
3,22
735
6,24
638
6,97
0-0
.912
.711
.712
Michi
gan
508,
456
503,
694
422,
455
418,
170
432,
148
-16.
92.
3-1
5.0
49
Min
neso
ta55
1,91
254
7,63
256
6,77
659
0,27
359
6,80
22.
75.
38.
118
Mississip
pi21
1,02
119
9,98
918
9,95
819
8,34
319
8,98
3-1
0.0
4.8
-5.7
44
Misso
uri
445,
239
477,
816
498,
183
474,
384
485,
411
11.9
-2.6
9.0
17
Mon
tana
160,
084
157,
487
156,
233
158,
859
160,
086
-2.4
2.5
0.0
36
Med
ical B
enef
its (t
hous
ands
)

Workers’ Compensation: Benefits, Coverage, and Costs • 29
Neb
rask
a19
2,90
919
8,22
818
4,75
818
8,83
120
2,63
9-4
.29.
75.
025
Nev
ada
187,
773
186,
591
179,
978
186,
674
183,
590
-4.2
2.0
-2.2
40
New
Ham
pshi
re15
4,02
915
4,02
214
9,70
214
4,15
114
0,64
0-2
.8-6
.1-8
.745
New
Jersey
1,02
7,40
21,
114,
559
1,15
2,66
31,
137,
327
1,17
4,56
012
.21.
914
.39
New
Mex
ico
161,
257
159,
403
179,
188
162,
154
142,
736
11.1
-20.
3-1
1.5
47
New
Yor
k1,
718,
807
1,82
7,88
61,
836,
191
1,84
5,62
01,
940,
983
6.8
5.7
12.9
11
Nor
th C
arol
ina
599,
857
643,
632
718,
660
654,
989
608,
362
19.8
-15.
31.
431
Nor
th D
akot
a72
,707
76,3
9490
,894
113,
592
108,
930
25.0
19.8
49.8
1
Ohi
o94
3,75
093
4,56
487
4,16
882
3,24
274
6,81
6-7
.4-1
4.6
-20.
950
Okl
ahom
a37
2,40
837
3,11
340
6,83
736
6,69
633
2,18
19.
2-1
8.4
-10.
846
Ore
gon
345,
268
367,
014
365,
413
353,
066
350,
944
5.8
-4.0
1.6
29
Penn
sylv
ania
1,30
3,67
61,
332,
559
1,35
7,07
01,
420,
477
1,44
3,82
24.
16.
410
.816
Rho
de Is
land
53,1
1656
,861
54,1
1353
,881
57,2
651.
95.
87.
820
Sout
h C
arol
ina
385,
034
382,
037
395,
662
406,
712
404,
427
2.8
2.2
5.0
26
Sout
h D
akot
a61
,915
60,0
4859
,973
67,4
9666
,919
-3.1
11.6
8.1
19
Tenn
esse
e44
3,49
746
0,82
749
3,81
045
6,66
943
3,13
811
.3-1
2.3
-2.3
41
Texa
s88
5,72
398
5,70
91,
130,
488
1,00
0,97
793
3,83
327
.6-1
7.4
5.4
24
Uta
h18
8,57
819
3,06
419
9,72
719
7,20
319
1,46
65.
9-4
.11.
530
Ver
mon
t71
,288
71,1
4269
,262
73,5
9079
,582
-2.8
14.9
11.6
13
Virgi
nia
469,
820
533,
383
591,
642
545,
282
575,
697
25.9
-2.7
22.5
3
Was
hing
ton
760,
998
750,
282
742,
658
741,
875
762,
486
-2.4
2.7
0.2
35
Wes
t Virgi
nia
276,
557
246,
844
239,
880
229,
019
207,
528
-13.
3-1
3.5
-25.
051
Wisco
nsin
749,
586
770,
936
781,
897
770,
152
802,
017
4.3
2.6
7.0
22
Wyo
min
g10
2,09
510
8,70
711
0,00
813
2,29
113
0,45
27.
818
.627
.82
Tota
l Non
-Fed
eral
$28,
184,
947
$29,
412,
219
$30,
402,
033
$30,
283,
667
$30,
264,
429
7.9
-0.5
7.4
All
Fede
rala
$1,0
92,9
04$1
,106
,723
$1,1
10,0
74$1
,110
,860
$1,1
10,6
211.
60.
01.
6
Fede
ral E
mpl
oyee
sb$9
12,8
82$9
17,0
95$9
24,6
22$9
23,5
64$1
,011
,450
1.3
9.4
10.8
TO
TAL
$29,
277,
851
$30,
518,
942
$31,
512,
107
$31,
394,
526
$31,
375,
050
7.6
-0.4
7.2
a.St
ates
are
ran
ked
from
1 to
51
by th
e larg
est p
erce
nt in
crea
se in
med
ical b
enef
its fr
om 2
010
to 2
014.
b. In
clud
ed in
the fe
dera
l ben
efits
tota
l.
Notes:B
enef
its are
pay
men
ts in
the ca
lend
ar y
ear to
inju
red
wor
kers and
to p
rovi
ders o
f the
ir m
edical car
e. D
ata so
urce
for ea
ch st
ate is
desc
ribe
d in
det
ail i
n Sources and M
ethods 2014
avai
labl
e at
ww
w.n
asi.o
rg.
Source: N
atio
nal A
cade
my
of S
ocia
l Ins
uran
ce estim
ates
bas
ed o
n da
ta fr
om st
ate ag
encies
, A.M
. Bes
t, N
atio
nal A
ssoc
iatio
n of
Insu
ranc
e C
omm
ission
ers (
NAIC
), th
e U
.S. D
epar
tmen
t of L
abor
, and
the
Social S
ecur
ity A
dmin
istrat
ion.

30 NATIONAL ACADEMY OF SOCIAL INSURANCE
Tabl
e 11
Wor
kers' C
ompe
nsation Cash Ben
efits Pa
id and
Percent
Cha
nge, by State, 201
0-20
14
Perc
ent C
hang
e
Stat
e20
1020
1120
1220
1320
1420
10-2
012
2012
-201
420
10-2
014
Ran
king
a
Alaba
ma
$195
,011
$198
,975
$211
,147
$199
,465
$199
,248
8.3
-5.6
2.2
21
Alask
a76
,353
83,1
5380
,116
75,4
1862
,563
4.9
-21.
9-1
8.1
43
Arizo
na26
2,40
726
2,66
025
9,11
624
4,18
624
8,40
1-1
.3-4
.1-5
.336
Ark
ansa
s76
,173
71,5
3271
,265
70,9
6572
,802
-6.4
2.2
-4.4
35
Califo
rnia
4,30
9,76
24,
547,
743
4,87
1,34
65,
086,
305
5,11
0,65
813
.04.
918
.65
Col
orad
o39
6,14
533
4,76
337
9,14
034
4,77
134
1,84
8-4
.3-9
.8-1
3.7
41
Con
nect
icut
434,
716
463,
266
493,
142
501,
587
467,
816
13.4
-5.1
7.6
12
Delaw
are
89,0
0790
,099
86,4
1897
,327
106,
986
-2.9
23.8
20.2
3
District o
f Col
umbi
a69
,265
72,5
8859
,194
69,9
3466
,291
-14.
512
.0-4
.333
Flor
ida
952,
582
988,
994
1,04
2,80
61,
048,
983
1,01
9,87
79.
5-2
.27.
113
Geo
rgia
726,
396
693,
196
778,
046
700,
278
723,
787
7.1
-7.0
-0.4
28
Haw
aii
136,
956
135,
976
140,
365
148,
921
149,
167
2.5
6.3
8.9
10
Idah
o88
,873
89,4
9683
,222
86,7
9792
,728
-6.4
11.4
4.3
16
Illin
ois
1,57
6,57
01,
582,
653
1,65
6,58
11,
443,
112
1,51
1,03
75.
1-8
.8-4
.232
Indi
ana
170,
025
168,
216
173,
748
172,
067
157,
323
2.2
-9.5
-7.5
39
Iow
a25
6,99
828
9,25
828
7,86
329
5,82
230
8,61
712
.07.
220
.14
Kan
sas
183,
241
191,
458
177,
567
156,
139
144,
556
-3.1
-18.
6-2
1.1
49
Ken
tuck
y28
5,86
029
7,00
930
4,45
730
6,28
829
1,53
56.
5-4
.22.
022
Loui
sian
a36
9,89
939
5,14
740
3,79
337
9,50
536
5,92
99.
2-9
.4-1
.129
Mai
ne12
8,56
412
9,14
813
1,32
413
1,35
613
2,68
62.
11.
03.
220
Mar
ylan
d51
7,76
954
1,76
553
0,02
150
3,47
850
9,26
72.
4-3
.9-1
.630
Mas
sach
uset
ts66
9,67
265
9,23
163
8,66
270
5,73
576
1,41
3-4
.619
.213
.76
Michi
gan
763,
435
797,
368
767,
028
715,
834
602,
624
0.5
-21.
4-2
1.1
48
Min
neso
ta48
2,74
946
4,25
847
5,70
347
4,41
048
2,46
2-1
.51.
4-0
.126
Mississip
pi12
6,61
313
4,44
114
6,25
113
4,44
713
7,70
615
.5-5
.88.
811
Misso
uri
355,
550
329,
305
371,
246
363,
750
367,
684
4.4
-1.0
3.4
19
Mon
tana
106,
279
94,0
9092
,546
89,3
5885
,822
-12.
9-7
.3-1
9.2
47
Cas
h Ben
efits
(tho
usan
ds)

Workers’ Compensation: Benefits, Coverage, and Costs • 31
Neb
rask
a12
2,81
812
3,04
911
5,66
111
7,71
312
2,62
4-5
.86.
0-0
.227
Nev
ada
241,
913
208,
729
187,
324
183,
711
185,
806
-22.
6-0
.8-2
3.2
50
New
Ham
pshi
re97
,652
77,9
3975
,753
77,2
7969
,584
-22.
4-8
.1-2
8.7
51
New
Jersey
1,03
9,97
81,
105,
865
1,09
3,73
61,
095,
318
1,09
4,59
65.
20.
15.
315
New
Mex
ico
114,
868
116,
380
127,
116
111,
293
119,
647
10.7
-5.9
4.2
17
New
Yor
k2,
898,
277
3,26
9,67
33,
534,
719
3,69
8,13
03,
640,
312
22.0
3.0
25.6
2
Nor
th C
arol
ina
757,
285
783,
490
850,
466
772,
002
702,
763
12.3
-17.
4-7
.238
Nor
th D
akot
a47
,648
54,7
0560
,139
80,3
8382
,518
26.2
37.2
73.2
1
Ohi
o1,
265,
654
1,26
6,12
81,
294,
779
1,24
6,78
01,
281,
148
2.3
-1.1
1.2
24
Okl
ahom
a47
0,14
446
7,23
251
5,69
644
6,37
738
2,18
69.
7-2
5.9
-18.
745
Ore
gon
335,
734
316,
438
297,
768
315,
620
305,
027
-11.
32.
4-9
.140
Penn
sylv
ania
1,63
1,57
61,
586,
724
1,57
3,01
61,
571,
961
1,56
6,96
9-3
.6-0
.4-4
.031
Rho
de Is
land
106,
872
112,
874
117,
130
115,
555
106,
819
9.6
-8.8
0.0
25
Sout
h C
arol
ina
506,
249
492,
190
509,
743
471,
716
484,
423
0.7
-5.0
-4.3
34
Sout
h D
akot
a38
,433
30,7
9627
,070
32,2
0331
,347
-29.
615
.8-1
8.4
44
Tenn
esse
e33
7,30
831
1,07
834
4,57
730
4,44
627
6,92
42.
2-1
9.6
-17.
942
Texa
s60
5,39
360
9,29
070
7,70
462
1,35
261
4,81
216
.9-1
3.1
1.6
23
Uta
h86
,317
79,6
2583
,574
84,9
1980
,503
-3.2
-3.7
-6.7
37
Ver
mon
t66
,069
66,9
9869
,262
76,5
9473
,167
4.8
5.6
10.7
9
Virgi
nia
315,
832
358,
562
387,
898
351,
563
357,
362
22.8
-7.9
13.1
7
Was
hing
ton
1,54
7,75
01,
566,
431
1,56
8,64
11,
589,
908
1,63
0,43
21.
33.
95.
314
Wes
t Virgi
nia
266,
760
273,
924
236,
072
208,
875
215,
999
-11.
5-8
.5-1
9.0
46
Wisco
nsin
322,
291
329,
015
341,
964
355,
906
361,
355
6.1
5.7
12.1
8
Wyo
min
g51
,982
54,2
5352
,296
59,5
3453
,946
0.6
3.2
3.8
18
Tota
l Non
-Fed
eral
$27,
081,
672
$27,
767,
175
$28,
884,
215
$28,
535,
377
$28,
361,
102
6.7
-1.8
4.7
All
Fede
rala
$2,5
79,1
54$2
,670
,270
$2,6
65,4
45$2
,580
,155
$2,5
70,5
833.
3-3
.6-0
.3
Fede
ral E
mpl
oyee
sb$1
,976
,439
$2,0
77,0
27$2
,081
,387
$2,0
24,5
68$1
,929
,360
5.3
-7.3
-2.4
TO
TAL
$29,
660,
827
$30,
437,
445
$31,
549,
660
$31,
115,
532
$30,
931,
686
6.4
-2.0
4.3
a.
Sta
tes a
re ran
ked
from
1 to
51
by th
e larg
est p
erce
nt in
crea
se in
cas
h be
nefit
s fro
m 2
010
to 2
014.
Notes:B
enef
its are
pay
men
ts in
the ca
lend
ar y
ear to
inju
red
wor
kers and
to p
rovi
ders o
f the
ir m
edical car
e. D
ata so
urce
for ea
ch st
ate is
desc
ribe
d in
det
ail i
n Sources and M
ethods 2014
avai
labl
e at
ww
w.n
asi.o
rg.
Source:N
atio
nal A
cade
my
of S
ocia
l Ins
uran
ce estim
ates
bas
ed o
n da
ta fr
om st
ate ag
encies
, A.M
. Bes
t, N
atio
nal A
ssoc
iatio
n of
Insu
ranc
e C
omm
ission
ers,
the U
.S. D
epar
tmen
t of L
abor
, and
the So
cial
Secu
rity
Adm
inist
ratio
n.

32 NATIONAL ACADEMY OF SOCIAL INSURANCE
Tabl
e 12
Wor
kers' C
ompe
nsation To
tal B
enefits Pa
id Per $10
0 of C
overed
Wag
es, b
y State, 201
0-20
14
Ben
efits
Per
$10
0 of
Cov
ered
Wag
esD
ollar Am
ount
Cha
nge
Stat
e20
1020
1120
1220
1320
1420
10-2
012
2012
-201
420
10-2
014
Ran
king
a
Alaba
ma
$0.9
5$0
.91
$0.9
3$0
.90
$0.8
7-$
0.02
-$0.
07-$
0.09
20
Alask
a1.
581.
631.
611.
601.
300.
04-0
.31
-0.2
847
Arizo
na0.
710.
700.
710.
650.
64-0
.01
-0.0
7-0
.07
19
Ark
ansa
s0.
550.
500.
500.
500.
49-0
.05
-0.0
1-0
.07
18
Califo
rnia
1.35
1.38
1.39
1.41
1.32
0.04
-0.0
6-0
.03
8
Col
orad
o0.
800.
730.
800.
720.
650.
00-0
.15
-0.1
534
Con
nect
icut
0.85
0.89
0.92
0.91
0.85
0.07
-0.0
70.
005
Delaw
are
1.11
1.11
1.05
1.14
1.13
-0.0
60.
070.
014
District o
f Col
umbi
a0.
300.
300.
230.
280.
24-0
.06
0.01
-0.0
615
Flor
ida
1.02
1.02
1.05
1.05
0.98
0.04
-0.0
7-0
.04
11
Geo
rgia
0.95
0.87
0.94
0.84
0.79
0.00
-0.1
6-0
.16
37
Haw
aii
1.10
1.08
1.05
1.05
1.04
-0.0
50.
00-0
.05
13
Idah
o1.
181.
191.
101.
101.
07-0
.07
-0.0
4-0
.11
26
Illin
ois
1.13
1.10
1.03
0.90
0.90
-0.1
0-0
.13
-0.2
342
Indi
ana
0.58
0.58
0.58
0.56
0.49
0.00
-0.0
9-0
.09
22
Iow
a1.
061.
121.
141.
071.
030.
08-0
.11
-0.0
39
Kan
sas
0.83
0.87
0.82
0.72
0.68
-0.0
2-0
.14
-0.1
636
Ken
tuck
y1.
041.
031.
000.
960.
90-0
.04
-0.1
0-0
.14
32
Loui
sian
a1.
091.
111.
081.
010.
94-0
.01
-0.1
5-0
.15
35
Mai
ne1.
231.
211.
151.
151.
11-0
.08
-0.0
4-0
.12
28
Mar
ylan
d0.
830.
860.
790.
760.
75-0
.04
-0.0
5-0
.09
21
Mas
sach
uset
ts0.
570.
540.
510.
530.
54-0
.06
0.03
-0.0
310
Michi
gan
0.80
0.77
0.68
0.64
0.55
-0.1
2-0
.13
-0.2
545
Min
neso
ta0.
890.
830.
820.
810.
78-0
.07
-0.0
3-0
.10
24
Mississip
pi1.
010.
970.
950.
910.
90-0
.06
-0.0
5-0
.11
25
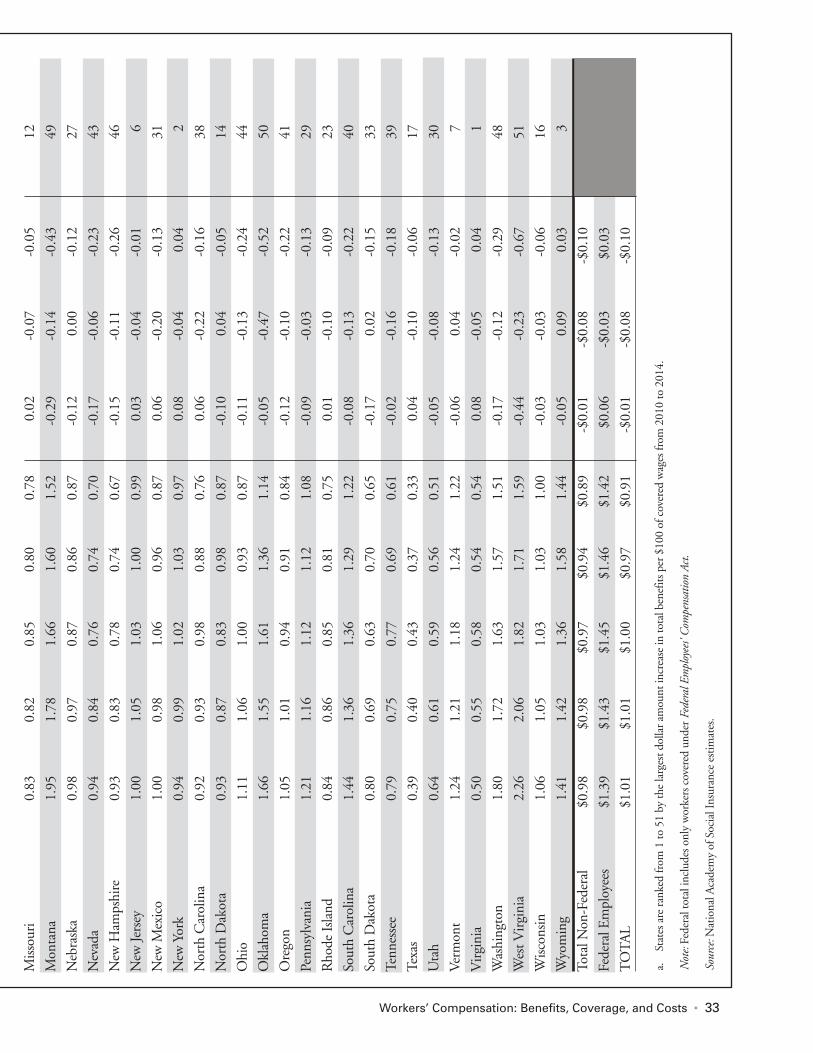
Workers’ Compensation: Benefits, Coverage, and Costs • 33
Misso
uri
0.83
0.82
0.85
0.80
0.78
0.02
-0.0
7-0
.05
12
Mon
tana
1.95
1.78
1.66
1.60
1.52
-0.2
9-0
.14
-0.4
349
Neb
rask
a0.
980.
970.
870.
860.
87-0
.12
0.00
-0.1
227
Nev
ada
0.94
0.84
0.76
0.74
0.70
-0.1
7-0
.06
-0.2
343
New
Ham
pshi
re0.
930.
830.
780.
740.
67-0
.15
-0.1
1-0
.26
46
New
Jersey
1.00
1.05
1.03
1.00
0.99
0.03
-0.0
4-0
.01
6
New
Mex
ico
1.00
0.98
1.06
0.96
0.87
0.06
-0.2
0-0
.13
31
New
Yor
k0.
940.
991.
021.
030.
970.
08-0
.04
0.04
2
Nor
th C
arol
ina
0.92
0.93
0.98
0.88
0.76
0.06
-0.2
2-0
.16
38
Nor
th D
akot
a0.
930.
870.
830.
980.
87-0
.10
0.04
-0.0
514
Ohi
o1.
111.
061.
000.
930.
87-0
.11
-0.1
3-0
.24
44
Okl
ahom
a1.
661.
551.
611.
361.
14-0
.05
-0.4
7-0
.52
50
Ore
gon
1.05
1.01
0.94
0.91
0.84
-0.1
2-0
.10
-0.2
241
Penn
sylv
ania
1.21
1.16
1.12
1.12
1.08
-0.0
9-0
.03
-0.1
329
Rho
de Is
land
0.84
0.86
0.85
0.81
0.75
0.01
-0.1
0-0
.09
23
Sout
h C
arol
ina
1.44
1.36
1.36
1.29
1.22
-0.0
8-0
.13
-0.2
240
Sout
h D
akot
a0.
800.
690.
630.
700.
65-0
.17
0.02
-0.1
533
Tenn
esse
e0.
790.
750.
770.
690.
61-0
.02
-0.1
6-0
.18
39
Texa
s0.
390.
400.
430.
370.
330.
04-0
.10
-0.0
617
Uta
h0.
640.
610.
590.
560.
51-0
.05
-0.0
8-0
.13
30
Ver
mon
t1.
241.
211.
181.
241.
22-0
.06
0.04
-0.0
27
Virgi
nia
0.50
0.55
0.58
0.54
0.54
0.08
-0.0
50.
041
Was
hing
ton
1.80
1.72
1.63
1.57
1.51
-0.1
7-0
.12
-0.2
948
Wes
t Virgi
nia
2.26
2.06
1.82
1.71
1.59
-0.4
4-0
.23
-0.6
751
Wisco
nsin
1.06
1.05
1.03
1.03
1.00
-0.0
3-0
.03
-0.0
616
Wyo
min
g1.
411.
421.
361.
581.
44-0
.05
0.09
0.03
3
Tota
l Non
-Fed
eral
$0.9
8$0
.98
$0.9
7$0
.94
$0.8
9-$
0.01
-$0.
08-$
0.10
Fede
ral E
mpl
oyee
s$1
.39
$1.4
3$1
.45
$1.4
6$1
.42
$0.0
6-$
0.03
$0.0
3
TO
TAL
$1.0
1$1
.01
$1.0
0$0
.97
$0.9
1-$
0.01
-$0.
08-$
0.10
a.
Sta
tes a
re ran
ked
from
1 to
51
by th
e larg
est d
ollar am
ount
incr
ease
in to
tal b
enef
its p
er $
100
of cov
ered
wag
es fr
om 2
010
to 2
014.
Note:
Fede
ral t
otal in
clud
es o
nly
wor
kers cov
ered
und
er Federal Employees' Com
pensation Act.
Source:N
atio
nal A
cade
my
of S
ocia
l Ins
uran
ce estim
ates
.

in North Dakota, while implementation of a strongfee schedule likely contributed to the decrease inIllinois.
Table 11 shows trends in cash benefits in each statebetween 2010 and 2014. Nationally, total non-federal cash benefits increased by 4.7 percent overthe five years reported in the study. Across states,however, the change in cash benefits ranged from anincrease of 73.2 percent in North Dakota to adecrease of 28.7 percent in New Hampshire. Alongwith North Dakota, eight other states experienceddouble-digit percentage increases in cash benefitsbetween 2010 and 2014: New York (25.6%),Delaware (20.2%), Iowa (20.1%), California(18.6%), Massachusetts (13.7%), Virginia (13.1%),Wisconsin (12.1%), and Vermont (10.7%). In addi-tion to New Hampshire, ten other states experienceddouble-digit decreases in cash benefits. In three ofthese states, the decrease was more than 20 percent:Nevada (-23.2%), Kansas (-21.1%), and Michigan (-21.1%).
Standardized benefits. Much of the interstate varia-tion in benefit payments described above can beattributed to different trends in employment andwages across states, rather than to structural differencesin state workers’ compensation systems. To isolate theeffects of the workers’ compensation system, we con-structed a standardized measure of benefits (benefitsper $100 of covered wages). The measure of benefitsas a percentage of covered wages helps explain whetherincreases or decreases in a state’s benefits payments canbe attributed to changes in the state’s covered employ-ment and wages, or to other factors.
Table 12 shows benefits paid per $100 of coveredwages, by state, from 2010 through 2014. In all butfive states (Connecticut, Delaware, New York,Virginia, Wyoming), standardized benefits declinedbetween 2010 and 2014. The greatest drop in bene-
fits per $100 covered wages occurred in WestVirginia (-$0.67), Oklahoma (-$0.52), and Montana(-$0.43), three states that implemented significantchanges in their workers’ compensation systems during this period.29 In contrast, in states wherebenefits did not decline, the increase in benefits per$100 covered payroll was miniscule (the largest, inNew York and Virginia, was an increase of $0.04). Recall that 26 states experienced an increase in totalworkers’ compensation benefits paid between 2010and 2014 (Table 9). Among these, four states(Delaware, New York, Virginia, and Wyoming) experienced an increase in benefits per $100 coveredpayroll, and Connecticut experienced no changeacross this time period. The remaining 21 statesexperienced an increase in total benefits while benefits per $100 of covered wages decreased. Thetrends in these states generally reflect more rapidgrowth in wages than in benefit payments.
The reader is cautioned that the data on standardized benefits (benefits paid per $100 of covered payroll) do not provide meaningful comparisons of the extent to which cash benefitscompensate workers for their losses due to injury(i.e. benefit adequacy). Standardized benefits couldbe high or low in a given state for a number of reasons completely unrelated to the adequacy of benefits injured workers receive.30 For example, ifwage rates (and, therefore, payrolls) are relatively low,
34 NATIONAL ACADEMY OF SOCIAL INSURANCE
29 Effective July 1, 2011, Montana instituted workers’ compensation reforms which established Utilization and Treatment Guidelinesfor medical care and a cap on medical benefits at 260 weeks. Other reforms during this period limited eligibility for indemnity bene-fits. (Personal communication from Richard Martin, workers’ compensation attorney.) West Virginia disestablished its state fund in2009. Changes to the workers’ compensation system in Oklahoma are described in footnote #7.
30 To provide meaningful comparisons of benefit adequacy, a study should compare the benefits that injured workers actually receive tothe wages they lose because of their occupational injuries or diseases. Such wage-loss studies have been conducted in several states(e.g., California, New Mexico, Oregon, Washington, Wisconsin), but the data for estimating wage losses are not available for moststates (Boden, Reville, and Biddle, 2005). Refer to the Academy’s study panel report Adequacy of Earnings Replacement in Workers’Compensation Programs (Hunt, 2004).
Most jurisdictions experienced a decrease in workers’ compensationbenefits per $100 of covered payroll between 2010 and 2014, with thelargest declines in West Virginia,
Oklahoma, and Montana.

all else equal, standardized benefits will be higher.31
If a state has a disproportionate share of risky occupations (e.g., mining), all else equal, standard-ized benefits will tend to be higher.
State outliers. Between 2010 and 2014, the fivestates experiencing the largest percent increases intotal workers’ compensation benefits paid were:North Dakota, New York, California, Wyoming, andVirginia. In North Dakota, California, and Virginia,the increase in total benefits paid reflects sizeableincreases in both medical and cash benefits. In NewYork, the increase in total benefits primarily reflectsan increase in cash benefits paid (medical benefitswere only 34.8 percent of total benefits in New Yorkin 2014). In Wyoming, the increase in total benefitsprimarily reflects an increase in medical benefits paid(medical benefits were 70.7 percent of total benefitsin Wyoming in 2014). None of these states experi-enced a sizable increase in standardized benefits;hence the increases in benefits are associated withincreases in employment and/or wages in thesestates.
The five states experiencing the largest percentdecreases in total workers’ compensation benefits paidover the five years reported in the study were: WestVirginia, Michigan, New Hampshire, Oklahoma,and Nevada. In Nevada, the decrease in total benefitsis primarily associated with a decrease in cash benefits paid (medical and cash benefits accountedfor equal shares of total benefits in Nevada in 2014). In the remaining four states, the decreases in totalbenefits reflect sizeable decreases in both medical andcash benefits. All of these states experienced sizeabledecreases in standardized benefits, as well (from$0.23 to $0.67 per $100 covered wages). Therefore,the decreases in benefits can be attributed, in whole or in part, to factors other than changes inemployment and wages in these states (for example,changes in injury rates or workers’ compensationstatutes).
Employer Costs forWorkers’ Compensation Data Sources for Estimating Employer Costs This section describes the primary sources of datathat we use to estimate employer costs for workers’compensation. A detailed, state-by-state explanationof how the cost estimates in this report are producedis provided in Sources and Methods: A Companion toWorkers’ Compensation: Benefits, Coverage, and Costs,2014, and is available on the Academy’s website(www.nasi.org).
The Academy’s methods for estimating employercosts vary according to the employer’s source ofworkers’ compensation coverage. For employers purchasing insurance from private carriers or statefunds, the cost of workers’ compensation in any yearequals the sum of premiums paid in that year plusreimbursements paid to the insurer under deductibleprovisions. Our cost data come from the state surveys or A.M. Best, but the growing use of largedeductible policies complicates the measurement ofemployer costs. A.M. Best does not provide information on payments under deductibles, andmany states are unable to provide data ondeductibles for the Academy’s survey. Consequently,costs associated with deductibles must be estimatedfor most states.
For self-insured employers, workers’ compensationcosts include medical and cash benefits paid duringthe calendar year, plus the administrative costs ofproviding those benefits. Administrative costsinclude the direct costs of managing claims, as wellas expenditures for litigation, cost containment,taxes, licenses, and fees. Self-insured employers generally do not report administrative costs of workers’ compensation separately from the costs ofadministering other employee benefit programs, sothe costs associated with workers’ compensationmust be estimated. To estimate total costs for self-insured employers, we assume that the ratio ofbenefits paid to total employer costs is the same forself-insured employers as it is for private insurers
Workers’ Compensation: Benefits, Coverage, and Costs • 35
31 Sometimes the benefit maximum is less likely to be binding when wages are lower. However, benefit maximums are generally tied tothe state average wage and are, therefore, lower when wages are lower.

36 NATIONAL ACADEMY OF SOCIAL INSURANCE
who report costs to the National Association ofInsurance Commissioners (NAIC, 2014).32
For the federal employee workers’ compensation pro-gram, employer costs are benefits paid plusadministrative costs, as reported by the Departmentof Labor (DOL, 2016).
The Academy’s estimates of employer costs alsoinclude estimates of assessments for special funds,second injury funds, and guaranty funds. The esti-mated costs of assessments are based on stateassessment rates applied either to premiums or losses(benefits paid).
National and State Estimates ofEmployer Costs This section summarizes key findings from ournational estimates of workers’ compensation employ-er costs. It includes a brief overview of totalemployer costs, trends in costs across different typesof coverage, and a description of our standardizedestimates of employer costs by state.
Trends in employer costs. Table 13 shows employercosts for workers’ compensation by type of coveragefor 1994 through 2014. In 2014, total employercosts were $91.8 billion, an increase of 4.9 percentfrom 2013 and a 20-year high.
In 2014, costs for employers insured through privatecarriers were 61.6 percent of total costs ($56.6 bil-lion); costs for self-insured employers were 19.3percent ($17.7 billion); costs for employers insuredthrough state funds were 13.9 percent ($12.8 bil-lion); and costs to the federal government were 5.2percent ($4.7 billion). In recent years, the share oftotal workers’ compensation costs attributed to dif-ferent sources has remained fairly stable at around 60percent for privately insured employers, 20 percent
for self-insured employers, 15 percent for state funds,and 5 percent for the federal government.
Standardized estimates of employer costs by state.Table 14 reports standardized estimates (per $100covered payroll) of employer costs for workers’ com-pensation for each state between 2010 and 2014.Costs are aggregated across all types of insurancearrangements (excluding federal programs). Between2010 and 2014, employer costs per $100 of coveredpayroll increased in 31 jurisdictions and decreased in20. The greatest increases in employer costs occurredin Wyoming ($0.37) and California ($0.32). Thegreatest decreases in costs occurred in Montana (-$0.51) and West Virginia (-$0.42). In Montana,the cost reductions occurred from 2010-2013 butstabilized in 2014. In West Virginia, the reductionscontinue a downward trend that began when thestate changed from an exclusive state fund in 2008to a private carrier system after 2009, along withsubstantial reductions in the statutory levels of benefits.
Readers are cautioned against using the estimates inTable 14 to make interstate comparisons of the costsof workers’ compensation to employers becausestates differ in the relative risk of their industry/occupational mix. A meaningful comparison ofemployer costs across states requires controls for vari-ation in the proportions of employers in differentinsurance classifications (based on industries andoccupations) in each state, which is beyond thescope of this report. Thus, the state estimates ofemployer costs reported here are not informative formaking plant location decisions, for determiningadequacy of workers’ compensation benefits, or forformulating legislative reforms.
In addition, the cost data reported here do not cap-ture recent changes in laws that may have changedthe workers’ compensation market within a state.Cost data for 2014 include a substantial proportionof cash benefits paid for injuries that occurred inprior years, when legal regimes and economic condi-tions may have been different. Thus, the cost datareported here may not fully reflect the current realityof the workers’ compensation costs in a state.
Employer costs for workers’ compensation were $91.8 billion
in 2014, a 20-year high.
32 Private insurers face some cost factors, such as commissions, profit allowances, and taxes on premiums that self-insurers do not face.Therefore, our estimates of the administrative costs of self-insurance costs are likely to be an upper bound.

Workers’ Compensation: Benefits, Coverage, and Costs • 37
Table 13Workers' Compensation Employer Costs, by Type of Coverage, 1994-2014
Total Private Insureda State Fund Insureda Self-Insureda Federalb
Year (millions) % Change (millions) % of total (millions) % of total (millions) % of total (millions) % of total
1994 $60,517 -0.5 $33,997 56.2 $11,235 18.6 $12,795 21.1 $2,490 4.1
1995 57,089 -5.7 31,554 55.3 10,512 18.4 12,467 21.8 2,556 4.5
1996 53,898 -5.6 31,081 57.7 8,480 15.7 11,736 21.8 2,601 4.8
1997 54,365 0.9 30,594 56.3 8,268 15.2 12,145 22.3 3,358 6.2
1998 55,028 1.2 31,446 57.1 8,130 14.8 11,981 21.8 3,471 6.3
1999 56,392 2.5 33,740 59.8 7,577 13.4 11,580 20.5 3,496 6.2
2000 60,681 7.6 36,038 59.4 8,934 14.7 12,089 19.9 3,620 6.0
2001 67,387 11.1 38,110 56.6 11,778 17.5 13,721 20.4 3,778 5.6
2002 74,114 10.0 41,600 56.1 14,794 20.0 13,822 18.6 3,898 5.3
2003 82,294 11.0 45,493 55.3 17,820 21.7 15,011 18.2 3,970 4.8
2004 86,114 4.6 47,601 55.3 19,103 22.2 15,337 17.8 4,073 4.7
2005 89,838 4.3 50,972 56.7 18,225 20.3 16,545 18.4 4,096 4.6
2006 87,493 -2.6 51,648 59.0 15,729 18.0 15,979 18.3 4,138 4.7
2007 86,537 -1.1 52,291 60.4 13,898 16.1 16,112 18.6 4,236 4.9
2008 80,602 -6.9 47,338 58.7 12,244 15.2 16,680 20.7 4,341 5.4
2009 73,921 -8.3 42,965 58.1 10,640 14.4 16,252 22.0 4,065 5.5
2010 72,785 -1.5 42,798 58.8 9,565 13.1 16,194 22.2 4,228 5.8
2011 77,760 6.8 46,198 59.4 9,897 12.7 17,238 22.2 4,427 5.7
2012 84,361 8.5 51,680 61.3 10,569 12.5 17,604 20.9 4,507 5.3
2013 87,550 3.8 54,282 62.0 11,660 13.3 17,064 19.5 4,543 5.2
2014 91,810 4.9 56,581 61.6 12,789 13.9 17,698 19.3 4,743 5.2
a. Costs for second injury funds and special funds are included in the totals from 1996 onwards. The costs for special funds are estimated from assessment rates, based on premiums and losses.
b. Federal costs include costs to the Federal government under the Federal Employees’ Compensation Act and employer costs associatedwith the Federal Black Lung Disability Trust Fund. In years before 1997, federal costs also include the part of the black lung programfinanced by federal funds. In 1997-2014 federal costs include employer costs associated with the Longshore and Harbor Workers'Compensation Act. See Appendix B for more information about federal programs.
Sources: National Academy of Social Insurance estimates of costs for private carriers and state funds are based on information from A.M.Best and direct contact with state agencies. Costs for federal programs are from the Department of Labor and the Social Security Administration. Self-insured administrative costs are based on information from the National Association of Insurance Commissioners.
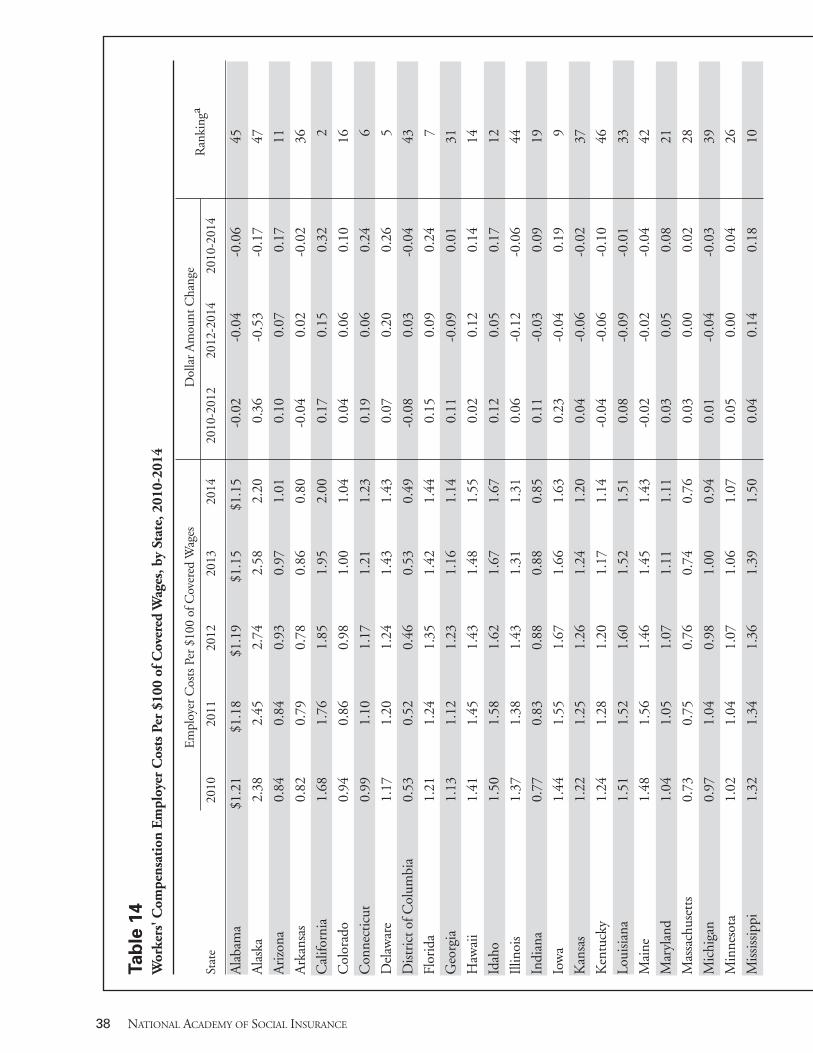
38 NATIONAL ACADEMY OF SOCIAL INSURANCE
Tabl
e 14
Wor
kers' C
ompe
nsation Employ
er C
osts
Per $1
00 of C
overed
Wag
es, b
y State, 201
0-20
14
Em
ploy
er C
osts P
er $
100
of C
over
ed W
ages
Dol
lar Am
ount
Cha
nge
Stat
e20
1020
1120
1220
1320
1420
10-2
012
2012
-201
420
10-2
014
Ran
king
a
Alaba
ma
$1.2
1$1
.18
$1.1
9$1
.15
$1.1
5-0
.02
-0.0
4-0
.06
45
Alask
a2.
382.
452.
742.
582.
200.
36-0
.53
-0.1
747
Arizo
na0.
840.
840.
930.
971.
010.
100.
070.
1711
Ark
ansa
s0.
820.
790.
780.
860.
80-0
.04
0.02
-0.0
236
Califo
rnia
1.68
1.76
1.85
1.95
2.00
0.17
0.15
0.32
2
Col
orad
o0.
940.
860.
981.
001.
040.
040.
060.
1016
Con
nect
icut
0.99
1.10
1.17
1.21
1.23
0.19
0.06
0.24
6
Delaw
are
1.17
1.20
1.24
1.43
1.43
0.07
0.20
0.26
5
District o
f Col
umbi
a0.
530.
520.
460.
530.
49-0
.08
0.03
-0.0
443
Flor
ida
1.21
1.24
1.35
1.42
1.44
0.15
0.09
0.24
7
Geo
rgia
1.13
1.12
1.23
1.16
1.14
0.11
-0.0
90.
0131
Haw
aii
1.41
1.45
1.43
1.48
1.55
0.02
0.12
0.14
14
Idah
o1.
501.
581.
621.
671.
670.
120.
050.
1712
Illin
ois
1.37
1.38
1.43
1.31
1.31
0.06
-0.1
2-0
.06
44
Indi
ana
0.77
0.83
0.88
0.88
0.85
0.11
-0.0
30.
0919
Iow
a1.
441.
551.
671.
661.
630.
23-0
.04
0.19
9
Kan
sas
1.22
1.25
1.26
1.24
1.20
0.04
-0.0
6-0
.02
37
Ken
tuck
y1.
241.
281.
201.
171.
14-0
.04
-0.0
6-0
.10
46
Loui
sian
a1.
511.
521.
601.
521.
510.
08-0
.09
-0.0
133
Mai
ne1.
481.
561.
461.
451.
43-0
.02
-0.0
2-0
.04
42
Mar
ylan
d1.
041.
051.
071.
111.
110.
030.
050.
0821
Mas
sach
uset
ts0.
730.
750.
760.
740.
760.
030.
000.
0228
Michi
gan
0.97
1.04
0.98
1.00
0.94
0.01
-0.0
4-0
.03
39
Min
neso
ta1.
021.
041.
071.
061.
070.
050.
000.
0426
Mississip
pi1.
321.
341.
361.
391.
500.
040.
140.
1810
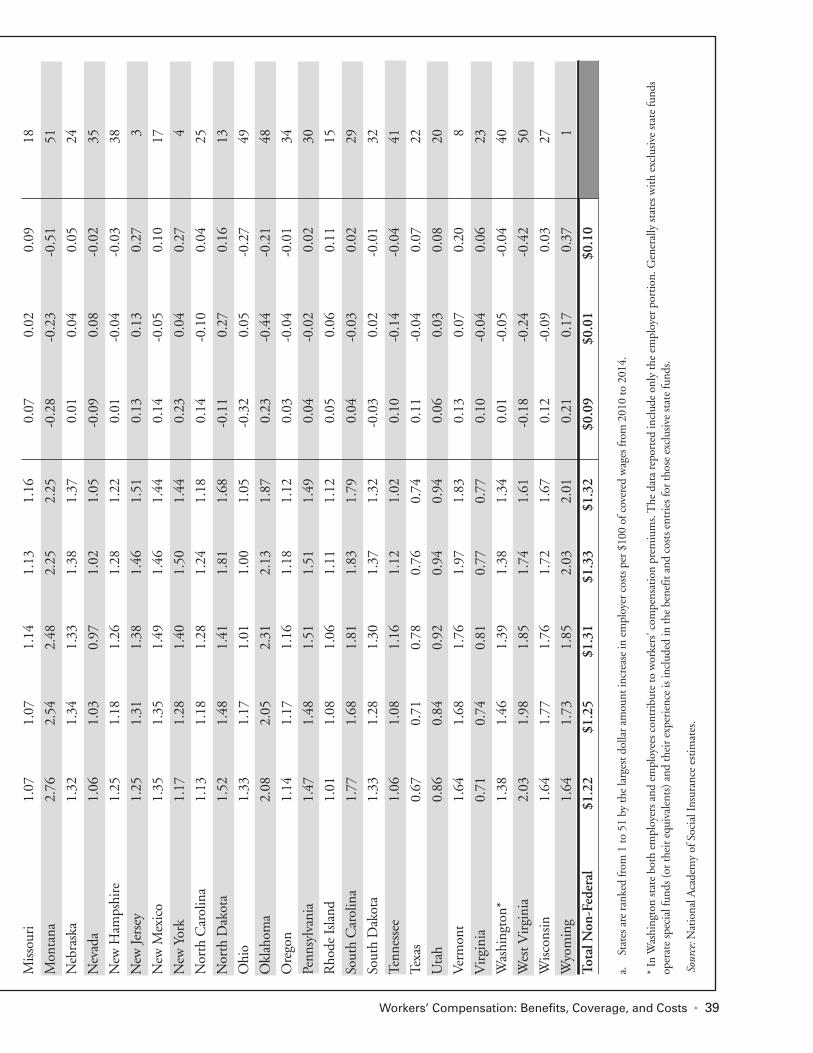
Workers’ Compensation: Benefits, Coverage, and Costs • 39
Misso
uri
1.07
1.07
1.14
1.13
1.16
0.07
0.02
0.09
18
Mon
tana
2.76
2.54
2.48
2.25
2.25
-0.2
8-0
.23
-0.5
151
Neb
rask
a1.
321.
341.
331.
381.
370.
010.
040.
0524
Nev
ada
1.06
1.03
0.97
1.02
1.05
-0.0
90.
08-0
.02
35
New
Ham
pshi
re1.
251.
181.
261.
281.
220.
01-0
.04
-0.0
338
New
Jersey
1.25
1.31
1.38
1.46
1.51
0.13
0.13
0.27
3
New
Mex
ico
1.35
1.35
1.49
1.46
1.44
0.14
-0.0
50.
1017
New
Yor
k1.
171.
281.
401.
501.
440.
230.
040.
274
Nor
th C
arol
ina
1.13
1.18
1.28
1.24
1.18
0.14
-0.1
00.
0425
Nor
th D
akot
a1.
521.
481.
411.
811.
68-0
.11
0.27
0.16
13
Ohi
o1.
331.
171.
011.
001.
05-0
.32
0.05
-0.2
749
Okl
ahom
a2.
082.
052.
312.
131.
870.
23-0
.44
-0.2
148
Ore
gon
1.14
1.17
1.16
1.18
1.12
0.03
-0.0
4-0
.01
34
Penn
sylv
ania
1.47
1.48
1.51
1.51
1.49
0.04
-0.0
20.
0230
Rho
de Is
land
1.01
1.08
1.06
1.11
1.12
0.05
0.06
0.11
15
Sout
h C
arol
ina
1.77
1.68
1.81
1.83
1.79
0.04
-0.0
30.
0229
Sout
h D
akot
a1.
331.
281.
301.
371.
32-0
.03
0.02
-0.0
132
Tenn
esse
e1.
061.
081.
161.
121.
020.
10-0
.14
-0.0
441
Texa
s0.
670.
710.
780.
760.
740.
11-0
.04
0.07
22
Uta
h0.
860.
840.
920.
940.
940.
060.
030.
0820
Ver
mon
t1.
641.
681.
761.
971.
830.
130.
070.
208
Virgi
nia
0.71
0.74
0.81
0.77
0.77
0.10
-0.0
40.
0623
Was
hing
ton*
1.38
1.46
1.39
1.38
1.34
0.01
-0.0
5-0
.04
40
Wes
t Virgi
nia
2.03
1.98
1.85
1.74
1.61
-0.1
8-0
.24
-0.4
250
Wisco
nsin
1.64
1.77
1.76
1.72
1.67
0.12
-0.0
90.
0327
Wyo
min
g1.
641.
731.
852.
032.
010.
210.
170.
371
Total N
on-Federal
$1.22
$1.25
$1.31
$1.33
$1.32
$0.09
$0.01
$0.10
a.
Sta
tes a
re ran
ked
from
1 to
51
by th
e larg
est d
ollar am
ount
incr
ease
in em
ploy
er cos
ts p
er $
100
of cov
ered
wag
es fr
om 2
010
to 2
014.
* In
Was
hing
ton
stat
e bo
th em
ploy
ers a
nd em
ploy
ees c
ontrib
ute to
wor
kers' c
ompe
nsat
ion
prem
ium
s. T
he d
ata re
ported
includ
e on
ly th
e em
ploy
er p
ortio
n. G
ener
ally
stat
es w
ith exc
lusive
stat
e fu
nds
oper
ate sp
ecia
l fun
ds (o
r th
eir eq
uiva
lent
s) and
their ex
perien
ce is
includ
ed in
the be
nefit
and
cos
ts ent
ries
for th
ose ex
clus
ive stat
e fu
nds.
Source: N
atio
nal A
cade
my
of S
ocia
l Ins
uran
ce estim
ates
.

Benefits Paid Relative to EmployerCosts This section reviews standardized benefits and costsin 2014 and evaluates changes in the ratio of stan-dardized benefits to costs across states.
Table 15 reports standardized estimates (per $100 ofcovered wages) of workers’ compensation benefitspaid and employer costs from 1994 to 2014. In
2014, employers paid $0.91 in benefits per $100 ofcovered wages, and incurred costs of $1.35. This isthe lowest level of standardized benefits in the last 20years, and one of the lowest levels of standardizedemployer costs over the same time period. Between2010 and 2014, total benefits per $100 of coveredwages decreased by 9 percent (standardized medicalbenefits decreased by 8 percent, and standardizedcash benefits by 10 percent).
40 NATIONAL ACADEMY OF SOCIAL INSURANCE
Table 15Workers’ Compensation Benefit/Cost Ratios, 1994-2014
Medical Benefits Cash Benefits Total Benefits Employer Costs Total Benefitsper $100 per $100 per $100 per $100 per $1
Year Covered Wages Covered Wages Covered Wages Covered Wages Employer Cost
1994 $ 0.58 $ 0.89 $ 1.47 $ 2.05 $ 0.72
1995 0.54 0.81 1.35 1.83 0.74
1996 0.50 0.76 1.26 1.62 0.78
1997 0.48 0.68 1.17 1.51 0.77
1998 0.48 0.65 1.13 1.42 0.80
1999 0.48 0.63 1.12 1.36 0.82
2000 0.47 0.60 1.06 1.35 0.79
2001 0.50 0.60 1.10 1.46 0.75
2002 0.52 0.61 1.13 1.61 0.71
2003 0.55 0.61 1.16 1.74 0.67
2004 0.53 0.61 1.13 1.74 0.65
2005 0.51 0.59 1.09 1.72 0.64
2006 0.47 0.52 0.99 1.58 0.63
2007 0.46 0.50 0.96 1.48 0.65
2008 0.49 0.50 0.99 1.35 0.73
2009 0.49 0.55 1.04 1.30 0.79
2010 0.50 0.51 1.01 1.25 0.81
2011 0.50 0.50 1.01 1.28 0.78
2012 0.50 0.50 1.00 1.33 0.75
2013 0.49 0.48 0.97 1.35 0.71
2014 0.46 0.45 0.91 1.35 0.68
Notes: Benefits are calendar-year payments to injured workers and to providers of their medical care. Employer costs are calendar-year expenditures for workers' compensation insurance premiums, benefits paid under deductibles or self-insurance,and administrative costs.
Source: National Academy of Social Insurance estimates.

Table 15 also reports the ratio of workers’ compensa-tion benefits to employer costs over the last 20 years.The ratio is determined by three factors: 1) Theextent to which employers’ payments to the workers’compensation system go to medical providers andinjured workers, as opposed to administrative costs.2) The extent to which insurers’ returns on invest-ments mitigate increases in the premiums chargedfor workers’ compensation. 3) The time lag betweenpremiums collected vs. benefits paid.33
Over the last two decades, the ratio of benefits paidto employer costs has varied between 0.63 (2006)and 0.82 (1999) (Table 15). In 2014, the benefit/cost ratio was 0.68, a decrease of 5.0 percent from2013, and continuing a downward trend since 2010.Since 2010, the benefit/cost ratio has decreased 16.2percent, with a 9.2 percent decline over the period2012-2014 and a 7.7 percent decline between 2010and 2012.
Estimates of Employer Costs fromOther Sources The Academy’s estimates compared to Bureau ofLabor Statistics (BLS) estimates. The BLS publish-es a quarterly report on Employer Costs for EmployeeCompensation (DOL, 2015a). The purpose of theBLS report is to provide average estimates ofemployer costs per hour worked, inclusive of wages,salaries, and employee benefits. Estimates are derivedfrom a representative sample of establishments in theprivate sector, state and local government. Costs arereported for five benefit categories (paid leave, sup-
plemental pay, insurance, retirement and savings,and legally required benefits) per employee hourworked. Workers’ compensation benefits are includ-ed within the legally required benefits category. TheBLS data are available at a national level by industry,occupational group, establishment size, bargainingstatus, four census regions, and nine censusdivisions. Total compensation, wages and salaries,and total benefits are available annually for the 15largest metropolitan areas. The data are not availablefor individual states.
The purpose of the Academy’s report is quite differ-ent. The Academy seeks to provide summary data onworkers’ compensation benefits paid to workers, andcosts borne by employers, at a state and nationallevel. Our estimates of $62.3 billion in benefits paidto workers and $91.8 billion in workers’ compensa-tion costs borne by employers in 2014 are the onlydata that answer questions about aggregate benefitsand costs of workers’ compensation.
Burton (2015) uses data from the BLS survey to cal-culate employer costs for workers’ compensation per$100 of payroll and compares it with the Academy’sestimates.34 Burton and the Academy use differentmethods to arrive at estimates of employer costs per$100 of covered payroll, so we would not expect thetwo measures to produce identical results, althoughwe would expect them to be close. In fact, the esti-mates derived from BLS data typically exceed theAcademy estimates of employer costs, although thetrends over time are similar.
The Academy’s estimates compared to OregonRate Ranking estimates. The Oregon Workers’Compensation Rate Ranking study also producesestimates of employer costs. The study (OregonDepartment of Consumer and Business Services,2015), conducted on a biennial basis by the State ofOregon, is designed to address the question: “Howdoes the standardized cost of workers’ compensationin Oregon compare to other states?”
Workers’ Compensation: Benefits, Coverage, and Costs • 41
Between 2010 and 2014, total standardized benefits fell by 9 percent,while standardized medical and cash
benefits fell by 8 percent and 10 percent, respectively.
33 For employers covered by private insurers or state funds, costs are largely determined by premiums paid. However, in a given year,premiums paid by employers do not necessarily match benefits received by workers. Premiums in a given year pay for all compens-able injuries that occur in the same year and benefits paid (on the same injuries) in future years. On the other hand, the majority ofcash benefits paid in any given year are for injuries that occurred in previous years (and are covered by the premiums paid in thosesame previous years). Premiums are influenced by a number of factors (some are modified to account for previous workers’ compen-sation liability experience) and may incorporate insurers’ past and anticipated investment returns on reserves set aside to cover futureliabilities.
34 The BLS methodology and the procedure used to calculate workers’ compensation benefits per $100 of payroll are discussed in Burton (2015).

42 NATIONAL ACADEMY OF SOCIAL INSURANCE
The Oregon estimates are comparisons of workers’compensation premium rates for a standardized set ofinsurance classifications. The standardization partlyfactors out differences in hazard mix (riskiness ofindustries) across states to provide a measure of inter-state differences in costs for employers withcomparable risk distributions.35 The Oregon studybases its estimates on premium rates, which are avail-able at the start of an applicable period, rather thancosts, which may not be fully reported until severalyears after. Some elements that apply only to individ-ual employers but affect employer costs in aggregatereporting are not included in the Oregon study. A more complete accounting of cost data is reflectedin Academy’s data, which also include estimates ofself-insurer costs. Average employer costs derivedfrom Academy data are influenced in part by the dif-ferent risk profile presented by each state’s economy,as well as variations in self-insurance across states.Unlike the Academy’s data series, the Oregon studyreports rates for a constant set of risk classificationsacross states.
Results of the Oregon study should not be comparedto the estimates of employer costs reported here. TheOregon approach is based on premiums employerswould currently pay for insurance coverage in differ-ent states (excluding discounts, dividends, andexperience rating). The Academy’s data reflect thecurrent costs of workers’ compensation for allemployers in a state, including those who self-insure.It should not be surprising that the results of thesedisparate approaches do not agree, because the esti-mates are designed to measure different concepts fordifferent purposes.36
Direct and Indirect Costs to WorkersSome of the costs of workers’ compensation areexplicitly or implicitly paid by workers. InWashington, for example, workers contribute directly to the insurance premiums for workers’ compensation. About 25-27 percent of the totalcosts of workers’ compensation in Washington arepaid by workers. This report only covers the employ-er paid portion of workers’ compensation. In some
states, workers’ pay a portion of special funds. Forexample, in Oregon, workers pay into the Workers’Benefit Fund. New Mexico has a small assessmentper worker.
In addition to such explicit contributions to premi-ums, there are implicit costs borne by workers in theform of waiting periods. All but three states (Hawaii,Rhode Island and, as of 2013, Oklahoma) have pro-visions to pay retroactive benefits to cover thewaiting period for more serious time-loss injuries.For workers who do not receive retroactive benefits,the three to seven days of uncompensated time lossattributable to the waiting period may constitutedirect costs to the worker (if not covered by otherprograms). The financial costs of uncompensatedwaiting periods are not routinely tracked or reportedby individual states and are, therefore, extremely difficult to collect and tabulate.
Other indirect costs to workers include losses of earn-ings, wealth (Galizzi and Zagorsky, 2009), and fringebenefits that occur during periods of injury-relatedwork absence (when the worker is compensated atless than their pre-injury wage); loss of home produc-tion attributable to work-related injury or illness; lossof employer contributions to health insurance premiums (except in the few states that mandate continuation of employer contributions during periods of injury-related work absence); and loss offuture income not covered by compensation for permanent impairments. Refer to Leigh and Marcin(2012) for estimates of how the direct and indirectcosts of work-related injuries are allocated amonginsurers, government payers, and injured workers.
Disputed claims are responsible for significant indirect costs to injured workers (and employers).Workers often hire attorneys to represent them inclaim disputes; attorney fees can siphon off 20 per-cent or more of the indemnity payment to theirclients. Insured employers are represented by theirinsurance carrier in legal proceedings, but time offwork for witnesses and managers to participate inhearings is a cost born by the employer.
35 The Oregon estimates are standardized on 50 out of 450 rate classifications. Additionally, the standardized rates are based on theOregon mix of payrolls, hence the rankings could be quite different if standardized based on another state.
36 Burton (2013) and Manley (2013) provide more extended discussions of the differences between the Academy and Oregon measuresof employers’ costs.

Estimates of WorkplaceInjuries and ClaimsInformation on the incidence of work-relatedinjuries and illnesses in any given year comes fromtwo sources: 1) The BLS collects information onfatal work-related injuries from the Census of FatalOccupational Injuries, and information on nonfatalwork-related injuries or illnesses from a sample survey of employers (Survey of Occupational Injuriesand Illnesses) (DOL 2015c & 2015e). 2) TheNational Council on Compensation Insurance collects information on the number of workers’ compensation claims paid by private carriers andcompetitive state funds in 37 states (NCCI, 2016b).
Incidence of Work-Related Injuries Fatal Injuries. According to the BLS, a total of4,821 fatal work-related injuries occurred in 2014,an increase of 5.1 percent from 2013, and the highestnumber of fatalities recorded since 2008 (Table 16).However, employment increased between 2013 and2014, so the increase in the incidence of fatal work-place injuries was smaller than 5.1 percent. In 2013,private industry workers (including self-employedworkers), accounted for 89.4 percent fatal injuries; in2014, private industry workers accounted for 90.9percent of total fatalities.
The leading cause of work-related fatalities in 2014was transportation incidents, accounting for 41 per-cent of the total. Other leading causes of fatalitieswere homicides (8.5%) and other injuries by personsor animals (16%), contact with objects and equip-ment (15%), and falls, slips, and trips (17%) (DOL,2015c).
Nonfatal injuries and illnesses. The BLS reports atotal of 2.95 million Occupational Safety & HealthAdministration recordable nonfatal workplaceinjuries and illnesses in private industry workplacesin 2014, a decrease of approximately 50,000 from
Workers’ Compensation: Benefits, Coverage, and Costs • 43
Table 16Fatal Occupational Injuries — All and Private Industry, 1994-2014
Number of Fatal InjuriesYear All Private Industry
1994 6,632 5,959
1995 6,275 5,495
1996 6,202 5,597
1997 6,238 5,616
1998 6,055 5,457
1999 6,054 5,488
2000 5,920 5,347
2001 8,801 7,545
September 11 events 2,886
Other 5,915
2002 5,534 4,978
2003 5,575 5,043
2004 5,764 5,229
2005 5,734 5,214
2006 5,840 5,320
2007 5,657 5,112
2008 5,214 4,670
2009 4,551 4,090
2010 4,690 4,206
2011 4,693 4,188
2012 4,628 4,175
2013 4,585 4,101
2014 4,821 4,386
Source: U.S. Department of Labor (2015c).
Between 2013 and 2014, the totalnumber of work-related fatalities increased 5.1 percent, and private-
sector fatalities increased for the firsttime since 2010. Still, work-related fatalities remain significantly lower
than they were before 2008.

44 NATIONAL ACADEMY OF SOCIAL INSURANCE
the number reported in 2013 (DOL, 2015e). A totalof 916,400 work-related injuries/illnesses involved atleast one day’s work absence following the day ofinjury, which was essentially unchanged from 2013.
The incidence of all reported nonfatal occupationalinjuries and illnesses has declined steadily over thelast two decades, decreasing from 8.4 per 100 full-time workers in 1994, to 3.2 cases per 100 full-timeworkers in 2014. The incidence of work-relatedinjuries or illnesses involving days away from workhas also declined, down from 2.8 per 100 full-time
workers in 1994 to approximately 1 per 100 in everyyear since 2008 (Table 17 and Figure 5).
In 2014, the most common nonfatal workplaceinjuries and illnesses that resulted in days away fromwork were (with incidence rates/10,000 FTE inparentheses)37: sprains and strains (35.4); soreness orpain, including back pain (16.0); fractures (8.6);bruises and contusions (7.9); and cuts, lacerations,and punctures (7.6)( DOL, 2015e). The three occu-pational groups with the highest incidence rates ofnonfatal injuries and illnesses involving days away
37 The BLS incidence rate represents the number of injuries and illnesses per 10,000 full-time workers. This rate takes into account thenumber of injuries and illnesses and the total hours worked by all employees during the calendar year, assuming a 40 hour workweek, 50 weeks per year.
Figure 5Private Industry Occupational Injuries and Illnesses: Incidence Rates, 1980-2014
Notes:The break in the graph indicates that the data for 2002 and beyond are not strictly comparable to prior year data due to changes in Occupa-tional Safety & Health Administration recordkeeping requirements. Cases involving days away from work are cases requiring at least one day awayfrom work with or without days of job transfer or restriction. Job transfer or restriction cases occur when, as a result of a work-related injury or illness,an employer or health care professional keeps, or recommends keeping an employee from doing the routine functions of his or her job or from work-ing the full workday that the employee would have been scheduled to work before the injury or illness occurred.
Source: U.S. Department of Labor (2015e).
0
0.5
1
1.5
2
2.5
3
3.5
4
1980
1981
1982
1983
1984
1985
1986
1987
1988
1989
1990
1991
1992
1993
1994
1995
1996
1997
1998
1999
2000
2001
2002
2003
2004
2005
2006
2007
2008
2009
2010
2011
2012
2013
2014
3.63.4
3.23.1
3.3 3.3 3.3 3.33.4 3.4 3.4
3.2
3.02.9
2.8
2.5
2.22.1
2.01.9
1.81.7
1.61.5
1.4 1.41.3
1.21.1 1.1 1.1
1.0 1.0 1.0 1.0
.8
1.0
.7 .7 .7 .7.8
.9.91.0
1.11.11.2
1.11.21.21.21.2
1.11.11.0
.7.8
.9
.7.6
.5.4
.3.2
.3.3.3.3.3
Cases with Days Away from Work
Cases with Job Transfer or Restriction
Cases with Days Away from Work 2003 and later
Cases with Job Transfer or Restriction2003 and later

Workers’ Compensation: Benefits, Coverage, and Costs • 45
from work in the private sector were transportationand material moving occupations (246.7), buildingand grounds cleaning and maintenance occupations(214.2), and healthcare support occupations (201.3),which all had incidence rates of more than double
the overall private industry rate of 97.8. The occupa-tion groups with the highest median days away fromwork were: architecture and engineering (16); trans-portation and material moving occupations (14);construction and extraction (11).
Table 17Non-Fatal Occupational Injuries and Illnesses Among Private Industry Employers, 1994-2014
Number of Cases Incidence Rate (millions) (per 100 full-time workers)
Cases with Cases with Job Cases with Cases with JobAll Any Days Away Transfer or All Any Days Away Transfer or
Year Cases from Work Restriction Cases from Work Restriction
1994 6.8 2.2 0.8 8.4 2.8 1.0
1995 6.6 2.0 0.9 8.1 2.5 1.1
1996 6.2 1.9 1.0 7.4 2.2 1.1
1997 6.1 1.8 1.0 7.1 2.1 1.2
1998 5.9 1.7 1.1 6.7 2.0 1.2
1999 5.7 1.7 1.0 6.3 1.9 1.2
2000 5.7 1.7 1.1 6.1 1.8 1.2
2001 5.2 1.5 1.0 5.7 1.7 1.1
2002* 4.7 1.4 1.1 5.3 1.6 1.2
2003 4.4 1.3 1.0 5.0 1.5 1.1
2004 4.3 1.3 1.0 4.8 1.4 1.1
2005 4.2 1.2 1.0 4.6 1.4 1.0
2006 4.1 1.2 0.9 4.4 1.3 1.0
2007 4.0 1.2 0.9 4.2 1.2 0.9
2008 3.7 1.1 0.8 3.9 1.1 0.9
2009 3.3 1.0 0.7 3.6 1.1 0.8
2010 3.1 0.9 0.7 3.5 1.1 0.8
2011 3.0 0.9 0.6 3.4 1.0 0.7
2012 3.0 0.9 0.7 3.4 1.0 0.7
2013 3.0 0.9 0.7 3.3 1.0 0.7
2014 3.0 0.9 0.7 3.2 1.0 0.7
* Data for 2002 and beyond are not strictly comparable to data from prior years because of changes in OSHA recordkeeping requirements.
Source: U.S. Department of Labor (2015d).

Injuries involving lost work time or work restric-tions. Figure 5 and Table 17 show trends in theincidence of work-related injuries and illnessesamong private industry employers for cases involvingeither days away from work or injury-related jobaccommodations (job transfer or restrictions onwork) (DOL, 2015e). The data show rates per 100full-time equivalent employees from 1994 to 2014.(The break in the trend lines in 2002 represents a
change in OSHA recordkeeping requirements in thatyear, indicating that the data before and after 2002may not be strictly comparable.)
While the incidence of injuries or illnesses involvingdays away from work has declined steadily since1994, the incidence of cases resulting in job transfersor work restrictions has fluctuated. The rateincreased from 0.9 per 100 full-time equivalent
46 NATIONAL ACADEMY OF SOCIAL INSURANCE
Table 18Number of Workers' Compensation Claims Per 100,000 Insured Workers: Private Carriers in 37 Jurisdictions, 1994-2012
Total Medical Only Temporary PermanentPolicy (including Medical Claims as Temporary Total Claims Permanent Partial ClaimsPeriod medical only) Only % of Total Total as % of Total Partial as % of Total
1994 7,875 6,001 76% 1,300 17% 565 7%
1995 7,377 5,689 77% 1,217 16% 459 6%
1996 6,837 5,281 77% 1,124 16% 419 6%
1997 6,725 5,230 78% 1,070 16% 414 6%
1998 6,474 5,035 78% 977 15% 452 7%
1999 6,446 5,047 78% 927 14% 461 7%
2000 6,003 4,685 78% 870 14% 437 7%
2001 5,510 4,277 78% 799 15% 423 8%
2002 5,239 4,036 77% 770 15% 422 8%
2003 4,901 3,747 76% 725 15% 423 9%
2004 4,728 3,635 77% 702 15% 385 8%
2005 4,571 3,514 77% 667 15% 383 8%
2006 4,376 3,351 77% 638 15% 381 9%
2007 4,076 3,107 76% 587 14% 375 9%
2008 3,615 2,730 76% 515 14% 363 10%
2009 3,452 2,659 77% 521 15% 357 10%
2010 3,486 2,616 75% 519 15% 347 10%
2011 3,411 2,563 75% 509 15% 335 10%
2012 3,279 2,466 75% 500 15% 308 9%
Percent change, 1994-2012
-56.7 -57.3 -60.8 -40.7
Source: National Council on Compensation Insurance (1997-2016), Exhibit XII, Annual Statistical Bulletin.

workers in 1994 to 1.2 in 1997, leveled off until2002, decreased gradually through 2011, and hasleveled off at 0.7 per 100 full-time equivalent work-ers since then. Some of the changes in the 1990s,when the incidence of injuries involving workabsence was decreasing while the incidence of transfers/work restrictions was increasing, may reflectan increasing focus on employer accommodationsthat enable injured workers to return to modifiedwork, until they are fully recovered and able toreturn to their pre-injury jobs.
Incidence of Workers’ Compensation Claims NCCI (2016b) reports the frequency of workers’compensation claims for insured employers and statefunds in 37 jurisdictions.38 The data, replicated inTable 18 for years 1994-2012 (the most recent yearreported), show declining trends in the incidence ofclaims similar to the declining trends in incidence ofwork-related injuries reported by the BLS.
According to NCCI data, the number of workers’compensation claims from privately insured employersdeclined by 56.7 percent between 1994 and 2012(compared to the BLS estimate of a 55.3 percentdecrease in injuries and illnesses for private industryemployers over the same time period). The NCCIdata indicate the number of temporary total disabili-ty claims from private industry declined by 60.8percent (compared to the BLS estimate of a 58.9percent decline in injuries and illnesses involving daysaway from work for private industry employers) (Tables17 and 18).39
A number of studies suggest that occupationalinjuries and illnesses are commonly under-reported,
so it is unclear to what extent the decline in workers’compensation claims reflects a decrease in injuryrates versus an increase in under-reporting.40 Thereare many reasons to suspect under-reporting on thepart of workers, employers, and/or medicalproviders. Workers may not report injuries because:they do not know an injury is covered by workers’compensation; they believe filing for benefits is tootime consuming, difficult, or stressful; they believethe injury is something to be expected as part oftheir job; or they fear employer retaliation (Galizzi etal., 2010; Pransky et al., 1999; Strunin and Boden,2004). Employers may not report injuries because:their recordkeeping is faulty; they want to maintain asuperior safety record or protect their experience rat-ing modification; or they are unaware that an injuryis covered by workers’ compensation (Azaroff et al.,2002; Lashuay and Harrison, 2006). Medicalproviders may fail to report injuries and illnesses thattake time to develop, such as carpal tunnel syn-drome, noise-induced hearing loss, and lung diseaseslike silicosis, because they are unaware of the work-place connection.41
Several studies based on independent sources of data(emergency room referrals, hospital discharge rates,and trauma registry data) show much smallerdeclines in occupational injury rates than appear inthe NCCI data (CDC, 2007; Friedman and Forst,2007; Sears et al., 2014). These differences suggesteither that under-reporting has worsened or thatonly rates of less-severe injuries (which would not bereferred for emergency care) have declined.
There are also incentives for workers and/or medicalproviders to over-report injuries or illnesses as work-related. The 100 percent coverage of medical costs
Workers’ Compensation: Benefits, Coverage, and Costs • 47
38 NCCI measures frequency by lost time claims for injuries occurring in the accident year per one million of earned premium adjustedby state for changes in average weekly wages.
39 While the trends in private sector injury or illness claims from the BLS and NCCI are similar across time, there are a number of rea-sons why they may differ. First, there are discrepancies in the classification of claims. In workers’ compensation, there is generally athree to seven day waiting period before a claim is recorded (and would be reported in NCCI data) whereas any case in which aworker misses at least one day away from work is classified as a “days away from work” (DAFW) case by OSHA and reflected as suchin BLS published data. Second, the BLS and NCCI cover different jurisdictions – the BLS covers injuries and illnesses across the en-tire U.S. whereas the NCCI only records workers’ compensation claims in 37 jurisdictions. Third, there is evidence that some em-ployers do not comply with OSHA recordkeeping or Survey of Occupational Injury and Illness reporting instructions, leading tounderreporting of workers’ compensation eligible claims in BLS data (Rappin et al., 2016).
40 See Azaroff et al. (2002), Spieler and Burton (2012), and OSHA (2015) for reviews of these studies.
41 Studies have typically shown much less reporting of these types of conditions as work-related than is suggested by their prevalence inmedical data (Stanbury et al., 1995; Biddle et al., 1998; Morse et al., 1998; Milton et al., 1998; DOL, 2008). On the other hand,there are incentives in some states for providers to report injuries as work-related because compensation for medical care is higher inworkers’ compensation.
under workers’ compensation creates incentives forboth groups to identify a work-related cause whenthe etiology of an injury or illness is uncertain.Workers also have incentives to report injuries aswork related if they can receive higher disability benefits from workers’ compensation than from aprivate disability plan or state unemployment insurance.
Addendum Other Disability Benefit Programs Workers’ compensation benefits can be supplement-ed by other sources of income for injured workers.This addendum describes the major disability support programs that interact with workers’ compensation, namely: temporary sick leave, short-and long-term disability benefits, retirement benefits,Social Security Disability Insurance, and Medicare.
Sick leave. Sick leave is a common form of wagereplacement for short-term absences from work dueto illnesses or injuries unrelated to work. About 61percent of all private-sector employees had access tosome type of paid sick leave in 2014, providedthrough their employer or a private short-term dis-ability plan (DOL, 2015b). Sick leave typically pays100 percent of wages for a number of days depend-ing on the worker’s job tenure and hours worked.Sick leave can be used to cover wage losses for thefirst three to seven days of a workers’ compensationdisability claim, when these days are not covered bystatute.
Paid sick leave is far more common than workers’compensation temporary disability benefits, and it isadministratively easier for workers to access andemployers to administer. For employers, the workers’compensation option has reporting requirements andnegative impacts on premium rates that are not pre-sent in paid sick leave. For workers, the decision toreport and pursue a workers’ compensation claiminvolves a lower wage replacement rate, and a mini-mum three-day wage penalty (unless they also applyfor paid sick leave).42 All these factors influenceworker and employer decisions regarding whether tocover short duration work-related time losses withsick leave or workers’ compensation.
Short-term disability benefits. Five states(California, Hawaii, New Jersey, New York, andRhode Island) require that employers provide short-to medium-term disability insurance for employees.Some private employers offer short-term disabilityinsurance to their workers even in states where suchinsurance is not required. About 40 percent of pri-vate industry workers had access to short-termdisability insurance in 2014 (DOL, 2015g).Typically, workers must have a specified amount ofpast employment or earnings to qualify for benefits,and benefits replace about half of the worker’s priorearnings. In general, workers receiving workers’ com-pensation benefits are not eligible for these types ofshort-term disability benefits.
There are also short-term disability plans that coverperiods that are longer than the sick leave providedas a function of payroll but shorter than required toqualify for long-term disability benefits. In addition,there are state and municipal short-term disabilitybenefit programs for public employees (particularlyfor police and firefighters) that coordinate withworkers’ compensation programs or, in some cases,are an alternative to workers’ compensation.
Long-term disability benefits. Long-term disabilityinsurance covers about 34 percent of private-sectoremployees. Such coverage is most common amongrelatively high-paying management, professional, andrelated occupations. About 59 percent of workers inmanagement and professional-related occupationswere covered by long-term disability plans as of2014, compared to 34 percent of workers in salesand office occupations, and 10 percent of workers inservice occupations (DOL, 2015g). Long-term dis-ability insurance is also sold in individual policies,typically to high-earning professionals. Such individ-ual policies are not included in these coveragestatistics.
Long-term disability benefits are usually paid after awaiting period of three to six months or after short-term disability benefits end. Long-term disabilityinsurance is generally designed to replace 60 percentof earnings, although replacement rates of 50 or 66percent are also common. Almost all long-term dis-ability insurance is coordinated with Social Security
48 NATIONAL ACADEMY OF SOCIAL INSURANCE
42 Workers’ compensation typically replaces two-thirds of a worker’s pre-injury wages before tax up to a maximum, but these benefitsare not taxed. A useful wage-replacement comparison is workers’ compensation benefits and post-tax wages.

Disability Insurance (SSDI) and workers’ compensa-tion. That is, private long-term disability benefits arereduced dollar for dollar by the amount of SocialSecurity or workers’ compensation benefits received.If Social Security benefits replace 40 percent of aworker’s prior earnings, for example, the long-termdisability benefit would pay the balance to achieve a60 percent wage replacement.
Retirement benefits. Retirement benefits also maybe available to workers who become disabled becauseof a work-related injury or illness. Most defined-ben-efit pension plans have some disability provision;benefits may be available at the time of disability ormay continue to accrue until retirement age.Defined-contribution pension plans will often makefunds in an employee’s account available withoutpenalty if the worker becomes disabled, but theseplans do not have the insurance features of defined-benefit pensions or disability insurance.
Federal disability programs. Social SecurityDisability Insurance (SSDI) and Medicare providecash and medical benefits, respectively, to workerswho become disabled and unable to work prior tonormal retirement age. SSDI benefits are available toworkers with disabilities whether or not the disabilityresults from a work-related injury, but the eligibilityrules for SSDI differ from the rules for workers’compensation.
Workers are eligible for workers’ compensation bene-fits from their first day of employment, whileeligibility for SSDI requires workers to have a sub-stantial history of contributions to the SocialSecurity system. Workers’ compensation providesbenefits for both short- and long-term disabilitiesand for partial as well as total disabilities. Workers’compensation cash benefits begin after a few days’work absence, while SSDI benefits begin only after afive-month waiting period. SSDI benefits are paidonly to workers who have long-term impairmentsthat preclude gainful employment in the labor mar-
ket suitable for the worker by virtue of training orexperience.
Medicare pays health care costs for persons whoreceive SSDI, after an additional 24-month waitingperiod (or 29 months after the onset of disability).Medicare covers all medical conditions, includingwork-related injuries or illnesses. According to theMedicare Secondary Payer Act, however, if a workerhas workers’ compensation and Medicare coverage,workers’ compensation is the primary payer for ill-nesses and injuries covered under the workers’compensation law. Medicare is the secondary payerfor medical costs after the primary workers’ compen-sation obligation is met.
In 2014, workers’ compensation benefits paid (cashbenefits plus medical payments) totaled $62.3 bil-lion. SSDI paid $145.1 billion in wage replacementbenefits to disabled persons and their dependents,and Medicare paid $90.3 billion for medical care fordisabled persons under age 65, for a total of $235.4billion (SSA, 2015b; CMS, 2016).
If a worker becomes eligible for both SSDI andworkers’ compensation cash benefits, one or bothprograms will reduce benefits to avoid making exces-sive payments relative to the worker’s past earnings.The Social Security amendments of 1965 requirethat SSDI benefits be reduced43 (or “offset”) suchthat the combined total of workers’ compensationand SSDI benefits does not exceed 80 percent of theworker’s prior earnings.44 Some states, however, hadestablished reverse offset laws prior to the 1965 legis-lation, whereby workers’ compensation payments arereduced if the worker receives SSDI. Legislation in1981 eliminated the states’ option to adopt reverseoffset laws, but the 15 states that already had suchlaws in place received exemptions.45
As of December 2014, about 8.95 million workerswith disabilities and 1.98 million dependentsreceived SSDI benefits (SSA, 2015a) (Table 19).About 651,000 (6.0%) of these individuals were
Workers’ Compensation: Benefits, Coverage, and Costs • 49
43 The portion of workers’ compensation benefits that offset (reduce) SSDI benefits are subject to federal income tax (IRC section86(d)(3)).
44 The cap remains at 80 percent of the worker’s average earnings before disability except that, in the relatively few cases when SocialSecurity disability benefits for the worker and dependents exceed 80 percent of prior earnings, the benefits are not reduced below theSocial Security amount. This cap also applies to coordination between SSDI and other public disability benefits derived from jobsnot covered by Social Security, such as state or local government jobs where the governmental employer has chosen not to cover itsemployees under Social Security.

dual beneficiaries of workers’ compensation or otherpublic disability programs in 2014. Of these,112,264 persons (1.0% of total beneficiaries) werecurrently receiving reduced SSDI benefits because ofthe offset provision.46
Benefits Incurred vs. Benefits Paid The Academy’s estimates of workers’ compensationbenefits in this report reflect amounts paid for work-related injuries and illnesses in a calendar year
regardless of when those injuries occurred. This measure of benefits is commonly used in reportingdata on social insurance programs, private employeebenefits, and other income security programs.
A different measure, accident year incurred losses (oraccident year incurred benefits) is the commonreporting measure for private workers’ compensationinsurers and some state funds. Incurred benefitsmeasure the total expected benefits associated withinjuries that occur in a particular year, regardless of
50 NATIONAL ACADEMY OF SOCIAL INSURANCE
Table 19Dual Eligible Individuals: Social Security Disability Insurance (SSDI) Beneficiaries with Workers' Compensation (WC) or Public Disability Benefits (PDB), 2014
Total Workers DependentsType of Case Number Percent Number Percent Number Percent
All Disability Insurance Beneficiaries 10,931,092 100.0 8,954,518 100.0 1,976,574 100.0
Total Dual Eligibles 1,309,634 12.0 1,053,756 11.8 255,878 12.9
Currently Receiving SSDI and WC or PDB 651,212 6.0 526,744 5.9 124,468 6.3
SSDI Reduced by Cap 112,264 1.0 82,706 0.9 29,558 1.5
SSDI Not Reduced by Cap 393,565 3.6 324,728 3.6 68,837 3.5
Reverse Jurisdiction 52,569 0.5 42,707 0.5 9,862 0.5
Pending Decision on WC or PDB 92,814 0.8 76,603 0.9 16,211 0.8
SSDI Previously Offset by WC or PDB 658,422 6.0 527,012 5.9 131,410 6.6
Notes: Social Security disability benefits are offset against workers’ compensation and certain other public disability benefits(PDB) in most states. In general, the PDB offset applies to disability benefits earned in state, local, or federal government em-ployment that is not covered by Social Security. There are 15 states with reverse offset laws where SSDI is the first payer forsome or all types of workers' compensation benefits. The states are Alaska, California, Colorado, Florida, Louisiana, Minnesota,Montana, Nevada, New Jersey, New York, North Dakota, Ohio, Oregon, Washington, and Wisconsin. California's reverse off-set laws only apply to workers' compensation benefits paid through the Subsequent Injuries' Fund and Industrial DisabilityLeave. SSDI previously offset by WC or PDB consists of the entire universe of beneficiaries who are currently receiving SSDIbenefits that at one point had their SSDI benefits offset by WC or PDB, but no longer do.
Source: Social Security Administration, Master Beneficiary Record, 100 percent data, and Social Security Administration Workers' Compensation and Public Disability Benefit file, 100 percent data (SSA, 2015a).
45 States with reverse offset laws for some or all types of workers’ compensation benefits are Alaska, California, Colorado, Florida,Louisiana, Minnesota, Montana, Nevada, New Jersey, New York, North Dakota, Ohio, Oregon, Washington, and Wisconsin. In ad-dition, there are reverse offset rules for other types of public disability benefits in Hawaii, Illinois, New Jersey, and New York (SSAProgram Operations Manual System, DI 52105.001). California’s reverse offset laws only apply to workers’ compensation benefitspaid through the Subsequent Injuries Fund and Industrial Disability Leave.
46 Burton and Guo (2016) examine the relationship between SSDI and workers’ compensation programs in detail.

Workers’ Compensation: Benefits, Coverage, and Costs • 51
whether the benefits are paid in that year or futureyears. The two measures, calendar year benefits paidand accident year benefits incurred, reveal importantbut different information.47
For the purpose of setting insurance premiums, it isvital to estimate the incurred benefits the premiumsare required to cover. When an employer purchasesworkers’ compensation insurance for a particularperiod, the premiums are designed to cover currentand future liabilities for all injuries that occur duringthe period covered by the policy. NCCI and staterating bureaus use trends in accident year (or policyyear) incurred benefits to help determine their rates.
Benefits incurred are also more appropriate for poli-cy purposes than benefits paid. For example, if astate lowers benefits or tightens compensability rulesfor new injuries as of a given date, benefits would beexpected to decline in the future. Similarly, if a stateraises benefits or expands the range of compensableinjuries, benefits would be expected to increase inthe future. The policy change will show up immedi-ately in estimates of incurred benefits but will beobserved more slowly in measures of paid benefitsbecause the latter measure is also influenced by pay-ments for injuries occurring in years prior to thepolicy change.
However, a disadvantage of relying on the measureof incurred benefits is that it takes many years before
the estimated losses associated with injuries occur-ring in a given year are reliable and stable. NCCIupdates accident year incurred benefits for 16 ormore years before the data for a particular year areconsidered final (or “developed to ultimate”). On theother hand, benefits paid are known and fixed forany given reporting period
Another disadvantage of using accident year incurreddata for reports such as this is that the data onincurred benefits are even more difficult to obtainthan data on benefits paid. Information on incurredbenefits is not routinely available for state regulatoryagencies, self-insured employers, and many statefunds, or for federal workers’ compensation pro-grams. While using incurred loss data instead of paidlosses may have some advantages for actuarial reservesetting and rate making, it has the disadvantage ofnot being readily available from state agencies. Norare incurred losses from different sources useful toaggregate without an understanding of how theincurred losses were estimated by each source. Inaddition, data on incurred benefits do not includebenefits paid by employers under large deductiblepolicies, benefits paid by employers insured undermonopolistic state funds, or benefits paid in stateswith a rating bureau.
47 A more detailed discussion of these measures is included in the Glossary and in Thomason, Schmidle, and Burton (2001).

52 NATIONAL ACADEMY OF SOCIAL INSURANCE

Accident Year: The year in which an injuryoccurred, or the year of onset or manifestation of anillness.
Accident Year Incurred Benefits: Benefits associatedwith all injuries and illnesses occurring in the acci-dent year, regardless of the years in which thebenefits are paid. (Also known as calendar accidentyear incurred benefits.)
Black Lung Benefits: See: Coal Mine Health andSafety Act.
BLS: The Bureau of Labor Statistics (BLS) in theU.S. Department of Labor is a statistical agency thatcollects, processes, analyzes, and disseminates statisti-cal data about the labor market. For moreinformation, visit www.bls.gov.
Calendar Year Paid Benefits: Benefits paid during acalendar year regardless of when the injury or illnessoccurred.
Coal Mine Health and Safety Act: The Coal MineHealth and Safety Act (Public Law 91-173) wasenacted in 1969 and provides black lung benefits tocoal miners disabled as a result of exposure to coaldust and to their survivors.
Compromise and Release (C&R) Agreement: Anagreement to settle a workers’ compensation case.State laws vary as to the nature of these releases, butthere are typically three elements to a C&R agree-ment: a compromise between the worker’s claim andthe employer’s offer concerning the amount of cashand/or medical benefits to be paid; the payment ofthe compromised amount in a fixed amount (com-monly called a “lump sum” but which may or maynot be paid to the claimant at once); and the releaseof the employer from further liability. Unless it was“full and final”, the release may allow for reopeningmedical or indemnity payments under specific conditions.
Covered Employment: The Academy’s coveragedata include employees of those employers requiredto be covered by workers’ compensation programs. Amore inclusive measure of covered employment
would also include employees of those employersthat voluntarily elect coverage.
Deductibles: Under deductible policies written byprivate carriers or state funds, the insurer is responsi-ble for paying all of the workers’ compensationbenefits, but employers are responsible for reimburs-ing the insurer for those benefits up to a specifieddeductible amount. Most high-deductible plans areadministered by a third party administrator that han-dles payments and settles accounts with the insurer.Deductibles may be written into an insurance policyon a per injury basis, or an aggregate basis, or a com-bination of a per injury basis with an aggregate cap.
Defense Base Act: The Defense Base Act (DBA-42U.S.C. §§ 1651-54) is a federal law extending theLongshore and Harbor Workers’ Compensation Act(33 U.S.C. §§ 901-50), passed in 1941 and amend-ed later, to persons: (1) employed by privateemployers at U.S. defense bases overseas, (2)employed under a public work contract with theUnited States performed outside the U.S., (3)employed under a contract with the United States,for work performed outside the U.S. under theForeign Assistance Act, or (4) employed by anAmerican contractor providing welfare or similar ser-vices outside the United States for the benefit of theArmed Services.
DI: Disability insurance from the Social Securityprogram. See: SSDI.
Disability: A loss of functional capacity associatedwith a health condition.
FECA: The Federal Employees’ Compensation Act(FECA) Public Law (103-3 or 5 U.S.C. §§ 8101-52), enacted in 1916, provides workers’compensation coverage to U.S. federal civilian andpostal workers around the world for work-relatedinjuries and occupational diseases.
FELA: The Federal Employers’ Liability Act (FELA45 U.S.C. § 51 et seq.), enacted in 1908, gives railroad workers engaged in interstate commerce anaction in negligence against their employer in theevent of work-related injuries or occupational diseases.
Workers’ Compensation: Benefits, Coverage, and Costs • 53
Glossary

Guaranty Fund: A guaranty fund is a special state-based fund that assumes all or part of the liability forworkers’ compensation benefits provided to a workerwhen the employer or insurance carrier legallyresponsible for those benefits is unable to make pay-ments. Guaranty funds for private insurance carriers(all states with private carriers have these) and forself-insuring employers (less than half the states havethese) are always separate funds. Both types arefinanced by assessments from insurers or self-insuredemployers, respectively.
Group Self-Insurance: A special form of self-insur-ance that is available to groups of employers, whichis only available in a little over half of the states. Thisis similar to a mutual insurance company and, assuch, is closely regulated.
IAIABC: The International Association of IndustrialAccident Boards and Commissions (IAIABC) is theorganization representing workers’ compensationagencies in the United States, Canada, and othernations and territories. For more information, visitwww.iaiabc.org.
Incurred Losses (or Incurred Benefits): Benefitspaid to the valuation date plus liabilities for futurebenefits for injuries that occurred in a specified peri-od, such as an accident year.
Jones Act: The Jones Act is Section 27 of theMerchant Marine Act (P.L. 66-261), passed in 1920,which extends the provision of the FederalEmployers’ Liability Act to qualifying sailors (indi-viduals assigned to a vessel or fleet that operates innavigable waters, meaning waterways capable ofbeing used for interstate or foreign commerce).
LHWCA: The Longshore and Harbor Workers’Compensation Act (LHWCA 33 U.S.C. §§ 901-50), enacted in 1927, requires employers to provideworkers’ compensation protection for longshore, har-bor, and other maritime workers. See: Defense BaseAct (DBA).
Loss Adjustment Expenses: Salaries and fees paid toinsurance adjusters, as well as other expensesincurred from adjusting claims.
Losses: A flexible term that can be applied in severalways: Paid benefits, incurred benefits, fully devel-
oped benefits, and possibly including incurred butnot reported benefits.
NAIC: The National Association of InsuranceCommissioners (NAIC) is the national organizationof chief insurance regulators in each state, theDistrict of Columbia, and five U.S. territories. Itassists state insurance regulators, individually andcollectively, to achieve insurance regulatory goals. Formore information, visit www.naic.org.
NCCI: The National Council on CompensationInsurance, Inc. (NCCI) is a national organizationthat assists private carriers and insurance commis-sioners in collecting statistical information forpricing workers’ compensation coverage in 37 states.For more information, visit www.ncci.com.
OSHA: The OSHAct created the OccupationalSafety and Health Administration (OSHA) withinthe U.S. Department of Labor. OSHA is responsiblefor promulgating standards, inspecting workplacesfor compliance, and prosecuting violations.
OSHAct: The Occupational Safety and Health Act(OSHAct Public Law 91-596) is a federal law enact-ed in 1970 that establishes and enforces workplacesafety and health rules for nearly all private-sectoremployers.
Paid Losses (or Paid Benefits): Benefits paid duringa specified period, such as a calendar year, regardlessof when the injury or disease occurred.
Permanent Partial Disability (PPD): A disabilitythat, although permanent, does not completely limita person’s ability to work. A statutory benefit awardis paid for qualifying injuries.
Permanent Total Disability (PTD): A permanentdisability that is deemed by law to preclude materiallevels of employment.
Residual Market: The mechanism used to provideinsurance for employers who are unable to purchaseinsurance in the voluntary private market. In somejurisdictions, the state fund is the “insurer of lastresort” and serves the function of the residual mar-ket. In others, there is a separate pool financed byassessments of private insurers, which is also knownas an assigned risk pool.
54 NATIONAL ACADEMY OF SOCIAL INSURANCE

Second Injury Fund: A second injury fund is a spe-cial fund that assumes all or part of the liability forworkers’ compensation benefits provided to a workerbecause of the combined effects of a work-relatedinjury or disease with a preexisting medical condi-tion. The second injury fund pays costs associatedwith the prior condition to encourage employers tohire injured workers who want to return to work.
Self-insurance: Self-insurance is a state-regulatedarrangement in which the employer assumes respon-sibility for the payment of workers’ compensationbenefits to the firm’s employees with workplaceinjuries or diseases. Most employers do not self-insure but instead purchase workers’ compensationinsurance from a private carrier or state fund.
SSA: The U.S. Social Security Administration (SSA)administers the Social Security program, which paysretirement, disability, and survivors’ benefits to work-ers and their families, and the federal SupplementalSecurity Income program, which provides incomesupport benefits to low-income, aged, and disabledindividuals. For more information, visit www.ssa.gov.
SSDI: Social Security Disability Insurance (SSDI)pays benefits to insured workers who sustain severe,long-term work disabilities due to any cause. See:DI.
Temporary Partial Disability (TPD): A temporarydisability that does not completely limit a person’sability to work.
Temporary Total Disability (TTD): A disabilitythat temporarily precludes a person from performingthe pre-injury job or another job at the employer
that the worker could have performed prior to theinjury.
Unemployment Insurance (UI): Federal/state pro-gram that provides cash benefits to workers whobecome unemployed through no fault of their ownand who meet certain eligibility criteria set by thestates.
U.S. DOL: The U.S. Department of Labor adminis-ters a variety of federal labor laws including thosethat guarantee workers’ rights to safe and healthyworking conditions, a minimum hourly wage andovertime pay, freedom from employment discrimina-tion, unemployment insurance, and other incomesupport. For more information, visit www.dol.gov.
WC: Workers’ compensation. A form of governmentinsurance, mandated for most employers, that pro-vides statutory benefits for covered work-relatedinjuries and illnesses.
WCRI: The Workers Compensation ResearchInstitute (WCRI) is a research organization provid-ing information about public policy issues involvingworkers’ compensation systems. For more informa-tion, visit www.wcrinet.org
Work-Related Injury/Illness: An injury or illnesscaused by activities related to the workplace. Theusual legal test for “work-related” is “arising out ofand in the course of employment.” However, thedefinition of a work-related injury or disease that iscompensable under a state’s workers’ compensationprogram can be quite complex and varies acrossstates.
Workers’ Compensation: Benefits, Coverage, and Costs • 55

56 NATIONAL ACADEMY OF SOCIAL INSURANCE
The National Academy of Social Insurance’s esti-mates of workers’ compensation coverage start withthe number of workers in each state who are coveredby unemployment insurance (UI) (DOL, 2015f).Those who are not required to be covered by UIinclude: some farm and domestic workers who earnless than a threshold amount from one employer;some state and local employees, such as elected offi-cials; employees of some nonprofit entities, such asreligious organizations, for whom coverage is option-al in some states; unpaid family workers; andrailroad employees who are covered under a separateunemployment insurance program. Railroad workersalso are not covered by state workers’ compensationbecause they have other arrangements (NASI, 2002). One category of workers not covered under eitherunemployment insurance or workers’ compensationis self-employed individuals. All U.S. employers whoare required to pay unemployment taxes must reportquarterly information to their state employmentsecurity agencies about their employees and payrollcovered by unemployment insurance. These employ-er reports are the basis for statistical reports preparedby the U.S. Bureau of Labor Statistics, known as theES-202 data. These data are a census of the universeof U.S. workers who are covered by unemploymentinsurance (DOL, 2015f).
Key assumptions underlying the Academy’s estimatesof workers’ compensation coverage, shown in TableA, are:
(1) Workers whose employers do not report thatthey are covered by UI are not covered by work-ers’ compensation.
(2) Workers who are reported to be covered by UIare generally covered by workers’ compensationas well, except in the following cases:
(a) Workers in small firms (which are requiredto provide UI coverage in every state) are notcovered by workers’ compensation if thestate law exempts small firms from manda-tory workers’ compensation coverage.
(b) Employees in agricultural industries (whomay be covered by UI) are not covered byworkers’ compensation if the state law
exempts agricultural employers from manda-tory workers’ compensation coverage.
(c) In Texas, where workers’ compensation cov-erage is elective for almost all employers,estimates are based on periodic surveys con-ducted by the Texas Research and OversightCouncil (TDI et al., 2014).
All federal employees are covered by workers’ com-pensation, regardless of the state in which they work.
Small Firm Exemptions. Private firms with fewerthan three employees are exempt from mandatoryworkers’ compensation coverage in eight states:Arkansas, Georgia, Michigan, New Mexico, NorthCarolina, Virginia, West Virginia, and Wisconsin.Firms with fewer than four employees are exempt intwo states: Florida and South Carolina. Firms withfewer than five employees are exempt from mandatorycoverage in five states: Alabama, Mississippi,Missouri, Oklahoma, and Tennessee (IAIABC-WCRI, 2014). The Academy assumes that workersare not covered by workers’ compensation if theywork in a small firm located in one of the thesestates.
To estimate the number of employees affected by thesmall firm exemptions, we use data from the U.S.Small Business Administration (SBA). The datashow, for each state, the proportion of private-sectoremployees who worked for firms with fewer thanfive employees in 2013, the latest year for which dataare available (SBA, 2016). For the 5 states withnumerical exemptions for firms with fewer than fiveemployees, these proportions are: Alabama, 4.6 per-cent; Mississippi, 5.0 percent; Missouri, 4.9 percent;Oklahoma, 5.5 percent; and Tennessee, 4.0 percent.These proportions are applied to the number of UI-covered workers in each state to calculate thenumber of employees affected by the small firmexemption.
For the states with numerical exemptions for firmswith fewer than three or four workers, the SBA pro-portions of workers in small firms (fewer than fiveemployees) must be adjusted downward to corre-spond to the workers’ compensation cutoff in eachstate. We use national data on small firms from the
Appendix A: Coverage Estimates
Workers’ Compensation: Benefits, Coverage, and Costs • 57
U.S. Census Bureau (2005) to make the adjust-ments. The data indicate that, among those workersemployed in small firms, 43.9 percent work in firmswith fewer than three employees, and 71.8 percentwork in firms with fewer than four employees.
For the eight states that exempt firms with fewerthan three workers, the proportions in small firmsare: Arkansas, 5.1 percent; Georgia, 4.9 percent;Michigan, 4.7 percent; New Mexico, 5.6 percent;North Carolina, 4.8 percent; Oklahoma, 5.5 per-cent; Tennessee, 4.0 percent; Virginia, 4.7 percent;West Virginia, 4.8 percent; and Wisconsin, 4.2 per-cent (SBA, 2016). These proportions are adjusted bya factor of 43.9 percent to estimate the proportion ofworkers in exempt firms. For example, the propor-tion of Arkansas private-sector workers in firms withfewer than three employees is: (5.1 %) x (43.9 %) =2.2 percent.
For the two states that exempt firms with fewer thanfour workers, the proportions in small firms are:Florida, 6.2 percent, and South Carolina, 4.9 per-cent. These proportions are adjusted by a factor of71.8 percent to estimate the proportion of workersin exempt firms. For South Carolina, the proportionof private sector workers in firms with fewer thanfour employees is (4.9%) x (71.8%). The adjustedratios are applied to the proportion of workers insmall firms in each state to calculate the exempt pop-ulation. In total, we estimate that 1.1 millionworkers were excluded from workers’ compensationcoverage in 2014 because of small firm exemptionsfrom mandatory coverage.
Agricultural Exemptions. We assume agriculturalworkers are excluded from workers’ compensationcoverage if they work in a state where agriculturalemployers are exempt from mandatory coverage.Only 13 jurisdictions have no exemption for agricul-tural workers: Alaska, Arizona, California,Connecticut, District of Columbia, Hawaii, Idaho,Massachusetts, New Hampshire, New Jersey, Ohio,Oregon, and Wyoming. In states with agriculturalexemptions, we identify the number of agriculturalworkers and subtract them from the total number ofUI covered jobs. To identify agricultural workers, weuse the Quarterly Census of Employment and Wages(DOL, 2015h), which provides estimates of totalemployment by state and by industry using NorthAmerican Industry Classification System (NAICS)codes. We estimate that roughly 497,000 agriculturalworkers were excluded from workers’ compensationin 2014 because of state exemptions.
Texas. In Texas, where workers’ compensation cover-age is elective for almost all employers, theAcademy’s estimate of coverage is based on periodicsurveys conducted by the Texas Department ofInsurance and the Workers’ Compensation Researchand Evaluation Group (TDI et al., 2014). Theirmost recent survey estimated that 80 percent ofTexas employees were covered in 2014. We appliedthis ratio to all UI-covered Texas employees (otherthan federal government workers, who were notincluded in the Texas surveys) to determine the totalnumber of employees covered by workers’ compensa-tion. In 2014, we estimate that 2.2 million workersin Texas were not covered by workers’ compensation.

58 NATIONAL ACADEMY OF SOCIAL INSURANCE
Tabl
e A
Doc
umen
ting
Wor
kers’ C
ompe
nsation Cov
erag
e Estim
ates, 2
014 Ann
ual A
verage
s
Une
mpl
oym
ent I
nsur
ance
(UI) C
over
ed Jo
bsa
Wor
kers’ C
ompe
nsat
ion
(WC
) Exe
mpt
ions
Priv
ate, N
on-
WC
W
C as a
Stat
eTo
tal
Farm
Firm
sSm
all F
irm
bAgr
icul
ture
cTe
xasd
Cov
ered
Jobs
% o
f UI
Alaba
ma
1,81
0,07
0 1,
499,
419
69,4
49
4,90
1 -
1,
735,
720
95.9
Alask
a31
5,21
4 25
2,94
2 -
-
-
315,
214
100.
0 Arizo
na2,
484,
708
2,14
0,51
2 -
-
-
2,48
4,70
8 10
0.0
Ark
ansa
s1,
137,
487
949,
774
26,4
87
7,56
2 -
1,
103,
438
97.0
C
alifo
rnia
15,5
66,8
28
13,2
98,9
88
-
- -
15
,566
,828
10
0.0
Col
orad
o2,
365,
067
2,01
7,21
1 -
11
,958
-
2,
353,
109
99.5
C
onne
cticut
1,63
6,17
5 1,
412,
982
-
- -
1,
636,
175
100.
0 D
elaw
are
418,
087
361,
143
-
1,14
6 -
41
6,94
1 99
.7
District o
f Col
umbi
a53
2,34
3 49
5,07
3 -
-
-
53
2,34
3 10
0.0
Flor
ida
7,62
3,89
7 6,
675,
923
319,
632
55,2
61
-
7,24
9,00
4 95
.1
Geo
rgia
3,93
3,90
7 3,
382,
176
90,4
98
14,5
12
-
3,82
8,89
7 97
.3
Haw
aii
593,
146
498,
821
-
- -
59
3,14
6 10
0.0
Idah
o63
4,01
4 51
5,63
4 -
-
-
634,
014
100.
0 Illin
ois
5,68
2,74
3 4,
961,
472
-
13,6
91
-
5,66
9,05
2 99
.8
Indi
ana
2,85
4,54
1 2,
487,
303
-
12,5
92
-
2,84
1,94
9 99
.6
Iow
a1,
498,
392
1,26
4,82
6 -
15
,427
-
1,
482,
965
99.0
K
ansa
s1,
332,
253
1,10
3,51
5 -
10
,282
-
1,
321,
971
99.2
K
entu
cky
1,76
9,42
6 1,
503,
150
-
4,85
2 -
1,
764,
574
99.7
Lo
uisian
a1,
893,
712
1,60
6,53
0 -
4,
629
-
1,88
9,08
3 99
.8
Mai
ne57
6,36
3 49
1,89
6 -
2,
985
-
573,
378
99.5
M
aryl
and
2,40
9,89
4 2,
062,
699
-
3,95
5 -
2,
405,
939
99.8
M
assa
chus
etts
3,31
4,71
8 2,
927,
768
-
- -
3,
314,
718
100.
0 M
ichi
gan
4,03
9,78
8 3,
514,
095
91,1
31
24,8
89
-
3,92
3,76
8 97
.1
Min
neso
ta2,
699,
095
2,34
0,93
3 -
17
,281
-
2,
681,
814
99.4
M
ississip
pi1,
077,
248
858,
483
42,7
55
7,45
7 -
1,
027,
036
95.3
M
isso
uri
2,61
4,67
6 2,
241,
513
109,
390
9,40
2 -
2,
495,
884
95.5

Workers’ Compensation: Benefits, Coverage, and Costs • 59
Mon
tana
427,
226
354,
347
-
3,53
5 -
42
3,69
1 99
.2
Neb
rask
a92
9,47
4 77
5,79
9 -
11
,015
-
91
8,45
9 98
.8
Nev
ada
1,18
4,58
2 1,
053,
429
-
2,11
8 -
1,
182,
464
99.8
N
ew H
amps
hire
619,
189
540,
074
-
- -
61
9,18
9 10
0.0
New
Jersey
3,79
3,10
9 3,
255,
269
-
- -
3,
793,
109
100.
0 N
ew M
exico
769,
504
610,
083
18,8
04
8,41
1
-
742,
289
96.5
N
ew Y
ork
8,73
2,25
3 7,
462,
044
-
22,1
04
8,71
0,14
9 99
.7
Nor
th C
arol
ina
3,98
8,57
9 3,
354,
480
89,3
97
21,1
80
-
3,87
8,00
2 97
.2
Nor
th D
akot
a43
5,57
7 37
2,45
7 -
3,
592
-
43
1,98
5 99
.2
Ohi
o5,
107,
621
4,46
5,02
5 -
-
-
5,10
7,62
1 10
0.0
Okl
ahom
a1,
536,
581
1,25
3,14
7 68
,515
9,
226
-
1,
458,
840
94.9
O
rego
n1,
698,
599
1,42
3,74
6 -
-
-
1,69
8,59
9 10
0.0
Penn
sylv
ania
5,54
8,94
7 4,
941,
790
-
19,6
57
-
5,52
9,29
0 99
.6
Rho
de Is
land
453,
117
403,
714
-
638
-
45
2,47
9 99
.9
Sout
h C
arol
ina
1,86
3,33
5 1,
551,
386
58,2
07
5,76
8
-
1,79
9,36
0 96
.6
Sout
h D
akot
a39
9,85
2 33
4,61
5 -
4,
502
-
39
5,35
0 98
.9
Tenn
esse
e2,
701,
647
2,33
6,59
2 93
,018
5,
795
-
2,
602,
834
96.3
Te
xas
11,1
85,6
32
9,55
1,27
7 -
45
,671
2,
237,
126
8,90
2,83
5 79
.6
Uta
h1,
257,
595
1,07
1,54
5 -
4,
512
-
1,
253,
083
99.6
Ver
mon
t29
7,85
9 24
9,02
6 -
2,
498
-
29
5,36
1 99
.2
Virgi
nia
3,48
5,03
5 2,
961,
057
76,5
26
8,21
6
-
3,40
0,29
3 97
.6
Was
hing
ton
2,97
2,25
1 2,
446,
566
-
72,9
03
-
2,89
9,34
8 97
.5
Wes
t Virgi
nia
677,
522
562,
481
14,8
93
825
-
66
1,80
4 97
.7
Wisco
nsin
2,72
9,87
7 2,
357,
366
54,5
17
21,7
74
-
2,65
3,58
6 97
.2
Wyo
min
g27
7,05
8 21
5,82
7 -
-
-
277,
058
100.
0 To
tal N
on-Federal
133,885,813
114,767,923
1,223,219
496,722
2,237,126
129,928,745
97.0
Fede
ral
2,74
4,34
0 -
- -
- 2,
744,
340
100.
0 TOTAL
136,630,153
114,767,923
1,223,219
496,722
2,237,126
132,673,085
97.1
a.
UI-co
vere
d em
ploy
men
t rep
orte
d in
the ETA-2
02 d
ata pr
oduc
ed b
y th
e Bur
eau
of L
abor
Sta
tistic
s (U
.S. D
OL,
201
5f).
b. D
ata on
em
ploy
ees a
t sm
all f
irm
s cam
e from
the Sm
all B
usin
ess A
dmin
istra
tion
and
the U
.S. C
ensu
s (SB
A, 2
016;
U.S
. Cen
sus,
2005
). c.
Dat
a on
agr
icul
tura
l wor
kers cam
e from
the Q
uarter
ly C
ensu
s of E
mpl
oym
ent a
nd W
ages
(U.S
. DO
L, 2
015h
).d.
D
ata on
wor
kers n
ot cov
ered
by
wor
kers' c
ompe
nsat
ion
in T
exas
cam
e from
the Te
xas D
epar
tmen
t of I
nsur
ance
(201
4).
Source: N
atio
nal A
cade
my
of S
ocia
l Ins
uran
ce estim
ates
.

Various federal programs compensate certain cate-gories of workers for disabilities caused on the joband provide benefits to dependents of workers whodie of work-related causes. Each program isdescribed briefly below along with an explanation ofwhether and how it is included in our national totalsof workers’ compensation benefits. Our aim in thisreport is to include in the national totals for workers’compensation those federally administered programsthat are financed by employers and that are not oth-erwise included in workers’ compensation benefitsreported by states, such as the benefits paid underthe Federal Employees’ Compensation Act. Programsthat cover private-sector workers and are financed byfederal general revenues, such as the RadiationExposure Compensation Act, are not included in ournational totals for workers’ compensation benefitsand employer costs. More detail on these programs isgiven below.
Federal Employees The Federal Employees’ Compensation Act of 1916(FECA), which superseded previous workers’ com-pensation laws for federal employees, provided thefirst comprehensive workers’ compensation programfor federal civilian employees. In 2014, total benefitswere $2.9 billion, of which 34 percent were for med-ical care, a three percentage point increase from2013. The share of benefits for medical care is lowerthan in most state programs because federal cashbenefits, particularly for higher-wage workers,replace a larger share of pre-injury wages than moststate programs. Administrative costs of the programwere $154 million in calendar year 2014, or 5.3 per-cent of total benefits (DOL, 2016). Table B1 reportsbenefits and administrative costs for federal civilianemployees under FECA from 2003-2014. Thesebenefits to workers and costs to the federal govern-ment as employer are included in national totals inthis report and are classified with federal programs.
Longshore and Harbor Workers The Longshore and Harbor Workers’ CompensationAct (LHWCA) requires employers to provide work-ers’ compensation protection for longshore, harbor,and other maritime workers. The original programwas enacted in 1927 in response to a U.S. SupremeCourt decision holding that the Constitution pro-
hibits states from extending workers’ compensationcoverage to maritime employees who are injuredwhile working over navigable waters. The LHWCAexcludes coverage of the master or crew of a vessel.However, the Act covers other types of workers whofall outside the jurisdiction of state workers’ compen-sation programs, such as employees working onoverseas military bases, persons working overseas forprivate contractors of the United States, and private-sector employees engaged in offshore drillingenterprises.
The Academy’s data series on benefits and costs ofworkers’ compensation allocate part of the benefitspaid under the LHWCA to the states where thecompanies operate, and part to federal programs.Private employers cover longshore and harbor work-ers by purchasing private insurance or self-insuring.Benefits paid by private carriers under the LWHCAare not identified separately in the information pro-vided by A.M. Best or the state agencies, so thesebenefits and employer costs appear with the statedata. Benefits paid by private employers who self-insure under the LHWCA, and benefits paid fromthe LHWCA special funds, are not reported by thestates or A.M. Best. Consequently, these benefits andemployer costs are included with federal programs inthis report.
Table B2 shows benefits reported to the U.S.Department of Labor by insurers and self-insuredemployers under the LHWCA from 2003-2014. Infiscal year 2015, about 540 self-insured employersand insurance companies reported a total of 27,628lost-time injuries to the federal Office of Workers’Compensation Programs. Total benefits paid underthe LHWCA in 2014 were $1.5 billion, including$962 million paid by private insurance carriers, $429million paid by self-insured employers, $118 millionpaid from the federally administered special fund forsecond injuries and other purposes, and $8.2 millionfor the District of Columbia Workers’Compensation Act Fund. Federal direct administra-tive costs were $14.2 million, or about 1 percent ofbenefits paid (Table B2).
Total benefits under the LHWCA include benefitspaid under the Defense Base Act (DBA). Under theDBA, benefits are paid for injuries or deaths of
60 NATIONAL ACADEMY OF SOCIAL INSURANCE
Appendix B: Federal Programs

employees (of any nationality) workingoverseas for companies under contractwith the U.S. government. These benefitsare also shown separately in Table B2.Total payments rose from about $11.3million in 2003 to $707 million in 2014.The number of DBA death claims peryear rose from single digits prior to 2003to 585 in 2010. The increase reflects, inlarge part, claims and deaths of employeesof companies working under contract forthe U.S. government in the war zones inIraq and Afghanistan. However, the num-ber of DBA death claims has fallen since2011, and was 146 in 2014.
Coal Miners with Black Lung Disease The Black Lung Benefits Act, enacted in1969, provides compensation for coalminers with pneumoconiosis – or blacklung disease – and their survivors. Theprogram has two parts. Part B is financedby federal general revenues and wasadministered by the Social SecurityAdministration until 1997, when admin-istration shifted to the U.S. Departmentof Labor. Part C is paid through the BlackLung Disability Trust Fund, which isfinanced by coal mine operators througha federal excise tax on coal that is minedand sold in the United States. In thisreport, only the Part C benefits that arefinanced by employers are included innational totals of workers’ compensationbenefits and employer costs for 2003–2014. Total benefits in 2014 were $309million, of which $124 million was paidunder Part B and $185 million was paidunder Part C. Part C benefits include $36million for medical care. Medical benefitsare a small share of black lung benefitsbecause many of the recipients of benefitsare deceased coal miners’ dependents,whose medical care is not covered by theprogram. Federal direct administrativecosts were $35.5 million, or about 11.5percent of benefit payments.
Table B3 shows benefits under the blacklung program in 2003 through 2014 for
Workers’ Compensation: Benefits, Coverage, and Costs • 61
Tabl
e B
1Fe
deral E
mploy
ees’ Com
pens
ation Act, B
enefits an
d Cos
ts, 2
003-20
14 (in th
ousand
s)
2003
2004
2005
2006
2007
2008
2009
2010
2011
2012
2013
2014
Tota
l Ben
efits
$2,3
67,7
57$2
,445
,077
$2,4
62,0
59$2
,454
,861
$2,5
86,7
00$2
,676
,370
$2,7
63,8
85$2
,889
,321
$2,9
94,1
22$3
,006
,009
$2,9
48,1
32$2
,940
,811
Com
pens
atio
n Ben
efits
1,69
8,27
31,
749,
397
1,79
1,00
31,
767,
926
1,83
3,95
81,
878,
331
1,90
0,15
61,
976,
439
2,07
7,02
72,
081,
387
2,02
4,56
81,
929,
360
Med
ical B
enef
its66
9,48
469
5,68
067
1,05
668
6,93
575
2,74
279
8,03
986
3,72
991
2,88
291
7,09
592
4,62
292
3,56
41,
011,
450
% M
edical
2828
2728
2930
3132
3131
3134
Dire
ct A
dmin
istra
tive C
osts
130,
672
131,
920
128,
536
137,
386
143,
768
142,
532
146,
015
156,
522
155,
027
157,
649
152,
410
154,
417
Tota
l Cos
ts2,
498,
429
2,57
6,99
72,
590,
595
2,59
2,24
72,
730,
468
2,81
8,90
22,
909,
900
3,04
5,84
33,
149,
149
3,16
3,65
83,
100,
542
3,09
5,22
7
Indi
rect
Adm
inist
rativ
e C
ostsa
4,80
64,
587
5,49
47,
619
6,77
37,
756
7,73
97,
765
8,16
17,
566
7,29
98,
426
a.
Includ
es le
gal a
nd in
vestig
ativ
e su
ppor
t fro
m th
e O
ffice of
the So
licito
r an
d th
e O
ffice
of t
he In
spec
tor G
ener
al.
Source:U
.S. D
epar
tmen
t of L
abor
(201
6).

62 NATIONAL ACADEMY OF SOCIAL INSURANCE
Tabl
e B
2Lon
gsho
re and
Harbo
r W
orke
rs’ C
ompe
nsation Act (LHW
CA), B
enefits, C
osts, a
nd N
umbe
r of D
efen
se B
ase Act
a(D
BA) Dea
th C
laim
s,
2003
-201
4 (in th
ousand
s)
2003
2004
2005
2006
2007
2008
2009
2010
2011
2012
2013
2014
Tota
l Ben
efits
$716
,218
$747
,321
$795
,466
$879
,508
$923
,045
$983
,050
$1,0
81,2
66$1
,134
,759
$1,2
69,9
04$1
,363
,544
$1,4
73,6
76$1
,516
,786
Insu
ranc
e C
arrier
sa26
2,75
327
8,88
732
5,02
736
7,62
545
6,77
350
4,34
855
1,71
658
9,38
771
0,33
080
1,90
292
7,41
796
1,54
2
Self-
Insu
ranc
e Em
ploy
er30
9,84
332
2,52
032
5,69
436
8,74
432
5,54
434
0,33
638
8,08
840
8,53
442
5,58
143
0,85
341
7,77
642
9,30
7
LHW
CA S
pecial F
und
132,
504
135,
073
134,
230
132,
933
130,
673
128,
372
131,
544
127,
415
124,
664
122,
133
120,
100
117,
694
DC
CA S
pecial F
und
11,1
1810
,841
10,5
1510
,206
10,0
559,
994
9,91
89,
423
9,32
88,
656
8,38
38,
243
DBAaBen
efits
11
,338
30,0
7959
,797
115,
758
170,
231
199,
837
242,
530
311,
643
415,
274
540,
283
665,
943
707,
468
Num
ber of
DBA D
eath
Claim
sb56
231
284
338
426
289
341
585
405
280
211
146
Tota
l Ann
ual A
sses
smen
ts13
5,80
014
8,50
014
6,50
013
5,50
013
5,00
013
2,50
013
6,50
013
1,50
013
1,00
013
2,00
013
2,00
012
3,00
0
LHW
CA
125,
000
137,
000
135,
000
125,
000
125,
000
124,
000
125,
000
124,
000
123,
000
124,
000
123,
000
118,
000
DC
CA
10,8
0011
,500
11,5
0010
,500
10,0
008,
500
11,5
007,
500
8,00
08,
000
9,00
05,
000
Adm
inist
rativ
e Exp
ense
s 12
,270
12,5
1012
,568
12,7
1512
,725
12,6
6712
,922
13,3
9413
,461
13,3
3013
,317
14,1
87
Gen
eral R
even
ue10
,297
10,4
9510
,553
10,6
9110
,699
10,6
3310
,855
11,3
5611
,354
11,2
2911
,203
12,0
52
Trus
t Fun
d1,
973
2,01
52,
015
2,02
42,
026
2,03
42,
067
2,03
82,
107
2,10
12,
114
2,13
5
Indi
rect
Adm
inist
rativ
e C
ostsc
2,34
72,
396
2,01
92,
115
2,43
71,
856
2,15
52,
766
1,92
21,
632
1,21
11,
534
a.In
clud
es b
enef
it co
sts f
or cas
es u
nder
the D
efen
se B
ase Act
(DBA) a
nd all
othe
r ex
tens
ions
to th
e LH
WC
A.
b.N
umbe
r of
civ
ilian
ove
rsea
s dea
ths.
c.In
clud
es le
gal a
nd in
vestig
ativ
e su
ppor
t fro
m th
e O
ffice
of t
he S
olicito
r an
d th
e O
ffice
of t
he In
spec
tor G
ener
al. T
hese
are
not
em
ploy
er cos
ts b
ut are
pro
vide
d fo
r th
roug
h ge
nera
l rev
enue
ap-
prop
riat
ions
.
Source:U
.S. D
epar
tmen
t of L
abor
(201
6).

Workers’ Compensation: Benefits, Coverage, and Costs • 63
both parts of the program.48 Its benefits are paiddirectly by the responsible mine operator or insurer,from the federal Black Lung Disability Trust Fund,or from federal general revenue funds. No data areavailable on the experience of employers who self-insure under the black lung program. Any suchbenefits and costs are not reflected in Table B3 andare not included in national estimates.
Energy Employees The Energy Employees Occupational IllnessCompensation Program Act (EEOICPA) provideslump sum payments up to $150,000 to civilianworkers (and/or their survivors) who become ill as aresult of exposure to radiation, beryllium, or silica inthe production or testing of nuclear weapons andother materials. This is Part B of the program, whichwent into effect in July 2001. It provides smallerlump sum payments to individuals previously foundeligible for an award under the Radiation ExposureCompensation Act. Medical benefits are awarded forthe treatment of covered conditions. Total benefits in2014 were $737 million, of which $354 millionwere paid as compensation benefits (DOL, 2016).The EEOICPA originally included a Part D programthat required the Department of Energy (DOE) toestablish a system for contractor employees and eligi-ble survivors to seek DOE assistance in obtainingstate workers’ compensation benefits for work-relatedexposure to toxic substances at a DOE facility. InOctober 2004, Congress abolished Part D, creating anew Part E program to be administered by theDepartment of Labor. Part E provides benefit pay-ments up to $250,000 for DOE contractoremployees, eligible survivors of such employees, anduranium miners, millers, and ore transporters. Wageloss, medical, and survivor benefits are also providedunder certain conditions. Total Part E benefits in2014 were $303 million. Benefits under both Part Band Part E are financed by general revenues and arenot included in our national totals. Table B4 pro-vides information on both Part B and Part E of theEEOICPA, as amended.
Workers Exposed to Radiation The Radiation Exposure Compensation Act of 1990provides lump sum compensation payments to indi-viduals who contracted certain cancers and otherserious diseases as a result of exposure to radiationreleased during above ground nuclear weapons testsor during employment in underground uraniummines. The lump sum payments are specified in lawand range from $50,000 to $100,000. From thebeginning of the program through December 2014,29,846 claims were paid for a total of $1.97 billion,or roughly $66,005 per claim (DOJ, 2015). Theprogram is financed with federal general revenuesand is not included in national totals in this report.Table B5 shows cumulative payments under theRadiation Exposure Compensation Act since itsenactment in 1990.
Veterans of Military Service U.S. military personnel are covered by the federalveterans’ compensation program of the Departmentof Veterans Affairs, which provides cash benefits toveterans who sustained total or partial disabilitieswhile on active duty. In fiscal year 2014, 3.9 millionveterans were receiving monthly compensation pay-ments for service-connected disabilities. Of these, 43percent of the veterans had a disability rating of 30percent or less, while the others had higher rated dis-abilities. Total monthly payments for disabledveterans and their dependents were $4.5 billion in2014, or about $54.2 billion on an annual basis (VA,2015). Veterans’ compensation is not included inour national estimates of workers’ compensation.Table B6 provides information on the veterans’ com-pensation program. This program is somewhatsimilar to workers’ compensation in that it isfinanced by the employer (the federal government)and compensates for injuries or illness caused on thejob (the armed forces). It is different from otherworkers’ compensation programs in many respects.With cash benefits of about $54.2 billion in 2014,veterans’ compensation is about 175 percent of thesize of total cash benefits in other workers’ compen-sation programs, which were $30.9 billion in 2014.
48 The Patient Protection and Affordable Care Act (PPACA) of 2010 amended the Black Lung Benefits Act, 30 U.S.C. 901-44, to re-instate two methods of establishing entitlement that were repealed with respect to claims filed after 1981. Specifically, PPACA rein-stated 30 U.S.C. 921(c)(4)(presumption of total disability or death due to pneumoconiosis arising out of coal mine employmentwhere the miner had 15 years of coal mine employment and proof of total disability) and 30 U.S.C. 932(l) (automatic entitlementto benefits for eligible survivors of miners who were awarded benefits based on lifetime claims). The newly amended statutory provi-sions apply to claims filed after January 1, 2005. The Department anticipates proposing rules that define the class of claims affectedby the amendments and set the criteria for establishing entitlement to benefits under the amendments.

64 NATIONAL ACADEMY OF SOCIAL INSURANCE
Tabl
e B
3Black
Lun
g Ben
efits Act, B
enefits an
d Cos
ts, 2
003-20
14(in th
ousand
s)
2003
2004
2005
2006
2007
2008
2009
2010
2011
2012
2013
2014
Tota
l Ben
efits
$775
,098
$719
,065
$665
,844
$616
,039
$569
,300
$524
,645
$481
,172
$445
,488
$406
,514
$368
,661
$337
,282
$309
,048
Part C
Com
pens
atio
n30
3,72
428
9,69
927
6,41
326
2,02
624
8,37
523
1,26
121
7,68
520
4,87
318
9,36
317
6,88
616
2,41
014
8,92
6
Part C
Med
ical B
enef
its59
,739
52,9
9249
,244
41,5
5238
,545
37,4
9231
,485
32,4
9233
,935
30,9
8234
,213
36,2
24
Part B
Com
pens
atio
n41
1,63
537
6,37
434
0,18
731
2,46
128
2,38
025
5,89
223
2,00
220
8,12
318
3,21
616
0,79
314
0,65
912
3,89
8
Tota
l Dire
ct A
dmin
istrat
ive C
osts
37,3
9338
,057
37,9
1738
,453
38,7
4938
,009
37,5
0237
,292
36,8
1837
,902
36,0
0035
,546
Part C
(DO
L)31
,991
32,1
5732
,724
33,1
8233
,374
32,6
4832
,411
32,3
6331
,695
32,4
8631
,085
30,7
13
Part B
(SSA
)5,
402
5,90
05,
193
5,27
15,
375
5,36
15,
091
4,92
95,
123
5,41
64,
915
4,83
3
Trus
t Fun
d Adv
ance
s fro
m
U.S
. Tre
asur
ya52
5,00
049
7,00
044
6,00
044
5,00
042
6,00
042
6,00
00
60,0
0010
7,74
921
4,00
040
1,00
049
6,00
0
Bon
d Pa
ymen
tsb
**
**
**
341,
939
364,
757
400,
905
431,
486
452,
439
472,
849
Inte
rest P
aym
ents o
n
Past A
dvan
cesc
620,
582
650,
579
674,
894
694,
964
717,
214
739,
469
00
60,1
6010
7,86
421
4,37
240
1,39
3
Coa
l Tax
Rev
enue
s Rec
eive
d by
the Black
Lun
g Tr
ust F
und
480,
080
577,
575
620,
420
598,
520
650,
432
646,
800
652,
935
588,
743
631,
002
636,
536
512,
866
574,
403
Indi
rect
Adm
inist
rativ
e C
ostsd
23,4
5923
,914
24,4
2425
,242
26,0
2025
,473
25,5
2825
,979
26,1
9125
,767
24,6
6125
,489
*In
form
atio
n no
t ava
ilabl
e
a.
Adv
ance
of f
unds
requ
ired
whe
n Tr
ust F
und
expe
nses
exc
eed
tax
reve
nues
rece
ived
in a g
iven
yea
r. U
nder
the Em
erge
ncy
Eco
nom
ic S
tabi
lizat
ion
Act
of 2
008
(EESA
), to
tal T
rust F
und
debt
(cum
ulat
ive ad
vanc
es) a
t the
end
of 2
008
was
con
verted
to zer
o co
upon
bon
ds th
at are
repa
yabl
e to
the U
.S. T
reas
ury
on an
annu
al b
asis.
b. Rep
aym
ent o
f bon
d pr
incipa
l and
inte
rest o
n pr
incipa
l deb
t as r
equi
red
by th
e Tr
ust F
und
debt
restru
ctur
ing
portio
n of
the EESA
.
c.
1997
-200
8 ar
e in
tere
st p
aym
ents o
n cu
mul
ativ
e de
bt fr
om p
ast T
rust F
und
borrow
ing
from
the U
.S. T
reas
ury. B
egin
ning
in 2
011,
the am
ount
show
n is th
e re
paym
ent o
f one
-yea
r ob
liga-
tions
of t
he T
rust F
und,
whi
ch in
clud
e th
e pr
evio
us y
ear's
adv
ance
s fro
m th
e U
.S. T
reas
ury
and
appl
icab
le in
tere
st d
ue o
n th
ose ad
vanc
es, a
s req
uire
d un
der th
e EESA
.
d. In
clud
es le
gal a
nd in
vestig
ativ
e su
ppor
t fro
m th
e O
ffice of
the So
licito
r an
d th
e O
ffice
of t
he In
spec
tor G
ener
al, s
ervi
ces p
rovi
ded
by th
e D
epar
tmen
t of t
he T
reas
ury, and
cos
ts fo
r th
e O
ffice
of A
dmin
istrat
ive La
w Ju
dges
(OALJ
) and
the Ben
efits
Rev
iew
Boa
rd (B
RB).
OALJ
and
BRB cos
ts are
not
includ
ed fo
r an
y ot
her pr
ogra
m b
ut can
not b
e se
para
tely
iden
tified
for C
oal
Min
e W
orke
rs' C
ompe
nsat
ion.
Source: U
.S. D
epar
tmen
t of L
abor
(201
6).

Workers’ Compensation: Benefits, Coverage, and Costs • 65
Tabl
e B
4Ene
rgy Employ
ees Occup
ationa
l Illn
ess Com
pens
ation Pr
ogram A
ct, P
art B
and
Part E
Ben
efits an
d Cos
ts, 2
003-20
14
(in th
ousand
s)
2003
2004
2005
2006
2007
2008
2009
2010
20
1120
1220
1320
14
Tota
l Ben
efits
Par
t B$3
03,9
81$2
75,7
27$3
92,5
03$5
02,6
36$5
61,8
24$6
05,3
38$4
71,6
39$8
03,4
56$7
84,2
78$8
68,2
48$8
50,1
26$7
37,1
87
Com
pens
atio
n Ben
efits
288,
274
250,
123
358,
751
460,
494
490,
089
517,
383
337,
642
576,
364
474,
213
538,
517
496,
868
354,
103
Med
ical B
enef
itsa
15,7
0725
,604
33,7
5242
,142
71,7
3587
,955
133,
997
227,
092
310,
065
329,
731
353,
258
383,
084
Dire
ct A
dmin
istra
tive C
ostsb
65,9
4194
,158
106,
818
104,
872
107,
417
92,0
7551
,377
53,1
0251
,228
49,5
7749
,555
51,9
37
Tota
l Ben
efits
Par
t Ec
n/a
n/a
268,
635
270,
598
409,
100
468,
982
395,
680
383,
760
348,
431
331,
089
351,
842
302,
672
Com
pens
atio
n Ben
efits
n/a
n/a
268,
586
269,
558
407,
277
465,
742
390,
077
370,
351
319,
032
296,
019
306,
604
260,
168
Med
ical B
enef
itsd
n/a
n/a
491,
040
1,82
33,
240
5,60
313
,409
29,3
9935
,071
45,2
3742
,504
Dire
ct A
dmin
istra
tive C
ostsb
n/a
n/a
39,2
9555
,088
61,6
7159
,152
68,1
4674
,622
74,1
8972
,259
68,5
2366
,752
a.
Med
ical p
aym
ents m
ade fo
r clai
man
ts elig
ible u
nder
Par
t B o
nly
and
clai
man
ts elig
ible u
nder
bot
h Pa
rt B
and
Par
t E.
b. Pa
rt B
cos
ts fo
r 20
02-0
8 in
clud
e fu
ndin
g fo
r th
e D
epar
tmen
t of H
ealth
and
Hum
an S
ervi
ces/N
atio
nal I
nstit
ute fo
r O
ccup
atio
nal S
afet
y an
d H
ealth
's (D
HH
S/N
IOSH
) con
-du
ct o
f dos
e re
cons
truc
tions
and
spec
ial e
xpos
ure co
hort d
eter
min
atio
ns. F
or 2
002,
thes
e co
sts w
ere $3
2.7
mill
ion;
200
3, $
26.8
mill
ion;
200
4, $
51.7
mill
ion;
200
5, $
50.5
mil-
lion;
200
6, $
58.6
mill
ion;
200
7, $
55.0
mill
ion;
and
200
8, $
41.5
mill
ion.
Beg
inni
ng in
200
9, th
ese co
sts a
re a d
irect
app
ropr
iatio
n to
DH
HS/
NIO
SH. P
art B
cos
ts fo
r20
09-1
4 in
clud
e fu
ndin
g fo
r an
om
buds
man
pos
ition
. For
200
9, th
ese co
sts w
ere $0
.1 m
illio
n; 2
010,
$0.
4 m
illio
n; 2
011,
$0.
2 m
illio
n; 2
012,
$0.
3 m
illio
n; 2
013,
$0.
4 m
illio
n;an
d 20
14, $
0.6
mill
ion.
Par
t E cos
ts fo
r 20
05-1
4 also
includ
e fu
ndin
g fo
r an
om
buds
man
pos
ition
. For
200
5 th
ese co
sts w
ere $0
.3 m
illio
n; 2
006,
$0.
6 m
illio
n; 2
007,
$0.
8 m
il-lio
n; 2
008,
$0.
8 m
illio
n; 2
009,
$0.
7 m
illio
n; 2
010,
$0.
6 m
illio
n; 2
011,
$0.
8 m
illio
n; 2
012,
$0.
8 m
illio
n; 2
013,
$0.
8 m
illio
n; and
201
4, $
0.8
mill
ion.
c.
The
Ene
rgy
Part E
ben
efit
prog
ram
was
estab
lishe
d in
Oct
ober
200
4.
d. M
edical p
aym
ents m
ade fo
r clai
man
ts elig
ible u
nder
Par
t E o
nly.
Source: U
.S. D
epar
tmen
t of L
abor
(201
6).
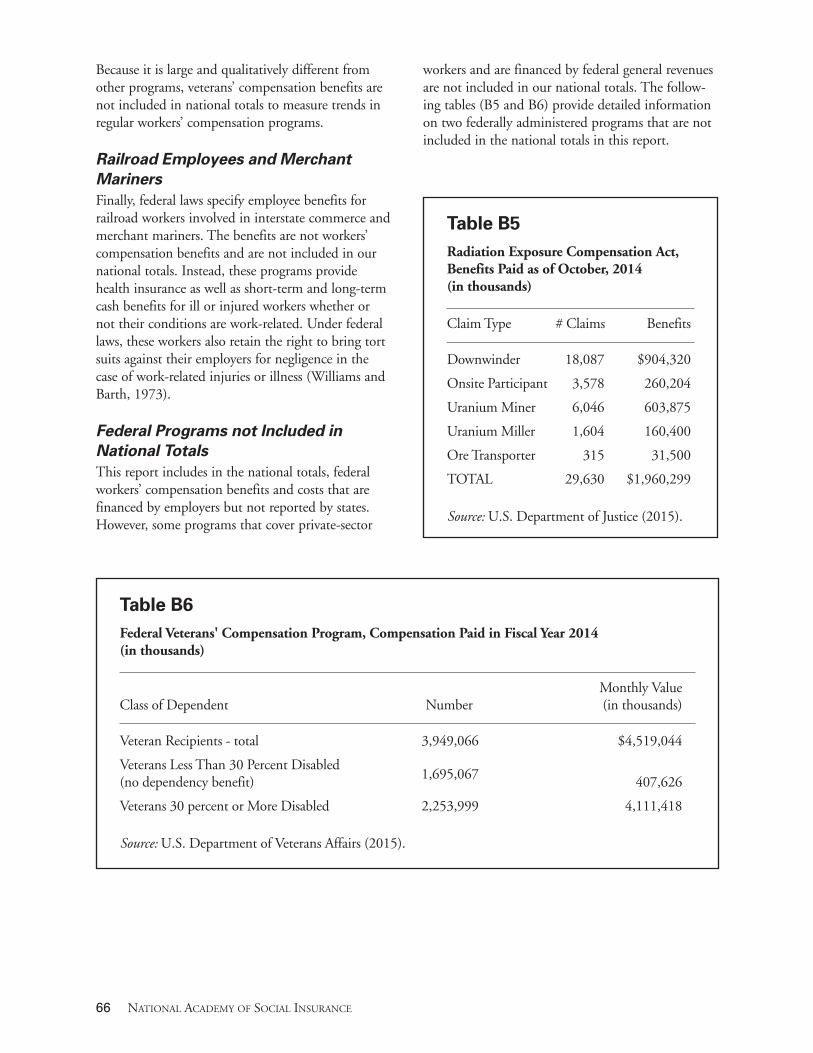
Because it is large and qualitatively different fromother programs, veterans’ compensation benefits arenot included in national totals to measure trends inregular workers’ compensation programs.
Railroad Employees and MerchantMariners Finally, federal laws specify employee benefits forrailroad workers involved in interstate commerce andmerchant mariners. The benefits are not workers’compensation benefits and are not included in ournational totals. Instead, these programs providehealth insurance as well as short-term and long-termcash benefits for ill or injured workers whether ornot their conditions are work-related. Under federallaws, these workers also retain the right to bring tortsuits against their employers for negligence in thecase of work-related injuries or illness (Williams andBarth, 1973).
Federal Programs not Included in National TotalsThis report includes in the national totals, federalworkers’ compensation benefits and costs that arefinanced by employers but not reported by states.However, some programs that cover private-sector
workers and are financed by federal general revenuesare not included in our national totals. The follow-ing tables (B5 and B6) provide detailed informationon two federally administered programs that are notincluded in the national totals in this report.
66 NATIONAL ACADEMY OF SOCIAL INSURANCE
Table B5Radiation Exposure Compensation Act,Benefits Paid as of October, 2014(in thousands)
Claim Type # Claims Benefits
Downwinder 18,087 $904,320
Onsite Participant 3,578 260,204
Uranium Miner 6,046 603,875
Uranium Miller 1,604 160,400
Ore Transporter 315 31,500
TOTAL 29,630 $1,960,299
Source: U.S. Department of Justice (2015).
Table B6Federal Veterans' Compensation Program, Compensation Paid in Fiscal Year 2014(in thousands)
Monthly ValueClass of Dependent Number (in thousands)
Veteran Recipients - total 3,949,066 $4,519,044
Veterans Less Than 30 Percent Disabled (no dependency benefit) 1,695,067 407,626
Veterans 30 percent or More Disabled 2,253,999 4,111,418
Source: U.S. Department of Veterans Affairs (2015).

Workers’ Compensation: Benefits, Coverage, and Costs • 67
Table C identifies the parameters that determineworkers’ compensation benefits under the currentlaws (as of January 2016) in each jurisdiction. Thetable is adapted from the IAIABC (InternationalAssociation of Industrial Accident Boards andCommissions) and WCRI (Workers CompensationResearch Institute) joint publication of Workers’Compensation Laws (IAIABC-WCRI 2016).
The benefit parameters defined in Table C include:
n The waiting period before a worker becomes eligible for cash benefits.
n The retroactive period when a worker becomeseligible for compensation for the waitingperiod.
n The minimum and maximum weekly benefitpayments for temporary total disability.
n The maximum duration of temporary total disability benefits.
n The maximum weekly benefit and benefit limitations for permanent partial disability.
n The maximum weekly benefit and benefit limitations for permanent total disability.
n The maximum weekly benefit and benefit limitations for death benefits.
The acronyms used in Table C include:
PIWW Pre-injury Weekly wage
AWW Average weekly wage
NWW Net weekly wage
SAWW State-wide average weekly wage
SAMW State-wide average monthly wage
AMW Average Monthly wage
TTD Temporary Total Disability
PTD Permanent Total Disability
PPD Permanent Partial Disability
MMI Maximum Medical Improvement
Appendix C: Workers’ Compensation under State Laws

68 NATIONAL ACADEMY OF SOCIAL INSURANCE
Tabl
e C
Worke
rs' C
ompe
nsation State La
ws as of J
anua
ry 201
6
Limit to
M
ax B
enefit fo
r Statutor
yRetro-
Min
Max
Max
Basis of
Max
Max
Mon
etary
Max
"Uns
ched
uled
Max
Limit fo
rW
aiting
active
Weekly
Weekly
Dur
ation
PTD
Weekly
Dur
ation
PTD
Weekly
Injuries"
Weekly
Dep
ende
ncy
State
Period
Period
Ben
efit
Ben
efit
(Weeks
)Calcu
lation
Ben
efit
(Weeks
)Ben
efits
Ben
efit
(Weeks
)Ben
efit
Ben
efits
Alabama
3 days
21 days
$224.00
$813.00
Duration of
66 2/3% PIWW
$813.00
NoNo
$220.00
300
$813.00
500 weeks
TTD disability
Alaska
3 days
28 days
$266.00
$1,211.00
Continue until
80% of the workers’
$1,211.00
If found to no
Up to the
Paid in lump
No$1,211.00
12 years
employee is
spendable
longer be
maximum
sum amount
unscheduled
medically stable
after tax
permanently and
TTD weekly
unless the
PPD
or released
or NWW
totally disabled
rate. Benefits
claimant is in
to work
continue
a reemployment
until no
training pro-
longer PTD
gram, in which
or death
case PPI
benefits can
be paid at the
weekly TTD
rates: TTD min
($251) and TTD
max ($1,143)
Arizona
7 consecutive
14 days
n/a
$679.51
Duration of
66 2/3% AMW
$679.51
NoNo
$766.60for
Payable for life
$679.51
None
calendar
TTD disability
scheduled
unless rearranged
days
injuries; for
by Industrial
unscheduled
Commission
injuries, n/a
Arkansas
7 days
14 days
$20.00
$646.00
450
66 2/3% PIWW
$646.00
Benefits are for
There is a
$485.00
450 maximum
$646.00
Remarriage of
the length of
limitation
for all disabilitya
spouse, attain-
disability and may
of the weekly
ment of age 18
be paid for life
amount but
of dependent
not on the total
child or 25 if
amount
full-time student;
450-week lim
it for partial
dependentsb
California
3 days
14 days
$ 169.26
$1,128.43
104c
2/3 of AWW,
$1,128.43
Lifetime
No$290.00
not applicable
$1,128.43
There is a
subject to minimum/
maximum
maximum rates
amount paid
per Labor Code
4702 but that
amount can be
higher based
on Labor Code
4703.5
Dea
th B
enefits
Perm
anen
t Partial D
isab
ility
Perm
anen
t Total D
isab
ility
Tempo
rary Total D
isab
ility
Waiting
Periodr

Workers’ Compensation: Benefits, Coverage, and Costs • 69
Colorado
3 scheduled
14 calen-
none
$875.42
Duration of
66 2/3%
$875.42
Benefits are for
None
$275.10is
400d
$875.42
None
days
dar
TTD
PIWW
the length of
set weekly rate
days
disability
disability
for all schedul-
and may be
ed injuries;
paid for life
$875.42weekly
is maximum for
calculating
unscheduled
injuries
Connecticut
3 days
7 days
$236.80
$1,184.00
Duration of
75% of spendable
$1256.00
None
None
$991.00
780 however no
$1,256.00
None
TTD disability
earnings
unscheduled PPD
since 1993
Delaw
are
3 days
7 calendar
$226.54
$679.63
unlimited
66 2/3% of the
$679.63
NoNo
$679.63
300
$679.63
When spouse
days
difference between the
remarries or if
wages received by
minor depen-
the injured before the
dents reach 18
injury and the earning
years of age or
power of the
25 if attending
employee thereafter
accredited
higher learning
institution
District of
3 days
14 days
$ 360.20
$1,441.80
500 weeks for all
66 2/3% PIWW
$1,441.80
500 weeks for all
The first
$1,441.80
500 week lim
it$1,441.80
None
Colum
biadisability benefits
disability benefits
$75,000 in
for all disability
with ability
with ability to
benefits for
and worker may
to petition for
petition for an
death or PTD
petition for an
an additional
additional 167
shall be paid
additional 167
167 weeks
weeks
by the employ-
weeks
er/insurer.
Amounts over
$75,000 are
paid from death
and PTD
Trust Fund
Florida
7 days
22 days
$20 unless
$ 863.00
104
66 2/3% PIWW
$863.00
Benefits are pay-
No$863.00
2 weeks for each
$863.00
Maximum
wages are
able to age 75. If the
% of im
pairment
payable is
less than
injury occurred after
from 1-10%;
$150,000
$20, then full
age 70, benefits
3 weeks from
wages
are payable during
11-15%; 4 weeks
continuance of
from 16-20%;
PTD not to exceed
and 6 weeks for
5 years following
each rating over
determination of
21%
PTD
Georgia
7 days
21 days
$50.00
$550.00
400 weeks un-
not applicable
not applicable
not applicable
not
$550.00
300
$550.00
$220,000 for
less catastrophic
applicable
surviving
injury
spouse with no
dependents
Hawaii
3 days
None
$203.00
$812.00
Duration of
66 2/3% PIWW
$812.00
NoNo
$812.00
312
$812.00
312 weeks
TTD disability
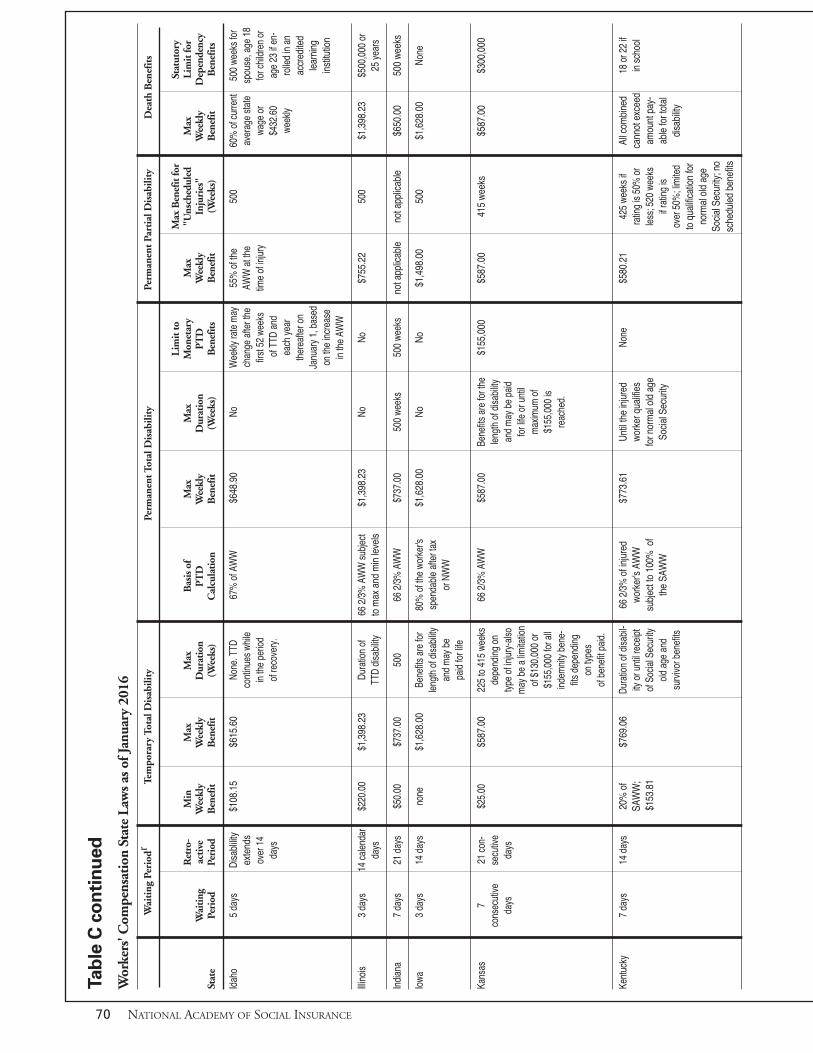
70 NATIONAL ACADEMY OF SOCIAL INSURANCE
Tabl
e C
con
tinu
edWorke
rs' C
ompe
nsation State La
ws as of J
anua
ry 201
6
Limit to
M
ax B
enefit fo
r Statutor
yRetro-
Min
Max
Max
Basis of
Max
Max
Mon
etary
Max
"Uns
ched
uled
Max
Limit fo
rW
aiting
active
Weekly
Weekly
Dur
ation
PTD
Weekly
Dur
ation
PTD
Weekly
Injuries"
Weekly
Dep
ende
ncy
State
Period
Period
Ben
efit
Ben
efit
(Weeks
)Calcu
lation
Ben
efit
(Weeks
)Ben
efits
Ben
efit
(Weeks
)Ben
efit
Ben
efits
Idaho
5 days
Disablility
$108.15
$615.60
None. TTD
67% of AWW
$648.90
NoWeekly rate may
55% of the
500
60% of current
500 weeks for
extends
continues while
change after the
AWW at the
average state
spouse, age 18
over 14
in the period
first 52 weeks
time of injury
wage or
for children or
days
of recovery.
of TTD and
$432.60
age 23 if en-
each year
weekly
rolled in an
thereafter on
accredited
January 1, based
learning
on the increase
institution
in the AW
W
Illinois
3 days
14 calendar
$220.00
$1,398.23
Duration of
66 2/3% AWW subject
$1,398.23
NoNo
$755.22
500
$1,398.23
$500,000 or
days
TTD disability
to max and min levels
25 years
Indiana
7 days
21 days
$50.00
$737.00
500
66 2/3% AWW
$737.00
500 weeks
500 weeks
not applicable
not applicable
$650.00
500 weeks
Iowa
3 days
14 days
none
$1,628.00
Benefits are for
80% of the worker's
$1,628.00
NoNo
$1,498.00
500
$1,628.00
None
length of disability
spendable after tax
and may be
or NWW
paid for life
Kansas
7 21 con-
$25.00
$587.00
225 to 415 weeks
66 2/3% AWW
$587.00
Benefits are for the
$155,000
$587.00
415 weeks
$587.00
$300,000
consecutive
secutive
depending on
length of disability
days
days
type of injury-also
and may be paid
may be a limitation
for life or until
of $130,000 or
maximum of
$155,000 for all
$155,000 is
indemnity bene-
reached.
fits depending
on types
of benefit paid.
Kentucky
7 days
14 days
20% of
$769.06
Duration of disabil-
66 2/3% of injured
$773.61
Until the injured
None
$580.21
425 weeks if
All combined
18 or 22 if
SAWW;
ity or until receipt
worker's AW
Wworker qualifies
rating is 50% or
cannot exceed
in school
$153.81
of Social Security
subject to 100% of
for normal old age
less; 520 weeks
amount pay-
old age and
the SAWW
Social Security
if rating is
able for total
survivor benefits
over 50%; limited
disability
to qualification for
normal old age
Social Security; no
scheduled benefits
Dea
th B
enefits
Perm
anen
t Partial D
isab
ility
Perm
anen
t Total D
isab
ility
Tempo
rary Total D
isab
ility
Waiting
Periodr
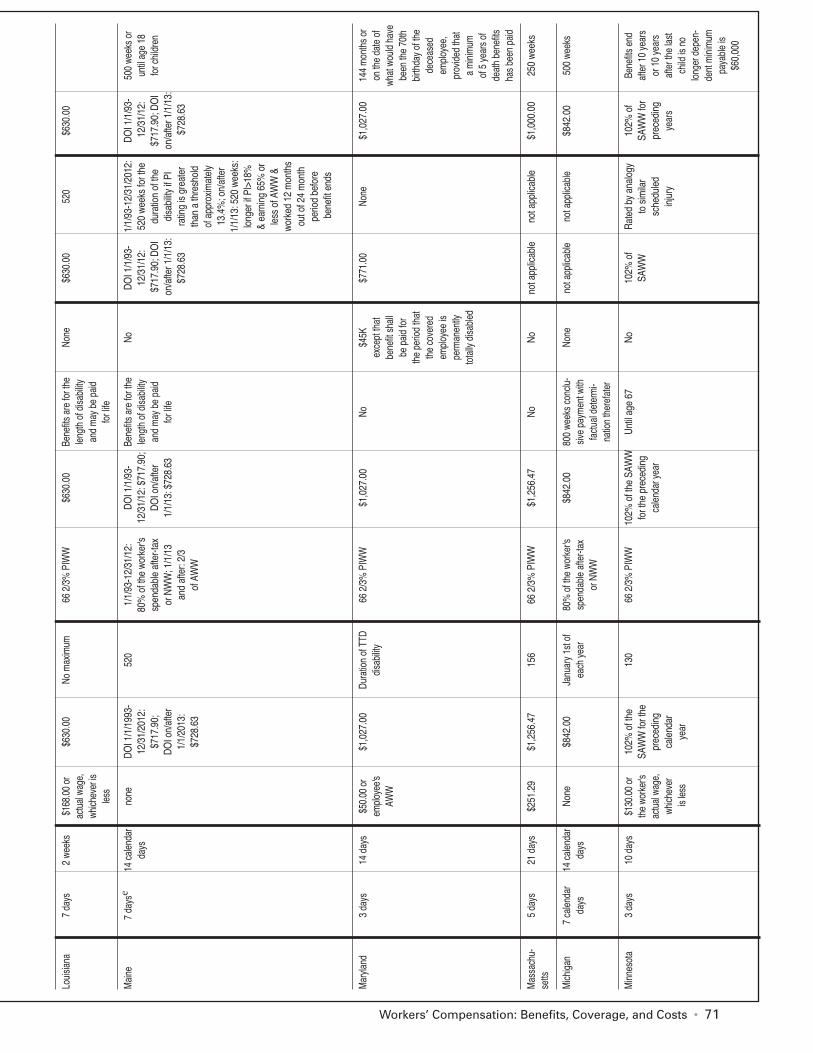
Workers’ Compensation: Benefits, Coverage, and Costs • 71
Louisiana
7 days
2 weeks
$168.00 or
$630.00
No maximum
66 2/3% PIWW
$630.00
Benefits are for the
None
$630.00
520
$630.00
actual wage,
length of disability
whichever is
and may be paid
less
for life
Maine
7 days
e14 calendar
none
DOI 1/1/1993-
520
1/1/93-12/31/12:
DOI 1/1/93-
Benefits are for the
NoDO
I 1/1/93-
1/1/93-12/31/2012:
DOI 1/1/93-
500 weeks or
days
12/31/2012:
80% of the worker's
12/31/12: $717.90; length of disability
12/31/12:
520 weeks for the
12/31/12:
until age 18
$717.90;
spendable after-tax
DOI on/after
and may be paid
$717.90; DOI
duration of the
$717.90; DOI
for children
DOI on/after
or NWW; 1/1/13
1/1/13: $728.63
for life
on/after 1/1/13:
disability if PI
on/after 1/1/13:
1/1/2013:
and after: 2/3
$728.63
rating is greater
$728.63
$728.63
of AWW
than a threshold
of approxim
ately
13.4%; on/after
1/1/13: 520 weeks:
longer if PI>18%
& earning 65% or
less of AWW &
worked 12 months
out of 24 month
period before
benefit ends
Maryland
3 days
14 days
$50.00 or
$1,027.00
Duration of TTD
66 2/3% PIWW
$1,027.00
No$45K
$771.00
None
$1,027.00
144 months or
employee's
disability
except that
on the date of
AWW
benefit shall
what would have
be paid for
been the 70th
the period that
birthday of the
the covered
deceased
employee is
employee,
permanently
provided that
totally disabled
a minimum
of 5 years of
death benefits
has been paid
Massachu-
5 days
21 days
$251.29
$1,256.47
156
66 2/3% PIWW
$1,256.47
NoNo
not applicable
not applicable
$1,000.00
250 weeks
setts
Michigan
7 calendar
14 calendar
None
$842.00
January 1st of
80% of the worker's
$842.00
800 weeks conclu-
None
not applicable
not applicable
$842.00
500 weeks
days
days
each year
spendable after-tax
sive payment with
or NWW
factual determi-
nation therefater
Minnesota
3 days
10 days
$130.00 or
102% of the
130
66 2/3% PIWW
102% of the SAW
WUntil age 67
No102% of
Rated by analogy
102% of
Benefits end
the worker's
SAWW for the
for the preceding
SAWW
to similar
SAWW for
after 10 years
actual wage,
preceding
calendar year
scheduled
preceding
or 10 years
whichever
calendar
injury
years
after the last
is less
year
child is no
longer depen-
dent minimum
payable is
$60,000

72 NATIONAL ACADEMY OF SOCIAL INSURANCE
Tabl
e C
con
tinu
edWorke
rs' C
ompe
nsation State La
ws as of J
anua
ry 201
6
Limit to
M
ax B
enefit fo
r Statutor
yRetro-
Min
Max
Max
Basis of
Max
Max
Mon
etary
Max
"Uns
ched
uled
Max
Limit fo
rW
aiting
active
Weekly
Weekly
Dur
ation
PTD
Weekly
Dur
ation
PTD
Weekly
Injuries"
Weekly
Dep
ende
ncy
State
Period
Period
Ben
efit
Ben
efit
(Weeks
)Calcu
lation
Ben
efit
(Weeks
)Ben
efits
Ben
efit
(Weeks
)Ben
efit
Ben
efits
Mississippi
5 days
f14 days
$25.00
$468.63
450
66 2/3% x AW
W$468.63
450 weeks or until
$210,883.50
$468.63
450
$468.63
450 weeks;
total compensation
remarriage
paid equals
for spouse;
$210,883.50
age 18-23 for
child
Missouri
3 days in
14 days
$40.00
$886.92
400
66 2/3% PIWW
$886.92
NoNone
$464.58
400
$886.92
g
which the em-
not to exceed
ployer is open
105% of the SAW
Wfor business
Montana
32 hours or 4
21 daysh
None
$733.00
Duration of TTD
66 2/3% PIWW
May not exceed
Payable
None
$366.50
400
May not exceed
500 weeksor
days, which-
disability
state’s AW
W at
until retirement
state’s AW
W at
until the spouse
ever is less
time of injury
time of injury
remarries
Nebraska
7 days
6 weeks
$49 or actual
$ 785.00
Duration of TTD
66 2/3% PIWW
$785.00
Payable for the
None
$785.00
300
$785.00
None
wage, if less
disability
length of disability
and may be for life
Nevada
5 days
5 consecu-
None
$831.88
Duration of TTD
66 2/3% pre-injury
$831.88
NoPer maximum
$831.88
PPD benefits
$831.88
None
tive days
disability
AMW
compensation
paid for 5 years or
or 5 cumu-
limit and
to age 70, which-
lative days
formula
ever is later
within a 20
day period
New
3 days
14 days
$293.70
$1,468.50
Duration of Total
60 % PIWW
$1,468.50
Payable for the
None
$1,468.50
350 weeks for a
$1,468.50
18 or 25 if a
Hampshire
disability
length of disability
whole person
full-time
and may be for life
award
student
New Jersey
7 days
7 calen-
$232.00
$871.00
400
70% of actual
$871.00
Payable for the
None
$871.00
600
$871.00
Lifetime
dar
wage at the time
length of disability
with
days
of injury
and may be for life
exceptions
New
7 days
4 weeks
$36.00
$785.03
700
66 2/3% PIWW
$785.03
Payable for the
None
$785.03
500 weeks if the
66 2/3% of
100% of the
Mexico
length of disability
rating is less than
AWW divide
SAWW for
and may be for life
80%, 700 weeks if
as stated in
700 weeks
rating is greater
Statute 52-1-46
New York
7 days
More than
$150, unless
$844.29
Duration of TTD
66 2/3% PIWW
$844.29
No. Benefits are
None
$844.29
$443,252.25.
$844.29
i
14 days
claimant's
disability
payable for the
Calculated by
wages less
length of disability
mulltiplying 525
than $150,
which is almost
(max weeks) by
then claim
ant
always for life of
max weekly rate
receives
the claimant
$803.21
full wages
Dea
th B
enefits
Perm
anen
t Partial D
isab
ility
Perm
anen
t Total D
isab
ility
Tempo
rary Total D
isab
ility
Waiting
Periodr

Workers’ Compensation: Benefits, Coverage, and Costs • 73
North
7 days
21 days
$30.00
$944.00
Benefit lim
its have
66 2/3% PIWW
$944.00
Benefit lim
its have
Benefit lim
its$944.00 for
$20,000.00
$944.00
500 weeksj
Carolina
been changed
been changed
have been
scheduled
to 500 weeks
to 500 weeks and changed to 500
injuries
and can be
can be extended
weeks and can
extended by
by Commission if
be extended by
Commission
employee has
Commission if
if employee has
sustained a total
employee has
sustained a total
loss of wage-
sustained a total
loss of wage-
earning capacity
loss of wage-
earning capacity
earning capacity
North
5 days
5 days
$585.00 or
$1,219.00
104 weeks. An
66 2/3% PIWW
$1,219.00
Payable until
Nonot
100%
$1,219.00
$300,000
Dakota
60% of the
additional
retirement at which
applicable
impairment
or death
SAWW unless
20 weeks
time benefits may
based on lump
the amount
may be added if
switch to ABP,
sum payment
exceeds the
the employee is
except in cases
employer’s
enrolled in a
of catastrophic
net wages, in
vocational
injuryk
which case
rehabilitation
the employee
program.
receives net
wages as a
weekly com-
pensation
rate.
Ohio
7 days
14 calen-
$287.33.
$862.00. If 72%
As long as
66 2/3%PIWWl
$862.00
NoNo
$287.33
200
$862.00
None
dar
However if
of the FW
W or
disability lasts
days
AWW is be-
66 2/3% of the
low minimum,
AWW is above
the TDD is
the maximum,
100% of
TTD is paid at
the AW
Wthe maximum
amount.
Oklahoma
3 days
None
None
$589.33
104 weeks, with
70% PIWW
$841.90
15 years or upon
No$323.00
350
$841.90
None
an additional 52
reaching Social
weeks if conse-
Security retirement
quential injury
age, whichever
found
is longer
Oregon
3 days
14 days
Not less than
$1,226.78
n/a
66 2/3% PIWW
$922.39. In
Lifetime plus
N/A
not applicable
$353,543.14
$1229.82m
None
$50 or 90%
but cannot exceed
addition, if the
benefits to
of the work-
the state AW
Wworkers’ wages
surviving
er's AW
W;
plus PTD may not
spouse
whichever is
exceed the workers’
and children
less
wage at injury
Pennsylvania
7 days
14 calen-
50% of
$978.00
Duration of TTD
not applicable o
not applicable
not applicable
not applicable
$978.00
500 weeks
$978.00
n/a
dar
statewide
disability subject
days
AWW or 90%
to conversion
of worker's
to partial
AWW, which-
benefits at
ever is lower.
104 weeksn
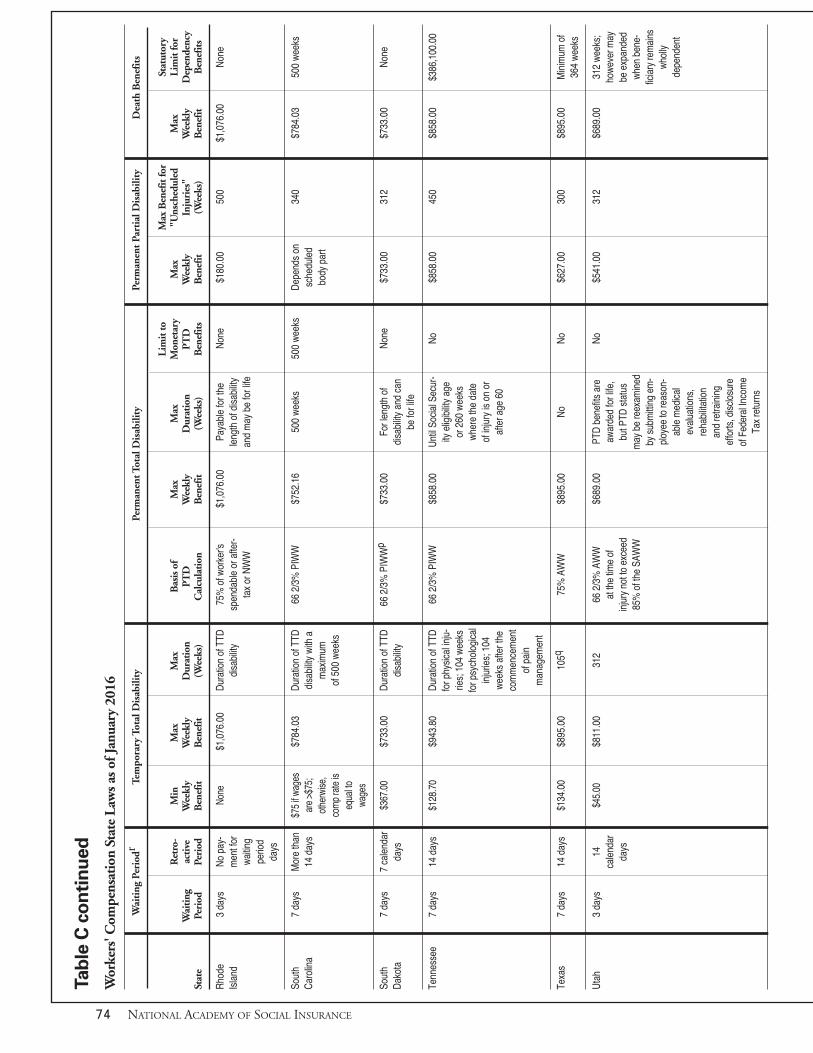
74 NATIONAL ACADEMY OF SOCIAL INSURANCE
Tabl
e C
con
tinu
edWorke
rs' C
ompe
nsation State La
ws as of J
anua
ry 201
6
Limit to
M
ax B
enefit fo
r Statutor
yRetro-
Min
Max
Max
Basis of
Max
Max
Mon
etary
Max
"Uns
ched
uled
Max
Limit fo
rW
aiting
active
Weekly
Weekly
Dur
ation
PTD
Weekly
Dur
ation
PTD
Weekly
Injuries"
Weekly
Dep
ende
ncy
State
Period
Period
Ben
efit
Ben
efit
(Weeks
)Calcu
lation
Ben
efit
(Weeks
)Ben
efits
Ben
efit
(Weeks
)Ben
efit
Ben
efits
Rhode
3 days
No pay-
None
$1,076.00
Duration of TTD
75% of worker's
$1,076.00
Payable for the
None
$180.00
500
$1,076.00
None
Island
ment for
disability
spendable or after-
length of disability
waiting
tax or NWW
and may be for life
period
days
South
7 days
More than
$75 if wages
$784.03
Duration of TTD
66 2/3% PIWW
$752.16
500 weeks
500 weeks
Depends on
340
$784.03
500 weeks
Carolina
14 days
are >$75;
disability with a
scheduled
otherwise,
maximum
body part
comp rate is
of 500 weeks
equal to
wages
South
7 days
7 calendar
$367.00
$733.00
Duration of TTD
66 2/3% PIWWp
$733.00
For length of
None
$733.00
312
$733.00
None
Dakota
days
disability
disability and can
be for life
Tennessee
7 days
14 days
$128.70
$943.80
Duration of TTD
66 2/3% PIWW
$858.00
Until Social Secur-
No$858.00
450
$858.00
$386,100.00
for physical inju-
ity eligibility age
ries; 104 weeks
or 260 weeks
for psychological
where the date
injuries; 104
of injury is on or
weeks after the
after age 60
commencement
of pain
management
Texas
7 days
14 days
$134.00
$895.00
105q
75% AWW
$895.00
NoNo
$627.00
300
$895.00
Minimum of
364 weeks
Utah
3 days
14$45.00
$811.00
312
66 2/3% AWW
$689.00
PTD benefits are
No$541.00
312
$689.00
312 weeks;
calendar
at the time of
awarded for life,
however may
days
injury not to exceed
but PTD status
be expanded
85% of the SAW
Wmay be reexamined
when bene-
by submitting em-
ficiary remains
ployee to reason-
wholly
able medical
dependent
evaluations,
rehabilitation
and retraining
efforts, disclosure
of Federal Income
Tax returns
Dea
th B
enefits
Perm
anen
t Partial D
isab
ility
Perm
anen
t Total D
isab
ility
Tempo
rary Total D
isab
ility
Waiting
Periodr
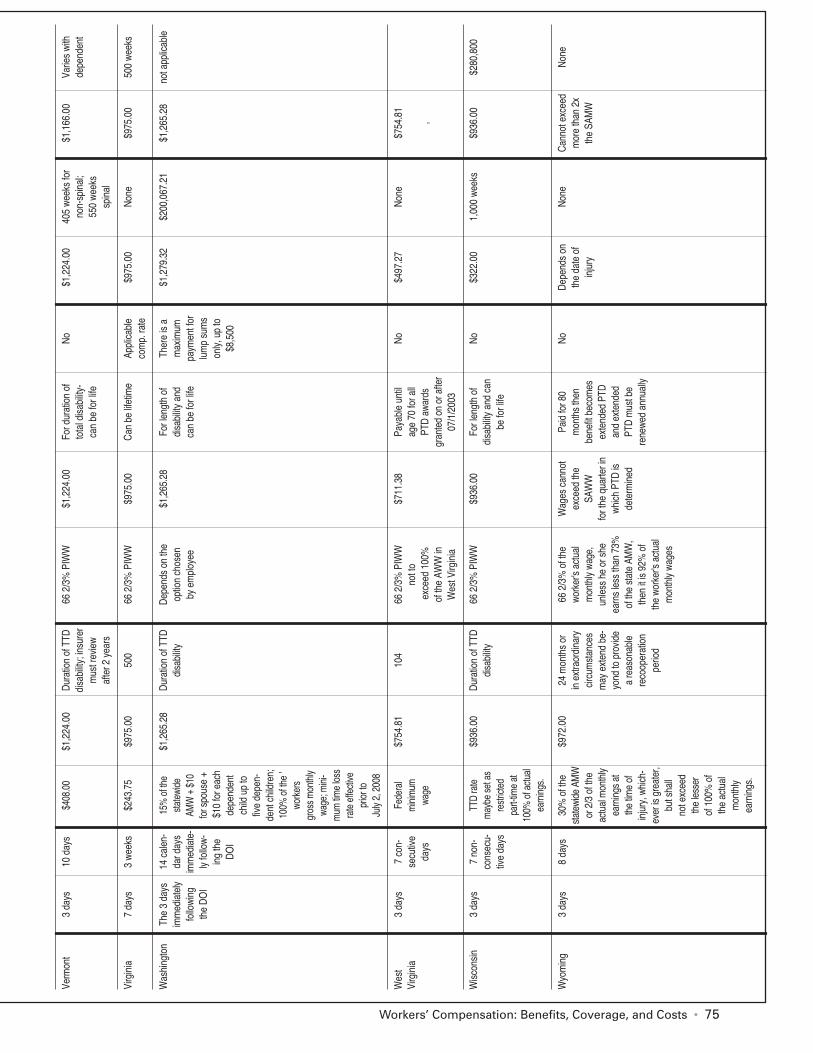
Workers’ Compensation: Benefits, Coverage, and Costs • 75
Vermont
3 days
10 days
$408.00
$1,224.00
Duration of TTD
66 2/3% PIWW
$1,224.00
For duration of
No$1,224.00
405 weeks for
$1,166.00
Varies with
disability; insurer
total disability-
non-spinal;
dependent
must review
can be for life
550 weeks
after 2 years
spinal
Virginia
7 days
3 weeks
$243.75
$975.00
500
66 2/3% PIWW
$975.00
Can be lifetime
Applicable
$975.00
None
$975.00
500 weeks
comp. rate
Washington
The 3 days
14 calen-
15% of the
$1,265.28
Duration of TTD
Depends on the
$1,265.28
For length of
There is a
$1,279.32
$200,067.21
$1,265.28
not applicable
immediately
dar days
statewide
disability
option chosen
disability and
maximum
following
immediate-
AMW + $10
by employee
can be for life
payment for
the DO
Ily follow-
for spouse +
lump sums
ing the
$10 for each
only, up to
DOI
dependent
$8,500
child up to
five depen-
dent children;
100% of the '
workers
gross m
onthly
wage; mini-
mum tim
e loss
rate effective
prior to
July 2, 2008
West
3 days
7 con-
Federal
$754.81
104
66 2/3% PIWW
$711.38
Payable until
No$497.27
None
$754.81
Virginia
secutive
minimum
not to
age 70 for all
days
wage
exceed 100%
PTD awards
, of the AW
W in
granted on or after
West Virginia
07/1/2003
Wisconsin
3 days
7 non-
TTD rate
$936.00
Duration of TTD
66 2/3% PIWW
$936.00
For length of
No$322.00
1,000 weeks
$936.00
$280,800
consecu-
maybe set as
disability
disability and can
tive days
restricted
be for life
part-time at
100% of actual
earnings.
Wyoming
3 days
8 days
30% of the
$972.00
24 months or
66 2/3% of the
Wages cannot
Paid for 80
NoDepends on
None
Cannot exceed
None
statewide AMW
in extraordinary
worker's actual
exceed the
months then
the date of
more than 2x
or 2/3 of the
circumstances
monthly wage,
SAWW
benefit becomes
injury
the SAMW
actual monthly
may extend be-
unless he or she
for the quarter in
extended PTD
earnings at
yond to provide
earns less than 73%
which PTD is
and extended
the time of
a reasonable
of the state AM
W,
determined
PTD must be
injury, which-
recooperation
then it is 92% of
renewed annually
ever is greater,
period
the worker's actual
but shall
monthly wages
not exceed
the lesser
of 100% of
the actual
monthly
earnings.

76 NATIONAL ACADEMY OF SOCIAL INSURANCE
Table C continuedWorkers' Compensation State Laws as of January 2016
a. Except for PTD which is payable for life
b. If total amount of weekly compensation is less than $7.00 per week.
c. There are some limited exceptions where benefits can be paid for 240 weeks.
d. Beginning Jan 1, 2012,the caps are adjusted each year. As of Jan 1, 2014 the caps are $80,868.10 and $161,734.15.
e. Does not apply to firefighters.
f. Any day on which a worker earns less than full wage because of an injury is considered a day of disability for the waiting period, and neither the 8 day period nor the 14-day period have to consist of consecutive calendar days.
g. So long as there is one "total dependent" (such as spouse or a minor child) the weekly death benefit payment is 66 2/3% ofthe worker's PIWW, not to exceed 105% of state AWW. Additional total or partial dependents do not increase the paymentamount.
h. If the worker is totally disabled and unable to work in any capacity for 21 days or longer, compensation must be paidretroactively to the first day of total wage loss unless the worker waives the retroactive payment and receives sick leave bene-fit from the employer instead.
i. Benefits end for spouse on remarriage or upon death and end for children upon turning 18, or if still in school, 23, if notblind or physically disabled. If blind or physically disabled, then the benefits end when the blindness or physical disabilityends, after age 18 or 23 as appropriate. If benefits paid to dependent parents or grandparents, they end upon death. Forbrothers, sisters, or grandchildren at age 18, or, if in school, 23.
j. Widower may receive lifetime payments if she is totally disabled at the date of decedents's death and child will receiveweekly payments for 400 weeks or until age 18, whichever is longer.
k. ABP benefits are additional benefits payable. ABP are payable for the length of the disability or until death. Benefit is basedon the duration of disability prior to retirement.
l. 66 2/3% of the workers' pre-injury weekly wage not to exceed the maximum for the date of injury or date of disability inoccupational disease claims.
m. This is the lowest benefit level for a child of deceased that is not substantially dependent on a surviving spouse up to age 18.
n. Disability under PA laws means loss of earning power. PA law allows employer/insurer to request "Impairment Rating Examination" after employee has received 104 weeks of full benefit payments. If IRE shows less than 50% impairmentbased on AMA Guides then benefits are reclassified as partial disability compensation and are subject to a 500-week cap.
o. Wage Loss benefits may continue for life, however.
p. If the weekly wage is below 50% of the SAWW the calculation is wages, less income tax and social security.
q. An exception to this amount could be made when an extension of MMI based on spinal surgery is approved by the Division.
r. The value of lost wages during the waiting period that are not recompensed by a retroactive period is an additional cost ofwork-related injuries borne by workers.
Source: IAIABC-WCRI (2016).

Workers’ Compensation: Benefits, Coverage, and Costs • 77
A.M. Best. 2015. Private Data Request. Oldwick, NJ:A.M. Best.
A.M. Best. 2015a. 2015 Best’s Aggregates & Averages –Property/Casualty. Oldwick, NJ: A.M. Best.
Azaroff, Lenore S., Charles Levenstein, and DavidWegman. 2002. “Occupational Injury and IllnessSurveillance: Conceptual Filters Explain Underreporting.”American Journal of Public Health 92 (9): 1421–1429.
Barth, Peter, and Michael Niss. 1999. Permanent PartialDisability Benefits: Interstate Differences. Cambridge, MA:Workers Compensation Research Institute.
Berkes, Howard and Michael Grabell. 2016. “OklahomaCommission Declares Workers’ Comp AlternativeUnconstitutional,” http://www.npr.org (July 12, 2016).
Biddle, Jeff, Karen Roberts, Kenneth D. Rosenman, andEdward M. Welch. 1998. “What Percentage of Workerwith Work-Related Illness Receive Workers’Compensation Benefits?” Journal of Occupational andEnvironmental Medicine 40 (4): 325– 331.
Boden, Leslie I., Robert T. Reville and Jeff Biddle. 2005.“The Adequacy of Workers’ Compensation CashBenefits,” in Karen Roberts, John F. Burton, Jr., andMatthew M. Bodah (Eds), Workplace Injuries and Diseases:Prevention and Compensation: Essays in Honor of TerryThomason, Kalamazoo, MI: W.E. Upjohn Institute forEmployment Research: 37-68
Burton, John F., Jr. 2008. “Workers’ Compensation CashBenefits: Part Two: Cash Benefit Systems and Criteria forEvaluation.” Workers’ Compensation Policy Review 8 (6):1331.
Burton, John F., Jr. 2013. “Workers’ Compensation Costsfor Employers, National and State Data.” Workers’Compensation Resources Research Report 6:3-26.
Burton, John F., Jr. 2014. “Workers’ CompensationInsurance Industry Underwriting Results Continue toImprove in 2013.” Workers’ Compensation ResourcesResearch Report, 8: 3-12.
Burton, John F., Jr. 2015. Workers’ Compensation Costs forEmployers: 1986-2014. Workers’ Compensation ResourcesResearch Report 10: 1-23.
Burton, John F., Jr., and Daniel J.B. Mitchell. 2003.“Employee Benefits and Social Insurance: The WelfareSide of Employee Relations.” Industrial Relations toHuman Resources and Beyond, Bruce E. Kaufman, RichardA. Beaumont, and Roy B. Helfgot (Eds). Armonk, NY:M.E. Sharpe.
Burton, John F., Jr. and Xuguang (Steve) Guo. 2016.“Improving the Interaction Between the SSDI andWorkers’ Compensation Programs,” SSDI Solutions: Ideasto Strengthen the Social Security Disability InsuranceProgram, Jim McCrery and Earl Pomeroy (Eds.). WestConshohocken, PA: Infinity Publishing.
Calderone, Peter. 2011. “Workers’ Compensation:Woodrow Wilson’s Important Legacy for New Jersey,”Reflections on the History and Development of Workers’Compensation in the United States, Gregory C. Krohm(Ed), 165-71. Madison, WI: International Association ofIndustrial Accident Boards and Commissions.
Centers for Disease Control and Prevention. 2007.“Nonfatal Occupational Injuries and Illnesses—UnitedStates, 2004.” MMWR: Morbidity and Mortality WeeklyReport 56 (16): 393-97.
Centers for Medicare & Medicaid Services. 2016. Privatedata request.
Clayton, Ann. 2004. “Workers’ Compensation: ABackground for Social Security Professionals.” SocialSecurity Bulletin 65 (4): 715.
Fishback, Price V., and Shawn Everett Kantor. 1996. “TheAdoption of Workers’ Compensation in the United States,1900-1930.” NBER Working Paper Series 5840.
Friedman, Lee S, and Linda Forst. 2007. “OccupationalInjury Surveillance of Traumatic Injuries in Illinois, Usingthe Illinois Trauma Registry: 1995–2003.” Journal ofOccupational and Environmental Medicine 49 (4): 401-10.
Galizzi, Monica and Jay L. Zagorsky. 2009. “How DoOn-the-Job Injuries and Illnesses Impact Wealth?” LabourEconomics 16: 26–36.
Galizzi, Monica, Petra Miesmaa, Laura Punnett, CraigSlatin, and PHASE. 2010. “Injured Workers’Underreporting in the Health Care Industry.” IndustrialRelations 49: 22–42.
Grabell, Michael, and Howard Berkes, 2015. “InsideCorporate America’s Campaign to Ditch Workers’Comp.” http://www.propublica.org (July 1, 2016).
Hunt, H. Allan. 2004. Adequacy of Earnings Replacementin Workers’ Compensation Programs. Kalamazoo, MI: W.E.Upjohn Institute for Employment Research and NASI.
Hunt, H. Allan, and Marcus Dillender, 2014. “BenefitAdequacy in State and Provincial Workers’ CompensationPrograms.” Employment Research 21(4): [1]-4.http://dx.doi.org/10.17848/1075-8445.21(4)-1
References

IAIABC–WCRI. 2014. Workers’ Compensation Laws,January 2014, WC-12-18. (Joint Publication of IAIABCand Workers Compensation Research Institute). Boston,MA.
IAIABC–WCRI. 2016. Workers’ Compensation Laws,January 2016, WC-16-43. (Joint Publication of IAIABCand Workers Compensation Research Institute). Boston,MA.
Krohm, Gregory C. 2011. “Wisconsin’s Role inPioneering Workers’ Compensation.” In Reflections on theHistory and Development of Workers’ Compensation in theUnited States, Gregory C. Krohm (Ed), 185-93. Madison,WI: International Association of Industrial AccidentBoards and Commissions.
Krohm, Gregory C. 2016. Understanding the Opt-outAlternative to Workers’ Compensation. Madison, WI:International Association of Industrial Accident Boardsand Commissions.
Lashuay, Nan, and Robert Harrison. 2006. “Barriers tooccupational health services for low-wage workers inCalifornia.” Commission on Health and Safety andWorkers’ Compensation, California Department ofIndustrial Relations.
Leigh, J. Paul, and James P. Marcin. 2012. “Workers’Compensation benefits and Shifting Costs forOccupational Injury and Illness.” Journal ofEnvironmental Medicine 54(4): 445-450.
Leigh, J. Paul, Steven Markowitz, Marianne Fahs, andPhilip Landrigan. 2000. Costs of Occupational Injuries andIllnesses. Ann Arbor, MI: The University of MichiganPress.
Manley, Mike. 2013. “Comments on Workers’Compensation Costs for Employers: National and StateData.” Workers’ Compensation Resources Research Report,Supplement 6: 3-5.
Milton, Donald K., Gina M. Solomon, Richard A.Rosiello, and Robert F. Herrick. 1998. “Risk andIncidence of Asthma Attributable to OccupationalExposure among HMO Members.” American Journal ofIndustrial Medicine 33: 110.
Minnesota Department of Labor and Industry. 2005.Comparing Workers’ Compensation Claims and OSHA DataInitiative Case, research report prepared by E. Messiou,and B. Zaidman. St. Paul, MN: Minnesota Departmentof Labor and Industry.
Morse, Timothy F., Charles Dillon, Nicholas Warren,Charles Levenstein, and Andrew Warren. 1998. “TheEconomic and Social Consequences of Work-RelatedMusculoskeletal Disorders: The Connecticut Upper
Extremity Surveillance Project (CUSP),” InternationalJournal of Occupational & Environmental Health 4: 209-216.
National Academy of Social Insurance (NASI). 2002.“Workers’ Compensation Coverage: Technical Note onEstimates,” Workers’ Compensation Data Fact Sheet 2.Washington, DC: NAIC.
National Association of Insurance Commissioners(NAIC). 2014. Statistical Compilation of Annual StatementInformation for Property/Casualty Insurance Companies in2014. Kansas City, MO: NAIC. Similar publication forthe years 1998-2013.
National Council on Compensation Insurance, Inc.(NCCI). 2016a. Private Data Request. Boca Raton, FL:NCCI.
———. 2016b. Annual Statistical Bulletin, ed. 1996. BocaRaton, FL: NCCI. Similar publication for the years 1997-2015.
Occupational Safety & Health Administration (OSHA).2015. Adding Inequality to Injury: The Costs of Failing toProtect Workers on the Job. U.S. Department of Labor,OSHA.
Oregon Department of Consumer and Business Services.2015. Oregon Workers’ Compensation Premium RateRanking: Calendar Year 2014, Central Services Division,Information and Research Section.
Postal, Arthur D. 2013. “Oklahoma Passes Bill AllowingEmployers to Opt Out of Workers’ Comp System,”PropertyCasualty360.com (May 1, 2013).
Pransky, Glenn, Terry Snyder, Allard Dembe, and JayHimmelstein. 1999. “Under Reporting of Work RelatedDisorders in the Workplace: A Case Study and Review ofthe Literature.” Ergonomics 42: 171-182.
Rappin, Christina L., Sara E. Wuellner, and David K.Bonauto. 2016. “Employer reasons for failing to reporteligible workers’ compensation claims in the BLS surveyof occupational injuries and illnesses.” American Journal ofIndustrial Medicine 59(5): 343-356.
Sears, Jeanne M, Stephen M Bowman, Sheilah Hogg-Johnson, and Zeynep A Shorter. 2014. “OccupationalInjury Trends Derived from Trauma Registry and HospitalDischarge Records: Lessons for Surveillance andResearch.” Journal of Occupational and EnvironmentalMedicine 56 (10): 1067-73.
Social Security Administration (SSA). 2015. Office ofResearch, Evaluation, and Statistics. Annual StatisticalSupplement, 2014. Washington, DC: SSA.
78 NATIONAL ACADEMY OF SOCIAL INSURANCE

———.2015a. Unpublished Data from the Office ofDisability. Baltimore, MD: SSA.
———. 2015b. The 2015 Annual Report of the Board ofTrustees of the Federal Old Age and Survivors Insurance andDisability Insurance Trust Funds. Washington, DC: SSA.
Spieler, Emily A., and John F. Burton, Jr. 2012. “TheLack of Correspondence between Work Related Disabilityand Receipt of Workers’ Compensation Benefits.”American Journal of Industrial Medicine 55: 487505.
Stanbury, Martha, Patrick Joyce, and Howard Kipen.1995. “Silicosis and Workers’ Compensation in NewJersey.” Journal of Occupational Environmental Medicine37: 1342-1347.
Strunin, Lee, and Leslie I. Boden. 2004. “The Workers’Compensation System: Worker Friend or Foe?” AmericanJournal of Industrial Medicine 45(4):338-345.
Texas Department of Insurance (TDI). 2014. TexasDepartment of Insurance Workers’ CompensationResearch and Evaluation Group, Employer Participation inthe Texas Workers’ Compensation System: 2014 Estimates.
Thomason, Terry, Timothy P. Schmidle, and John F.Burton, Jr. 2001. Workers’ Compensation: Benefits, Costs,and Safety under Alternative Insurance Arrangements.Kalamazoo, MI: W.E. Upjohn Institute for EmploymentResearch.
U.S. Census Bureau. 2005. The Number of Firms andEstablishments, Employment, Annual Payroll, and Receiptsin 1997 by Industry and Employment Size of Enterprise.Washington, DC: U.S. Census Bureau.
U.S. Department of Justice (DOJ). 2015. RadiationExposure Compensation Act. Washington, DC: U.S. DOJ.
U.S. Department of Labor (DOL). 2008. An InterimReport to Congress on Occupational Diseases, AssistantSecretary for Policy Evaluation and Research. Washington,D.C.
———. 2016. Private Data request from the Office ofWorkers’ Compensation Program, U.S. DOL.
———. 2015a. Bureau of Labor Statistics. Employer Costsfor Employee Compensation – December 2014. USDL-14-0390. Washington, DC: U.S. DOL.
———. 2015b. Bureau of Labor Statistics. EmployeeBenefits in the United States, March 2013. Washington,DC: U.S. DOL.
———. 2015c. Bureau of Labor Statistics. NationalCensus of Fatal Occupational Injuries in 2014. Washington,DC: U.S. DOL.
———. 2015d. Bureau of Labor Statistics. EmployerReported Workplace Injuries and Illnesses in 2014.Washington, DC: U.S. DOL.
———. 2015e. Bureau of Labor Statistics. NonfatalOccupational Injuries and Illnesses Requiring Days awayfrom Work, 2014. Washington, DC: U.S. DOL.
———. 2015f. ES 202 Report. Washington, DC: U.S.DOL.
———.2015g. Bureau of Labor Statistics. PrivateIndustry Long-term and Short-term Disability, Access toBenefits. Washington, DC: U.S. DOL.
———.2015h. Bureau of Labor Statistics. QuarterlyCensus of Employment and Wages. Washington, DC: U.S.DOL.
U.S. Department of Veterans Affairs (VA): VeteransBenefit Administration. 2015. Annual Benefits Report,Fiscal Year 2014. Washington, DC: U.S. Department ofVeterans Affairs.
U.S. Small Business Administration (SBA). Office ofAdvocacy. 2016. Employer Firms, Establishments,Employment, and Annual Payroll by Firm Size and State,2013. Washington, DC: U.S. SBA.
Willborn, Steven L., Stewart J. Schwab, John F. Burton,Jr., and Gillian L.L. Lester. 2012. Employment Law: Casesand Materials (Fifth Edition). Newark, NJ: LexisNexis.
Williams, C. Arthur, and Peter S. Barth. 1973.Compendium on Workmen’s Compensation. Washington,DC: National Commission on State Workmen’sCompensation Laws.
Workers’ Compensation: Benefits, Coverage, and Costs • 79

80 NATIONAL ACADEMY OF SOCIAL INSURANCE


www.nasi.orgISBN: 1-884902-64-2


