International Journal of Managerial Finance Working capital and firm value in an emerging market Shaista Wasiuzzaman Article information: To cite this document: Shaista Wasiuzzaman , (2015),"Working capital and firm value in an emerging market", International Journal of Managerial Finance, Vol. 11 Iss 1 pp. 60 - 79 Permanent link to this document: http://dx.doi.org/10.1108/IJMF-01-2013-0016 Downloaded on: 27 March 2015, At: 05:16 (PT) References: this document contains references to 62 other documents. To copy this document: [email protected]The fulltext of this document has been downloaded 415 times since 2015* Users who downloaded this article also downloaded: Bana Abuzayed, (2012),"Working capital management and firms’ performance in emerging markets: the case of Jordan", International Journal of Managerial Finance, Vol. 8 Iss 2 pp. 155-179 http:// dx.doi.org/10.1108/17439131211216620 Pedro Juan García-Teruel, Pedro Martínez-Solano, (2007),"Effects of working capital management on SME profitability", International Journal of Managerial Finance, Vol. 3 Iss 2 pp. 164-177 http:// dx.doi.org/10.1108/17439130710738718 Darush Yazdanfar, Peter Öhman, (2014),"The impact of cash conversion cycle on firm profitability: An empirical study based on Swedish data", International Journal of Managerial Finance, Vol. 10 Iss 4 pp. 442-452 http://dx.doi.org/10.1108/IJMF-12-2013-0137 Access to this document was granted through an Emerald subscription provided by 571227 [] For Authors If you would like to write for this, or any other Emerald publication, then please use our Emerald for Authors service information about how to choose which publication to write for and submission guidelines are available for all. Please visit www.emeraldinsight.com/authors for more information. About Emerald www.emeraldinsight.com Emerald is a global publisher linking research and practice to the benefit of society. The company manages a portfolio of more than 290 journals and over 2,350 books and book series volumes, as well as providing an extensive range of online products and additional customer resources and services. Emerald is both COUNTER 4 and TRANSFER compliant. The organization is a partner of the Committee on Publication Ethics (COPE) and also works with Portico and the LOCKSS initiative for digital archive preservation. *Related content and download information correct at time of download. Downloaded by UEPB At 05:16 27 March 2015 (PT)
Transcript
International Journal of Managerial FinanceWorking capital and firm value in an emerging marketShaista Wasiuzzaman
Article information:To cite this document:Shaista Wasiuzzaman , (2015),"Working capital and firm value in an emerging market", InternationalJournal of Managerial Finance, Vol. 11 Iss 1 pp. 60 - 79Permanent link to this document:http://dx.doi.org/10.1108/IJMF-01-2013-0016
Downloaded on: 27 March 2015, At: 05:16 (PT)References: this document contains references to 62 other documents.To copy this document: [email protected] fulltext of this document has been downloaded 415 times since 2015*
Users who downloaded this article also downloaded:Bana Abuzayed, (2012),"Working capital management and firms’ performance in emerging markets:the case of Jordan", International Journal of Managerial Finance, Vol. 8 Iss 2 pp. 155-179 http://dx.doi.org/10.1108/17439131211216620Pedro Juan García-Teruel, Pedro Martínez-Solano, (2007),"Effects of working capital managementon SME profitability", International Journal of Managerial Finance, Vol. 3 Iss 2 pp. 164-177 http://dx.doi.org/10.1108/17439130710738718Darush Yazdanfar, Peter Öhman, (2014),"The impact of cash conversion cycle on firm profitability: Anempirical study based on Swedish data", International Journal of Managerial Finance, Vol. 10 Iss 4pp. 442-452 http://dx.doi.org/10.1108/IJMF-12-2013-0137
Access to this document was granted through an Emerald subscription provided by 571227 []
For AuthorsIf you would like to write for this, or any other Emerald publication, then please use our Emeraldfor Authors service information about how to choose which publication to write for and submissionguidelines are available for all. Please visit www.emeraldinsight.com/authors for more information.
About Emerald www.emeraldinsight.comEmerald is a global publisher linking research and practice to the benefit of society. The companymanages a portfolio of more than 290 journals and over 2,350 books and book series volumes, aswell as providing an extensive range of online products and additional customer resources andservices.
Emerald is both COUNTER 4 and TRANSFER compliant. The organization is a partner of theCommittee on Publication Ethics (COPE) and also works with Portico and the LOCKSS initiative fordigital archive preservation.
*Related content and download information correct at time ofdownload.
Working capital and firm valuein an emerging market
Shaista WasiuzzamanFaculty of Management, Multimedia University, Cyberjaya, Malaysia
AbstractPurpose – The purpose of this paper is to examine the relationship between working capital efficiencyand firm value and the influence of financing constraints on this relationship.Design/methodology/approach – Data from 192 firms spanning a period of ten years (1999-2008)are used for this purpose and analyzed using the ordinary least squares regression technique.Findings – The study finds that improvements in working capital efficiency through reduction inworking capital investment results in higher firm value. However, this relationship is influenced by thefinancing constraints faced by a firm. For financially constrained firms, working capital efficiencysignificantly increases firm value but it is found to be insignificant for unconstrained firms.Originality/value – To the author’s knowledge, this is the first study on the value of working capitalin Malaysia or in any emerging market. Most studies on working capital valuation concentrate ondeveloped countries and that too are only a handful. Hence this study contributes to the scarceliterature on the valuation of working capital. This study also uses the model by Fama and French(1998) to evaluate the relationship between working capital and firm value, which has hardly been usedin studies on working capital valuation.Keywords Firm value, Financing constraints, Working capital managementPaper type Research paper
1. IntroductionWorking capital is considered to be the life-giving force to an economic entity(Mukhopadhyay, 2004) and “efficient working capital is one of the pre-conditions forthe success of an enterprise” (Ghosh and Maji, 2004, p. 363). In fact, of the sevendrivers of shareholder value identified by Rappaport (1998), working capitalimprovements may be the easiest to make and the investment in working capital isthe “only investment a firm makes on which it doesn’t expect a defined return”(Bender and Ward, 2009, Chap. 19, p. 325).
Unfortunately, while finance magazines and online newsletters, such as CFOMagazine and gtnews (www.gtnews.com), offer ample focus on working capitalmanagement issues, there is still a lack of importance given to this issue academically.Every year CFO Magazine reveals billions of dollars stuck in the working capital cycleof some of the biggest companies in the world. For instance, they report that in year2007, a total of $833 billion in working capital was not put to productive use by 850 ofthe region’s largest companies the Asia-Pacific region. When Asia’s 725 largest companiessignificantly improved their working capital standing in 2006, Malaysian companies’overall working capital performance degraded (Wasiuzzaman and Arumugam, 2013).
Despite the dismal working capital performance, its importance is realized by headsof Malaysian firms especially in the face of increasing global competition anduncertainty. Over the years several firms have undertaken business transformation
Received 30 January 2013Revised 14 September 20137 March 2014Accepted 26 March 2014
The current issue and full text archive of this journal is available on Emerald Insight at:www.emeraldinsight.com/1743-9132.htm
The author wishes to thank the anonymous referee(s) of this journal who provided constructivefeedback which helped improve this paper significantly. The author also wishes to thank herPhD supervisor, Associate Professor Dr V.C. Arumugam, for his support and encouragement.
60
IJMF11,1
Dow
nloa
ded
by U
EPB
At 0
5:16
27
Mar
ch 2
015
(PT
)
programs in order to improve profit margin and the focus has always been on some, ifnot all, areas of working capital. An example is the largest telecommunicationsprovider, Telekom Malaysia. In 1996, its head of finance acknowledged that withincreasing competition due to the privatization of the telecommunications industry,efficient management of working capital had become critical to improve cashflow especially given the size of the company (Crane, 2001). An independent creditmanagement unit was set up to improve accounts receivable resulting in improvementin the cash conversion efficiency rate by 24.5 percent in 1999 but still there was moreroom for improvement for the company (Crane, 2001). Another high-profile company isMalaysia Airlines, whose transformation programe in 2008 resulted in an improvementin inventory management in its Inflight Services and Engineering & Maintenancedepartments leading to significant cost savings and revenue improvements.It acknowledged that improvement in its revenue management with inventoryallocation being an important part would improve its competitiveness (MalaysiaAirlines, 2008). The company was awarded the “Airline Turnaround of the Year”award in 2006. In a more recent case, in its 2012 financial performance review, Nestle(Malaysia) Bhd. reported an improvement in its net profit with a margin improvementof 100 bps, notably due to the role of good working capital management practices inreducing financing costs. One of the focus of its lean production approach, the NestleContinuous Excellence, was the improvement in its supply chain performance whereservice levels to customers improved significantly mainly due to its tight control on itsinventories. With its continuous focus on excellence, the company achieved A+ ratingfor its 2012 Creating Shared Value report.
The examples above suggest a connection between working capital and profitability.Academically, there is a growing amount of research on the effect of working capitalefficiency/investment on profitability. However, profitability is a short-term measure ofperformance (Samiloglou and Demirgunes, 2008) and its role as an indicator of firm well-being is doubted partly due to its manipulability. For example Tung et al. (2008, p. 61)find that managers practice the granting of extended credit at the end of the fiscal year inorder “to accelerate customer purchases and thus avoid reporting losses […] to meetannual financial reporting targets.” Hence, an investigation into the effect of workingcapital on profitability may not give a clear picture of its actual impact since one or moreof its components may have been used to manipulate earnings.
On the other hand, firm value is a long-term measure of performance (Samiloglouand Demirgunes, 2008). Since working capital is within a firm’s control andindependent of macroeconomic factors, it allows a firm to adapt to changing economicenvironments easily and enhance its economic value added (Havoutis, 2003). Theefficient management of working capital helps increase free cash flows used to value afirm, thus maximizing firm value (Berk et al., 2009). Hence, Hill et al. (2010) suggest thatthe study on the value of the marginal dollar in net operating working capital (NWC) isneeded but except for Kieschnick et al. (2008) and more recently, Autukaite and Molay(2011) and Kieschnick et al. (2013), no other study has considered its contribution tovalue, a fundamental issue in finance.
Additionally, compared to the investment in fixed assets, investment in workingcapital is more sensitive to financing constraints (Fazzari and Petersen, 1993).Considering that a firm’s fixed-investment decision is set ahead of time, firms will try tomaintain a stable fixed-investment path but cash flow fluctuations may happen andthis may need to be offset through the use of external funds. Unfortunately, a firmfacing financing constraints may not be able to do this without incurring heavy costs
61
Workingcapital andfirm value
Dow
nloa
ded
by U
EPB
At 0
5:16
27
Mar
ch 2
015
(PT
)
hence it needs to look for cheaper alternatives, one of them being working capital whichallows the release of short-run liquidity and is reversible due to its short-term nature.Faulkender andWang (2006) find evidence of the influence financing constraints have onthe valuation of cash holdings, thus a study on the impact of working capital investmenton firm value without considering financing constraints may be inadequate.
Unfortunately, given Malaysian firms’ unsatisfactory working capital performanceover the years, there is still a lack of studies focussing on this important aspect offinancial management in Malaysian firms. Zariyawati et al. (2009) and Mohamad andSaad (2010) study the effect of working capital management on profitability of Malaysianfirms and Wasiuzzaman and Arumugam (2013) on the determinants of working capitalof Malaysian firms but to our knowledge, none so far have studied its effect on firm valuein the Malaysian context. A study on profitability is not enough as working capitalefficiency affects not only short-term financial performance (profitability) but also long-term (firm value maximization) (Samiloglou and Demirgunes, 2008). Additionally, whilethere is abundant literature on working capital efficiency/management globally, studieson valuation are limited. Hence, the contribution of this study is threefold. First, thisstudy adds to the scant literature on working capital issues in Malaysian firms. Second, itcontributes to the growing but limited global literature on working capital valuation andthe importance of financing constraints in influencing it. Finally, it advances knowledgeon the importance of working capital in determining firm value by focussing on anemerging market where strong relationships with banks and differing economic andcultural conditions may influence the impact working capital has on firm value.
The objective of this study is thus to investigate the value attached to the workingcapital investment made by firms in Malaysia and the effect financing constraints haveon this valuation. Given different economic conditions, culture and attitudes, it ispossible that Malaysian investors may perceive the level of working capital in adifferent way compared to investors in the USA, for example. To do this, data from 192companies listed on the Bursa Malaysia over the period 1999-2008 are used. Ordinaryleast squares (OLS) regression is used to analyze the data. The results show that areduction in working capital investment increases firm value but this relationship isaffected by the financing constraints faced by the firm.
This paper is organized as follows. Section 2 reviews previous studies on issuesrelated to working capital and cash management hence the gap of this study ishighlighted. To address this gap, Section 3 develops the hypotheses related to thisstudy. The model used and the measurement of variables are described in Section 4.Section 5 describes the data and summary statistics while Section 6 presents the resultsof the data analysis. Discussions of the findings are presented in Sections 7 and 8concludes the study.
2. Literature reviewEfficient liquidity management requires current assets and liabilities managed insuch a way so that the risk of the inability to meet due short-term obligations iseliminated while avoiding excessive investment in current assets (Eljelly, 2004) and thisultimately depends on its effect on firm profitability. Most studies, such as by Soenen(1993), Beaumont and Begemann (1997), Shin and Soenen (1998, 2000), Wang (2002),Deloof (2003), Lazaridis and Tryfonidis (2006), García-Teruel and Martinez-Solano(2007), Ramachandran and Janakiraman (2009), Zariyawati et al. (2009) and Erasmus(2010a, b) find a negative relationship between different measures of working capitaland profitability. On the other hand, Lyroudi and Lazaridis (2000) find a positive
62
IJMF11,1
Dow
nloa
ded
by U
EPB
At 0
5:16
27
Mar
ch 2
015
(PT
)
relationship between cash conversion cycle and return on investment and netprofit margin. However, a study on profitability is not enough as “these accountingnumbers may have little to do with what is good or bad for the firm” and the goal offirm value maximization encompasses both safety and profit (Ross et al., 2009, p. 12).Hence it is in fact more important to understand the impact of working capitalinvestment on firm value.
Unfortunately, studies on the valuation of working capital are lacking but there is asubstantial and increasing amount of work carried out on cash management and firmvalue. The relationship between cash holdings and firm value as found by most studiessuch as by Luo and Hachiya (2005), Pinkowitz et al. (2006), Kalcheva and Lins (2007),Harford et al. (2008), Chen (2009) and Lee and Lee (2009) is negative. However, studies byFaulkender and Wang (2006), Bates et al. (2009), Isshaq et al. (2009) and Chen (2009) findpositive influence of cash holdings on firm valuation, suggesting that the market valuesliquidity although Faulkender and Wang (2006) show the possibility of an upper boundon the amount of cash for which the market rewards firms.
The valuation of cash holdings may, however, depend on other factors. For instance,Pinkowitz and Williamson (2007) find that firms with high levels of cash holdings arevalued higher if they have riskier operating cash flows and better growth opportunitiesbut the valuation differs across industries. Luo and Hachiya (2005) and Lee andLee (2009) find agency problems/governance to be a major influential factor in therelationship between cash and firm value although Bates et al. (2009) find evidence tothe contrary. Pinkowitz et al. (2006) and Kalcheva and Lins (2007) find evidence of theinfluence of the level of investor protection in a country while Harford et al. (2008)suggest that the interaction of governance and excess cash holdings does impact thecash valuation. Chen (2009) proposes the influence of financial crisis and Drobetz et al.(2010) incorporate asymmetric information and the interaction between investorprotection and corporate governance in their study on cash valuation.
Unlike cash holdings, working capital’s relationship with firm value has not beenstudied as extensively. Using Rappaport’s (1998) model, Strischek’s (2003) conceptualstudy shows that higher cash flows from better working capital management imply lowercost of capital and higher value of equity. However, Kieschnick et al. (2008) are the first toempirically test the relationship between working capital management and firm value.Using Faulkender andWang’s (2006) valuation model, they find that the value assigned toinvestment in NWC is lower than that of cash and that reduction in firm value is due to itsfinancing and the additional dollar invested in NWC, a result also confirmed by Autukaiteand Molay (2011). However, the investment in NWC declines when a company has moreanti-takeover provisions, highlighting the importance of considering agency costs whentrying to understand the effect of working capital management on firm value.
Luo et al. (2009) find that aside from the level of working capital efficiency,improvement in working capital management significantly affects future operatingearnings. In addition, increasing accounts receivable (or trade credit to other firms)results in higher future performance. The firm value of highly levered firms is found tobe positively affected by changes in working capital management policy so the marketactually views working capital management efficiency positively although it alsounder-reacts to working capital changes.
Baños-Caballero et al. (2011) study on the link between working capital and businessperformance reveals that the relationship between working capital investment and firmperformance is not linear, implying that there should actually be an optimal level ofworking capital that would be able to balance cost and benefit and maximize
63
Workingcapital andfirm value
Dow
nloa
ded
by U
EPB
At 0
5:16
27
Mar
ch 2
015
(PT
)
performance. The optimal level of working capital for financially constrained firms isfound to be lower than those of unconstrained firms.
More recently, Kieschnick et al. (2013) confirm the effect of working capitalmanagement on shareholder’s wealth but find cash to be valued higher in comparisonto working capital. Additionally, they find evidence of the influence of other firmcharacteristics such as financing constraints on the valuation of working capital.Further investigations reveal that the investment in accounts receivable has a greaterimpact on shareholder wealth compared to the investment in inventories.
The studies so far on working capital valuation confirm two things. First, workingcapital does influence firm value significantly and second, financing constraints playan important part in this relationship. However, the studies are still limited and furtherempirical evidence is needed to support these findings.
3. Hypothesis formulationPrior studies suggest that the relationship between working capital and firm value isnot very straight forward. A negative relationship is usually expected since reducinginvestment in working capital means higher profitability and hence should meanhigher firm value (Kieschnick et al., 2008; Luo et al., 2009). However, Kieschnick et al.(2013) argue that this relationship is not as straight forward when the followingvaluation equation by Brigham and Daves (2007) is observed:
Vf irm ¼X1
t¼1
FCFt
1þWACCð ÞT(1)
where FCFt¼NOPATt−ΔNOWCt−ΔFixed Assetst. FCFt is the free cash flow at time t,NOPATt is the net operating profits after taxes at time t, ΔNOWCt is the change inNWC at time t or the investment in working capital at time t and ΔFixed Assetst is thechange in the value of the firm’s fixed assets or its investment in long-term assets.
Equation (1) illustrates that value is determined by the present and future FCFs of afirm and that NWC is an important component of FCF. While it is evident that NWCinvestment at a particular point in time (ΔNOWCt) reduces FCF at that time hencereducing investment in working capital should improve free cash flow at time t, itsimpact on future FCFs is not clear. The relationship is actually more complicatedbecause of the effect of working capital on future sales (Kieschnick et al., 2008). Forexample, holding too much inventory may not be ideal today as it reduces FCF todaybut it helps avoid stock outs which can result in loss of sales and customer goodwilland a disruption in production in the future (Brigham and Daves, 2007). Similarly,tightening credit policy may reduce receivables and bad debt losses today but it alsoreduces future sales (Salek, 2005). Effect of the individual components of workingcapital on future sales and firm value and the dynamic linkages between eachcomponent, especially the firm’s credit policy and its inventory management as pointedout by Kieschnick et al. (2013), are some reasons for the complicated relationship. Hencethe first hypothesis of this study is:
H1. There is a significant relationship between working capital of a firm and itsvalue.
Further, working capital investment is “excessively sensitive to cash-flow fluctuations”and working capital “is a source of liquidity that should be used to smooth fixed
64
IJMF11,1
Dow
nloa
ded
by U
EPB
At 0
5:16
27
Mar
ch 2
015
(PT
)
investment relative to cash-flow shocks if firms face finance constraints” (Fazzari andPetersen, 1993, p. 339). Investors view market frictions as costly for firms and hencethey reward highly liquid firms with higher valuations (Faulkender and Wang, 2006).Kieschnick et al. (2013) confirm the influence of financing constraints have on thevaluation of NWC.
In this study, financing constraint is proxied via size. Larger firms enjoy greaterexposure and better reputation and so have better access to capital markets comparedto smaller firms (Faulkender and Wang, 2006). Hence, larger firms face fewer financialconstraints when they need funds for their investments. On the other hand, smallerfirms facing financial constraints will turn toward working capital as a source of short-run liquidity and relatively cheap financing for their fixed-investment needs.
Hence it is expected that for financially constrained firms, reduction in workingcapital investment should lead to higher valuations compared to unconstrained firms:
H2. Firm value is more sensitive to changes in working capital investment ofconstrained firms as compared to that of unconstrained firms.
4. Model specification and measurement of variablesFama and French’s (1998) valuation model, which relates firm value to itscharacteristics, uses a set of variables encompassing earnings, investment and R&Dexpenditure to proxy for net cash flows. Pinkowitz et al. (2006) later modify the model tostudy cash valuation. The free cash flow in Equation (1) includes all the characteristicsidentified by Fama and French and also NWC. Therefore in this study, the modelis further modified to include NWC so that the importance of net working capitalwith respect to firm value may be deduced. To test the two hypotheses, the model isas follows:
where Xit represents the level of variable X of firm i in year t; ΔXit represents thechange in the level of variable X of firm i from year t−1 to year t; ΔXit+1 representsthe change in the level of variable X of firm i from year t to year t+1; e is the error term.
Firm value (Value) is measured as the total market value of the firm. It is calculatedas the value of a firm’s common stock price times shares outstanding at the end of thefiscal year t (or its market capitalization) plus preferred stock (taken to be, in order andas available, redemption value, liquidating value, or par value) plus total book liabilitiesminus balance sheet deferred taxes and investment tax credit, if available.
The independent variable of interest in this model is the investment in NWC. NWCis measured as the sum of accounts receivables and inventories, net of accountspayable. Measurements of other variables are as follows: earnings are measured as netincome before extraordinary items plus interest expenses plus (when available) incomestatement deferred tax credits plus investment tax credits (Fama and French, 1998).However, because the last two items are not found in the financial statements ofMalaysian firms, earnings are measured as just net income before extraordinary itemsplus interest expenses. Since Pinkowitz et al. (2006) include cash as one of their
65
Workingcapital andfirm value
Dow
nloa
ded
by U
EPB
At 0
5:16
27
Mar
ch 2
015
(PT
)
independent variables they use net assets instead of total assets to remove the impactof cash on total assets. In this study, because NWC is also considered separately inaddition to cash, NetAssets is calculated as total assets minus cash and marketablesecurities minus the asset portion of NWC (i.e. accounts receivables plus inventories).
Fama and French (1998) and Pinkowitz et al. (2006) include research and development(R&D) expenses in their model because it is mandatory in the USA and this causes assetsto be understated. Although for the Malaysian case R&D expenditure is not mandatory,it is included in this model due to the robustness of the model as indicated by Pinkowitzet al. (2006). R&D expenditure (RnD) is measured as the value of the R&D expenses of thefirms. It is noted that out of the 192 firms selected, only around 20 of them actually investin R&D and that too inconsistently. Hence this variable is not expected to be significantin the Malaysian setting. Interest expenses (interest), according to Fama and French(1998), convey information about leverage policy (and changes in it) hence they use firm’sinterest payment as a measure of its leverage and this measurement is adopted in thisstudy. Following Pinkowitz et al. (2006), this study uses the value of common dividendpaid out by a firm as the measure of the dividend policy (Dividend). Cash is measured asthe value of cash and marketable securities. All variables are scaled by total book assetsat time t to solve for heteroscedasticity problem. Changes in the variables are included toabsorb changes in expectations (Pinkowitz et al., 2006). Measurement for each variablecan also be found in Appendix.
Next, to study the effect of financing constraints on the valuation of NWC, the firms aredivided into two groups based on size. Faulkender and Wang (2006) present variousproxies for financing constraints, which are dividend payout, long-term bond rating andcommercial paper rating and size. For the Malaysian scenario, long-term bond andcommercial paper ratings are not easily obtainable due to the inactive participation offirms in the issue of these securities. It is found in the summary statistics (to be presentedlater) that the dividend policy of firms in the sample do not vary much and so usingdividend payout as a proxy for financing constraints may not enable proper classificationof the firms. Hence, although size may have its limitations as a proxy for financingconstraints, it is deemed to be the most suitable to partition the firms in this study.
The partition is carried out by first calculating the size of all firms listed on the MainBoard (now Main Market) for the period of 1999-2008 including those not considered inthis study so that the median of the entire population can be calculated. Size is measuredby the natural logarithm of total assets and the median is then calculated for each yearover this period. Then, firms with size below the median in year t are assigned to the“small firms” or “constrained” group while those which are above the median are assignedto the “big firms” or “unconstrained” group. Most studies (such as by Faulkender andWang, 2006) use deciles for grouping firms but due to the limitation of sample size, medianis used in this study. Generally, most firms are found to belong to either of the categoriesover the period of study but there are some firms which belong to the “unconstrained”group in some years and the “constrained” group in other years. It is expected from thearguments by Fazzari and Petersen (1993) and from the results of Faulkender and Wang(2006) that smaller firms are likely to have higher financing constraints and hence a highervalue will be assigned to the NWC investment of these firms.
5. Data and summary statisticsThe data set used in this study is from year 1999 to 2008 due to the requirements of themodel, i.e. lag and lead values, although the analysis is from year 2000 to 2007. The dataare collected from three different databases, i.e. the Datastream International Database,
66
IJMF11,1
Dow
nloa
ded
by U
EPB
At 0
5:16
27
Mar
ch 2
015
(PT
)
the ISI Emerging Markets Database from EMIS and the Research Insight Databaseprovided by Compustat. Companies from all sectors on the Main Board of the BursaMalaysia which have complete data from 1999 to 2008 are considered except for thefinance and regulated sectors. Some sectors such as the technology and mining sectorsare excluded as less than ten firms in these sectors meet the criteria of having completedata. This results in a total of 192 companies, out of a possible 298 companies, over eightyears implying a total of 1,536 firm-year observations. Partitioning of data based onfinancial constraints results in 1,115 firms belonging to the unconstrained group and 421belonging to the constrained group. The data are then winsorized at the 1 percent level.
Table I presents the summary statistics for the variables of the model (Equation (2)).The summary statistics in Table I indicates mostly non-growth firms (average value
of 0.89) with weak earnings or a higher tendency to generate small positive earnings.On average, investments in net assets (average ΔNetAssetst of 0.013) and R&D(average RnDt value of 0.000696) are low. There is an indication of the stability of thedividend policies of the firms under study as can be observed via the standarddeviation and the difference between the minimum and maximum values. This is in linewith the results of Isa (1992) and Kester and Isa (1994) with regards to the stability ofthe dividend policy of Malaysian firms. The average cash holdings (to total assets) ofthe firms studied is 0.095 cents. This value is much lower compared to the averagevalue for NWC to total assets (0.131543), a result similar to Hill et al.’s (2010), who notethat for the US case, cash holdings ratio is less than the investment in NWC yet thefinancial component of working capital is getting more attention than the operatingcomponent. The maximum value for cash holdings is 0.3957 and 0.6134 for NWC.
The summary statistics for constrained and unconstrained firms are presented inTable II. The significance in the difference of the mean values of each variable forconstrained and unconstrained firms are also calculated in Table II.
The summary statistics show that for all the variables, except for ΔNetAssetst andInterest, the mean is higher for constrained firms. Constrained firms are found to havehigher earnings (0.038693 against 0.036053) despite the financing constraints faced.Also, interestingly, constrained firms pay higher dividends on average although thedifference in the payout is not significant. They also have higher cash holdings(0.107247 as compared to 0.090639), which is consistent with the findings of Faulkenderand Wang (2006). The Mann-Whitney test results show a highly significant differencein the means of cash holdings at the 1 percent level (0.000). Since constrained firms faceproblems in getting access to external funds, there is greater reliance on internalfunding and so hold higher levels of cash held.
On average, constrained firms also have higher levels of NWC (0.198163 comparedto 0.106388). It is expected that since constrained firms face difficulty in acquiringexternal funds, working capital is managed more efficiently in order to free up morecash and so there is a lower investment in NWC but this is not the case here. This resultis in contrast to the findings of Baños-Caballero et al. (2009) who find that firms withless financing constraints actually have longer cash conversion cycles. NWC may behigher here because of inefficient management of working capital or it could be thefirms’ investment in liquidity. It seems that constrained firms focus more on long-terminvestments rather than on short-term investments. Larger firms are better atmanaging their cash conversion cycles (Moss and Stein, 1993) or may simply havegreater bargaining power with suppliers and customers (Baños-Caballero et al., 2009)especially since the Malaysian industries are highly concentrated and monopolistic innature with very few players (Lian, 2011).
Another possible reason for the lower investment in working capital by large firmscould be the vendor development programe established and implemented by theMalaysian government in 1988, aimed at developing the competitiveness of Malaysiansmall and medium industries (SMIs) via industrial mentorship. Under this program,
Variable Unconstrained firms Constrained firms p-value of difference
Number of observations 1,115 421 1,536Notes: Value is a firm’s common stock price multiplied by its shares outstanding at the end of thefiscal year t (or its market capitalization) plus preferred stock (taken to be, in order and as available,redemption value, liquidating value, or par value) plus total book liabilities – balance sheet deferredtaxes and investment tax credit, if available. Earnings is net income before extraordinary items plusinterest expenses. NetAssets is total assets minus cash and marketable securities minus the assetportion of net operating working capital (i.e. accounts receivables plus inventories). RnD is researchand development expenditure. Interest is total interest payment. Dividend is total common dividendspaid out. Cash is the value of cash and marketable securities. NWC is accounts receivables plusinventories minus accounts payables. All variables are scaled by total book assets. ( ) representstandard errors. **po0.05; ***po0.01
large firms become mentors of SMIs which serve as the vendor (supplier) companymanufacturing and supplying parts and components to the large firms (Abdul Hamid,2003). The success of this program in the automobile industry in Malaysia, where theprogram was first introduced, led to the implementation in other industries. The aim ofany supplier development program is to establish a network of competent supplierswho are responsible for the large firm’s supply needs, while at the same time improveperformance and capabilities of the suppliers (Leenders, 1989). The implications of thison working capital investment are the shift of the burden of carrying large amounts ofinventory to the supplier and the relaxing of credit terms by the suppliers (accountspayables) since the supplier has less bargaining power due to the consolidation ofsuppliers and the focus on production for one specific customer.
In terms of significance, the independent t-test results show that there is asignificant difference in the mean NWC of both groups. Other variables with significantdifferences at least at the 5 percent level are Valuet (0.007), Earningst (0.001),ΔNetAssetst (0.042), Interestt (0.001), ΔInterestt (0.002) and ΔInterestt+1 (0.018).
6. Data analysisWorking capital and firm valueThe OLS regression technique is used to regress Valuet against the independentvariables. Because of the problem of heteroscedasticity and autocorrelation, which isexpected of panel data sets, the estimates are calculated using various standard erroradjustments. Estimates based on the fixed effects model are also calculated althoughgiven the short time frame clustered estimates are more efficient (Petersen, 2009).Before running the regressions, the correlations are checked and no evidence of highcorrelations, which may lead to multicollinearity issues, is found.
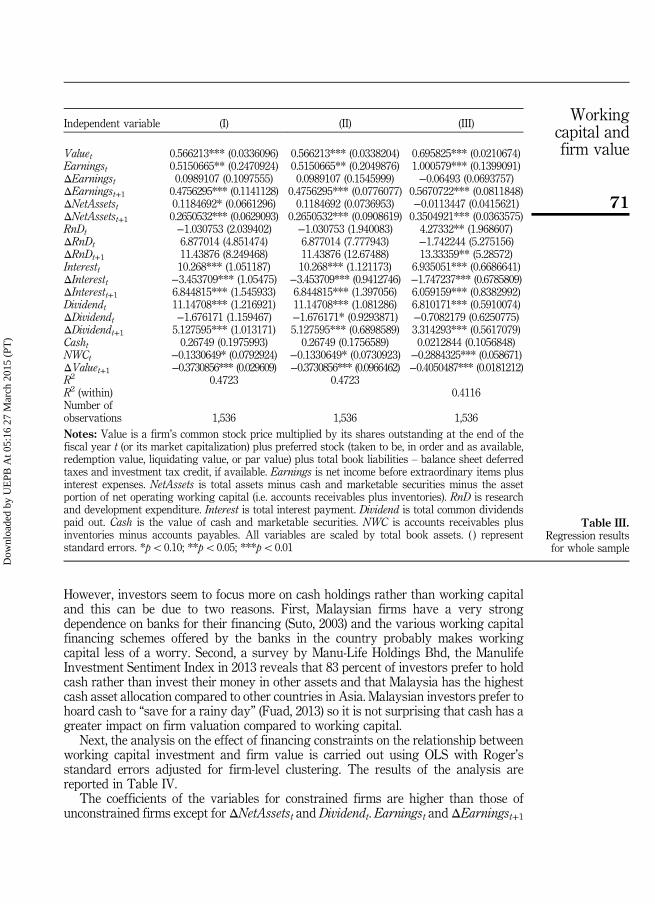
Table III reports the results of the various regression analyses. The results for themodel (Equation (1)) using the OLS technique with Rogers (1994) standard errorsclustered across firm level are presented in Column (I). As a robustness check, when thestandard errors are clustered by firm and year (Column II), the results are quite similar.Finally, Column (III) presents the results of the fixed effects model.
Earningst and ΔEarningst+1 are significant at least at the 5 percent level butΔEarningst is found to be insignificant. ΔNetAssetst has a positive effect on firm valuebut is only significant at the 10 percent level while ΔNetAssetst+1 is significant at the 1percent level. RnDt, ΔRnDt and ΔRnDt+1 are insignificant as is expected. Interestt,ΔInterestt and ΔInterestt+1 are all highly significant at the 1 percent level but whileInterestt and ΔInterestt+1 are positively related to firm, ΔInterestt is negatively related.Dividendt and ΔDividendt+1 positively affect firm value and are highly significant butΔDividendt is negatively related and is significant only at the 10 percent level. The levelof cash holdings, Casht, is found to be insignificant in affecting firm value.
Net operating working capital (NWCt), the variable of interest, has a negative impacton firm value and is significant at the 10 percent level. An interesting point to note isthat despite the higher investment in working capital compared to cash, the absolutevalues of the coefficient and beta coefficient for Casht are found to be about two timeshigher than those of NWCt, indicating the greater impact of cash on firm valuation.This is also found by Autukaite and Molay (2011) and Kieschnick et al. (2013).
High levels of working capital were observed in the summary statistics presentedearlier, possible due to inefficient management of working capital or a result of thefirm’s investment in liquidity. Given the negative relationship found in this study andMalaysian firms’ working capital performance so far, the former seems to be the case.
70
IJMF11,1
Dow
nloa
ded
by U
EPB
At 0
5:16
27
Mar
ch 2
015
(PT
)
However, investors seem to focus more on cash holdings rather than working capitaland this can be due to two reasons. First, Malaysian firms have a very strongdependence on banks for their financing (Suto, 2003) and the various working capitalfinancing schemes offered by the banks in the country probably makes workingcapital less of a worry. Second, a survey by Manu-Life Holdings Bhd, the ManulifeInvestment Sentiment Index in 2013 reveals that 83 percent of investors prefer to holdcash rather than invest their money in other assets and that Malaysia has the highestcash asset allocation compared to other countries in Asia. Malaysian investors prefer tohoard cash to “save for a rainy day” (Fuad, 2013) so it is not surprising that cash has agreater impact on firm valuation compared to working capital.
Next, the analysis on the effect of financing constraints on the relationship betweenworking capital investment and firm value is carried out using OLS with Roger’sstandard errors adjusted for firm-level clustering. The results of the analysis arereported in Table IV.
The coefficients of the variables for constrained firms are higher than those ofunconstrained firms except for ΔNetAssetst and Dividendt. Earningst and ΔEarningst+1
Independent variable (I) (II) (III)
Valuet 0.566213*** (0.0336096) 0.566213*** (0.0338204) 0.695825*** (0.0210674)Earningst 0.5150665** (0.2470924) 0.5150665** (0.2049876) 1.000579*** (0.1399091)ΔEarningst 0.0989107 (0.1097555) 0.0989107 (0.1545999) −0.06493 (0.0693757)ΔEarningst+1 0.4756295*** (0.1141128) 0.4756295*** (0.0776077) 0.5670722*** (0.0811848)ΔNetAssetst 0.1184692* (0.0661296) 0.1184692 (0.0736953) −0.0113447 (0.0415621)ΔNetAssetst+1 0.2650532*** (0.0629093) 0.2650532*** (0.0908619) 0.3504921*** (0.0363575)RnDt −1.030753 (2.039402) −1.030753 (1.940083) 4.27332** (1.968607)ΔRnDt 6.877014 (4.851474) 6.877014 (7.777943) −1.742244 (5.275156)ΔRnDt+1 11.43876 (8.249468) 11.43876 (12.67488) 13.33359** (5.28572)Interestt 10.268*** (1.051187) 10.268*** (1.121173) 6.935051*** (0.6686641)ΔInterestt −3.453709*** (1.05475) −3.453709*** (0.9412746) −1.747237*** (0.6785809)ΔInterestt+1 6.844815*** (1.545933) 6.844815*** (1.397056) 6.059159*** (0.8382992)Dividendt 11.14708*** (1.216921) 11.14708*** (1.081286) 6.810171*** (0.5910074)ΔDividendt −1.676171 (1.159467) −1.676171* (0.9293871) −0.7082179 (0.6250775)ΔDividendt+1 5.127595*** (1.013171) 5.127595*** (0.6898589) 3.314293*** (0.5617079)Casht 0.26749 (0.1975993) 0.26749 (0.1756589) 0.0212844 (0.1056848)NWCt −0.1330649* (0.0792924) −0.1330649* (0.0730923) −0.2884325*** (0.058671)ΔValuet+1 −0.3730856*** (0.029609) −0.3730856*** (0.0966462) −0.4050487*** (0.0181212)R2 0.4723 0.4723R2 (within) 0.4116Number ofobservations 1,536 1,536 1,536Notes: Value is a firm’s common stock price multiplied by its shares outstanding at the end of thefiscal year t (or its market capitalization) plus preferred stock (taken to be, in order and as available,redemption value, liquidating value, or par value) plus total book liabilities – balance sheet deferredtaxes and investment tax credit, if available. Earnings is net income before extraordinary items plusinterest expenses. NetAssets is total assets minus cash and marketable securities minus the assetportion of net operating working capital (i.e. accounts receivables plus inventories). RnD is researchand development expenditure. Interest is total interest payment. Dividend is total common dividendspaid out. Cash is the value of cash and marketable securities. NWC is accounts receivables plusinventories minus accounts payables. All variables are scaled by total book assets. ( ) representstandard errors. *po0.10; **po0.05; ***po0.01
Table III.Regression resultsfor whole sample
71
Workingcapital andfirm value
Dow
nloa
ded
by U
EPB
At 0
5:16
27
Mar
ch 2
015
(PT
)
are found to be significant at the 5 percent level for constrained firms but not forunconstrained firms where only ΔEarningst+1 is highly significant at the 1 percentlevel. Also, the coefficient of Earningst is found to be about four times higher forconstrained firms compared to unconstrained firms, providing evidence of theemphasis on the current earnings of constrained firms and its impact on firm value.ΔNetAssetst is only found to be significant at the 5 percent level for unconstrainedfirms (0.027) and its value is about five times higher for unconstrained firms comparedto constrained firms. ΔNetAssetst+1 is found to be highly significant for both groups offirms. RnDt remains insignificant but ΔRnDt+1 is valued higher for unconstrainedfirms (13.78704 vs 5.731597). Interestt is highly significant at the 1 percent level (0.000)for both types of firms but is valued higher for constrained firms. ΔInterestt andΔInterestt+1 are highly significant for constrained firms while ΔInterestt is found to beinsignificant for unconstrained firms. For dividend payout, Dividendt is significant forboth types of firms (0.000) and valued higher for unconstrained firms but ΔDividendt isfound to be insignificant for both groups. ΔDividendt+1 is highly significant at 1percent level for unconstrained firms (0.000) and significant only at the 10 percent levelfor constrained firms (0.080). Comparing the β for dividend and leverage, it is found
Valuet 0.5453237*** (0.0364311) 0.6789041*** (0.0528927)Earningst 0.279074 (0.2887286) 0.0494726 1.032394** (0.3973839) 0.2378187ΔEarningst 0.109071 (0.1249747) 0.0225195 −0.0097151 (0.1773167) −0.0029455ΔEarningst+1 0.4095711*** (0.133675) 0.0831602 0.4561431** (0.199153) 0.1315013ΔNetAssetst 0.1468655** (0.0658982) 0.0542064 0.0295572 (0.1438707) 0.0129399ΔNetAssetst+1 0.267156*** (0.0675901) 0.1137543 0.2711409** (0.1116747) 0.1497597RnDt −0.1013369 (2.909623) −0.0009356 −3.579204 (2.78942) −0.0600281ΔRnDt 4.723101 (6.215433) 0.0098513 6.803359 (8.115966) 0.0276125ΔRnDt+1 13.78704 (13.26642) 0.027276 5.731597 (8.441455) 0.0225068Interestt 9.879356*** (1.170826) 0.4294204 11.00729*** (1.508593) 0.5610475ΔInterestt −2.014756** (0.970264) −0.0389912 −2.837657 (1.882731) −0.0682397ΔInterestt+1 8.385116*** (1.474612) 0.1531843 7.202548*** (2.715027) 0.1576336Dividendt 13.5613*** (1.181336) 0.7116205 5.819514*** (1.407456) 0.3514431ΔDividendt −1.435492 (1.366716) −0.0308984 −2.290532 (1.501224) −0.0620429ΔDividendt+1 5.84265*** (1.369711) 0.1483162 2.484647* (1.400203) 0.078145Casht 0.1770026 (0.2326952) 0.0449501 0.3011916 (0.2726363) 0.0886028NWCt −0.1153393 (0.0889828) −0.0534145 −0.2844592** (0.1323927) −0.1697676ΔValuet+1 −0.367934*** (0.0320238) −0.2907256 −0.403871*** (0.0675517) −0.422968No. of observations 1,115 421R2 0.5360 0.4364Notes: Value is a firm’s common stock price multiplied by its shares outstanding at the end of thefiscal year t (or its market capitalization) plus preferred stock (taken to be, in order and as available,redemption value, liquidating value, or par value) plus total book liabilities – balance sheet deferredtaxes and investment tax credit, if available. Earnings is net income before extraordinary items plusinterest expenses. NetAssets is total assets minus cash and marketable securities minus the assetportion of net operating working capital (i.e. accounts receivables plus inventories). RnD is researchand development expenditure. Interest is total interest payment. Dividend is the value of total dividendspaid out. Cash is the value of cash and marketable securities. NWC is the value of accounts receivablesplus inventories minus accounts payables. All variables are scaled by total book assets. ( ) representstandard errors. *po0.10; **po0.05; ***po0.01
that dividend has a greater influence on firm value for unconstrained firms butleverage is more influential for constrained firms. Casht is found to be insignificant inaffecting firm value but is valued higher (by about two times) for constrained firms.
NWCt is significant at the 5 percent level for constrained firms but insignificant forunconstrained firms with the absolute value being higher for constrained firmscompared to unconstrained firms, implying that the contribution of NWC to firm valueis more important and higher for constrained firms compared to unconstrained firms.
7. Discussion of findingsThe results of the entire sample are in line with the results of Luo et al. (2009) andAutukaite and Molay (2011) but contrary to that of Kieschnick et al. (2008). The resultsimply that investors prefer firms which follow a more restrictive working capital policy,hence associate a higher value to firms with lower investment in NWC. For every 1Ringgit invested in NWC, a drop of 13 cents in firm value is found to occur.
However, according to Fazzari and Petersen (1993), the investment in workingcapital is extremely sensitive to financing constraints. From the mean values of bothgroups of firms, constrained firms are found to have higher mean values for allvariables (at time t) except for investment in net assets (ΔNetAssetst). This is expecteddue to the financing constraints faced by these firms, making it difficult to makeadditional investment in assets.
The results of the regression analysis also show that similar to Faulkender andWang’s (2006) findings, there are differences between constrained and unconstrainedfirms with values being higher for constrained firms generally. The significance ofEarningst for constrained firms only and the significance ΔEarningst+1 forunconstrained firms implies that given the ease of access to the capital market byunconstrained firms, the future earnings, which are a result of the firm’s efficient use ofcapital, become an important focus. Since constrained firms are having difficulty inraising funds, their current earnings, which is a source of cash flow, is significant andvalued higher. Current net asset investment (ΔNetAssetst) is significant and is valuedhigher for unconstrained firms but not for constrained firms, indicating the importanceof current investment by unconstrained firms. Confirming the result of Faulkender andWang (2006), future net asset investment (ΔNetAssetst+1) is significant for both groupsbut has a larger impact on the value of constrained firms. This verifies the need for bothtypes of firms to use the funds that they can raise for investment purposes in order togenerate higher value although the focus for constrained firms seems to be on future,rather than current, investment.
Changes in future leverage and dividends are valued higher for unconstrained firms.The mean value for Interestt is found to be significantly lower for constrained firms butdespite lower interest payments, every Ringgit of interest paid is valued higher. Higherinterest payments can mean higher tax shields and hence reduction in amount of taxpaid leads to higher cash flow available to the firm. Higher interest payments can alsobe an indication of the signaling theory at work, where these signal a positive future forthe firm. Given the financing constraints faced by constrained firms, their ability tosecure debt may indicate the confidence of these firms with regards to their future sincea firm which is constrained financially will not take on debt unless it is confident of itsability to repay the debt payments in the future. Hence higher valuation is assigned toconstrained firms.
Given the possible future opportunities, higher dividends on the other hand will onlyresult in cash outflow and hence dividend payments made by constrained firms are
73
Workingcapital andfirm value
Dow
nloa
ded
by U
EPB
At 0
5:16
27
Mar
ch 2
015
(PT
)
valued lower compared to unconstrained firms, a result also found by Faulkender andWang (2006). However, dividend payments are still important to investors, whether it ismade by constrained or unconstrained firms hence the high significance attached to it.Dividends are found to have the highest influence on firm value for the entire sampleand this indicates Malaysian investors’ preference for dividends. However, becauseunconstrained firms are able to secure funding easily, they are expected to payouthigher dividends and their dividend payments are valued higher.
It is found that Casht is insignificant for both groups of firms but its beta is higherfor constrained firms indicating that despite its insignificance, the contribution of thelevel of cash to firm value is quite high especially for constrained firms.
On the other hand, NWC, NWCt, is found to be highly significant for constrainedfirms but not for unconstrained firms. The (absolute) values assigned to the NWC ofconstrained firms are higher by about twice that of unconstrained firms, confirming theimportance placed by investors on efficient working capital management as an avenueto free up cash in order to obtain more capital for investment purposes especially forfirms facing difficulties in obtaining financing externally.
Taken altogether, the findings are consistent with Malaysian investors’ favorablereaction to a constrained firm’s ability to increase its current cash flow through higherearnings, higher interest payments (to save cash flow through taxes), lower dividends(compared to constrained firms), higher liquidity via higher cash retention and lowerinvestment in NWC, probably in anticipation to the future investment opportunitiesavailable to these firms since Malaysian investors’ financial priority is to “save for arainy day” (Fuad, 2013). For unconstrained firms, investment and debt are importantbut dividends are of more importance possibly to reduce free cash flow. Therefore,although Malaysian investors prefer to save for a rainy day, weak legal protection andpoor corporate governance environment in Malaysia (Mitton, 2002; Ming and Gee,2008) may be the reasons for the need to reduce free cash flow to avoid agencyproblems in unconstrained firms. Hence, liquidity is not as important for unconstrainedfirms as is observed from the results of cash and NWC.
8. ConclusionThe high levels of investment in working capital by firms in Malaysia raises thequestion of the likely impact it has on firm value. Hence, the objective of this study is tounderstand the impact of working capital investment on firm value in Malaysia. Usingdata from 192 firms over a period of eight years (from year 2000 to 2007), therelationship between working capital investment and firm value is studied. Results ofmultiple regression analysis show that firm value is significantly increased byimprovements in working capital management and this is particularly true forfinancially constrained firms. On the other hand, working capital efficiency is not foundto improve firm value for financially unconstrained firms.
This study contributes to the scarce global literature on working capital valuation.While most studies have valued working capital through its contribution toprofitability, this study considers its contribution to firm value, a fundamental issue infinance and one not yet studied in the Malaysian context. The results of this studyshow that investors regard investment in NWC as important in determining firm valueand prefer it to be at its minimum. Hence, managers should be aware that an avenue forincreasing firm value is efficient management of working capital. While the results areimportant for managers, they are also useful for investors. It is obvious that NWCinvestment does affect firm value significantly hence it is important for investors to
74
IJMF11,1
Dow
nloa
ded
by U
EPB
At 0
5:16
27
Mar
ch 2
015
(PT
)
evaluate companies not just based on their capital structure, dividend and investmentpolicies but also their working capital policy in order to choose the best investment options.
Limitations of the study and suggestions for future researchThis study being a first for the Malaysian market does not consider a few things whichcan be worked on in future research. This study considers the effect of financingconstraints on the relationship between working capital and firm value but does notconsider the possible interactions between working capital and the other variables suchas earnings, dividend policy and capital structure policy which may provide a clearerunderstanding of the direct/indirect impact of NWC on firm value. This study also doesnot consider organizational characteristics such as perceived environment uncertainty,budgetary control, organizational structure, information technology and organizationalculture which may influence the results. It also does not use the Faulkender and Wang(2006) model as is done by Kieschnick et al. (2013) and Autukaite and Molay (2011) butinstead uses the Fama and French (1998) model due to the unavailability of suitablebenchmark portfolios required by the Faulkender and Wang (2006) model. Hence, it ishoped that future research on working capital valuation will consider these issues andfurther add to the literature on working capital.
References
Abdul Hamid, A.B. (2003), “Vendor development program among small and mediumindustries (SMIs): a Malaysian experience”, Jurnal Kemanusiaan, Vol. 2 No. 1,pp. 163-177.
Autukaite, R. and Molay, E. (2011), “Cash holdings, working capital and firm value: evidence fromFrance”, 28th International Conference of French Finance Association, Montpellier.
Baños-Caballero, S., García-Teruel, P.J. and Martínez-Solano, P. (2009), “How do marketimperfections affect working capital management”, in EC Series, Valencian Institute ofEconomic Research, Valencia, pp. 3-25.
Baños-Caballero, S., García-Teruel, P.J. and Martínez-Solano, P. (2011), Working CapitalManagement, Corporate Performance and Financial Constraints, Fundacion de Las Cajasde Ahorros, Madrid.
Bates, T.W., Kahle, K.M. and Stulz, R.M. (2009), “Why do US firms hold so much more cash thanthey used to?”, Journal of Finance, Vol. 64 No. 5, pp. 1985-2021.
Beaumont, S.M. and Begemann, E. (1997), “Measuring associations between working capitaland return on investment”, South African Journal of Business Management, Vol. 28 No. 1,pp. 1-5.
Bender, R. and Ward, K. (2009), Corporate Financial Strategy, 3rd ed., Elsevier Butterworth-Heinemann, Oxford, p. 378.
Berk, J., DeMarzo, P. and Harford, J. (2009), Fundamentals of Corporate Finance, PearsonEducation Inc., Boston, MA, p. 737.
Brigham, E. and Daves, P. (2007), Intermediate Financial Management, 9th ed., ThomsonLearning, Mason, OH.
Chen, N. (2009), “Corporate liquidity in emerging markets: a retrospect of Asian financial crisis”,17th Conference on the Theories and Practices of Securities and Financial Markets,Kaohsiung.
Crane, S. (2001), “The great cash hunt”, available at: www.cfoasia.com/archives/2001020-28.htm(accessed March 25, 2008).
Deloof, M. (2003), “Does working capital management affect profitability of Belgian firms?”,Journal of Business Finance and Accounting, Vol. 30 Nos 3/4, pp. 573-587.
Drobetz, W., Gruninger, M.C. and Hirschvogl, S. (2010), “Information asymmetry and the value ofcash”, Journal of Banking and Finance, Vol. 34 No. 9, pp. 2168-2184.
Eljelly, A.M.A. (2004), “Liquidity-profitability tradeoff: an empirical investigation in anemerging market”, International Journal of Commerce and Management, Vol. 18 No. 2,pp. 48-61.
Erasmus, P.D. (2010a), “The relationship between working capital management andprofitability for South African listed industrial firms”, The Business Review, Vol. 15No. 1, pp. 193-198.
Erasmus, P.D. (2010b), “Working capital management and profitability: the relationshipbetween the net trade cycle and return on assets”, Management Dynamics, Vol. 19 No. 1,pp. 2-10.
Fama, E.F. and French, K.R. (1998), “Taxes, financing decisions, and firm value”, Journal ofFinance, Vol. 53 No. 3, pp. 819-843.
Faulkender, M. andWang, R. (2006), “Corporate financial policy and the value of cash”, Journal ofFinance, Vol. 61 No. 4, pp. 1957-1990.
Fazzari, S.M. and Petersen, B. (1993), “Working capital and fixed investment: new evidence onfinancing constraints”, Rand Journal of Economics, Vol. 24 No. 3, pp. 328-342.
Fuad, M. (2013), “Malaysians prefer to Hoard Cash”, The Edge, Kuala Lumpur, April 24, availableat: www.theedgemalaysia.com/business-news/236864-malaysians-prefer-to-hoard-cash.html(accessed September 14, 2013).
García-Teruel, P.J. and Martinez-Solano, P. (2007), “Effects of working capital management onSME profitability”, International Journal of Managerial Finance, Vol. 3 No. 2, pp. 164-177.
Ghosh, S.K. and Maji, S.G. (2004), “Working capital management efficiency: a study on the Indiancement industry”, Management Accountant, Vol. 39 No. 5, pp. 363-372.
Harford, J., Mansi, S.A. and Maxwell, W.F. (2008), “Corporate governance and firm cash holdingsin the US”, Journal of Financial Economics, Vol. 87 No. 3, pp. 535-555.
Havoutis, N. (2003), Optimising Working Capital: The Latest Solutions, JP Morgan, New York, NY.
Hill, M.D., Kelly, G.W. and Highfield, M.J. (2010), “Net operating working capital behavior: a firstlook”, Financial Management, Vol. 39 No. 2, pp. 783-805.
Isa, M. (1992), “Dividend policies and practices of listed Malaysian companies”, SecuritiesIndustry Review, Vol. 18 No. 1, pp. 53-64.
Isshaq, Z., Bokpin, G.A. and Onumah, J.M. (2009), “Corporate governance, ownership structure,cash holdings, and firm value on the Ghana Stock Exchange”, The Journal of Risk Finance,Vol. 10 No. 5, pp. 488-499.
Kalcheva, I. and Lins, K.V. (2007), “International evidence on cash holdings and expectedmanagerial agency problems”, Review of Financial Studies, Vol. 20 No. 4, pp. 1087-1112.
Kester, G.W. and Isa, M. (1994), “Capital structure policy in Malaysia: a comparative analysis”,Capital Markets Review, Vol. 2 No. 2, pp. 1-16.
Kieschnick, R., LaPlante, M. and Moussawi, R. (2008), “Working capital management, agency costs,and firm value”, Financial Management Association Annual Meeting, Financial ManagementAssociation, Grapevine, TX, available at: www.fma.org/Texas/Papers/valnowc_fma2008.pdf(accessed August 9, 2009).
Kieschnick, R., Laplante, M. and Moussawi, R. (2013), “Working capital management andshareholders’ wealth”, Review of Finance, Vol. 17 No. 5, pp. 1827-1852.
Lazaridis, I. and Tryfonidis, D. (2006), “Relationship between working capital management andprofitability of listed companies in the athens stock exchange”, Journal of FinancialManagement and Analysis, Vol. 19 No. 1, pp. 26-35.
Lee, K.W. and Lee, C.F. (2009), “Cash holdings, corporate governance structure and firm valuation”,Review of Pacific Basin Financial Markets and Policies, Vol. 12 No. 3, pp. 475-508.
Leenders, M. (1989), “Supplier development”, Journal of Purchasing and Materials Management,Spring, Vol. 25 No. 1, pp. 47-55.
Lian, L.W. (2011), “Get rid of market anomalies and monopolies, say economists”, The MalaysianInsider, Kuala Lumpur, April 19, available at: www.themalaysianinsider.com/malaysia/article/get-rid-of-market-anomalies-and-monopolies-say-economists (accessed September 14, 2013).
Luo, M.M., Lee, J.J.-Y. and Hwang, Y. (2009), “Cash conversion cycle, firm performance and stockvalue”, Financial Management Association Annual Meeting, October 21-24, Reno-LakeTahoe, available at: www.fma.org/Reno/Papers/CCC_performance_value_FMA.pdf
Luo, Q. and Hachiya, T. (2005), “Corporate governance, cash holdings, and firm value: evidencefrom Japan”, Review of Pacific Basin Financial Markets and Policies, Vol. 8 No. 4, pp. 613-636.
Lyroudi, K. and Lazaridis, J. (2000), The cash conversion cycle and liquidity analysis of the foodindustry in Greece, European Financial Management Association, Athens.
Malaysia Airlines (2008), Five Star Value Carrier: Business Transformation Plan (BTP2), KualaLumpur.
Ming, T.C. and Gee, C.S. (2008), “The influence of ownership structure on the corporateperformance of Malaysian public listed companies”, ASEAN Economic Bulletin, Vol. 25No. 2, pp. 195-208.
Mitton, T. (2002), “A cross-firm analysis of the impact of corporate governance on the East Asianfinancial crisis”, Journal of Financial Economics, Vol. 64 No. 2, pp. 215-242.
Mohamad, N.E.A. and Saad, N.M. (2010), “Working capital management: the effect of marketvaluation and profitability in Malaysia”, International Journal of Business and Management,Vol. 5 No. 11, pp. 140-147.
Moss, J.D. and Stein, B. (1993), “Cash conversion cycle and firm size”,Managerial Finance, Vol. 19No. 8, pp. 25-34.
Mukhopadhyay, D. (2004), “Working capital management in heavy engineering firms – a casestudy”, Management Accountant, Vol. 39 No. 4, pp. 317-323.
Petersen, M.A. (2009), “Estimating standard errors in finance panel data sets: comparingapproaches”, The Review of Financial Studies, Vol. 22 No. 1, pp. 435-634.
Pinkowitz, L. and Williamson, R. (2007), “What is the market value of a dollar of corporate cash?”,Journal of Applied Corporate Finance, Vol. 19 No. 3, pp. 74-81.
Pinkowitz, L., Stulz, R. and Williamson, R. (2006), “Does the contribution of corporate cashholdings and dividends to firm value depend on governance? A cross-country analysis”,Journal of Finance, Vol. 61 No. 6, pp. 2725-2751.
Ramachandran, A. and Janakiraman, M. (2009), “The relationship between working capitalmanagement efficiency and EBIT”, Managing Global Transitions, Vol. 7 No. 1, pp. 61-74.
Rappaport, A. (1998), Creating Shareholder Value, The Free Press, New York, NY.
Rogers, W. (1994), “Regression standard errors in clustered samples”, Stata Technical Bulletin,Vol. 3 No. 13, pp. 19-23.
Ross, S.A., Westerfield, R.W., Jaffe, J. and Jordan, B.D. (2009),Modern Financial Management, 8thed., McGraw-Hill, New York, NY.
Salek, J.G. (2005), Accounts Receivable Management Best Practices, John Wiley & Sons, Hoboken,NJ.
Samiloglou, F. and Demirgunes, K. (2008), “The effect of working capital management on firmprofitability: evidence from Turkey”, International Journal of Applied Economics andFinance, Vol. 2 No. 1, pp. 44-50.
Shin, H.H. and Soenen, L. (1998), “Efficiency of working capital management and corporateprofitability”, Financial Practice and Education, Vol. 8 No. 2, pp. 37-45.
Shin, H.H. and Soenen, L. (2000), “Liquidity management or profitability – is there room forboth?”, AFP Exchange, Vol. 20 No. 2, pp. 46-49.
Soenen, L.A. (1993), “Cash conversion cycle and corporate profitability”, Journal of CashManagement, Vol. 13 No. 4, pp. 53-57.
Strischek, D. (2003), “The impact of working capital investment on the value of a company”, TheRMA Journal, Vol. 85 No. 7, pp. 48-55.
Suto, M. (2003), “Capital structure and investment behaviour of Malaysian firms in the 1990s: astudy of corporate governance before the crisis”, Corporate Governance, Vol. 11 No. 1,pp. 25-39.
Tung, S., Lan-Fen, W., Chen-Chang, L., Ching-Hui, L. and Hsu, A. (2008), “The use of extendedcredit (channel stuffing) to avoid reporting losses”, Asia-Pacific Journal of Accounting andEconomics, Vol. 15 No. 2, pp. 161-182.
Wang, Y.-J. (2002), “Liquidity management, operating performance, and corporate value:evidence from Japan and Taiwan”, Journal of Multinational Financial Management, Vol. 12No. 2, pp. 159-169.
Wasiuzzaman, S. and Arumugam, V.C. (2013), “Determinants of working capital investment: astudy of Malaysian public listed firms”, Australasian Accounting Business and FinanceJournal, Vol. 7 No. 2, pp. 49-70.
Zariyawati, M.A., Annuar, M.N., Taufiq, H. and Rahim, A.S.A. (2009), “Working capitalmanagement and corporate performance: case of Malaysia”, Journal of Modern Accountingand Auditing, Vol. 5 No. 11, pp. 47-54.
About the authorDr Shaista Wasiuzzaman is a Senior Lecturer at the Multimedia University, Cyberjaya, Malaysia.She teaches finance subjects at the university. She has published various articles related tocorporate finance, financial markets and Islamic banking in peer-reviewed journals andconferences. Dr Shaista Wasiuzzaman can be contacted at: [email protected]
Variable Measurement Source
Firm Value (Value) Firm’s common stock price * shares outstanding atthe end of the fiscal year t (or its marketcapitalization) + preferred stock (taken to be, inorder and as available, redemption value, liquidatingvalue, or par value) + total book liabilities - balancesheet deferred taxes and investment tax credit,if available.
Fama and French (1998)
Earnings(Earnings)
Net income before extraordinary items + interestexpenses + (when available) income statementdeferred tax credits plus investment tax credits,if available
Fama and French (1998)
Net Asset(NetAssets)
Total assets minus cash and marketable securities -the asset portion of net operating working capital(i.e. accounts receivables + inventories)
Kieschnick et al. (2008a)
R&D Expenditure(RnD)
Research and development expenses Fama and French (1998)and Pinkowitz et al. (2006)
Interest Expenses(Interest)
Interest payment Fama and French (1998)
Dividends(Dividend)
Common dividends paid out Pinkowitz et al. (2006)
Cash (Cash) Cash and marketable securities Kieschnick et al. (2008a)Net OperatingWorking Capital(NWC)
For instructions on how to order reprints of this article, please visit our website:www.emeraldgrouppublishing.com/licensing/reprints.htmOr contact us for further details: [email protected]