Page 1
WORKING CAPITAL MANAGEMENT
PROJECT REPORT
Submitted in partial fulfilment of the requirement for the award of Two year full time, Masters in Business Administration.
By
Sudhir Kumar
DEPARTMENT OF MANAGEMENT
LOVELY PROFESSIONAL UNIVERSITY
PHAGWARA
(2008-2010)
1
Page 2
Summer Project-2009 Working Capital Management
Acknowledgement
Whatever we do and whatever we achieve during the course of our limited life
is just not done only by our own efforts, but by efforts contributed by other
people associated with us indirectly or directly. I thank all those people who
contributed to this from the very beginning till its successful end.
I sincerely thank Mr. Ashutosh Aggarwal (Account Executive, PepsiCo,
Phillaur), person of amiable personality, for assigning such a challenging
project work which has enriched my work experience and getting me
acclimatized in a fit and final working ambience in the premises of PEPSICO.
I acknowledge my gratitude to Ms. Harjeet Kaur (Lovely Professional
University), for her extended guidance, encouragement, support and reviews
without whom this project would not have been a success.
Last but not the least I would like to extend my thanks to all the employees at
PEPSICO (Aradhna Drinks & Beverages Pvt. Ltd) and my friends for their
cooperation, valuable information and feedback during my project.
Lovely Professional University 2
Page 3
Summer Project-2009 Working Capital Management
TABLE OF CONTENTS
1. EXECUTIVE SUMMARY 5-6
2. LITERATURE REVIEW 7-12
3. ABOUT THE COMPANY 13-29
a. Company profile 14
b. Mission & Vision 18
c. Company Leadership 19
d. Company Brands 20
e. Milestones 24
f. Company Profile in India 26
4. WORKING CAPITAL MANAGEMENT 30-37
a. Introduction 31
b. Working Capital Analysis 33
c. Nature & importance of working capital 33
d. The importance of Good Working Capital 34
e. Working Capital Cycle 36
5. ANALYSIS OF WORKING CAPITAL MANAGE 38-43
6. MENT
a. Schedule of changes In working Capital Management 38
b. Percentage change in working capital 40
c. Assessment of working Capital Management 42
7. OBJECTIVE OF THE STUDY 44
Lovely Professional University 3
Page 4
Summer Project-2009 Working Capital Management
8. RESEACH METHODOLOGY 45-46
9. ANALYSIS OF THE STUDY 47-65
a. Analysis of various components 48-56
b. Inventory 48
c. Sundry Debtors 50
d. Cash & Bank Balance 52
e. Current Liability 54
f. Provision Analysis 56
10.WORKING CAPITAL RATIO 57-65
a. Receivable Ratio 58
b. Payable Ratio 59
c. Inventory Ratio 61
d. Current Ratio 62
e. Quick Ratio 64
f. Working capital Ratio 64
11.PROFIT & LOSS ACCOUNT 66
12.INCOME STATEMENT ANALYSIS 67
13.MAJOR FINDINGS 69
14.CONCLUSION 70
15.RECOMMENDATION 73
16.BIBLIOGRAPHY & REFRENCES 76
17.ANNEXTURE 78
Lovely Professional University 4
Page 5
Summer Project-2009 Working Capital Management
Executive Summary
The project on Working Capital Management has been a very good experience.
Every manufacturing company faces the problem of Working Capital
Management in their day to day processes. An organization’s cost can be
reduced and the profit can be increased only if it is able to manage its Working
Capital efficiently. At the same time the company can provide customer
satisfaction and hence can improve their overall productivity and profitability.
This project is a sincere effort to study and analyze the Working Capital
Management of PEPSICO Bottling group. The project was focused on making a
financial overview of the company by conducting a Working Capital analysis of
PEPSICO Bottling group for the years 2006 to 2008 and Ratios & various
components of working capital & for the year 2008 in a cma(cash monitoring
arrangement) format emphasizing on Working Capital.
The internship is a bridge between the institute and the organization. This
made me to be involved in a project that helped me to employ my theoretical
knowledge about the myriad and fascinating facets of finance. And in the
process I could contribute substantially to the organization’s growth.
Lovely Professional University 5
Page 6
Summer Project-2009 Working Capital Management
The experience that I gathered over the past
two months has certainly provided the orientation, which I believe will help me
in shouldering any responsibility in future.
Lovely Professional University 6
Page 7
Summer Project-2009 Working Capital Management
Lovely Professional University 7
Page 8
Summer Project-2009 Working Capital Management
The research done by Pass C.L., Pike R.H., “An overview of working capital management
and corporate financing”,(1984) describes that over the past 40 years major theoretical
developments have occurred in the areas of longer-term investment and financial decision
making. Many of these new concepts and the related techniques are now being employed
successfully in industrial practice. By contrast, far less attention has been paid to the area of
short-term finance, in particular that of working capital management. Such neglect might be
acceptable were working capital considerations of relatively little importance to the firm, but
effective working capital management has a crucial role to play in enhancing the profitability
and growth of the firm. Indeed, experience shows that inadequate planning and control of
working capital is one of the more common causes of business failure.
The research done by Herrfeldt B., “How to Understand Working Capital Management”
describes that“Cash is king”--so say the money managers who share the responsibility of
running this country's businesses. And with banks demanding more from their prospective
borrowers, greater emphasis has been placed on those accountable for so-called working
capital management. Working capital management refers to the management of current or
short-term assets and short-term liabilities. In essence, the purpose of that function is to make
certain that the company has enough assets to operate its business. Here are things you should
know about working capital management.
The research done by, Samiloglu F. and Demirgunes K., “The Effect of Working Capital
Management on Firm Profitability: Evidence from Turkey” (2008) describes that the effect of
working capital management on firm profitability. In accordance with this aim, to consider
statistically significant relationships between firm profitability and the components of cash
conversion cycle at length, a sample consisting of Istanbul Stock Exchange (ISE) listed
manufacturing firms for the period of 1998-2007 has been analysed under a multiple
regression model. Empirical findings of the study show that accounts receivables period,
inventory period and leverage affect firm profitability negatively; while growth (in sales)
affects firm profitability positively.
Lovely Professional University 8
Page 9
Summer Project-2009 Working Capital Management
The research done by, Appuhami, Ranjith B A, “The Impact of Firms' Capital Expenditure on
Working Capital Management: An Empirical Study across Industries in Thailand” ,
International Management Review,(2008), The purpose of this research is to investigate the
impact of firms' capital expenditure on their working capital management. The author used
the data colleted from listed companies in the Thailand Stock Exchange. The study used
Shulman and Cox's (1985) Net Liquidity Balance and Working Capital Requirement as a
proxy for working capital measurement and developed multiple regression models. The
empirical research found that firms' capital expenditure has a significant impact on working
capital management. The study also found that the firms' operating cash flow, which was
recognized as a control variable, has a significant relationship with working capital
management.
The research done by, Hardcastle J., “Working Capital Management”,(2007) describes that
Working capital, sometimes called gross working capital, simply refers to the firm's total
current assets (the short-term ones), cash, marketable securities, accounts receivable, and
inventory. While long-term financial analysis primarily concerns strategic planning, working
capital management deals with day-to-day operations. By making sure that production lines
do not stop due to lack of raw materials, that inventories do not build up because production
continues unchanged when sales dip, that customers pay on time and that enough cash is on
hand to make payments when they are due. Obviously without good working capital
management, no firm can be efficient and profitable.
Lovely Professional University 9
Page 10
Summer Project-2009 Working Capital Management
The research done by, Thachappilly G., “Working Capital Management Manages Flow of
Funds”,(2009) describes that Working capital is the cash needed to carry on operations
during the cash conversion cycle, i.e. the days from paying for raw materials to collecting
cash from customers. Raw materials and operating supplies must be bought and stored to
ensure uninterrupted production. Wages, salaries, utility charges and other incidentals must
be paid for converting the materials into finished products. Customers must be allowed a
credit period that is standard in the business. Only at the end of this cycle does cash flow in
again.
The research done by, Beneda, Nancy; Zhang, Yilei, “Working Capital Management, Growth
and Performance of New Public Companies”, Credit & Financial Management Review,
(2008) examining impact of working capital management on the operating performance and
growth of new public companies. The study also sheds light on the relationship of working
capital with debt level, firm risk, and industry. Using a sample of initial public offerings
(IPO's), the study finds a significant positive association between higher levels of accounts
receivable and operating performance. The study further finds that maintaining control (i.e.
lower amounts) over levels of cash and securities, inventory, fixed assets, and accounts.
The research done by, Dubey R., “Working Capital Management-an Effective Tool for
Organisational Success” (2008) describes that The working capital in a firm generally arises
out of four basic factors like sales volume,technological changes,seasonal , cyclical changes
and policies of the firm.The strenghth of the firm is dependent on the working capital as
discussed earlier but this working capital is inteslf dependent on the level of sales volume of
the firm.The firm requires current assets to support and maintain operational or functional
activities.By current assets we mean the assets which can be converted readily into cash say
within a year such as receivables,inventories and liquid cash.If the level of sales is stable and
towards growth the level of cash,receivables and stock will also be on the high.
Lovely Professional University 10
Page 11
Summer Project-2009 Working Capital Management
The research done by, McClure B., “Working Capital Works” describes that Cash is the
lifeline of a company. If this lifeline deteriorates, so does the company's ability to fund
operations, reinvest and meet capital requirements and payments. Understanding a company's
cash flow health is essential to making investment decisions. A good way to judge a
company's cash flow prospects is to look at its working capital management (WCM). Cash is
king, especially at a time when fund raising is harder than ever. Letting it slip away is an
oversight that investors should not forgive. Analyzing a company's working capital can
provide excellent insight into how well a company handles its cash, and whether it is likely to
have any on hand to fund growth and contribute to shareholder value.
The research done by, Gass D., “How To Improve Working Capital Management” (2006)
"Cash is the lifeblood of business" is an often repeated maxim amongst financial managers.
Working capital management refers to the management of current or short-term assets and
short-term liabilities. Components of short-term assets include inventories, loans and
advances, debtors, investments and cash and bank balances. Short-term liabilities include
creditors, trade advances, borrowings and provisions. The major emphasis is, however, on
short-term assets, since short-term liabilities arise in the context of short-term assets. It is
important that companies minimize risk by prudent working capital management.
The research done by, Maynard E. Rafuse, “ Working capital management: an urgent need to
refocus” Management Decision, (1996) Argues that attempts to improve working capital by
delaying payment to creditors is counter-productive to individuals and to the economy as a
whole. Claims that altering debtor and creditor levels for individual tiers within a value
system will rarely produce any net benefit.Proposes that stock reduction generates system-
wide financial improvements and other important benefits.Urges those organizations seeking
concentrated working capital reduction strategies to focus on stock management strategies
based on “lean supply-chain” techniques.
Lovely Professional University 11
Page 12
Summer Project-2009 Working Capital Management
The research done by, Thomas M. Krueger, “An Analysis of Working Capital Management
Results Across Industries” American Journal of Business, (2005) found distinct levels of
WCM measures for different industries, which tend to be stable over time. Many factors help
to explain this discovery. The improving economy during the period of the study may have
resulted in improved turnover in some industries, while slowing turnover may have been a
signal of troubles ahead. Our results should be interpreted cautiously. Our study takes places
over a short time frame during a generally improving market. In addition, the survey suffers
from survivorship bias – only the top firms within each industry are ranked each year and the
composition of those firms within the industry can change annually.
Lovely Professional University 12
Page 13
Summer Project-2009 Working Capital Management
Lovely Professional University 13
Page 14
Summer Project-2009 Working Capital Management
PepsiCo is a world leader in convenient foods and beverages, with 2008 revenues of more
than $ 13796 Million and 168,000 employees.
The company consists of Frito-Lay North America, PepsiCo Beverages North America,
PepsiCo International and Quaker Foods North America. PepsiCo brands are available in
nearly 200 countries and territories and generate sales at the retail level of about $92 billion.
Some of PepsiCo's brand names are more than 100-years-old, but the corporation is relatively
young. PepsiCo was founded in 1965 through the merger of Pepsi-Cola and Frito-Lay.
Tropicana was acquired in 1998 and PepsiCo merged with the Quaker Oats Company,
including Gatorade, in 2001.
PEPSI is a soft drink produced and manufactured by PepsiCo. It is sold in many places such
as retail stores, restaurants, schools, cinemas and from vending machines. The drink was first
made in the 1890s by pharmacist Caleb Bradham in New Bern, North Carolina. The brand
was trademarked on June 16, 1903. There have been many Pepsi variants produced over the
years since 1898.
In October 2008, Pepsi announced that it would be redesigning its logo and re-branding many
of its products by early 2009. In 2009, Pepsi, Diet Pepsi and Pepsi Max began using all
lower-case fonts for name brands, and Diet Pepsi Max was re-branded as Pepsi Max. The
brand's blue and red globe trademark became a series of "smiles," with the central white band
arcing at different angles depending on the product. As of July 2009, the 2003 Pepsi logo is
still the current logo for Pepsi Wild Cherry and Pepsi ONE. Countries such as Australia and
India continue to use the old design on all packaging. Diet Pepsi Wild Cherry, Pepsi
throwback, Diet Pepsi Lime, and Diet Pepsi Vanilla received the redesign.
Lovely Professional University 14
Page 15
Summer Project-2009 Working Capital Management
ORIGIN
It was first introduced in North Carolina in 1898 by Caleb Bradham, who made it at his
pharmacy which sold the drink. Known back then as "Brad's Drink", it was later named Pepsi
Cola possibly due the digestive enzyme pepsin and kola nuts used in the recipe. Bradham
sought to create a fountain drink that was delicious and would aid in digestion and boost
energy.
In 1903, Bradham moved the bottling of Pepsi-Cola from his drugstore into a rented
warehouse. That year, Bradham sold 7,968 gallons of syrup. The next year, Pepsi was sold in
six-ounce bottles, and sales increased to 19,848 gallons. In 1926, Pepsi received its first logo
redesign since the original design of 1905. In 1929, the logo was changed again. In 1929,
automobile race pioneer Barney Oldfield endorsed Pepsi-Cola in newspaper ads as "A bully
drink...refreshing, invigorating, a fine bracer before a race.
In 1931, the Pepsi-Cola Company went bankrupt during the Great Depression- in large part
due to financial losses incurred by speculating on wildly fluctuating sugar prices as a result of
World War I. Assets were sold and Roy C. Megargel bought the Pepsi trademark. Eight years
later, the company went bankrupt again. Pepsi's assets were then purchased by Charles Guth,
the President of Loft Inc. Loft was a candy manufacturer with retail stores that contained
soda fountains. He sought to replace Coca-Cola at his stores' fountains after Coke refused to
give him a discount on syrup. Guth then had Loft's chemists reformulate the Pepsi-Cola syrup
formula.
Lovely Professional University 15
Page 16
Summer Project-2009 Working Capital Management
Rise
During the Great Depression, Pepsi gained popularity following the introduction in 1936 of a
12-ounce bottle. Initially priced at 10 cents, sales were slow, but when the price was slashed
to five cents, sales increased substantially. With a radio advertising campaign featuring the
jingle "Pepsi-Cola hits the spot / Twelve full ounces, that's a lot / Twice as much for a nickel,
too / Pepsi-Cola is the drink for you," arranged in such a way that the jingle never ends. Pepsi
encouraged price-watching consumers to switch, obliquely referring to the Coca-Cola
standard of six ounces per bottle for the price of five cents (a nickel), instead of the 12 ounces
Pepsi sold at the same price. Coming at a time of economic crisis, the campaign succeeded in
boosting Pepsi's status. In 1936 500,000,000 bottles of Pepsi were consumed. From 1936 to
1938, Pepsi-Cola's profits doubled.
Pepsi's success under Guth came while the Loft Candy business was faltering. Since he had
initially used Loft's finances and facilities to establish the new Pepsi success, the near-
bankrupt Loft Company sued Guth for possession of the Pepsi-Cola company. A long legal
battle, Guth v. Loft, then ensued, with the case reaching the Delaware Supreme Court and
ultimately ending in a loss for Guth.
History
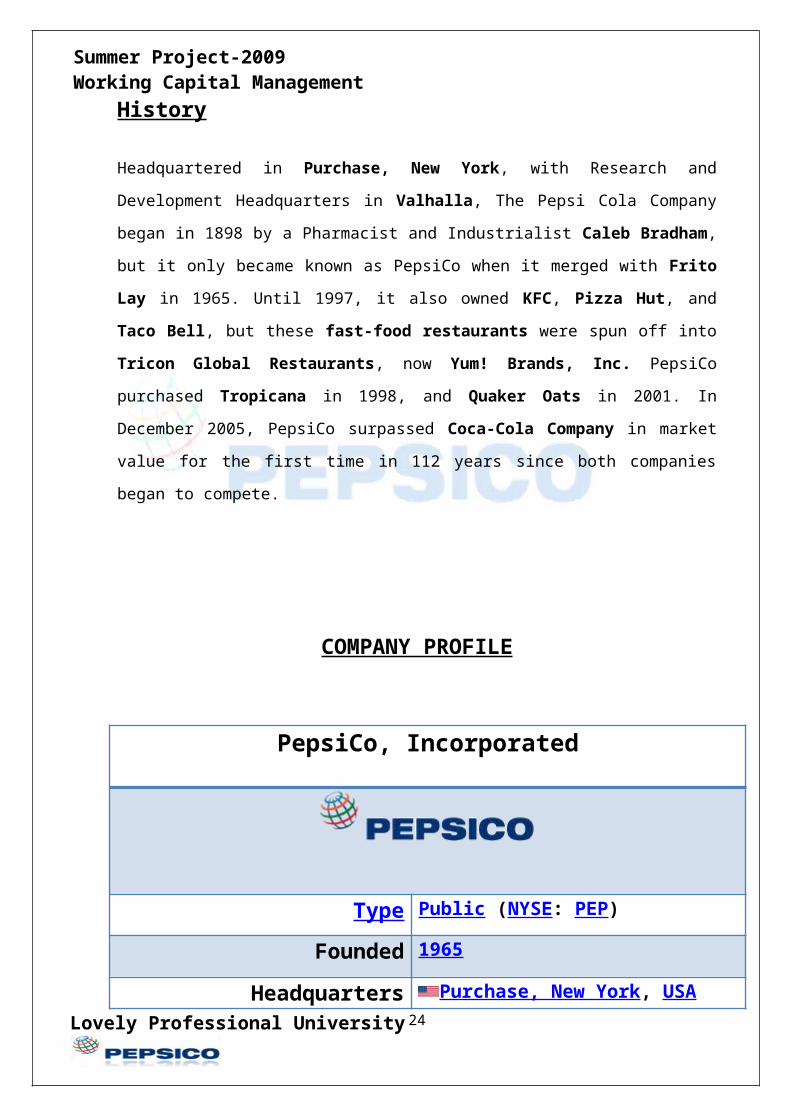
Headquartered in Purchase, New York, with Research and Development Headquarters in
Valhalla, The Pepsi Cola Company began in 1898 by a Pharmacist and Industrialist Caleb
Bradham, but it only became known as PepsiCo when it merged with Frito Lay in 1965.
Until 1997, it also owned KFC, Pizza Hut, and Taco Bell, but these fast-food restaurants
were spun off into Tricon Global Restaurants, now Yum! Brands, Inc. PepsiCo purchased
Tropicana in 1998, and Quaker Oats in 2001. In December 2005, PepsiCo surpassed Coca-
Cola Company in market value for the first time in 112 years since both companies began to
compete.
Lovely Professional University 16
Page 17
Summer Project-2009 Working Capital Management
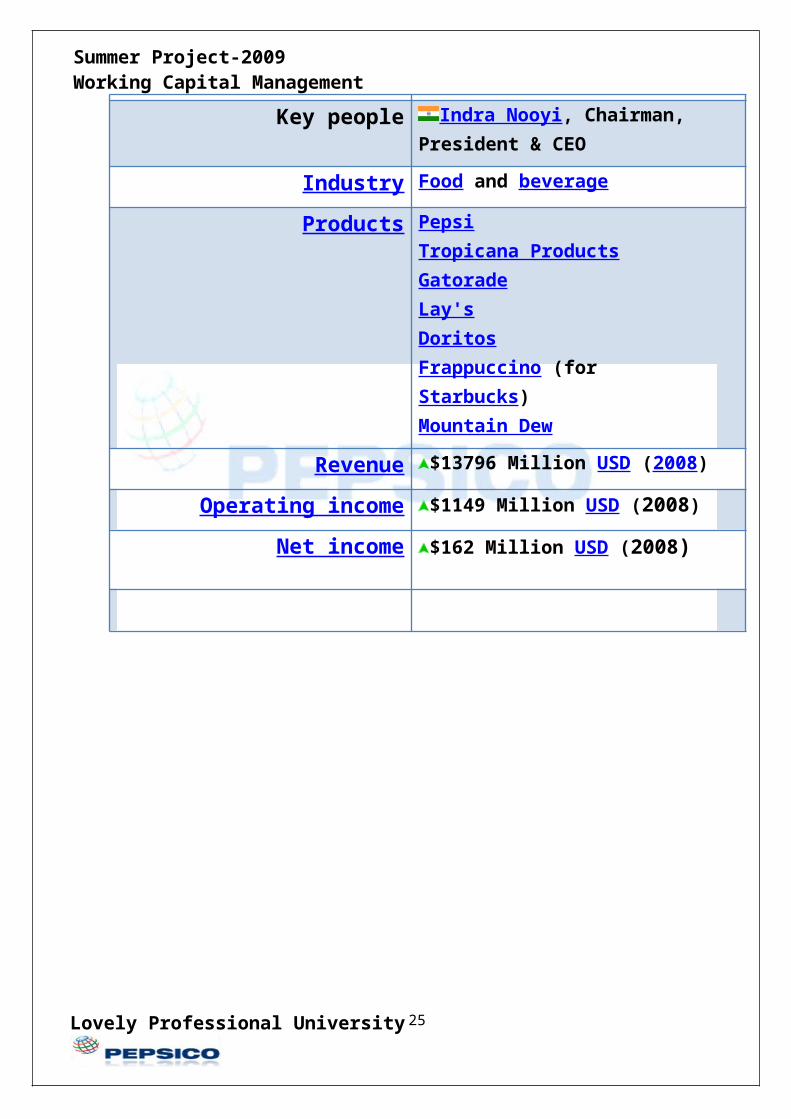
COMPANY PROFILE
PepsiCo, Incorporated
Type Public (NYSE: PEP)
Founded 1965
Headquarters Purchase, New York, USA
Key people Indra Nooyi, Chairman, President & CEO
Industry Food and beverage
Products PepsiTropicana ProductsGatoradeLay'sDoritosFrappuccino (for Starbucks)Mountain Dew
Revenue $13796 Million USD (2008)
Operating income $1149 Million USD (2008)
Net income $162 Million USD (2008)
Lovely Professional University 17
Page 18
Summer Project-2009 Working Capital Management
MISSION & VISION
At PepsiCo, we believe being a responsible corporate citizen is not only the right thing to do,
but the right thing to do for our business.
MISSION
Our mission is to be the world’s premier consumer products focused on convenient foods and
beverages. We seek to produce financial rewards to investors as we provide opportunities for
growth and enrichment to our employee, our business partners and the communities which
we operate. And in everything we do, we strive for honestly, fairness and integrity.
VISION
“PepsiCo responsibility is to continually improve all aspects of the world in which we
operate environment, social, economic – creating a better tomorrow than today”.
Our vision is put in to action through programs and a focus on environmental stewardship,
activities to benefit society, and a commitment to build shareholder value by making PepsiCo
a truly sustainable company.
Lovely Professional University 18
Page 19
Summer Project-2009 Working Capital Management
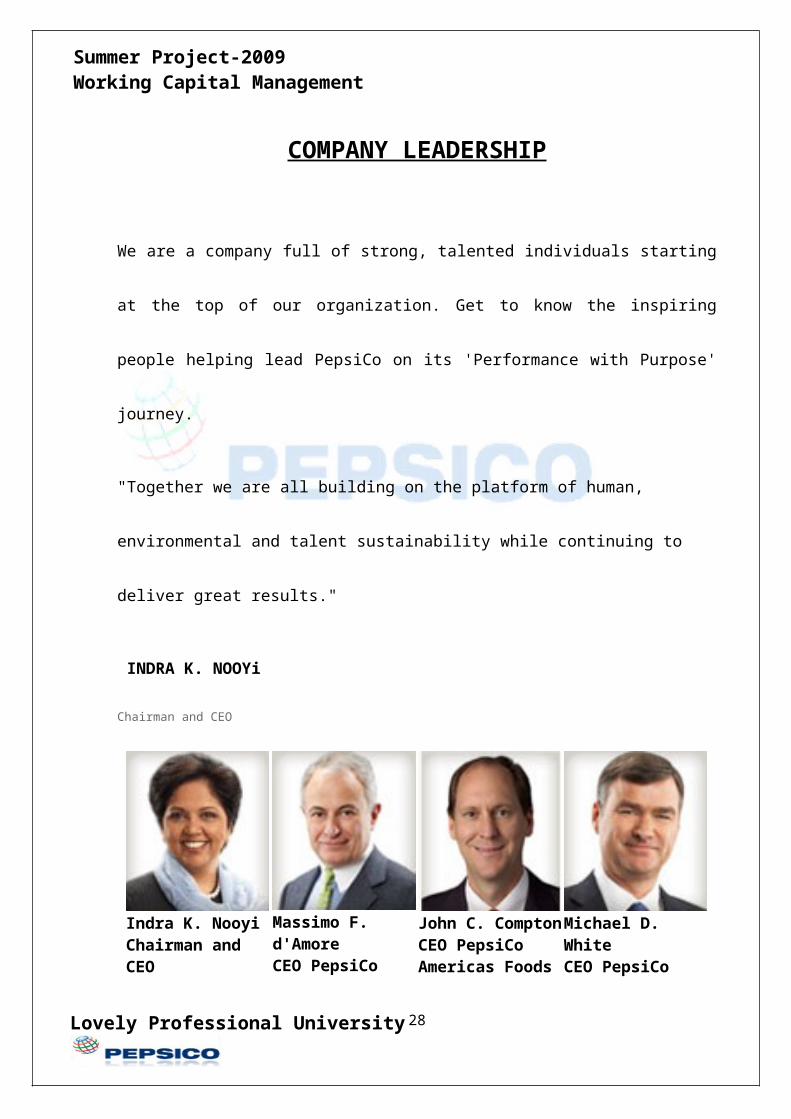
COMPANY LEADERSHIP
We are a company full of strong, talented individuals starting at the top of our organization.
Get to know the inspiring people helping lead PepsiCo on its 'Performance with Purpose'
journey.
"Together we are all building on the platform of human, environmental and talent
sustainability while continuing to deliver great results."
INDRA K. NOOYi
Chairman and CEO
Indra K. NooyiChairman and CEO
Massimo F. d'AmoreCEO PepsiCo Americas Beverages
John C. ComptonCEO PepsiCo Americas Foods
Michael D. WhiteCEO PepsiCo Intl. & Vice Chairman, PepsiCo
Lovely Professional University 19
Page 20
Summer Project-2009 Working Capital Management
Lovely Professional University 20
Page 21
Summer Project-2009 Working Capital Management
Lovely Professional University 21
Page 22
Summer Project-2009 Working Capital Management
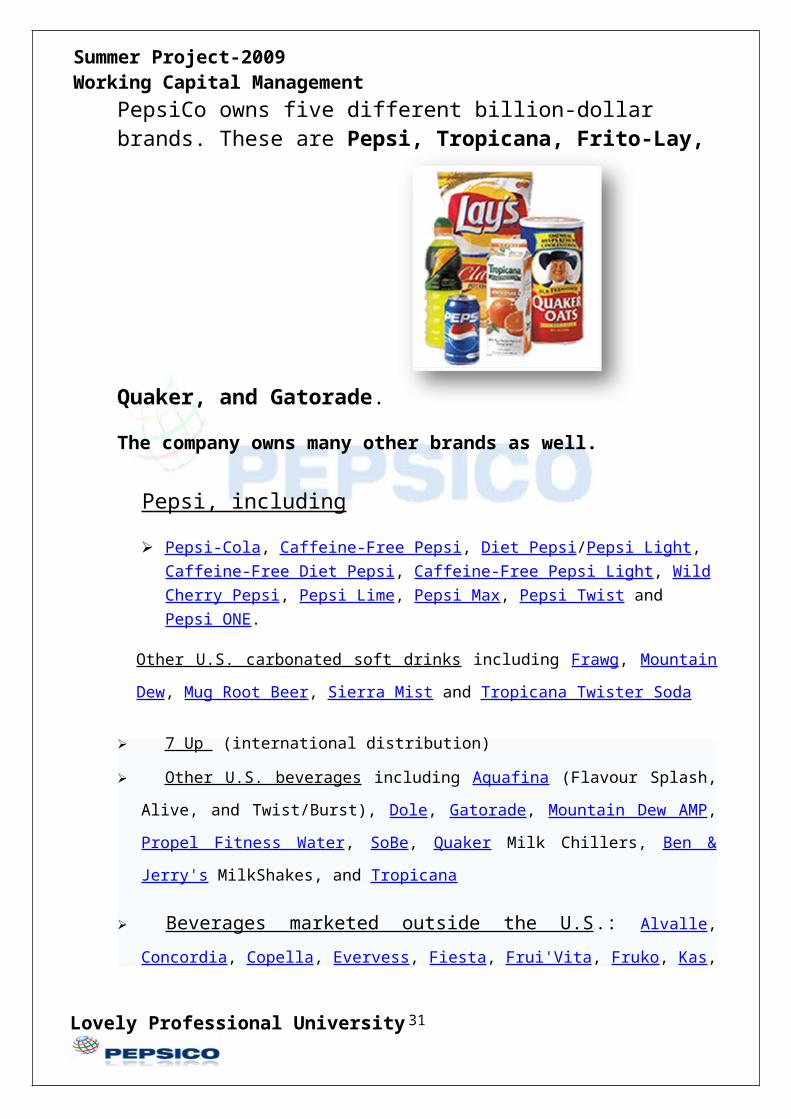
PepsiCo owns five different billion-dollar brands. These are Pepsi, Tropicana, Frito-Lay, Quaker, and Gatorade.
The company owns many other brands as well.
UPepsi, includingU
Pepsi-Cola , Caffeine-Free Pepsi, Diet Pepsi/Pepsi Light, Caffeine-Free Diet Pepsi,
Caffeine-Free Pepsi Light, Wild Cherry Pepsi, Pepsi Lime, Pepsi Max, Pepsi Twist
and Pepsi ONE.
Other U.S. carbonated soft drinks including Frawg, Mountain Dew, Mug Root Beer,
Sierra Mist and Tropicana Twister Soda
7 Up (international distribution)
Other U.S. beverages including Aquafina (Flavour Splash, Alive, and Twist/Burst),
Dole, Gatorade, Mountain Dew AMP, Propel Fitness Water, SoBe, Quaker Milk Chillers,
Ben & Jerry's MilkShakes, and Tropicana
UBeverages marketed outside the U.S U.: Alvalle, Concordia, Copella, Evervess,
Fiesta, Frui'Vita, Fruko, Kas, Loóza, Manzanita Sol, Mirinda, Paso de los Toros, Radical
Fruit, San Carlos, Shani, Teem, Triple Kola, and Yedigun
U.S Frito-Lay brands : Baken-ets, Barcel, Bocabits, Cheese Tris, Cheetos,
Chester's, Chizitos, Churrumais, Cracker Jack, Crujitos, Doritos, Fandangos, Fritos,
Funyuns, Gamesa, Go Snacks, James' Grandma's Cookies, Hamka's, Lay's, Miss Vickie's,
Munchies, Munchos, Nik Naks, Oberto Meat Snacks, Quavers, Rold Gold, Ruffles,
Lovely Professional University 22
Page 23
Summer Project-2009 Working Capital Management
Rustler's Meat Sticks, Sabritas, Sabritones, Santitas, Smartfood, The Smith's Snackfood
Company, Sonric's, Stacy's Pita Chips, Sun Chips, Tor-tees, Tostitos, Walkers, and
Wotsits
U.S Quaker Oats brands : Aunt Jemima, Cap'n Crunch, Coqueiro, Crisp'ums,
Cruesli, FrescAvena, King Vitaman, Life, Oatso Simple,Quake, Quisp, Rice-A-Roni, and
Spudz
Lovely Professional University 23
Page 24
Summer Project-2009 Working Capital Management
2008 Milestones
PepsiCo Foundation announces two major new grants to WaterPartners and Safe
Water Network programs to provide access to safe water and sanitation in developing
countries
PepsiCo Again Named to the Dow Jones Sustainability Index
PepsiCo Agrees to Buy Bulgaria's Leading Nuts and Seeds Company
PepsiCo Announces Initiatives With the Earth Institute and H2O Africa to Drive
Sustainable Water Practices
Forbes Names PepsiCo Among Its Best Big Companies
PepsiCo India Commissions First Remote Wind Turbine to Generate Renewable,
Clean Energy
CRO Names PepsiCo to Top 25 100 Best Corporate Citizens 2008
PepsiCo to Buy Russian Juice Leader, Lebedyansky
Employees Lead Effort to Make Chicago Plaza First LEED-Certified PepsiCo
Headquarters
Gatorade Launches Gatorade Tiger with Comprehensive Integrated Marketing
Campaign
PepsiCo Honored with 2008 Energy Star Partner of the Year Award
UK Vitamin Water Brand- V Water Acquired by PepsiCo
Lovely Professional University 24
Page 25
Summer Project-2009 Working Capital Management
Quaker Plant in Cedar Rapids Closes and Reopens Facility Due to Flooding to Protect
Employees
PepsiCo Foodservice and Naked Juice Expand Starbucks Presence
Gatorade Sports Science Institute Gathers World's Leading Researchers on Protein
Nutrition
PepsiCo International's China Foods Wins "China's Top Leaders 2008" Award
Wall Street Journal Article Recognizes PepsiCo for Leadership in Employment of
People with Different Abilities
PepsiCo and Frito-Lay Join SmartWay in Commitment to Reduce Greenhouse Gas
Emissions
PepsiCo Beats Coke in Race to Launch New Natural Sweetener (Stevia)
PepsiCo France Recognized as "Great Place To Work" by Institute Survey
PepsiCo Commits to Reducing Acryalmide Levels in Potato Chip Products and
Restructured Potato Snacks in California
Subway Names PepsiCo "Vendor of the Year" for Sustainability Leadership
Tazo Tea Joins Pepsi Lipton Partnership
Lovely Professional University 25
Page 26
Summer Project-2009 Working Capital Management
PEPSICO IN INDIA
PepsiCo entered India in 1988 and has grown to become one of the country’s leading food
and beverage companies. One of the largest multinational investors in the country, PepsiCo
has established a business which aims to serve the long term dynamic needs of India.
PepsiCo India and its partners have invested more than U.S.$1 billion since the company was
established in the country. PepsiCo provides direct and indirect employment to 150,000
people including suppliers and distributors.
PepsiCo nourishes consumers with a range of products from treats to healthy eats, that deliver
joy as well as nutrition and always, good taste. PepsiCo India’s expansive portfolio includes
iconic refreshment beverages Pepsi, 7 UP, Mirinda and Mountain Dew, in addition to low
calorie options such as Diet Pepsi, hydrating and nutritional beverages such as Aquafina
drinking water, isotonic sports drinks - Gatorade, Tropicana100% fruit juices, and juice based
drinks – Tropicana Nectars, Tropicana Twister and Slice. Local brands – Lehar Evervess
Soda, Dukes Lemonade and Mangola add to the diverse range of brands.
PepsiCo’s foods company, Frito-Lay, is the leader in the branded salty snack market and all
Frito Lay products are free of trans-fat and MSG. It manufactures Lay’s Potato Chips;
Cheetos extruded snacks, Uncle Chips and traditional snacks under the Kurkure and Lehar
brands. The company’s high fibre breakfast cereal, Quaker Oats, and low fat and roasted
snack options enhance the healthful choices available to consumers. Frito Lay’s core
products, Lay’s, Kurkure, Uncle Chips and Cheetos are cooked in Rice Bran Oil to
significantly reduce saturated fats and all of its products contain voluntary nutritional
labelling on their packets.
The group has built an expansive beverage and foods business. To support its operations,
PepsiCo has 43 bottling plants in India, of which 15 are company owned and 28 are
franchisee owned. In addition to this, PepsiCo’s Frito Lay foods division has 3 state-of-the-
art plants. PepsiCo’s business is based on its sustainability vision of making tomorrow better
than today. PepsiCo’s commitment to living by this vision every day is visible in its
contribution to the country, consumers and farmers.
Lovely Professional University 26
Page 27
Summer Project-2009 Working Capital Management
PepsiCo gained entry to India in 1988 by creating a joint venture with the Punjab
government-owned Punjab Agro Industrial Corporation (PAIC) and Voltas India Limited.
This joint venture marketed and sold Lehar Pepsi until 1991, when the use of foreign brands
was allowed; PepsiCo bought out its partners and ended the joint venture in 1994. Others
claim that firstly Pepsi was banned from import in India, in 1970, for having refused to
release the list of its ingredients and in 1993, the ban was lifted, with Pepsi arriving on the
market shortly afterwards. These controversies are a reminder of "India's sometimes
acrimonious relationship with huge multinational companies." Indeed, some argue that
PepsiCo and The Coca-Cola Company have "been major targets in part because they are
well-known foreign companies that draw plenty of attention."
In 2003, the Centre for Science and Environment (CSE), a non-governmental organization in
New Delhi, said aerated waters produced by soft drinks manufacturers in India, including
multinational giants PepsiCo and The Coca-Cola Company, contained toxins, including
lindane, DDT, malathion and chlorpyrifos — pesticides that can contribute to cancer, a
breakdown of the immune system and cause birth defects. Tested products included Coke,
Pepsi, 7 Up, Mirinda, Fanta, Thums Up, Limca, and Sprite. CSE found that the Indian-
produced Pepsi's soft drink products had 36 times the level of pesticide residues permitted
under European Union regulations; Coca Cola's 30 times. CSE said it had tested the same
products in the US and found no such residues. However, this was the European standard for
water, not for other drinks. No law bans the presence of pesticides in drinks in India.
The Coca-Cola Company and PepsiCo
angrily denied allegations that their products manufactured in India contained toxin levels far
above the norms permitted in the developed world. But an Indian parliamentary committee,
in 2004, backed up CSE's findings and a government-appointed committee, is now trying to
develop the world's first pesticides standards for soft drinks. Coke and PepsiCo opposed the
move, arguing that lab tests aren't reliable enough to detect minute traces of pesticides in
complex drinks. On December 7, 2004, India's Supreme Court ruled that both PepsiCo and
competitor The Coca-Cola Company must label all cans and bottles of the respective soft
drinks with a consumer warning after tests showed unacceptable levels of residual pesticides.
Both companies continue to maintain that their products meet all international safety
standards without yet implementing the Supreme Court ruling. As of 2005, The Coca-Cola
Company and PepsiCo together hold 95% market share of soft-drink sales in India. PepsiCo
Lovely Professional University 27
Page 28
Summer Project-2009 Working Capital Management
has also been accused by the puthussery panchayat in the Palakkad district in Kerala, India,
of practicing "water piracy" due to its role in exploitation of ground water resources resulting
in scarcity of drinking water for the panchayat's residents, who have been pressuring the
government to close down the PepsiCo unit in the village.
In 2006, the CSE again found that soda drinks, including both Pepsi and Coca-Cola, had high
levels of pesticides in their drinks. Both PepsiCo and The Coca-Cola Company maintain that
their drinks are safe for consumption and have published news paper advertisements that say
pesticide levels in their products are less than those in other foods such as tea, fruit and dairy
products. In the Indian state of Kerala, sale and production of Pepsi-Cola, along with other
soft drinks, was banned by the state government in 2006, but this was reversed by the Kerala
high court merely a month later. Five other Indian states have announced partial bans on the
drinks in schools, colleges and hospitals.
Lovely Professional University 28
Page 29
Summer Project-2009 Working Capital Management
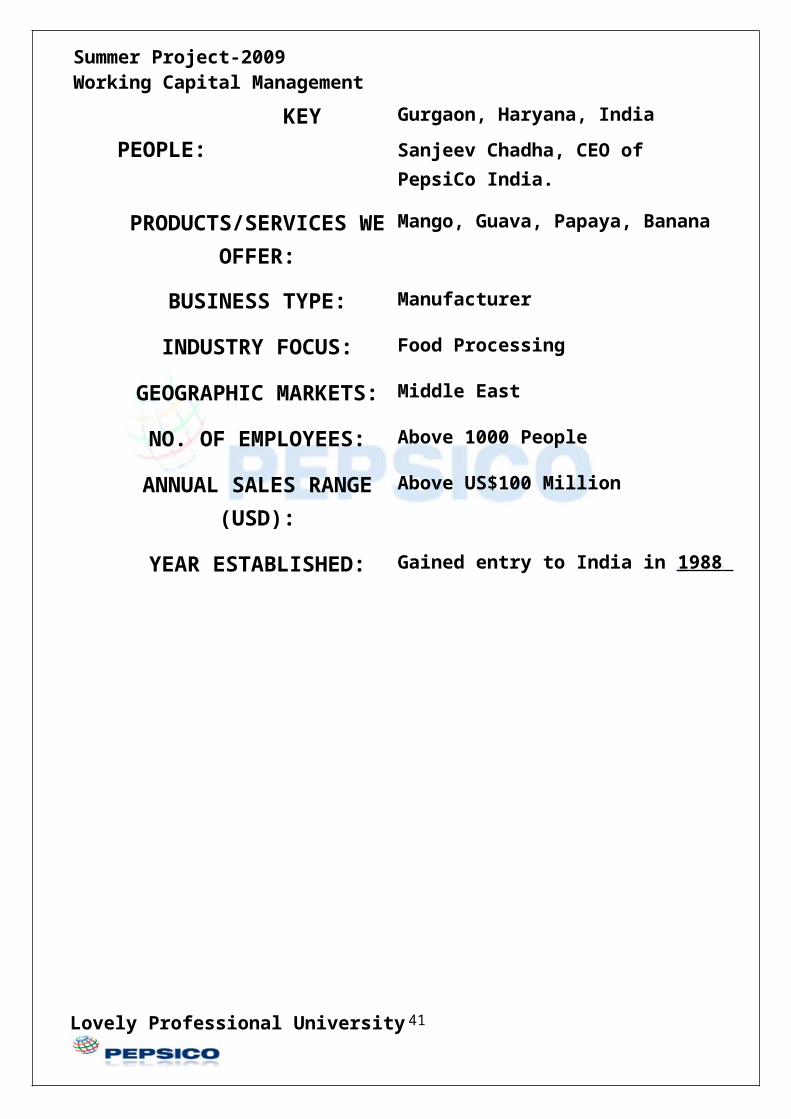
COMPANY PROFILE IN INDIA
COMPANY NAME: Pepsi Co India Holdings Private Limited
COUNTRY/TERRITORY: India
ADDRESS:
KEY PEOPLE:
3B;DLF Corporate park’s Block; Qutub Enclave; Gurgaon, Haryana, India
Sanjeev Chadha, CEO of PepsiCo India.
PRODUCTS/SERVICES WE OFFER:
Mango, Guava, Papaya, Banana
BUSINESS TYPE: Manufacturer
INDUSTRY FOCUS: Food Processing
GEOGRAPHIC MARKETS: Middle East
NO. OF EMPLOYEES: Above 1000 People
ANNUAL SALES RANGE (USD):
Above US$100 Million
YEAR ESTABLISHED: Gained entry to India in T 1988 T
Lovely Professional University 29
Page 30
Summer Project-2009 Working Capital Management
Lovely Professional University 30
Page 31
Summer Project-2009 Working Capital Management
INTRODUCTION
A managerial accounting strategy focusing on maintaining efficient levels of both
Components of working capital, current assets and current liabilities, in respect to each other
are referred to as working capital management. Working capital management ensures a
company has sufficient cash flow in order to meet its short-term debt obligations and
operating expenses. Implementing an effective working capital management system is an
excellent way for many companies to improve their earnings. The two main aspects of
working capital management are ratio analysis and management of individual components of
working capital. Ratio analysis will lead management to identify areas of focus such as
inventory management, cash management, accounts receivable and payable management.
The study objectives in working capital management particular to this study are:
To examine the impact of accounts receivables days, inventories days, accounts
payable Days and cash conversion cycle on return on total assets
To analyze the trend in working capital needs of firms and to examine the causes for
any significant differences between the industries.
Working Capital Components
The term working capital refers to the amount of capital which is readily available to an
Organization. It is a measure of both a company's efficiency and its short-term financial
health. That is, working capital is the difference between resources in cash or readily
convertible into cash (Current Assets) and organizational commitments for which cash will
soon be required (Current Liabilities). Current Assets are resources which are in cash or will
soon be converted into cash in “the ordinary course of business”‘. Current Liabilities are
commitments which will soon require cash settlement in “the ordinary course of business”.
Lovely Professional University 31
Page 32
Summer Project-2009 Working Capital Management
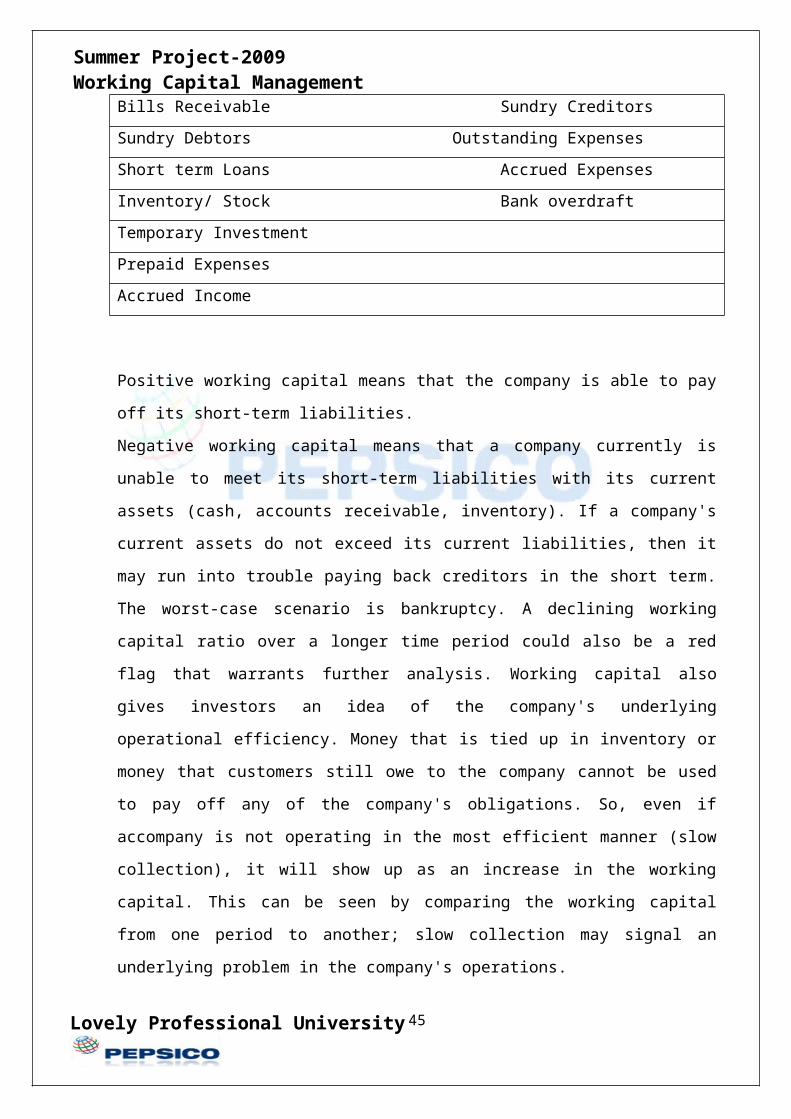
The working capital is calculated as:
WORKING CAPITAL = CURRENT ASSETS-CURRENT LIABILITIES
CURRENT ASSETS CURRENT LIABILITY
Cash in hand/at bank Bills Payable
Bills Receivable Sundry Creditors
Sundry Debtors Outstanding Expenses
Short term Loans Accrued Expenses
Inventory/ Stock Bank overdraft
Temporary Investment
Prepaid Expenses
Accrued Income
Positive working capital means that the company is able to pay off its short-term liabilities.
Negative working capital means that a company currently is unable to meet its short-term
liabilities with its current assets (cash, accounts receivable, inventory). If a company's current
assets do not exceed its current liabilities, then it may run into trouble paying back creditors
in the short term. The worst-case scenario is bankruptcy. A declining working capital ratio
over a longer time period could also be a red flag that warrants further analysis. Working
capital also gives investors an idea of the company's underlying operational efficiency.
Money that is tied up in inventory or money that customers still owe to the company cannot
be used to pay off any of the company's obligations. So, even if accompany is not operating
in the most efficient manner (slow collection), it will show up as an increase in the working
capital. This can be seen by comparing the working capital from one period to another; slow
collection may signal an underlying problem in the company's operations.
Lovely Professional University 32
Page 33
Summer Project-2009 Working Capital Management
Working Capital Analysis
The major components of gross working capital include stocks (raw materials, work-in-
progress and finished goods), debtors, cash and bank balances. The composition of working
capital depends on a multiple of factors, such as operating level, level of operational
efficiency, inventory policies, book debt policies, technology used and nature of the industry.
While inter- industry variation is expected to be high, the degree of variation is expected to
be low for firms within the industry.
Nature and Importance of Working Capital
The working capital meets the short-term financial requirements of a business enterprise. It is
a trading capital, not retained in the business in a particular form for longer than a year. The
money invested in it changes form and substance during the normal course of business
operations. If it becomes weak, the business can hardly prosper and survive. The success of a
firm depends ultimately, on its ability to generate cash receipts in excess of disbursements.
On the one hand, working capital is always significant. This is especially true from the
lenders or creditors
Perspective, where the main concern is defensiveness: can the company meet its short-term
obligations, such as paying vendor bills?
But from the perspective of equity valuation and the company's growth prospects, working
capital is more critical to some businesses than to others. At the risk of oversimplifying, we
could say that the models of these businesses are asset or capital intensive rather than service
or people intensive.
Lovely Professional University 33
Page 34
Summer Project-2009 Working Capital Management
The Importance of Good Working Capital Management
Working capital constitutes part of the Crown’s investment in a department. Associated with
this is an opportunity cost to the Crown. (Money invested in one area may “cost”
opportunities for investment in other areas.) If a department is operating with more working
capital than is necessary, this over-investment represents an unnecessary cost to the Crown.
From a department’s point of view, excess working capital means operating inefficiencies. In
addition, unnecessary working capital increases the amount of the capital charges.
The Management of Working Capital
The amounts invested in working capital are often high in proportion to the total assets
employed and so it is vital that these amounts are used in an efficient and effective way. A
firm can be very profitable, but if this is not translated into cash from operations within the
same operating cycle, the firm would need to borrow to support its continued working capital
needs. Thus, the twin objectives of profitability and liquidity must be synchronized and one
should not impinge on the other for long. Investments in current assets are inevitable to
ensure delivery of goods or services to the ultimate customers and a proper management of
same should give the desired impact on either profitability or liquidity. If resources are
blocked at different stages of the supply chain, this will prolong the cash operating cycle.
Although this might increase profitability (due to increase sales), it may also adversely affect
the profitability if the costs tied up in working capital exceed the benefits of holding more
inventory and/or granting more trade credit to customers. Another component of working
capital is accounts payable, but it is different in the sense that it does not consumer sources;
instead it is often used as a short term source of finance. Thus it helps firms to reduce its cash
operating cycle, but it has an implicit cost where discount is offered for early settlement of
invoices.
Lovely Professional University 34
Page 35
Summer Project-2009 Working Capital Management
Approaches to Working Capital Management
The objective of working capital management is to maintain the optimum balance of each of
the working capital components. This includes making sure that funds are held as cash in
bank deposits for as long as and in the largest amounts possible, thereby maximizing the
interest earned.
However, such cash may more appropriately be “invested” in other assets or in reducing
other liabilities.
Working capital management takes place on two levels:
Ratio analysis can be used to monitor overall trends in working capital and to identify areas
requiring closer management.
The individual components of working capital can be effectively managed by using various
techniques and strategies.
When considering these techniques and strategies, departments need to recognize that each
department has a unique mix of working capital components. The emphasis that needs to be
placed on each component varies according to department. For example, some departments
have significant inventory levels; others have little if any inventory.
Furthermore, working capital management is not an end in itself. It is an integral part of the
department’s overall management. The needs of efficient working capital management must
be considered in relation to other aspects of the department’s financial and non-financial
performance.
Lovely Professional University 35
Page 36
Summer Project-2009 Working Capital Management
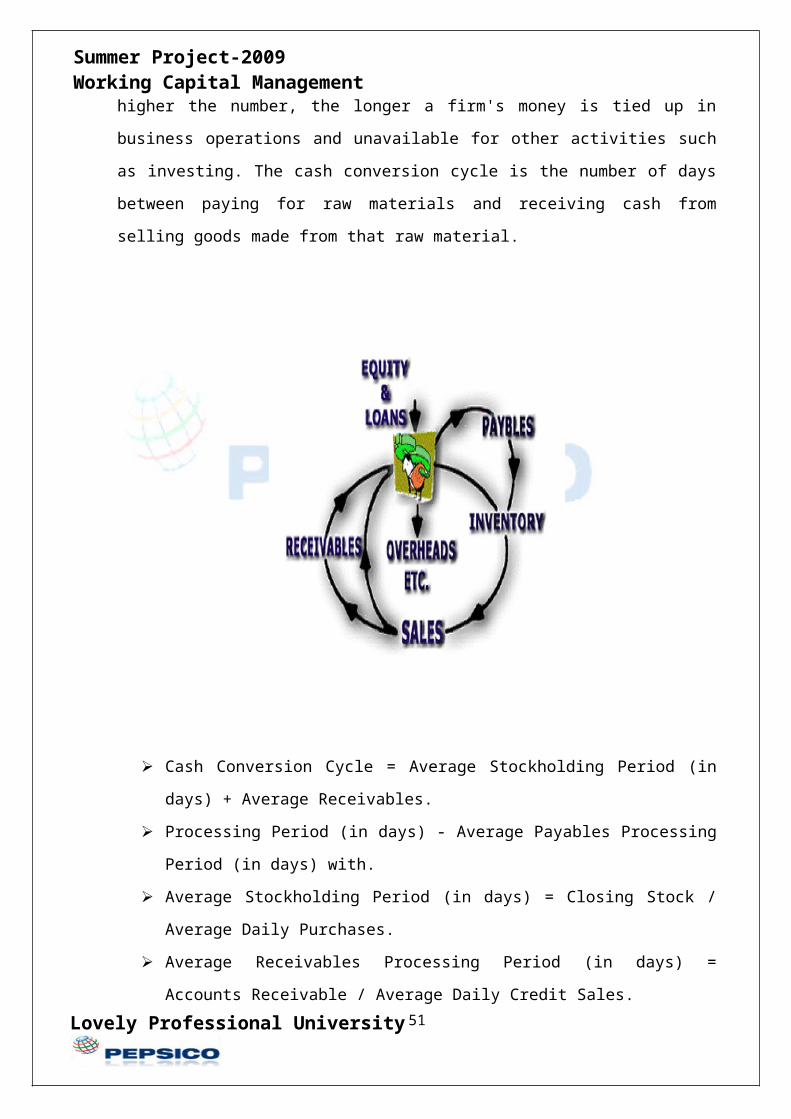
Working Capital Cycle
Working capital cycle, also known as the asset conversion cycle, operating cycle, cash
conversion cycle or just cash cycle, is used in the financial analysis of a business. The higher
the number, the longer a firm's money is tied up in business operations and unavailable for
other activities such as investing. The cash conversion cycle is the number of days between
paying for raw materials and receiving cash from selling goods made from that raw material.
Cash Conversion Cycle = Average Stockholding Period (in days) + Average
Receivables.
Processing Period (in days) - Average Payables Processing Period (in days) with.
Average Stockholding Period (in days) = Closing Stock / Average Daily Purchases.
Average Receivables Processing Period (in days) = Accounts Receivable / Average
Daily Credit Sales.
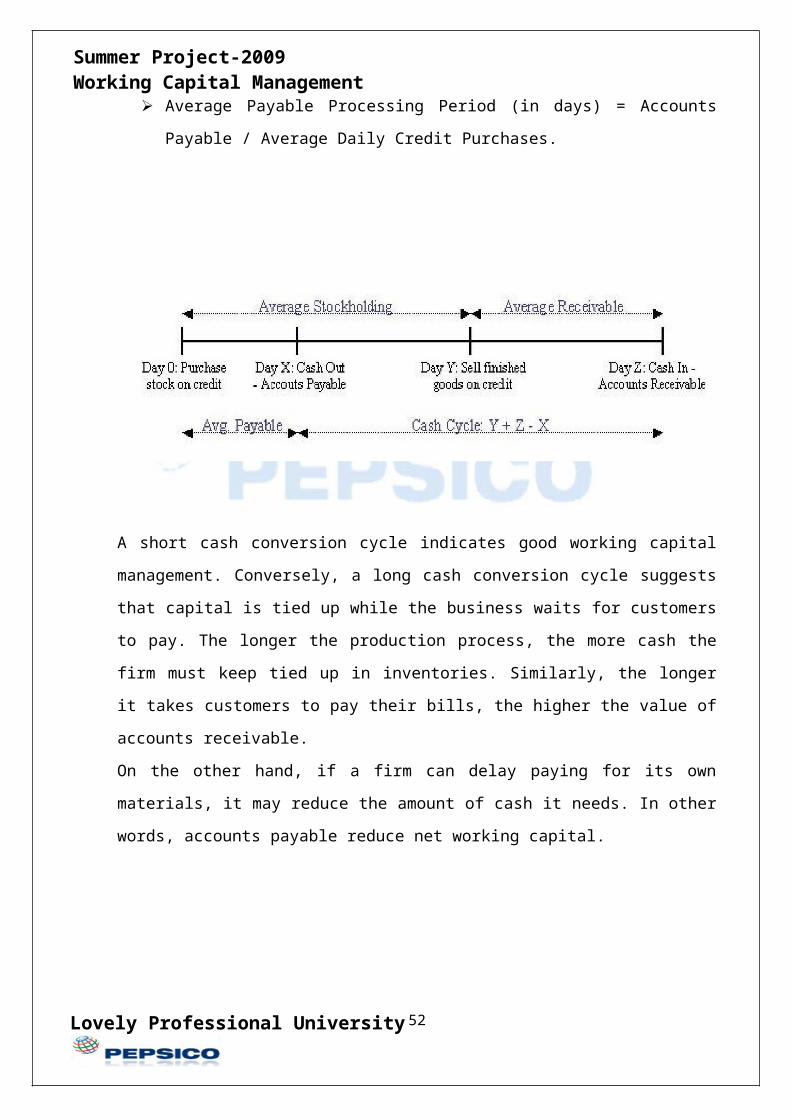
Average Payable Processing Period (in days) = Accounts Payable / Average Daily
Credit Purchases.
Lovely Professional University 36
Page 37
Summer Project-2009 Working Capital Management
A short cash conversion cycle indicates good working capital management. Conversely, a
long cash conversion cycle suggests that capital is tied up while the business waits for
customers to pay. The longer the production process, the more cash the firm must keep tied
up in inventories. Similarly, the longer it takes customers to pay their bills, the higher the
value of accounts receivable.
On the other hand, if a firm can delay paying for its own materials, it may reduce the amount
of cash it needs. In other words, accounts payable reduce net working capital.
Lovely Professional University 37
Page 38
Summer Project-2009 Working Capital Management
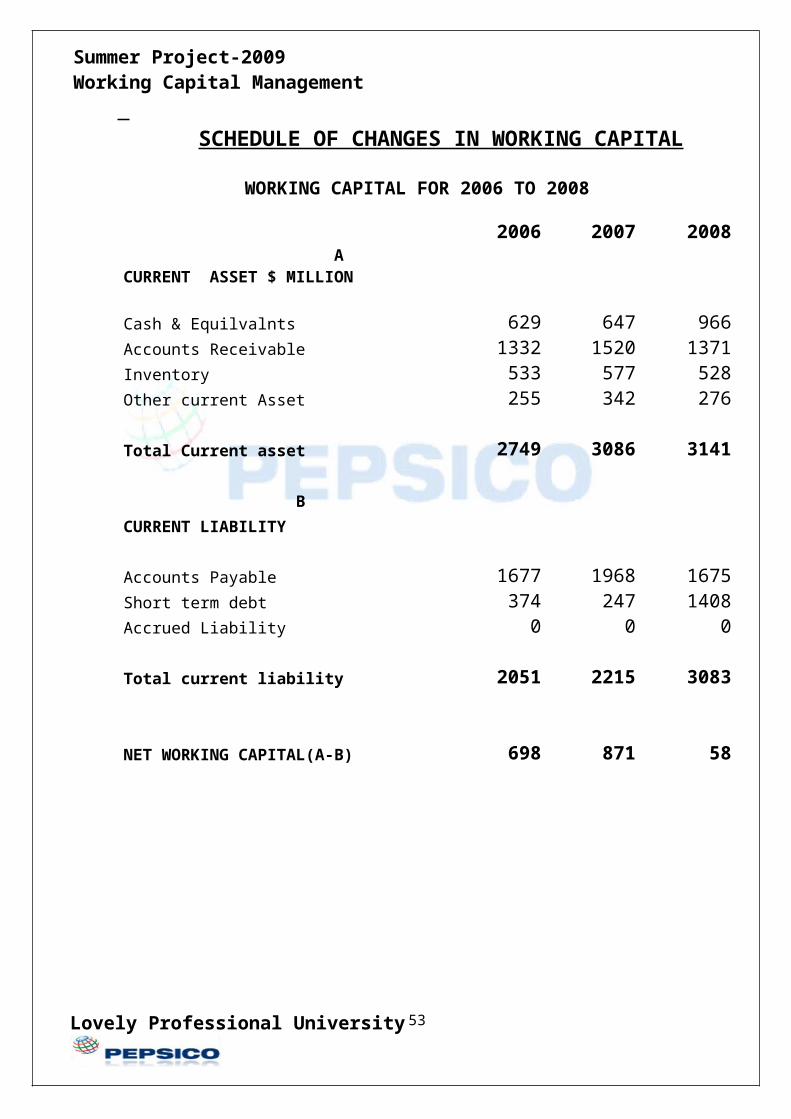
SCHEDULE OF CHANGES IN WORKING CAPITAL
WORKING CAPITAL FOR 2006 TO 2008
2006 2007 2008 ACURRENT ASSET $ MILLION
Cash & Equilvalnts 629 647 966Accounts Receivable 1332 1520 1371Inventory 533 577 528Other current Asset 255 342 276
Total Current asset 2749 3086 3141
B
CURRENT LIABILITY
Accounts Payable 1677 1968 1675Short term debt 374 247 1408Accrued Liability 0 0 0
Total current liability 2051 2215 3083
NET WORKING CAPITAL(A-B) 698 871 58
Lovely Professional University 38
Page 39
Summer Project-2009 Working Capital Management
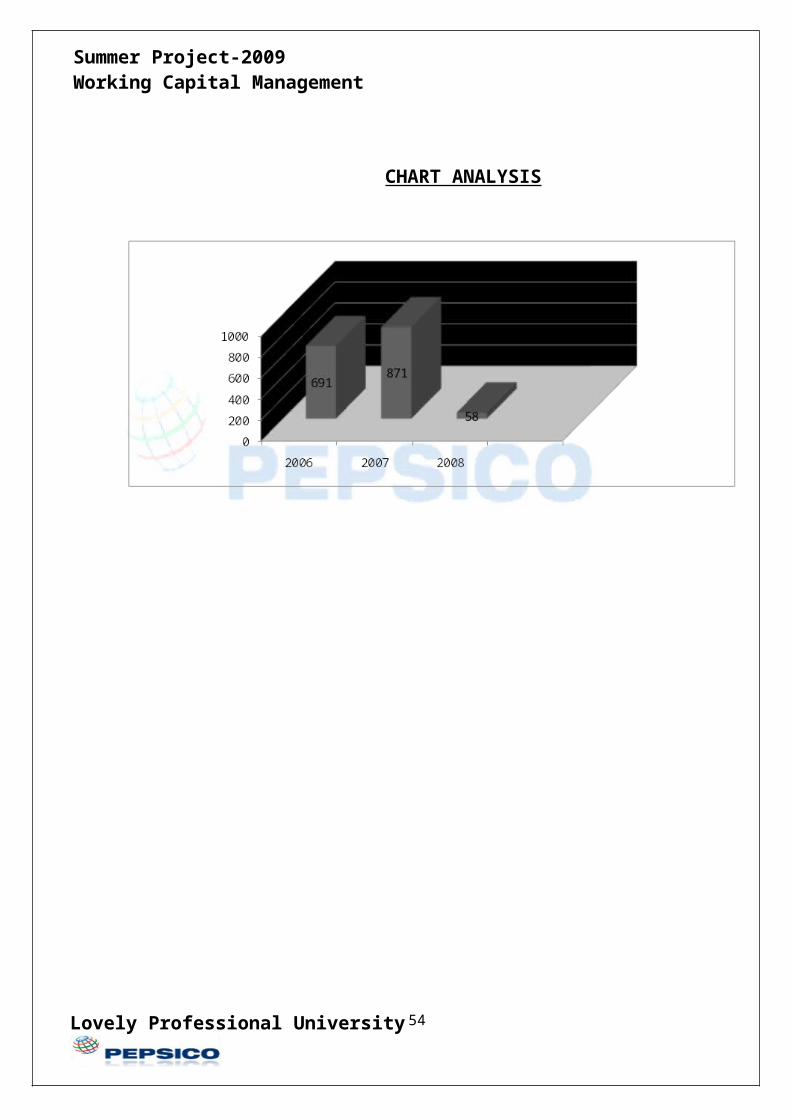
CHART ANALYSIS
Lovely Professional University 39
Page 40
Summer Project-2009 Working Capital Management
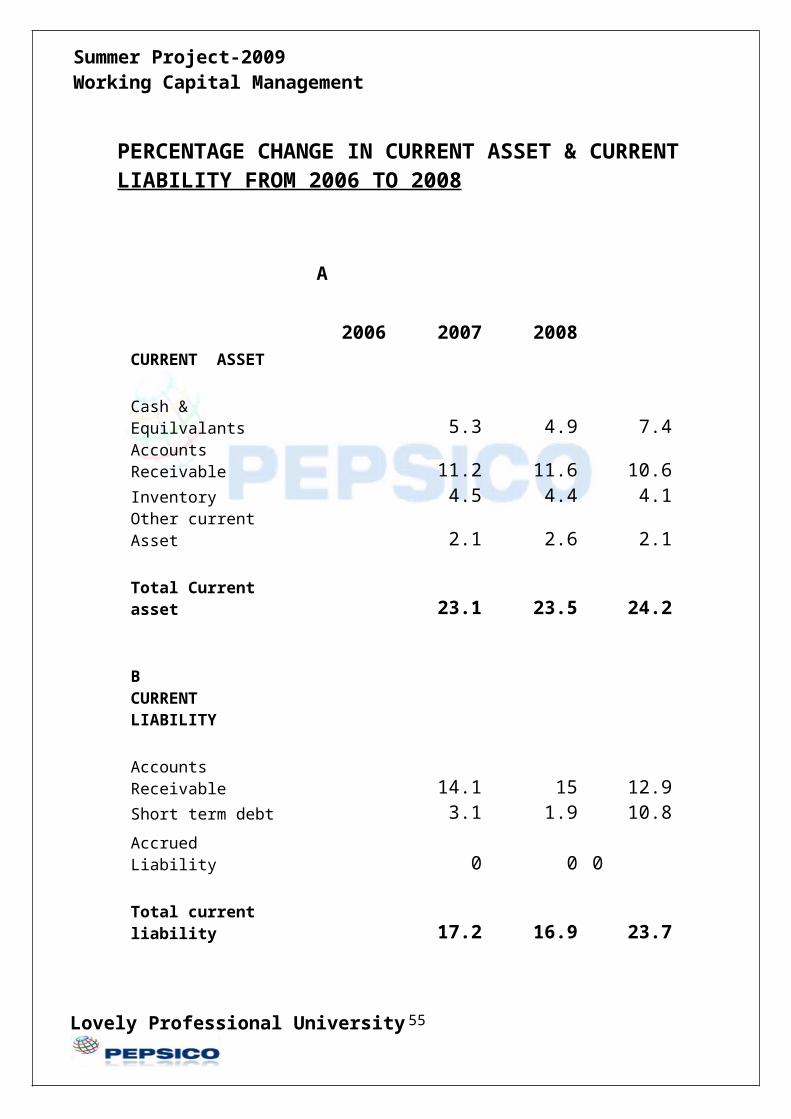
PERCENTAGE CHANGE IN CURRENT ASSET & CURRENT LIABILITY FROM 2006 TO 2008
A
2006 2007 2008CURRENT ASSET
Cash & Equilvalants 5.3 4.9 7.4Accounts Receivable 11.2 11.6 10.6Inventory 4.5 4.4 4.1Other current Asset 2.1 2.6 2.1
Total Current asset 23.1 23.5 24.2
BCURRENT LIABILITY
Accounts Receivable 14.1 15 12.9Short term debt 3.1 1.9 10.8
Accrued Liability 0 0 0
Total current liability 17.2 16.9 23.7
Lovely Professional University 40
Page 41
Summer Project-2009 Working Capital Management
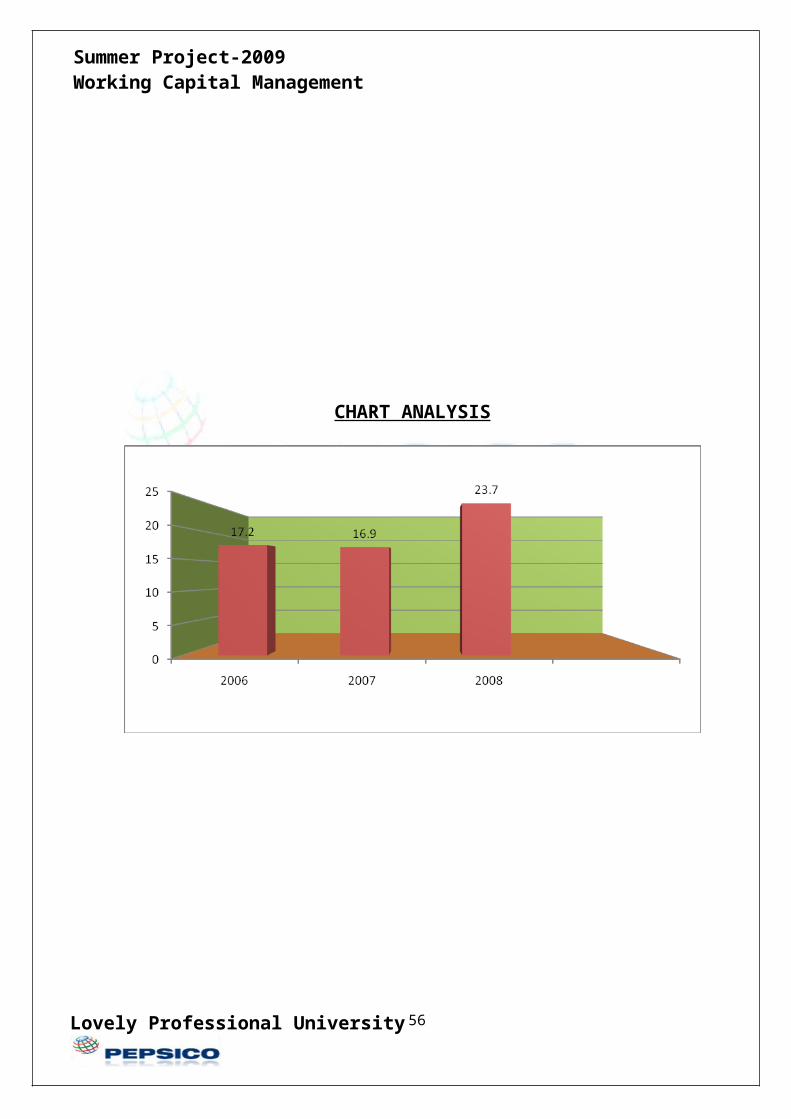
CHART ANALYSIS
Lovely Professional University 41
Page 42
Summer Project-2009 Working Capital Management
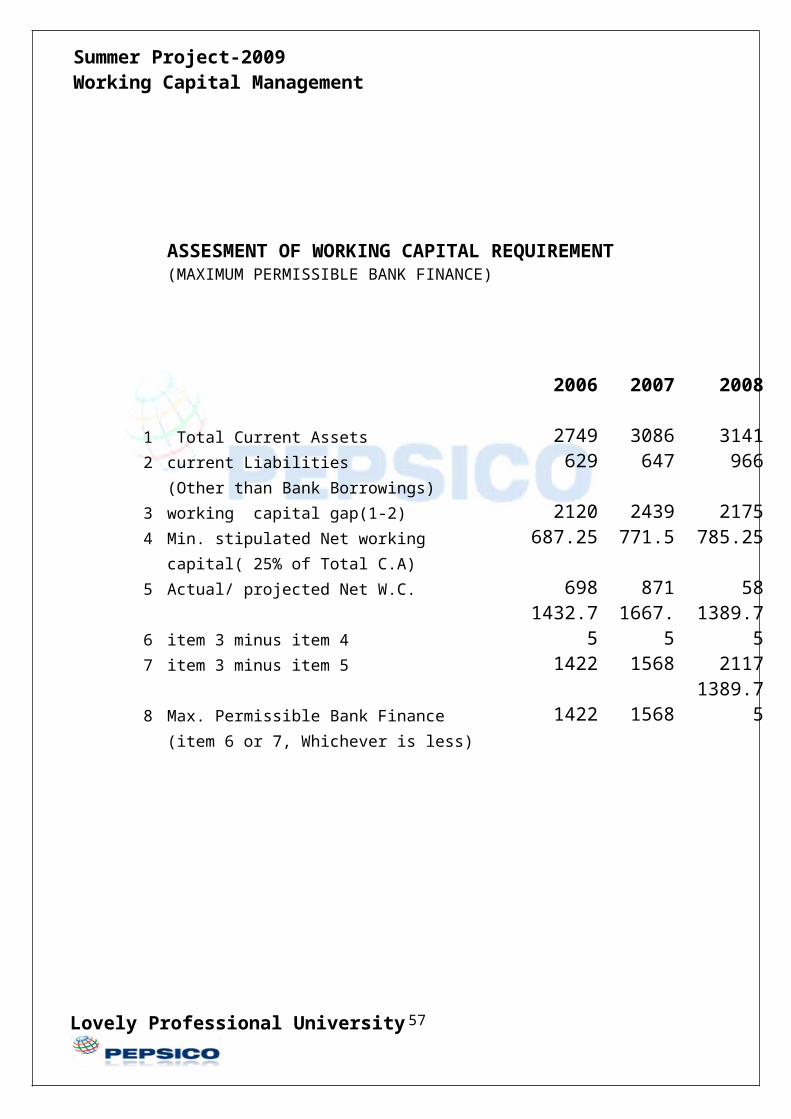
ASSESMENT OF WORKING CAPITAL REQUIREMENT(MAXIMUM PERMISSIBLE BANK FINANCE)
2006 2007 2008
1 Total Current Assets 2749 3086 31412 current Liabilities 629 647 966
(Other than Bank Borrowings)3 working capital gap(1-2) 2120 2439 21754 Min. stipulated Net working 687.25 771.5 785.25
capital( 25% of Total C.A)5 Actual/ projected Net W.C. 698 871 586 item 3 minus item 4 1432.75 1667.5 1389.757 item 3 minus item 5 1422 1568 21178 Max. Permissible Bank Finance 1422 1568 1389.75
(item 6 or 7, Whichever is less)
Lovely Professional University 42
Page 43
Summer Project-2009 Working Capital Management
ANALYSIS
Working capital management ensures a company has sufficient cash flow in order to meet its
short-term debt obligations and operating expenses. In 2006 the company have Rs.691mill$. Its
shows good financial position of the company. In 2007 it increases to 871 mill $. In this year
company have take less short term debt from previous year. This year company uses his own
funds. Its shows the efficient working capital management by Pepsi. In 2008 the company have
only 58 mill $ working capital because in this year company have takes much more short term
loans for its expansion and pay for his day to day expenses. Its shows the company have not
utilise efficiently the fixed assets.
In this year world economy faces downturns. Recession has also affected on Pepsi. This year. For
this company has take $1408 mill. Short term loans. Its increases the current liability of the
company. Company pay its quickly in his payable time. Its shows the good liquidity position of
the company in 2008.
This year company have more cash & bank balance in hand from the previous year. Its 50% more
than from the previous year. This year company have $1675 mill. Accounts payable it is less from
the previous year. It is good for the company.
Lovely Professional University 43
Page 44
Summer Project-2009 Working Capital Management
Objective of the study
To observe the systems, process, interactions in the organization.
To study and analyze the working capital management of PepsiCo.
To study that how they use working capital to solve day to day problems.
To study about their Operating Cycle, cash conversion cycle, processing period.
Lovely Professional University 44
Page 45
Summer Project-2009 Working Capital Management
Research Methodology
Research in common parlance refers to search for knowledge
The term research refers to the systematic method consisting of enunciating the problem ,
formulating a hypothesis collecting the data , analyzing the facts and reaching the certain
conclusions either in the form of solution towards the concern problem or in certain
generalization for some theoretical formulation .
Research Methodology is a way to systematically solve the research problem .It may be
understood as a science of studying how research is done scientifically.
For completing the project work, data inputs were collected from the following sources:
Primary Data:
Collected data through discussion with the Finance manager in Pepsi.
Collected data during working in Pepsi.
Secondary Data:
Collected data from personnel manual of Pepsi.
Collected data from different magazines, journals, News papers and Internet.
For this project I’ve used the secondary data in the form of Annual report 2006, Annual report 2007, and Annual report 2008.
Lovely Professional University 45
Page 46
Summer Project-2009 Working Capital Management
TOOLS
I’ve used analysis tools that are mention below-
Ratio Analysis Charts & Graphs
Lovely Professional University 46
Page 47
Summer Project-2009 Working Capital Management
Lovely Professional University 47
Page 48
Summer Project-2009 Working Capital Management
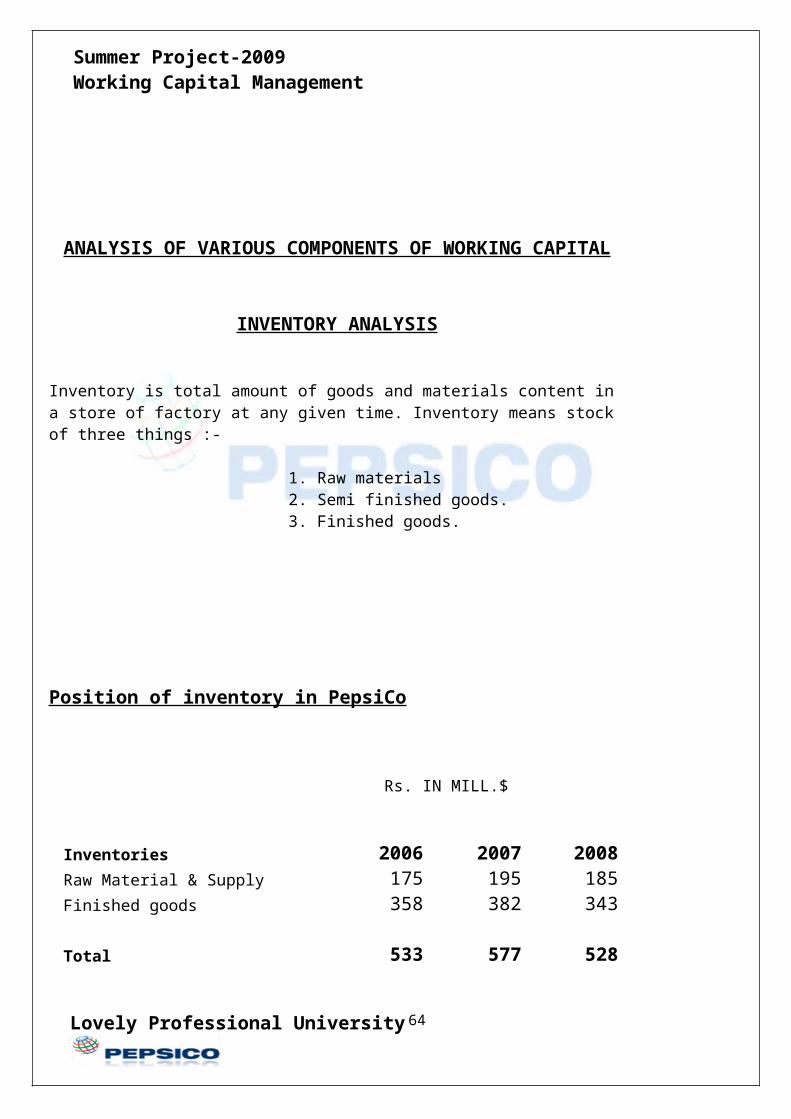
ANALYSIS OF VARIOUS COMPONENTS OF WORKING CAPITAL
INVENTORY ANALYSIS
Inventory is total amount of goods and materials content in a store of factory at any given time. Inventory means stock of three things :-
1. Raw materials2. Semi finished goods.3. Finished goods.
Position of inventory in PepsiCo
Rs. IN MILL.$
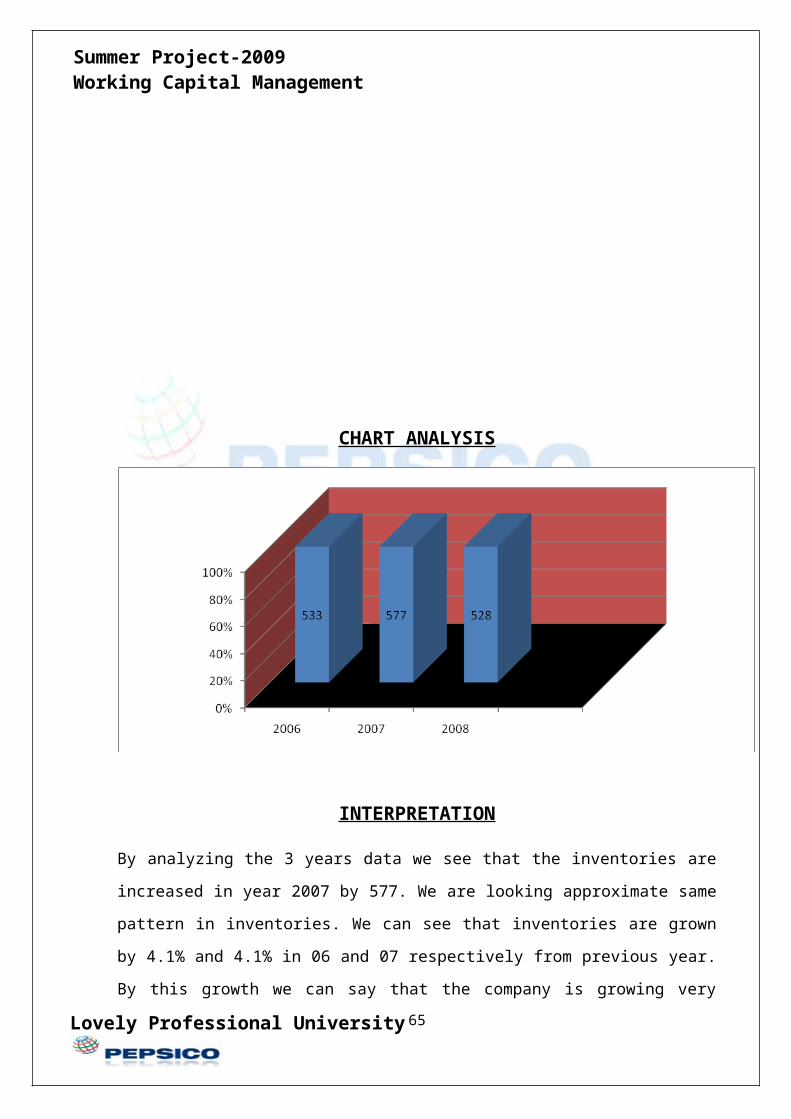
Inventories 2006 2007 2008Raw Material & Supply 175 195 185Finished goods 358 382 343
Total 533 577 528
Lovely Professional University 48
Page 49
Summer Project-2009 Working Capital Management
CHART ANALYSIS
INTERPRETATION
By analyzing the 3 years data we see that the inventories are increased in year 2007 by 577.
We are looking approximate same pattern in inventories. We can see that inventories are
grown by 4.1% and 4.1% in 06 and 07 respectively from previous year. By this growth we
can say that the company is growing very smoothly in soft drink sector. A company uses
inventory when they have demand in market and Pepsi is having a great demand in beverages
sector. From other point of view we can say that the liquidity of firm is blocked in inventories
but to stock is very good due to uncertainty of availability of raw material in time.
Lovely Professional University 49
Page 50
Summer Project-2009 Working Capital Management
SUNDRY DEBTORS ANALYSIS
Debtors or an account receivable is an important component of working capital and fall under
current assets. Debtors will arise only when credit sales are made.
POSITION OF SUNDRY DEBTORS IN PEPSI CO
RS. IN MILL $2006 2007 2008
Debtors Net
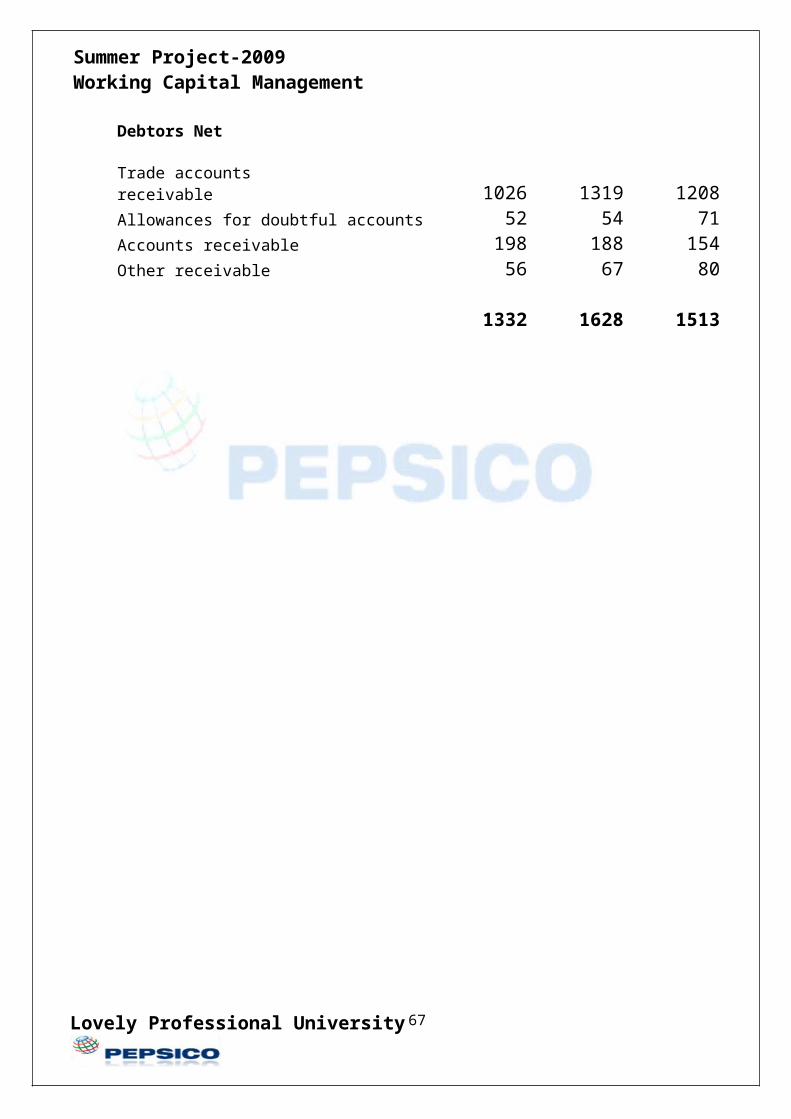
Trade accounts receivable 1026 1319 1208Allowances for doubtful accounts 52 54 71Accounts receivable 198 188 154Other receivable 56 67 80
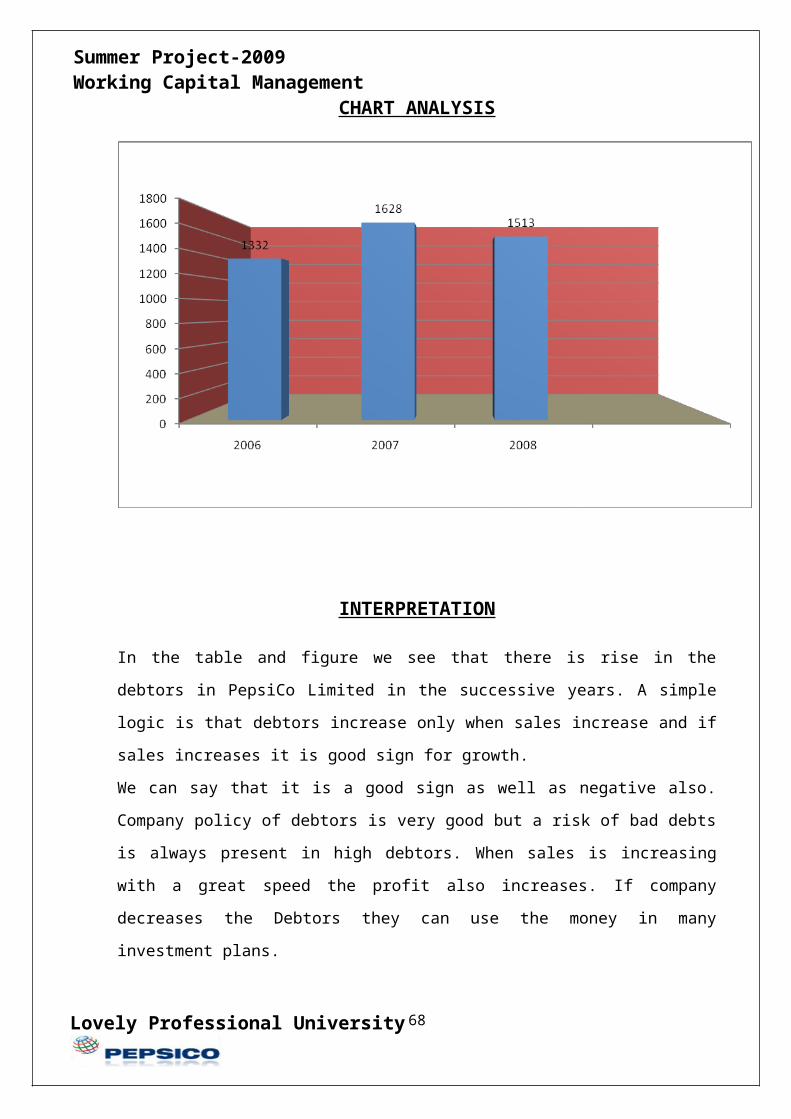
1332 1628 1513
Lovely Professional University 50
Page 51
Summer Project-2009 Working Capital Management
CHART ANALYSIS
INTERPRETATION
In the table and figure we see that there is rise in the debtors in PepsiCo Limited in the
successive years. A simple logic is that debtors increase only when sales increase and if sales
increases it is good sign for growth.
We can say that it is a good sign as well as negative also. Company policy of debtors is very
good but a risk of bad debts is always present in high debtors. When sales is increasing with a
great speed the profit also increases. If company decreases the Debtors they can use the
money in many investment plans.
Lovely Professional University 51
Page 52
Summer Project-2009 Working Capital Management
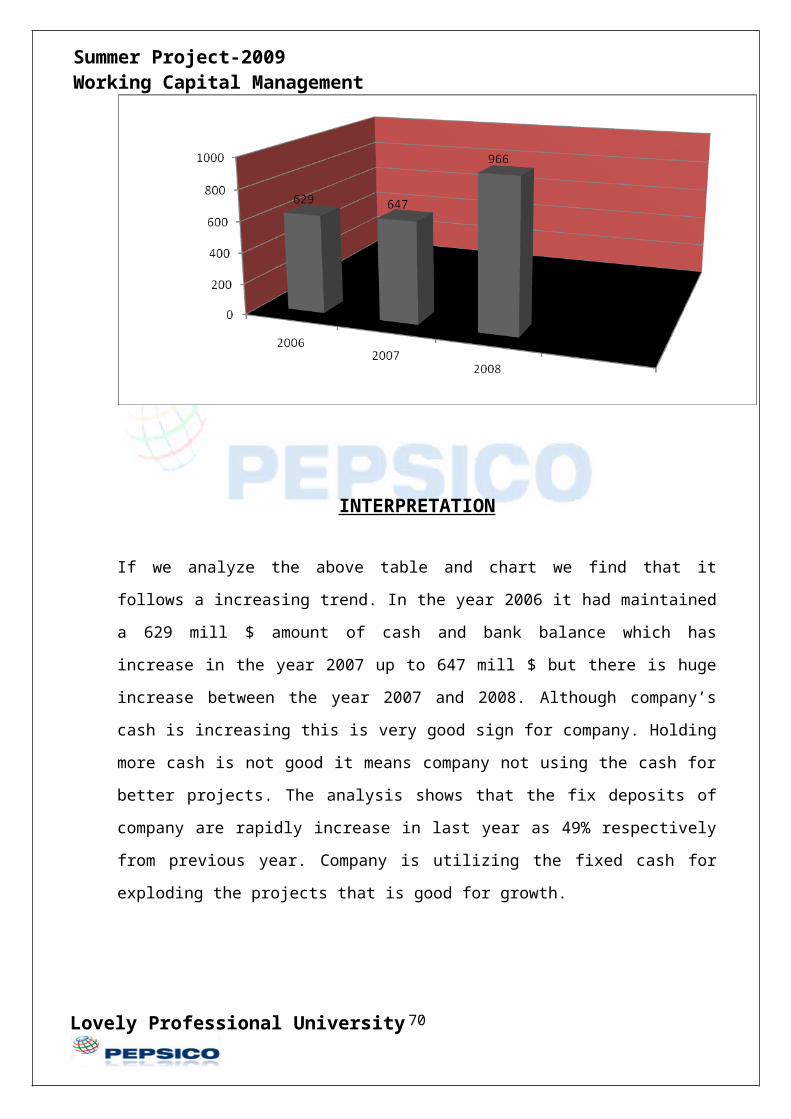
CASH AND BANK BALANCE ANALYSIS
Cash is called the most liquid asset and vital current assets. It is an important component of
working capital. In a narrow sense, cash includes notes, bank draft, cheque etc while in a
broader sense it includes near cash assets such as marketable securities and time deposits
with bank.
POSITION OF CASH & BANK BALANCE IN PEPSICO
RS.IN MILL. $
2006 2007 2008
CASH in hand& 629 647 966BANKBALANCE & EQUILANTS
CHART ANALYSIS
Lovely Professional University 52
Page 53
Summer Project-2009 Working Capital Management
INTERPRETATION
If we analyze the above table and chart we find that it follows a increasing trend. In the year
2006 it had maintained a 629 mill $ amount of cash and bank balance which has increase in
the year 2007 up to 647 mill $ but there is huge increase between the year 2007 and 2008.
Although company’s cash is increasing this is very good sign for company. Holding more
cash is not good it means company not using the cash for better projects. The analysis shows
that the fix deposits of company are rapidly increase in last year as 49% respectively from
previous year. Company is utilizing the fixed cash for exploding the projects that is good for
growth.
Lovely Professional University 53
Page 54
Summer Project-2009 Working Capital Management
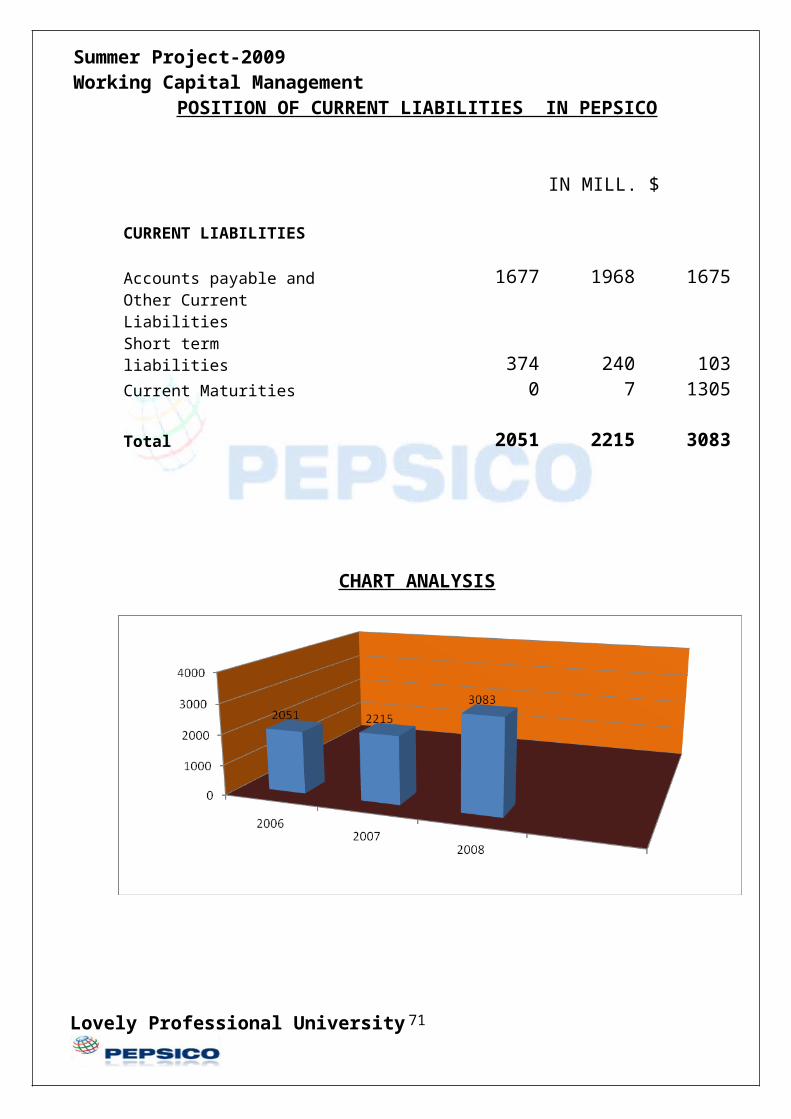
POSITION OF CURRENT LIABILITIES IN PEPSICO
IN MILL. $
CURRENT LIABILITIES
Accounts payable and 1677 1968 1675Other Current Liabilities
Short term liabilities 374 240 103Current Maturities 0 7 1305
Total 2051 2215 3083
CHART ANALYSIS
Lovely Professional University 54
Page 55
Summer Project-2009 Working Capital Management
INTERPRETATION
we analyze the above table then we can see that it follow an uneven trend. The important
component of current liabilities is sundry creditors and other liabilities. In 06-07 it increased
by 17% and in 07-08 it increased by 16.9%. In 07-08 it was increased because of growth in
short term debt by 39%.This is liability for company so this should be less. When company
have minimum liabilities it creates a better goodwill in market. High current liabilities
indicate that company is using credit facility.
Lovely Professional University 55
Page 56
Summer Project-2009 Working Capital Management
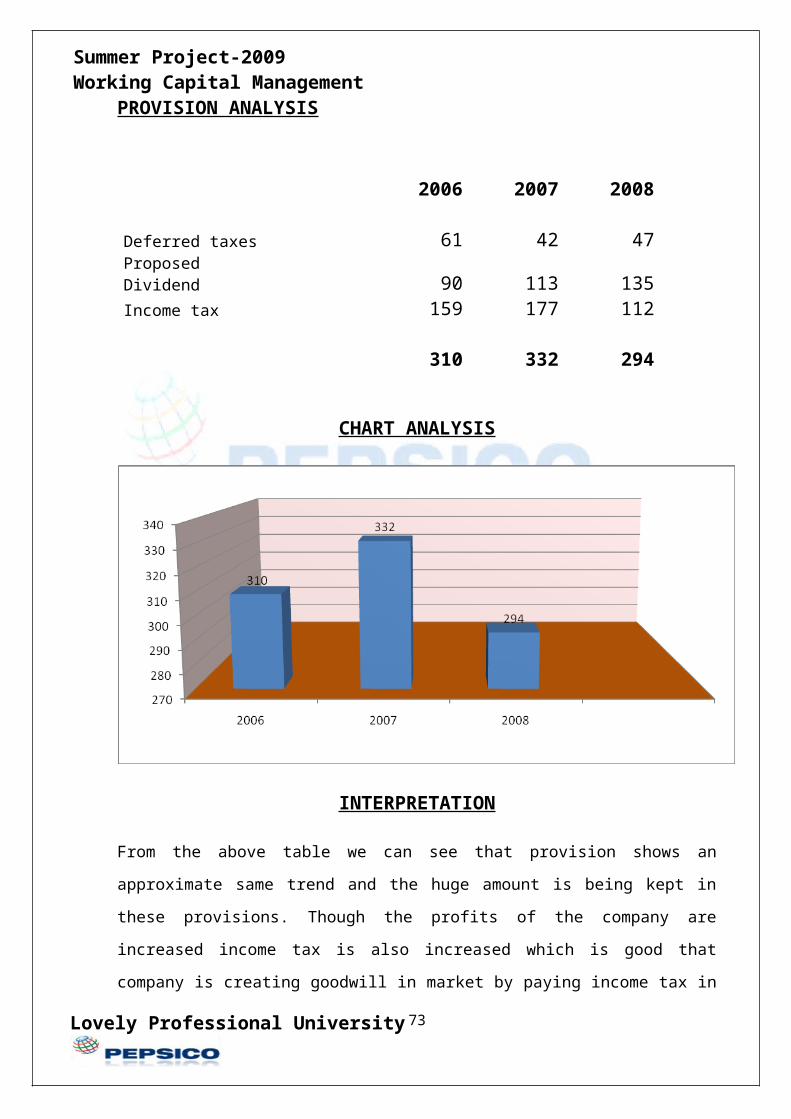
PROVISION ANALYSIS
2006 2007 2008
Deferred taxes 61 42 47Proposed Dividend 90 113 135Income tax 159 177 112
310 332 294
CHART ANALYSIS
INTERPRETATION
From the above table we can see that provision shows an approximate same trend and the
huge amount is being kept in these provisions. Though the profits of the company are
increased income tax is also increased which is good that company is creating goodwill in
market by paying income tax in time. Other provisions are also for the benefit of employees
and public. This is good sign for Company growth.
Lovely Professional University 56
Page 57
Summer Project-2009 Working Capital Management
Lovely Professional University 57
Page 58
Summer Project-2009 Working Capital Management
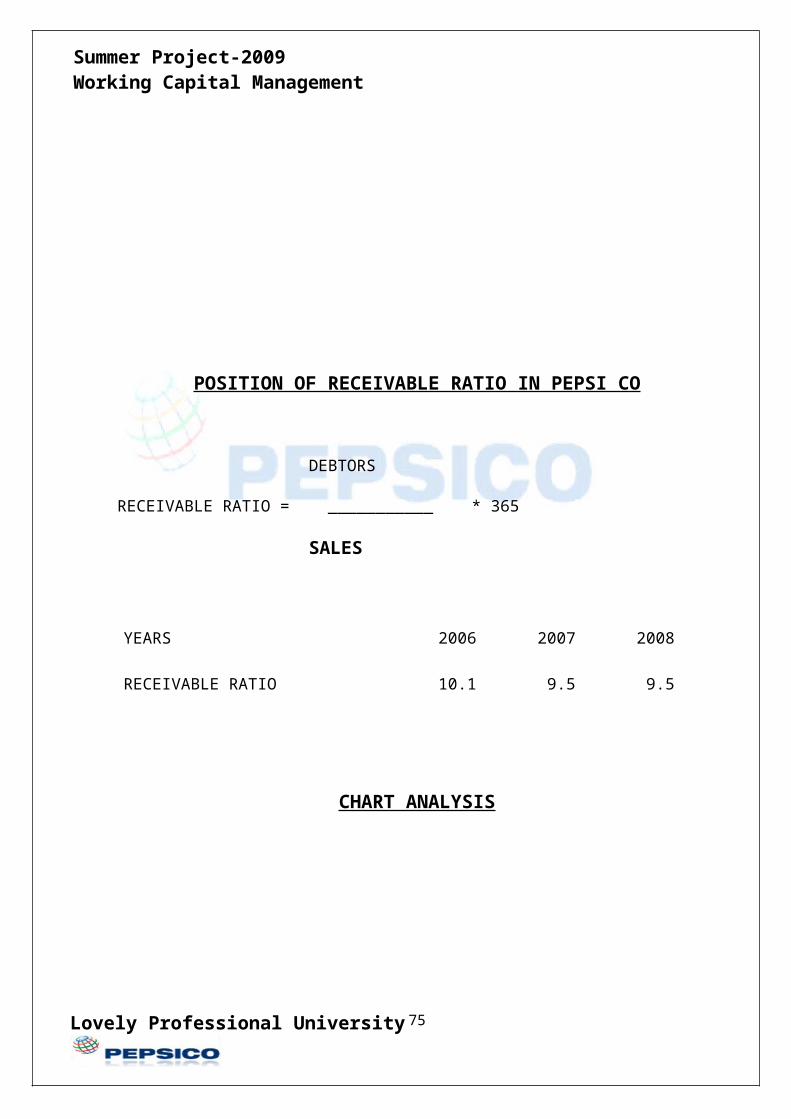
POSITION OF RECEIVABLE RATIO IN PEPSI CO
DEBTORS
RECEIVABLE RATIO = ___________ * 365
SALES
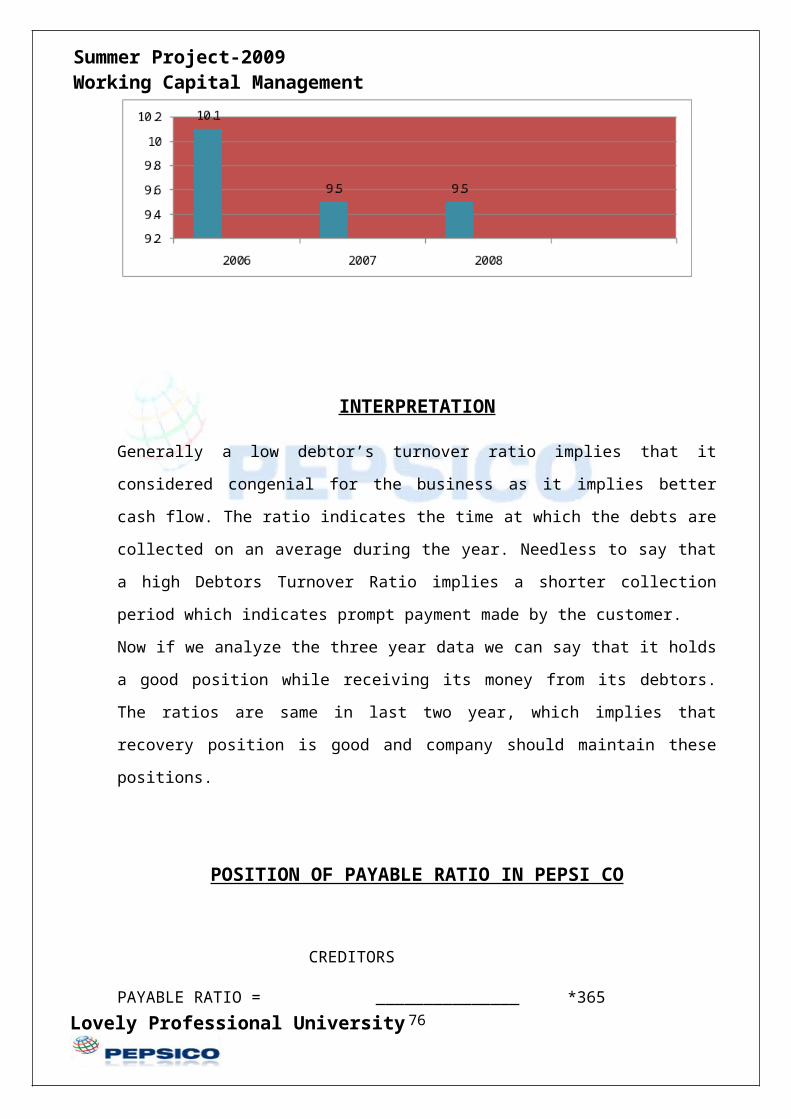
2006 2007 2008YEARS
RECEIVABLE RATIO 10.1 9.5 9.5
CHART ANALYSIS
INTERPRETATION
Generally a low debtor’s turnover ratio implies that it considered congenial for the business
as it implies better cash flow. The ratio indicates the time at which the debts are collected on
an average during the year. Needless to say that a high Debtors Turnover Ratio implies a
shorter collection period which indicates prompt payment made by the customer.
Lovely Professional University 58
Page 59
Summer Project-2009 Working Capital Management
Now if we analyze the three year data we can say that it holds a good position while
receiving its money from its debtors. The ratios are same in last two year, which implies that
recovery position is good and company should maintain these positions.
POSITION OF PAYABLE RATIO IN PEPSI CO
CREDITORS
PAYABLE RATIO = _______________ *365
COST OF SALES
2006 2007 2008YEARS
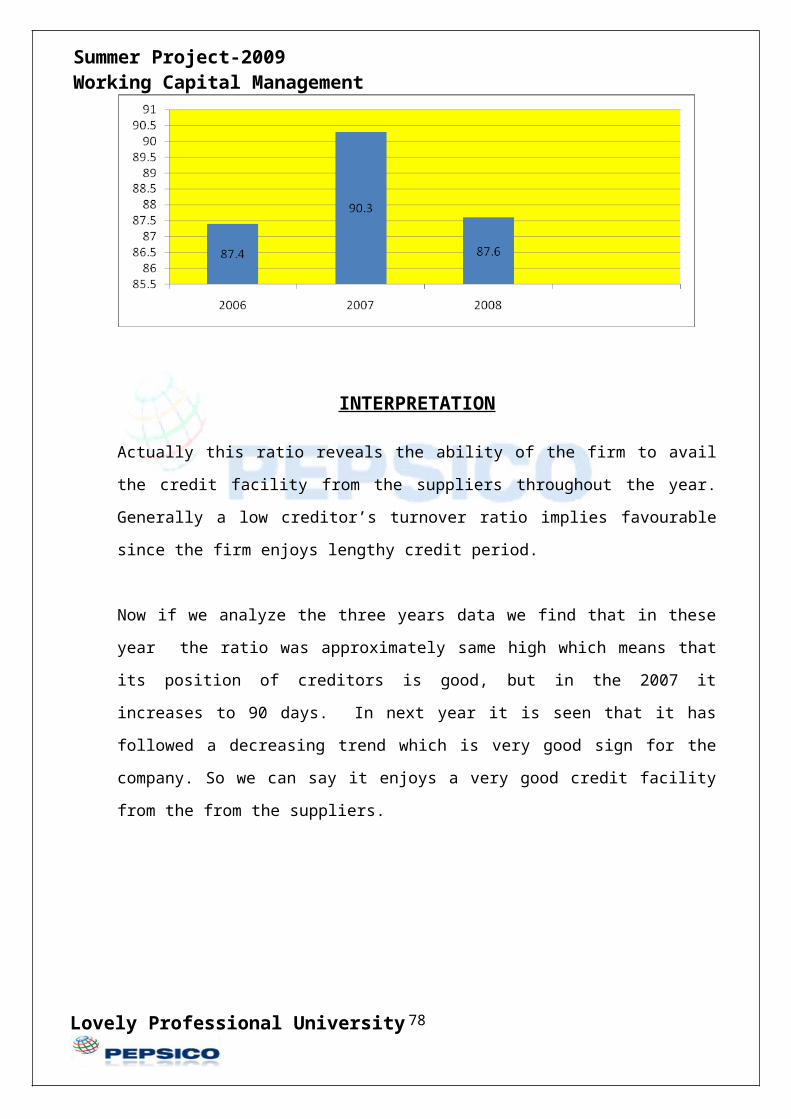
PAYABLE RATIO 87.4 90.3 87.6 (IN DAYS)
Lovely Professional University 59
Page 60
Summer Project-2009 Working Capital Management
CHART ANALYSIS
INTERPRETATION
Actually this ratio reveals the ability of the firm to avail the credit facility from the suppliers
throughout the year. Generally a low creditor’s turnover ratio implies favourable since the
firm enjoys lengthy credit period.
Now if we analyze the three years data we find that in these year the ratio was approximately
same high which means that its position of creditors is good, but in the 2007 it increases to 90
days. In next year it is seen that it has followed a decreasing trend which is very good sign
for the company. So we can say it enjoys a very good credit facility from the from the
suppliers.
Lovely Professional University 60
Page 61
Summer Project-2009 Working Capital Management
POSITION OF INVENTORY RATIO IN PEPSI CO
Average stock
INVENTORY TURNOVER RATIO. = ______________ * 365
Cost of goods sold
2006 2007 2008YEARS
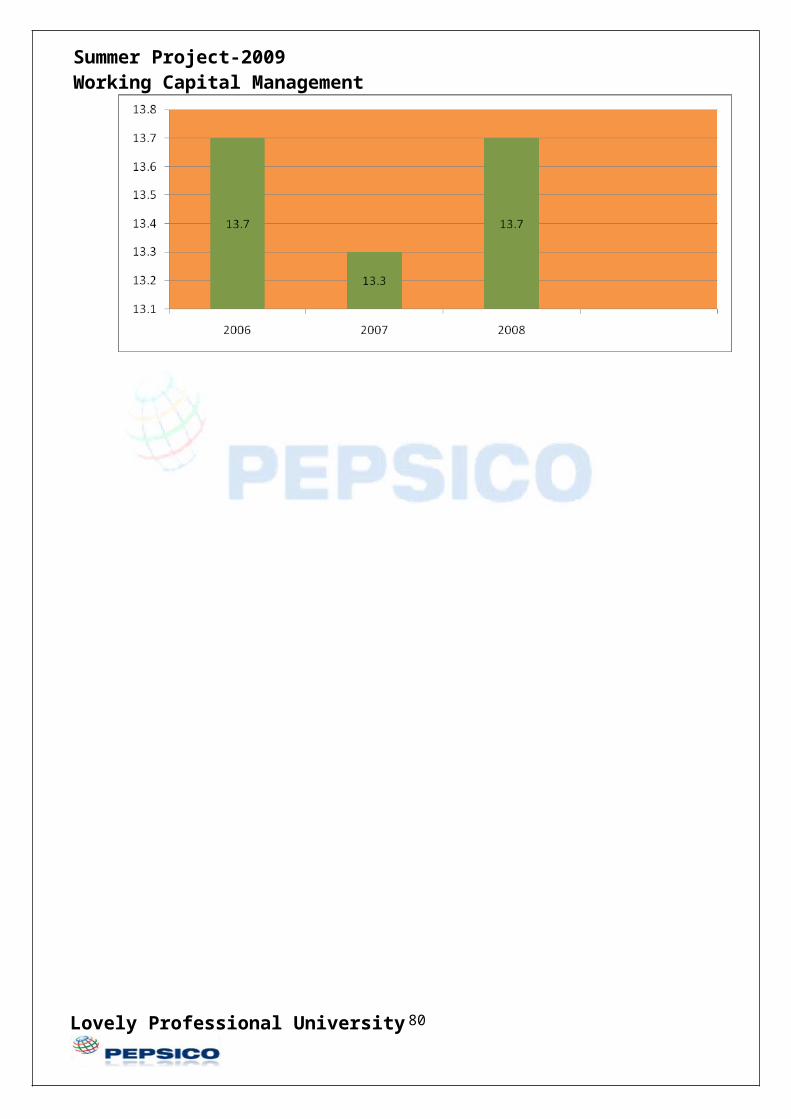
I.T.R. RATIO 13.7 13.3 13.7
CHART ANALYSIS
Lovely Professional University 61
Page 62
Summer Project-2009 Working Capital Management
INTERPRETATION
This ratio tells the story by which stock is converted into sales. A high stock turnover ratio
reveals the liquidity of the inventory i.e., how many times on an average, inventory is turned
over or sold during the year. If a firm maintains a minimum stock level in order to maximize
sales by quick rotation of inventory and the holding cost of inventory will be minimum. A
low stock turnover ratio reveals undesirable accumulation of obsolete stock.
By analyzing the three year data it seen that it follows an approximately same trend. We see
that from the year 2006 to 2008 it is more or less double which has been rectified in the year
2008. But it is needless to say that ratio the company maintains is very high and the company
is required to take measures to lower down this ratio as it affects the working capital cycle of
company and the flow of cash in the company.
POSITION OF CURRENT RATIO IN PEPSI CO
TOTAL CURRENT ASSET
CURRENT RATIO = ________________________
TOTAL CURRENT LIABILITY
YEARS 2006 2007 2008
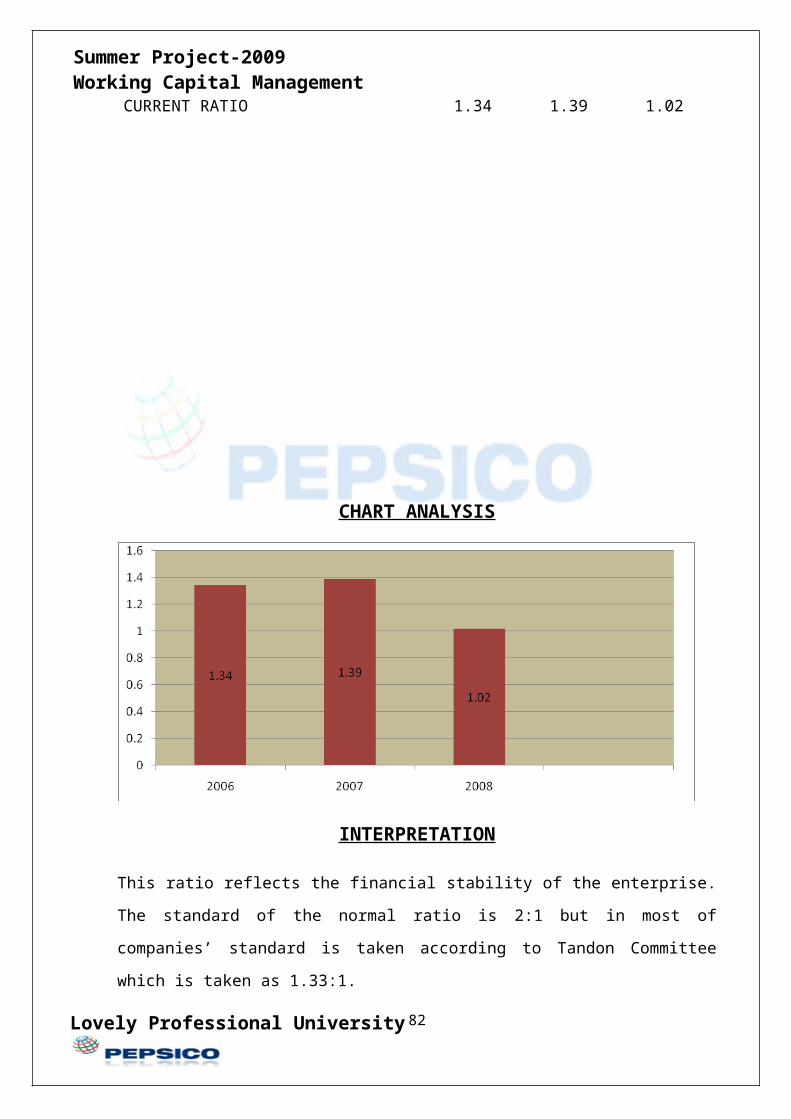
CURRENT RATIO 1.34 1.39 1.02
Lovely Professional University 62
Page 63
Summer Project-2009 Working Capital Management
CHART ANALYSIS
INTERPRETATION
This ratio reflects the financial stability of the enterprise. The standard of the normal ratio is
2:1 but in most of companies’ standard is taken according to Tandon Committee which is
taken as 1.33:1.
Now if we analyze the three years data it can be predicted that it holds a stable position all
throughout period but it is seen that it holds a low position than the standard one and the
company is required to improve its position.
Lovely Professional University 63
Page 64
Summer Project-2009 Working Capital Management
POSITION OF QUICK RATIO IN PEPSI CO
TOTAL LIQUID ASSET
QUICK RATIO = ________________________
TOTAL CURRENT LIABILITY
CHART ANALYSIS
INTERPRETATION
It is the ratio between quick liquid assets and quick liabilities. The normal value for such
ratio is taken to be 1:1. It is used as an assessment tool for testing the liquidity position of the
firm. It indicates the relationship between strictly liquid assets whose realizable value is
almost certain on one hand and strictly liquid liabilities on the other hand. Liquid assets
comprise all current assets minus stock.
By analyzing the three years data it can be said that its position was good in the year 2006
and 2007 but its decrease in the next year. But it is to be said that it is higher than the
standard in the year 2006 & 2007. Its shows the higher liquidity position of the company.
Lovely Professional University
YEARS 2006 2007 2008QUICK RATIO 1.08 1.13 0.84
64
Page 65
Summer Project-2009 Working Capital Management
WORKING CAPITAL TURNOVER RATIO
COST OF SALE
WORKING CAPITAL RATIO = __________________
NET WORKING CAPITAL
YEARS 2006 2007 2008
Working capital ratio 9.88 8.46 130.79
CHART ANALYSIS
INTERPRETATION
Lovely Professional University 65
Page 66
Summer Project-2009 Working Capital Management
This ratio indicates whether the investments in current assets or net current assets (i.e.,
working capital) have been properly utilized. In order words it shows the relationship
between sales and working capital. Higher the ratio lower is the investment in working
capital and higher is the profitability. But too high ratio indicates over trading.
This ratio is an important indicator about the working capital position. Now if we analyze the
three years data, we find that it follows an increasing trend which means that its investment in
working capital is lower and the company is utilizing more of its profit. But we find that
in2008 the ratio was increasing up to 130. In this year company takes much more short term
loans for its short time requirement which is not a good sign for the company and the
company is required to look into these matters closely.
Lovely Professional University 66
Page 67
Summer Project-2009 Working Capital Management
PROFITABILITY ANALYSIS
Particulars RS.IN MILL. $
2006 2007 2008
Net Sale 12730 13591 13,796
Cost of goods sold 6900 7370 7586Operating Profit before Interest 5830 6221 6210Operating Profit after Interest 5830 1071 649Profit/Loss before Tax 681 709 274Profit/Loss after Tax 522 532 162Dividend Payout/Drawing 0.41 0.53 0.65
Lovely Professional University 67
Page 68
Summer Project-2009 Working Capital Management
INCOME STATEMENT OF PEPSICO 2004 TO 2008
2004 2005 2006 2007 2008 TTM
Sales 10,906 11,885 12,730 13,591 13,796 13,404Operating Income 976 1,023 1,017 1,071 649 617Income Tax 232 247 159 177 112 -9Net Income 457 466 522 532 162 223
Lovely Professional University 68
Page 69
Summer Project-2009 Working Capital Management
INTERPRETATION
Analyzing the last five year data we say that sales have increasing trend. Its shows the
growth of the company. The profits are increasing year by year but in 2008 the profits
are very low from previous year. In this year company takes huge amount of short term
loans in this way they give more interest on this. This is the main reason the company
profits are very low. Now in 2009 the profits of the company is 223 mill $ its shows
amazing growth rate of the company In two quarters of 2009 company sales are equal
to last year. This year company cover all the loses of previous year.
Lovely Professional University 69
Page 70
Summer Project-2009 Working Capital Management
FINDINGS
Pepsi bottling group has once again, demonstrated the power of our operating
capabilities and unique assets in 2008.
Comparable diluted earnings per share growth of 3% to $2.27
Worldwide revenue growth of 2%
Comparable operating income growth of 2%
Returned $624 million in cash to shareholder
This year company takes $1400mill short term loans because of macro
economics downturns in economy.
In 2008 company gives .65$ dividend to his share holder.
This year company have 2% growth in EPS this is very low from the previous
year because company has paid many interest on short term loans.
Lovely Professional University 70
Page 71
Summer Project-2009 Working Capital Management
Lovely Professional University 71
Page 72
Summer Project-2009 Working Capital Management
Pepsi bottling group has once again, demonstrated the power of our operating capabilities
and unique assets in 2008. While facing unprecedented macroeconomics challenges
throughout the world, PBG showed flexibility and discipline to advance our business
priorities and become a stronger, more focused organisation.
The overall performance of PepsiCo is getting on a good track. The total
turnover of the company has registered a growth of 205 Million where as the operating
profits for the year were lower by 422 million mainly on the accounts of increase in the
volume or sales, higher realization and effective cost control measures taken by the company.
The profit before tax is 709 million at against 681 millions in the previous year. The cash
earning of the company improved substantially to 1437 million as against 1228 million in the
last financial year. With the increase in capacity on account of expansion projects being
undertaken by the company, it is expected that the company would be in a position to
maintain the growth in future years.
Company has parked its surplus fund in the various debt schemes of
mutual fund. There is an Investment in non controlled affiliates of 619 million in current
year. Company is cash rich but as there are expansion and diversification plans under the
pipeline, company is not utilizing these funds. For meeting the working capital needs and
capacity expansion needs it has borrowed from banks.
During the year company has embarked upon expansion projects which
would effectively enhance the capacity of the company. With the capacitive power plants
already in operation and expansion projects under implementation, it is expected that the
beverages division of the company will do well in the foreseeable future.
Lovely Professional University 72
Page 73
Summer Project-2009 Working Capital Management
They achieved these results by adapting quickly to the economic environment
and by focusing on several business drivers to grow our top line, improve cost and
productivity, and strengthen our people and culture.
Lovely Professional University 73
Page 74
Summer Project-2009 Working Capital Management
Lovely Professional University 74
Page 75
Summer Project-2009 Working Capital Management
Measures to Improve Working Capital Management at PEPSICO:
The essence of effective working capital management is proper cash flow forecasting.
This should take into account the impact of unforeseen events, market cycles, loss of
a prime customer and actions by competitors. So the effect of unforeseen demands of
working capital should be factored by company. This was one of its reasons for the
variation of its revised working capital projection from the earlier projection.
It pays to have contingency plans to tide over unexpected events. While market-
leaders can manage uncertainty better, even other companies must have risk-
management procedures. These must be based on objective and realistic view of the
role of working capital.
Addressing the issue of working capital on a corporate-wide basis has certain
advantages. Cash generated at one location can well be utilized at another. For this to
happen, information access, efficient banking channels, good linkages between
production and billing, internal systems to move cash and good treasury practices
should be in place.
An innovative approach, combining operational and financial skills and an all-
encompassing view of the company’s operations will help in identifying and
implementing strategies that generate short-term cash. This can be achieved by having
the right set of executives who are responsible for setting targets and performance
levels. They could be then held accountable for delivering, encouraged to be
enterprising and to act as change agents.
Effective dispute management procedures in relation to customers will go along way
in freeing up cash otherwise locked in due to disputes. It will also improve customer
service and free up time for legitimate activities like sales, order entry and cash
collection. Overall, efficiency will increase due to reduced operating costs.
Lovely Professional University 75
Page 76
Summer Project-2009 Working Capital Management
Working capital management is an important yardstick to measure a company
operational and financial efficiency. This aspect must form part of the strategic and
operational thinking. Efforts should constantly be made to improve the working
capital position. This will yield greater efficiencies and improve customer
satisfaction.
Inventories should be managed on a line-by-line basis using the 80/20 rule.
Placing the responsibility for collecting the debt upon the centre that made the sale.
i.e., cold rolled, hot rolled, galvanized etc.
Lovely Professional University 76
Page 77
Summer Project-2009 Working Capital Management
Lovely Professional University 77
Page 78
Summer Project-2009 Working Capital Management
www.pepsico.com
www.yahoofinance.com
http://www.rediff.com/money/2003/aug/21pepsi.htm
http://www.stjohns.edu/media/3/80dc682a41f44209b5da9de5f8ac8bec.pdf
http://quicktake.morningstar.com/stocknet/cashflow10.aspx?Country=USA&Symbol=PBG
http://quicktake.morningstar.com/stocknet/EfficiencyRatios10.aspx?Country=USA&Symbol=PBG
http://www.sirpepsi.com/pepsi11.htm
REFRENCE
Shashi k. Gupta (2008) Financial Management, kalyani Publications
Lovely Professional University 78
Page 79
Summer Project-2009 Working Capital Management
Lovely Professional University 79
Page 80
Summer Project-2009 Working Capital Management
BALANCE SHEET OF PEPSI CO
PERIOD ENDING 27-Dec-08 29-Dec-07 30-Dec-06
Assets
Current Assets
Cash And Cash Equivalents 2,064,000 910,000 1,651,000
Short Term Investments 213,000 1,571,000 1,171,000
Net Receivables 4,683,000 4,389,000 3,725,000
Inventory 2,522,000 2,290,000 1,926,000
Other Current Assets 1,324,000 991,000 657,000
Total Current Assets 10,806,000 10,151,000 9,130,000
Long Term Investments 3,998,000 4,475,000 3,839,000
Property Plant and Equipment 11,663,000 11,228,000 9,687,000
Goodwill 5,124,000 5,169,000 4,594,000
Intangible Assets 1,860,000 2,044,000 1,849,000
Accumulated Amortization - - -
Other Assets 2,324,000 1,356,000 599,000
Deferred Long Term Asset Charges 219,000 205,000 232,000
Total Assets 35,994,000 34,628,000 29,930,000
Liabilities
Current Liabilities
Accounts Payable 6,494,000 6,209,000 5,271,000
Lovely Professional University 80
Page 81
Summer Project-2009 Working Capital Management
Short/Current Long Term Debt 369,000 - 274,000
Other Current Liabilities 1,924,000 1,544,000 1,315,000
Total Current Liabilities 8,787,000 7,753,000 6,860,000
Long Term Debt 7,858,000 4,203,000 2,550,000
Other Liabilities 7,017,000 4,792,000 4,624,000
Deferred Long Term Liability Charges 226,000 646,000 528,000
Minority Interest - - -
Negative Goodwill - - -
Total Liabilities 23,888,000 17,394,000 14,483,000
Stockholders' Equity
Misc Stocks Options Warrants - - (79,000)
Redeemable Preferred Stock (97,000) - -
Preferred Stock - 41,000 -
Common Stock 30,000 30,000 30,000
Retained Earnings 30,638,000 28,184,000 24,837,000
Treasury Stock (14,122,000) (10,519,000) (7,758,000)
Capital Surplus 351,000 450,000 584,000
Other Stockholder Equity (4,694,000) (952,000) (2,246,000)
Total Stockholder Equity 12,203,000 17,234,000 15,447,000
Net Tangible Assets $5,219,000 $10,021,000 $9,004,000
Lovely Professional University 81
Page 82
Summer Project-2009 Working Capital Management
INCOME STATEMENT OF PEPSI CO
PERIOD ENDING 27-Dec-08 29-Dec-07 30-Dec-06
Total Revenue 13,796,000 13,591,000 12,730,000
Cost of Revenue 7,586,000 7,370,000 6,810,000
Gross Profit 6,210,000 6,221,000 5,920,000
Operating Expenses
Research Development - - -
Selling General and Administrative 5,149,000 5,150,000 4,903,000
Non Recurring 412,000 - -
Others - - -
Total Operating Expenses - - -
Operating Income or Loss 649,000 1,071,000 1,017,000
Income from Continuing Operations
Total Other Income/Expenses Net (25,000) 6,000 (11,000)
Earnings Before Interest And Taxes 564,000 983,000 947,000
Interest Expense 290,000 274,000 266,000
Income Before Tax 274,000 709,000 681,000
Income Tax Expense 112,000 177,000 159,000
Minority Interest (60,000) (94,000) (59,000)
Net Income From Continuing Ops 162,000 532,000 522,000
Non-recurring Events
Discontinued Operations - - -
Extraordinary Items - - -
Effect Of Accounting Changes - - -
Lovely Professional University 82
Page 83
Summer Project-2009 Working Capital Management
Other Items - - -
Net Income 162,000 532,000 522,000
Preferred Stock And Other Adjustments - - -
Net Income Applicable To Common Shares $162,000 $532,000 $522,000
Lovely Professional University 83