WORKING CAPITAL - Meaning of Working Capital Capital required for a business can be classified under two main categories via, 1) Fixed Capital 2) Working Capital Every business needs funds for two purposes for its establishment and to carry out its day- to-day operations. Long terms funds are required to create production facilities through purchase of fixed assets such as p&m, land, building, furniture, etc. Investments in these assets represent that part of firm’s capital which is blocked on permanent or fixed basis and is called fixed capital. Funds are also needed for short-term purposes for the purchase of raw material, payment of wages and other day – to- day expenses etc. These funds are known as working capital. In simple words, working capital refers to that part of the firm’s capital which is required for financing short- term or current assets such as
Transcript
WORKING CAPITAL - Meaning of
Working Capital
Capital required for a business can be classified under two main
categories via,
1) Fixed Capital
2) Working Capital
Every business needs funds for two purposes for its establishment
and to carry out its day- to-day operations. Long terms funds are required
to create production facilities through purchase of fixed assets such as
p&m, land, building, furniture, etc. Investments in these assets represent
that part of firm’s capital which is blocked on permanent or fixed basis
and is called fixed capital. Funds are also needed for short-term purposes
for the purchase of raw material, payment of wages and other day – to-
day expenses etc.
These funds are known as working capital. In simple words,
working capital refers to that part of the firm’s capital which is required
for financing short- term or current assets such as cash, marketable
securities, debtors & inventories. Funds, thus, invested in current assts
keep revolving fast and are being constantly converted in to cash and this
cash flows out again in exchange for other current assets. Hence, it is also
known as revolving or circulating capital or short term capital.
CONCEPT OF WORKING CAPITAL
There are two concepts of working capital:
1. Gross working capital
2. Net working capital
The gross working capital is the capital invested in the total current
assets of the enterprises current assets are those
Assets which can convert in to cash within a short period normally one
accounting year.
CONSTITUENTS OF CURRENT ASSETS
1) Cash in hand and cash at bank
2) Bills receivables
3) Sundry debtors
4) Short term loans and advances.
5) Inventories of stock as:
a. Raw material
b. Work in process
c. Stores and spares
d. Finished goods
6. Temporary investment of surplus funds.
7. Prepaid expenses
8. Accrued incomes.
9. Marketable securities.
In a narrow sense, the term working capital refers to the net
working. Net working capital is the excess of current assets over
current liability, or, say:
NET WORKING CAPITAL = CURRENT ASSETS –
CURRENT LIABILITIES.
Net working capital can be positive or negative. When the
current assets exceeds the current liabilities are more than the
current assets. Current liabilities are those liabilities, which are
intended to be paid in the ordinary course of business within a
short period of normally one accounting year out of the current
assts or the income business.
CONSTITUENTS OF CURRENT LIABILITIES
1. Accrued or outstanding expenses.
2. Short term loans, advances and deposits.
3. Dividends payable.
4. Bank overdraft.
5. Provision for taxation , if it does not amt. to app. Of
profit.
6. Bills payable.
7. Sundry creditors.
The gross working capital concept is financial or going concern concept
whereas net working capital is an accounting concept of working capital.
Both the concepts have their own merits.
The gross concept is sometimes preferred to the concept of working
capital for the following reasons:
1. It enables the enterprise to provide correct amount of
working capital at correct time.
2. Every management is more interested in total current
assets with which it has to operate then the source from
where it is made available.
3. It take into consideration of the fact every increase in
the funds of the enterprise would increase its working
capital.
4. This concept is also useful in determining the rate of
return on investments in working capital. The net
working capital concept, however, is also important for
following reasons:
It is qualitative concept, which indicates the firm’s ability
to meet to its operating expenses and short-term liabilities.
IT indicates the margin of protection available to the
short term creditors.
It is an indicator of the financial soundness of
enterprises.
It suggests the need of financing a part of working capital
requirement out of the permanent sources of funds.
CLASSIFICATION OF WORKING CAPITAL
Working capital may be classified in to ways:
o On the basis of concept.
o On the basis of time.
On the basis of concept working capital can be classified as gross
working capital and net working capital. On the basis of time,
working capital may be classified as:
Permanent or fixed working capital.
Temporary or variable working capital
PERMANENT OR FIXED WORKING CAPITAL
Permanent or fixed working capital is minimum amount which is required
to ensure effective utilization of fixed facilities and for maintaining the
circulation of current assets. Every firm has to maintain a minimum level
of raw material, work- in-process, finished goods and cash balance. This
minimum level of current assts is called permanent or fixed working
capital as this part of working is permanently blocked in current assets. As
the business grow the requirements of working capital also increases due
to increase in current assets.
TEMPORARY OR VARIABLE WORKING CAPITAL
Temporary or variable working capital is the amount of working capital
which is required to meet the seasonal demands and some special
exigencies. Variable working capital can further be classified as seasonal
working capital and special working capital. The capital required to meet
the seasonal need of the enterprise is called seasonal working capital.
Special working capital is that part of working capital which is required to
meet special exigencies such as launching of extensive marketing for
conducting research, etc.
Temporary working capital differs from permanent working capital in the
sense that is required for short periods and cannot be permanently
employed gainfully in the business.
IMPORTANCE OR ADVANTAGE OF ADEQUATE WORKING
CAPITAL
SOLVENCY OF THE BUSINESS: Adequate working capital
helps in maintaining the solvency of the business by providing
uninterrupted of production.
Goodwill: Sufficient amount of working capital enables a firm
to make prompt payments and makes and maintain the goodwill.
Easy loans: Adequate working capital leads to high solvency
and credit standing can arrange loans from banks and other on easy
and favorable terms.
Cash Discounts: Adequate working capital also enables a
concern to avail cash discounts on the purchases and hence reduces
cost.
Regular Supply of Raw Material: Sufficient working
capital ensures regular supply of raw material and continuous
production.
Regular Payment Of Salaries, Wages And Other Day
TO Day Commitments: It leads to the satisfaction of the
employees and raises the morale of its employees, increases their
efficiency, reduces wastage and costs and enhances production and
profits.
Exploitation Of Favorable Market Conditions: If a firm
is having adequate working capital then it can exploit the favorable
market conditions such as purchasing its requirements in bulk
when the prices are lower and holdings its inventories for higher
prices.
Ability To Face Crises: A concern can face the situation
during the depression.
Quick And Regular Return On Investments: Sufficient
working capital enables a concern to pay quick and regular of
dividends to its investors and gains confidence of the investors and
can raise more funds in future.
High Morale: Adequate working capital brings an environment
of securities, confidence, high morale which results in overall
efficiency in a business.
EXCESS OR INADEQUATE WORKING CAPITAL
Every business concern should have adequate amount of working
capital to run its business operations. It should have neither redundant
or excess working capital nor inadequate nor shortages of working
capital. Both excess as well as short working capital positions are bad
for any business. However, it is the inadequate working capital which
is more dangerous from the point of view of the firm.
DISADVANTAGES OF REDUNDANT OR EXCESSIVE
WORKING CAPITAL
1. Excessive working capital means ideal funds which
earn no profit for the firm and business cannot earn
the required rate of return on its investments.
2. Redundant working capital leads to unnecessary
purchasing and accumulation of inventories.
3. Excessive working capital implies excessive debtors
and defective credit policy which causes higher
incidence of bad debts.
4. It may reduce the overall efficiency of the business.
5. If a firm is having excessive working capital then the
relations with banks and other financial institution
may not be maintained.
6. Due to lower rate of return n investments, the values
of shares may also fall.
7. The redundant working capital gives rise to
speculative transactions
DISADVANTAGES OF INADEQUATE WORKING CAPITAL
Every business needs some amounts of working capital. The need for
working capital arises due to the time gap between production and
realization of cash from sales. There is an operating cycle involved in
sales and realization of cash. There are time gaps in purchase of raw
material and production; production and sales; and realization of cash.
Thus working capital is needed for the following purposes:
For the purpose of raw material, components and spares.
To pay wages and salaries
To incur day-to-day expenses and overload costs such as office
expenses.
To meet the selling costs as packing, advertising, etc.
To provide credit facilities to the customer.
To maintain the inventories of the raw material, work-in-
progress, stores and spares and finished stock.
For studying the need of working capital in a business, one has to
study the business under varying circumstances such as a new concern
requires a lot of funds to meet its initial requirements such as
promotion and formation etc. These expenses are called preliminary
expenses and are capitalized. The amount needed for working capital
depends upon the size of the company and ambitions of its promoters.
Greater the size of the business unit, generally larger will be the
requirements of the working capital.
The requirement of the working capital goes on increasing with the
growth and expensing of the business till it gains maturity. At maturity
the amount of working capital required is called normal working
capital.
There are others factors also influence the need of working capital in a
business.
FACTORS DETERMINING THE WORKING CAPITAL
REQUIREMENTS
1. NATURE OF BUSINESS: The requirements of
working is very limited in public utility undertakings such as
electricity, water supply and railways because they offer cash
sale only and supply services not products, and no funds are
tied up in inventories and receivables. On the other hand the
trading and financial firms requires less investment in fixed
assets but have to invest large amt. of working capital along
with fixed investments.
2. SIZE OF THE BUSINESS: Greater the size of the
business, greater is the requirement of working capital.
3. PRODUCTION POLICY: If the policy is to keep
production steady by accumulating inventories it will require
higher working capital.
4. LENTH OF PRDUCTION CYCLE: The longer
the manufacturing time the raw material and other supplies
have to be carried for a longer in the process with progressive
increment of labor and service costs before the final product is
obtained. So working capital is directly proportional to the
length of the manufacturing process.
5. SEASONALS VARIATIONS: Generally, during
the busy season, a firm requires larger working capital than in
slack season.
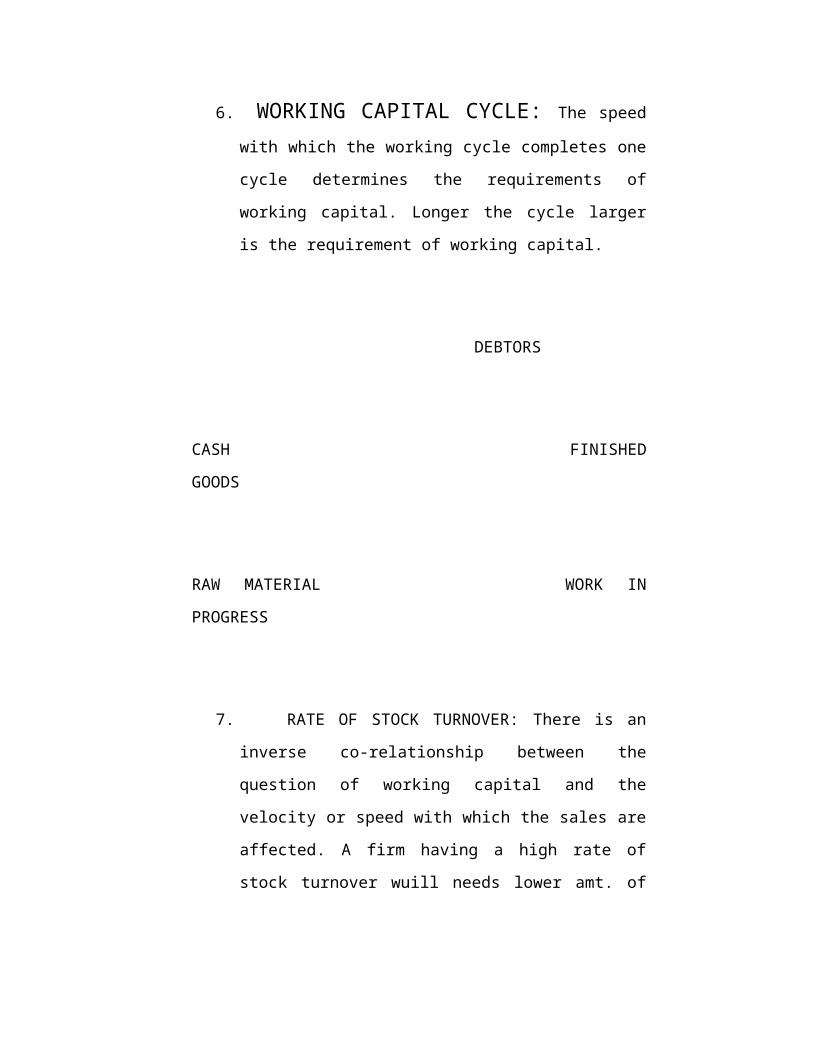
6. WORKING CAPITAL CYCLE: The speed with
which the working cycle completes one cycle determines the
requirements of working capital. Longer the cycle larger is the
requirement of working capital.
DEBTORS
CASH FINISHED GOODS
RAW MATERIAL WORK IN PROGRESS
7. RATE OF STOCK TURNOVER: There is an inverse co-
relationship between the question of working capital and the
velocity or speed with which the sales are affected. A firm
having a high rate of stock turnover wuill needs lower amt. of
working capital as compared to a firm having a low rate of
turnover.
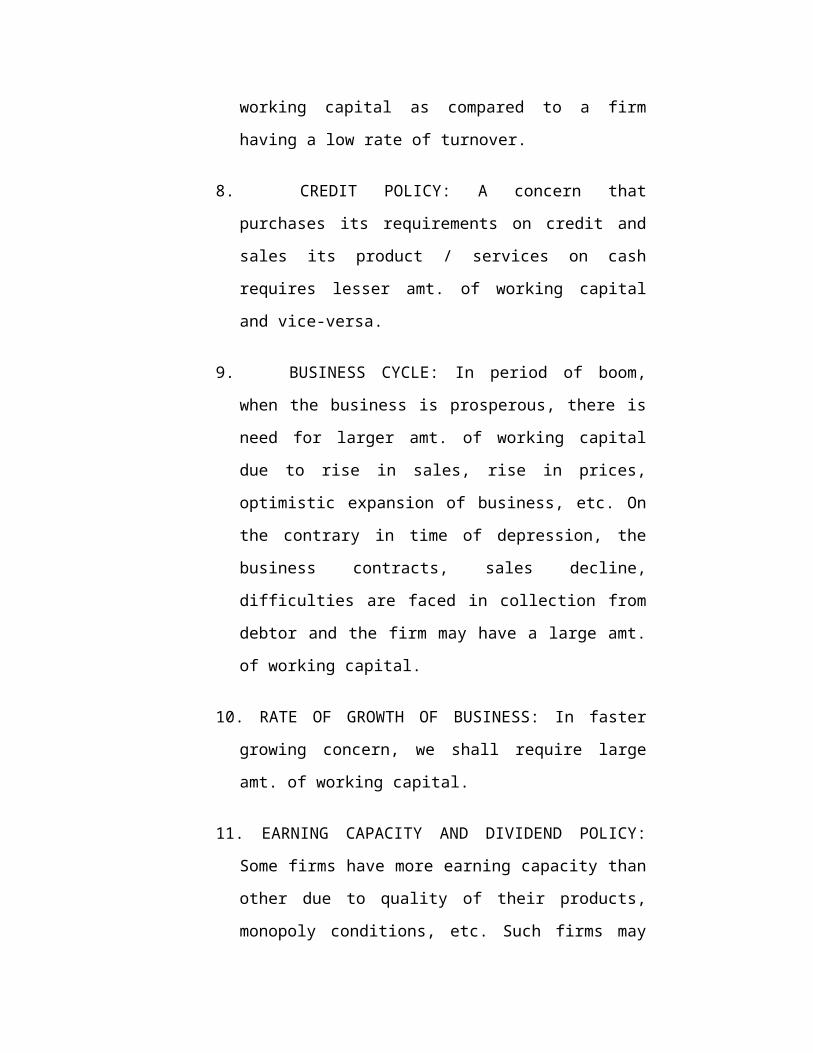
8. CREDIT POLICY: A concern that purchases its requirements
on credit and sales its product / services on cash requires lesser
amt. of working capital and vice-versa.
9. BUSINESS CYCLE: In period of boom, when the business
is prosperous, there is need for larger amt. of working capital
due to rise in sales, rise in prices, optimistic expansion of
business, etc. On the contrary in time of depression, the
business contracts, sales decline, difficulties are faced in
collection from debtor and the firm may have a large amt. of
working capital.
10. RATE OF GROWTH OF BUSINESS: In faster growing
concern, we shall require large amt. of working capital.
11. EARNING CAPACITY AND DIVIDEND POLICY: Some
firms have more earning capacity than other due to quality of
their products, monopoly conditions, etc. Such firms may
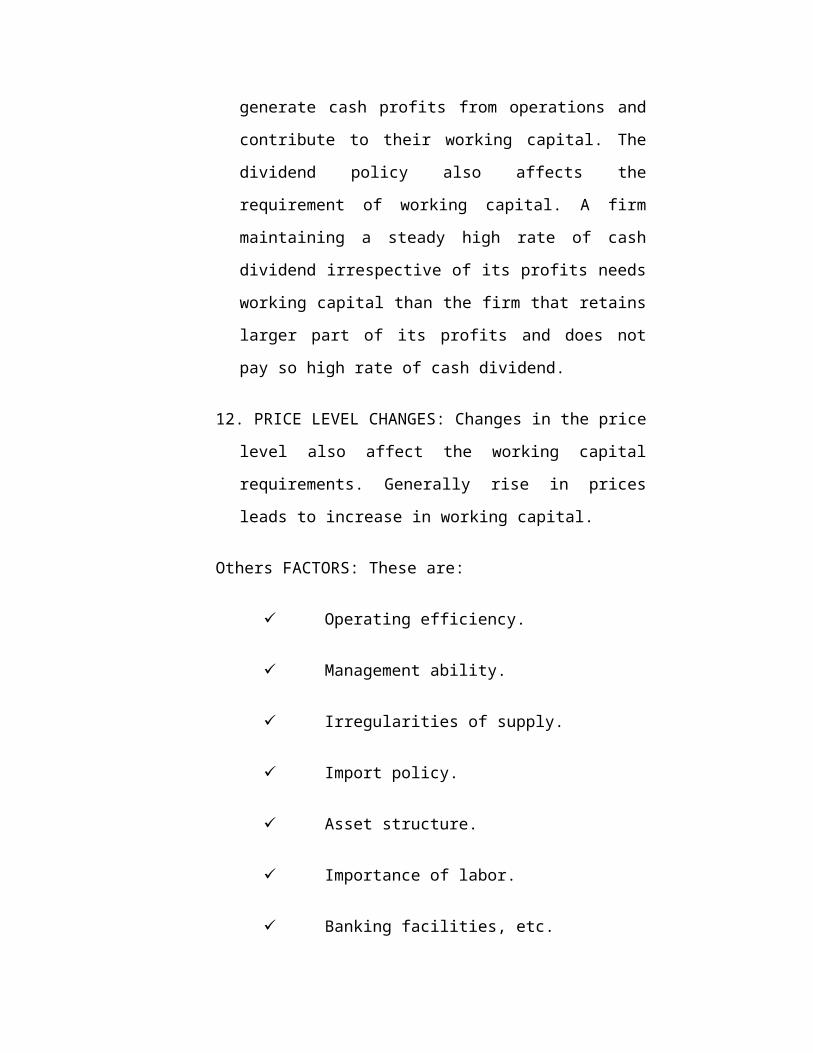
generate cash profits from operations and contribute to their
working capital. The dividend policy also affects the
requirement of working capital. A firm maintaining a steady
high rate of cash dividend irrespective of its profits needs
working capital than the firm that retains larger part of its
profits and does not pay so high rate of cash dividend.
12. PRICE LEVEL CHANGES: Changes in the price level also
affect the working capital requirements. Generally rise in
prices leads to increase in working capital.
Others FACTORS: These are:
Operating efficiency.
Management ability.
Irregularities of supply.
Import policy.
Asset structure.
Importance of labor.
Banking facilities, etc.
MANAGEMENT OF WORKING CAPITAL
Management of working capital is concerned with the problem that
arises in attempting to manage the current assets, current liabilities.
The basic goal of working capital management is to manage the
current assets and current liabilities of a firm in such a way that a
satisfactory level of working capital is maintained, i.e. it is neither
adequate nor excessive as both the situations are bad for any firm.
There should be no shortage of funds and also no working capital
should be ideal. WORKING CAPITAL MANAGEMENT
POLICES of a firm has a great on its probability, liquidity and
structural health of the organization. So working capital
management is three dimensional in nature as
1. It concerned with the formulation of policies with
regard to profitability, liquidity and risk.
2. It is concerned with the decision about the
composition and level of current assets.
3. It is concerned with the decision about the
composition and level of current liabilities.
WORKING CAPITAL ANALYSIS
As we know working capital is the life blood and the centre of a
business. Adequate amount of working capital is very much
essential for the smooth running of the business. And the most
important part is the efficient management of working capital in
right time. The liquidity position of the firm is totally effected by
the management of working capital. So, a study of changes in the
uses and sources of working capital is necessary to evaluate the
efficiency with which the working capital is employed in a
business. This involves the need of working capital analysis.
The analysis of working capital can be conducted through a
number of devices, such as:
1. Ratio analysis.
2. Fund flow analysis.
3. Budgeting.
1. RATIO ANALYSIS
A ratio is a simple arithmetical expression one number to another.
The technique of ratio analysis can be employed for measuring
short-term liquidity or working capital position of a firm. The
following ratios can be calculated for these purposes:
1. Current ratio.
2. Quick ratio
3. Absolute liquid ratio
4. Inventory turnover.
5. Receivables turnover.
6. Payable turnover ratio.
7. Working capital turnover ratio.
8. Working capital leverage
9. Ratio of current liabilities to tangible net worth.
2. FUND FLOW ANALYSIS
Fund flow analysis is a technical device designated to the study the
source from which additional funds were derived and the use to
which these sources were put. The fund flow analysis consists of:
a. Preparing schedule of changes of working
capital
b. Statement of sources and application of funds.
It is an effective management tool to study the changes in financial
position (working capital) business enterprise between beginning
and ending of the financial dates.
3. WORKING CAPITAL BUDGET
A budget is a financial and / or quantitative expression of business
plans and polices to be pursued in the future period time. Working
capital budget as a part of the total budge ting process of a business
is prepared estimating future long term and short term working
capital needs and sources to finance them, and then comparing the
budgeted figures with actual performance for calculating the
variances, if any, so that corrective actions may be taken in future.
He objective working capital budget is to ensure availability of
funds as and needed, and to ensure effective utilization of these
resources. The successful implementation of working capital
budget involves the preparing of separate budget for each element
of working capital, such as, cash, inventories and receivables etc.
ANALYSIS OF SHORT – TERM FINANCIAL POSITION OR
TEST OF LIQUIDITY
The short –term creditors of a company such as suppliers of
goods of credit and commercial banks short-term loans are
primarily interested to know the ability of a firm to meet its
obligations in time. The short term obligations of a firm can be
met in time only when it is having sufficient liquid assets. So to
with the confidence of investors, creditors, the smooth
functioning of the firm and the efficient use of fixed assets the
liquid position of the firm must be strong. But a very high degree
of liquidity of the firm being tied – up in current assets.
Therefore, it is important proper balance in regard to the liquidity
of the firm. Two types of ratios can be calculated for measuring
short-term financial position or short-term solvency position of
the firm.
1. Liquidity ratios.
2. Current assets movements ‘ratios.
A) LIQUIDITY RATIOS
Liquidity refers to the ability of a firm to meet its current
obligations as and when these become due. The short-term
obligations are met by realizing amounts from current, floating
or circulating assts. The current assets should either be liquid or
near about liquidity. These should be convertible in cash for
paying obligations of short-term nature. The sufficiency or
insufficiency of current assets should be assessed by comparing
them with short-term liabilities. If current assets can pay off the
current liabilities then the liquidity position is satisfactory. On
the other hand, if the current liabilities cannot be met out of the
current assets then the liquidity position is bad. To measure the
liquidity of a firm, the following ratios can be calculated:
1. CURRENT RATIO
2. QUICK RATIO
3. ABSOLUTE LIQUID RATIO
1. CURRENT RATIO
Current Ratio, also known as working capital ratio is a measure
of general liquidity and its most widely used to make the analysis
of short-term financial position or liquidity of a firm. It is
defined as the relation between current assets and current
liabilities. Thus,
CURRENT RATIO = CURRENT ASSETS
CURRENT LIABILITES
The two components of this ratio are:
1) CURRENT ASSETS
2) CURRENT LIABILITES
Current assets include cash, marketable securities, bill
receivables, sundry debtors, inventories and work-in-progresses.
Current liabilities include outstanding expenses, bill payable,
dividend payable etc.
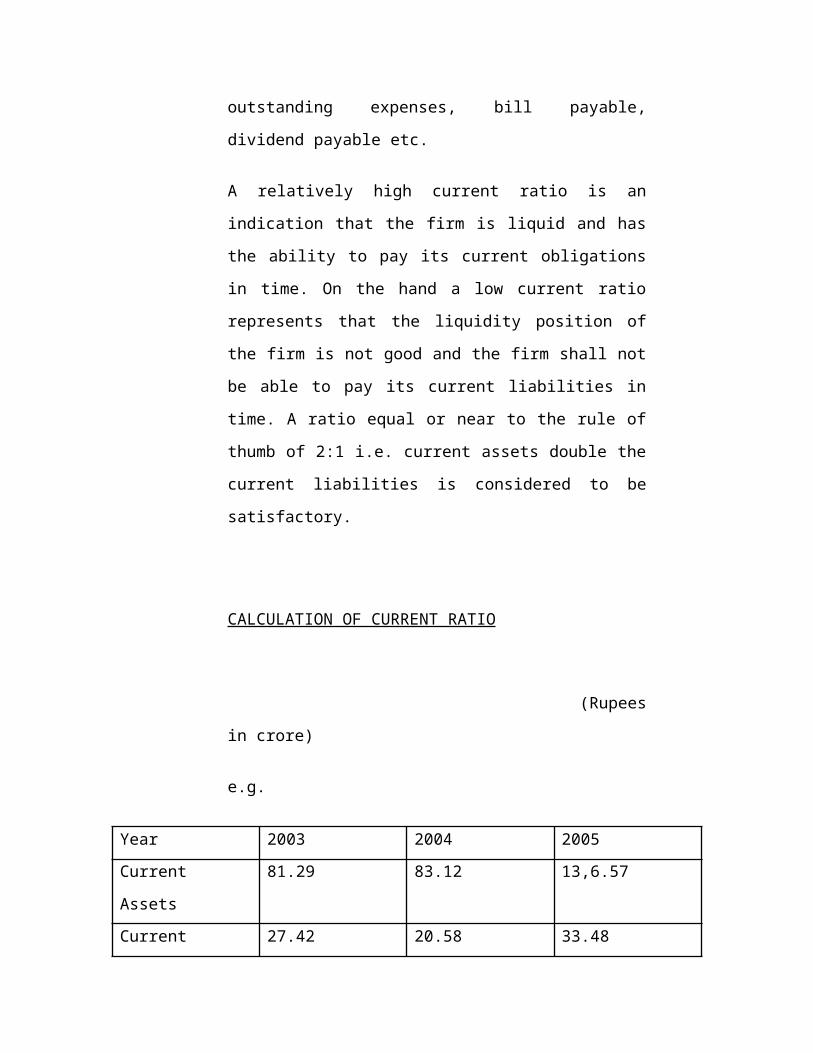
A relatively high current ratio is an indication that the firm is
liquid and has the ability to pay its current obligations in time.
On the hand a low current ratio represents that the liquidity
position of the firm is not good and the firm shall not be able to
pay its current liabilities in time. A ratio equal or near to the rule
of thumb of 2:1 i.e. current assets double the current liabilities is
considered to be satisfactory.
CALCULATION OF CURRENT RATIO
(Rupees in
crore)
e.g.
Year 2003 2004 2005
Current Assets 81.29 83.12 13,6.57
Current Liabilities 27.42 20.58 33.48
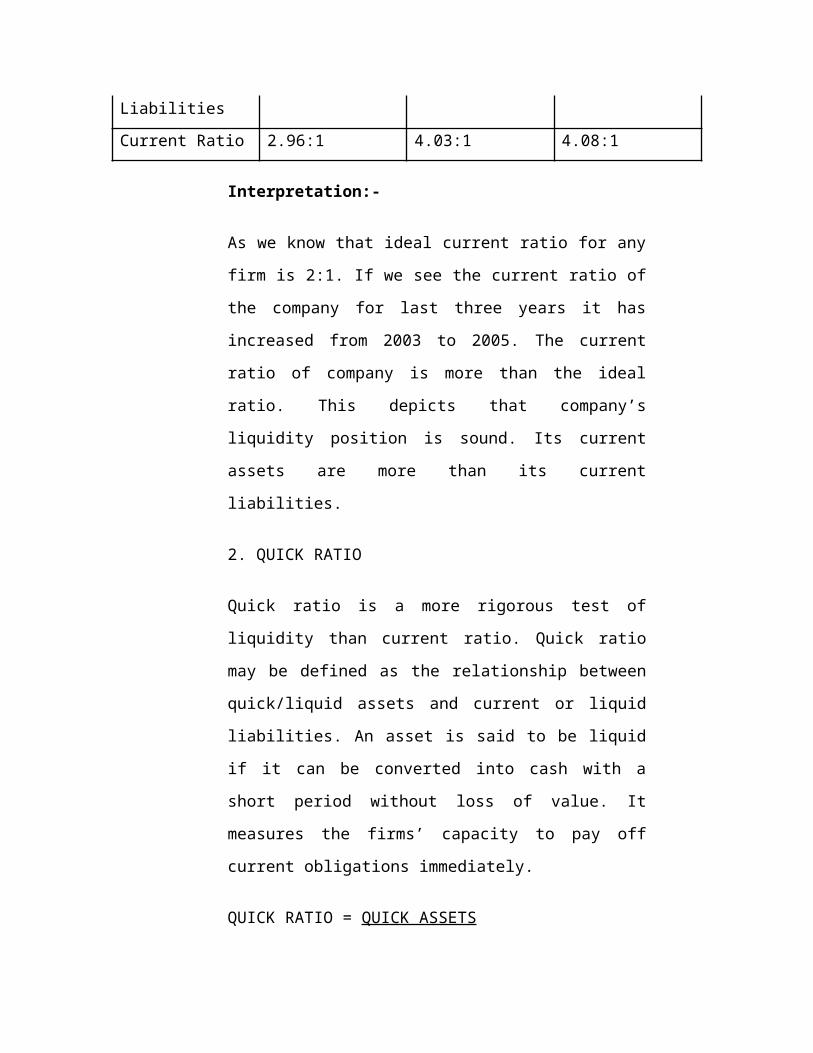
Current Ratio 2.96:1 4.03:1 4.08:1
Interpretation:-
As we know that ideal current ratio for any firm is 2:1. If we see
the current ratio of the company for last three years it has
increased from 2003 to 2005. The current ratio of company is
more than the ideal ratio. This depicts that company’s liquidity
position is sound. Its current assets are more than its current
liabilities.
2. QUICK RATIO
Quick ratio is a more rigorous test of liquidity than current ratio.
Quick ratio may be defined as the relationship between
quick/liquid assets and current or liquid liabilities. An asset is
said to be liquid if it can be converted into cash with a short
period without loss of value. It measures the firms’ capacity to
pay off current obligations immediately.
QUICK RATIO = QUICK ASSETS
CURRENT LIABILITES
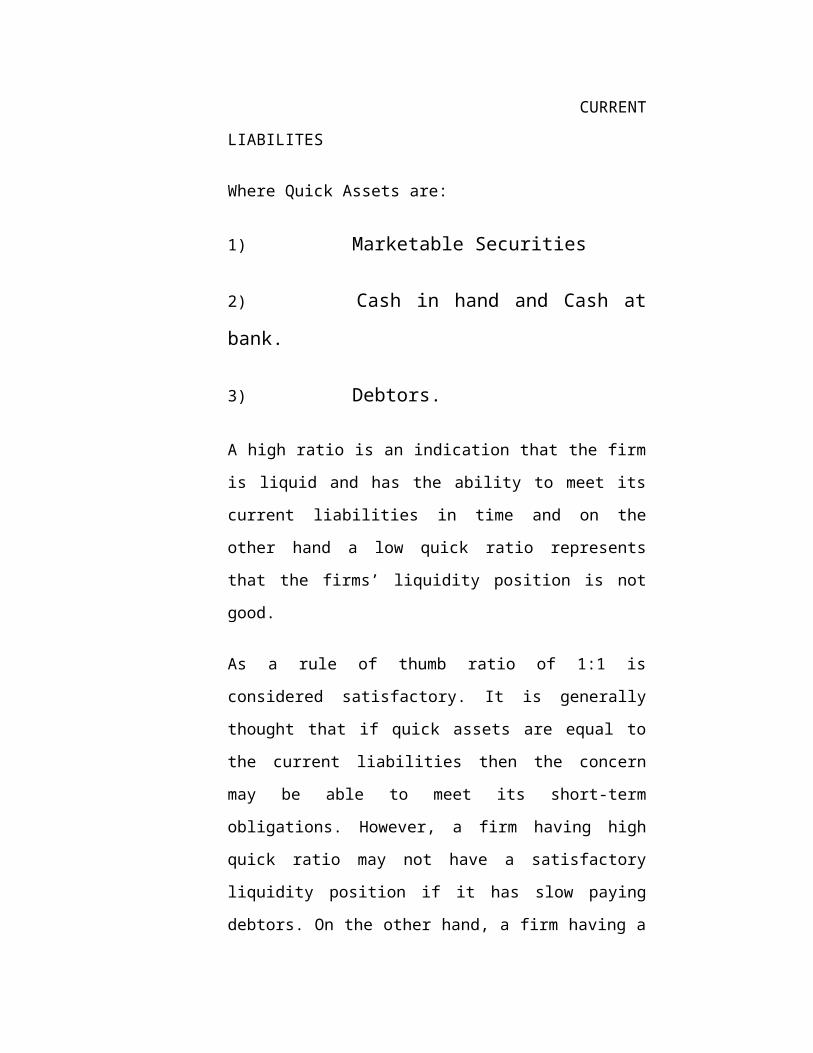
Where Quick Assets are:
1) Marketable Securities
2) Cash in hand and Cash at bank.
3) Debtors.
A high ratio is an indication that the firm is liquid and has the
ability to meet its current liabilities in time and on the other hand
a low quick ratio represents that the firms’ liquidity position is
not good.
As a rule of thumb ratio of 1:1 is considered satisfactory. It is
generally thought that if quick assets are equal to the current
liabilities then the concern may be able to meet its short-term
obligations. However, a firm having high quick ratio may not
have a satisfactory liquidity position if it has slow paying
debtors. On the other hand, a firm having a low liquidity position
if it has fast moving inventories.
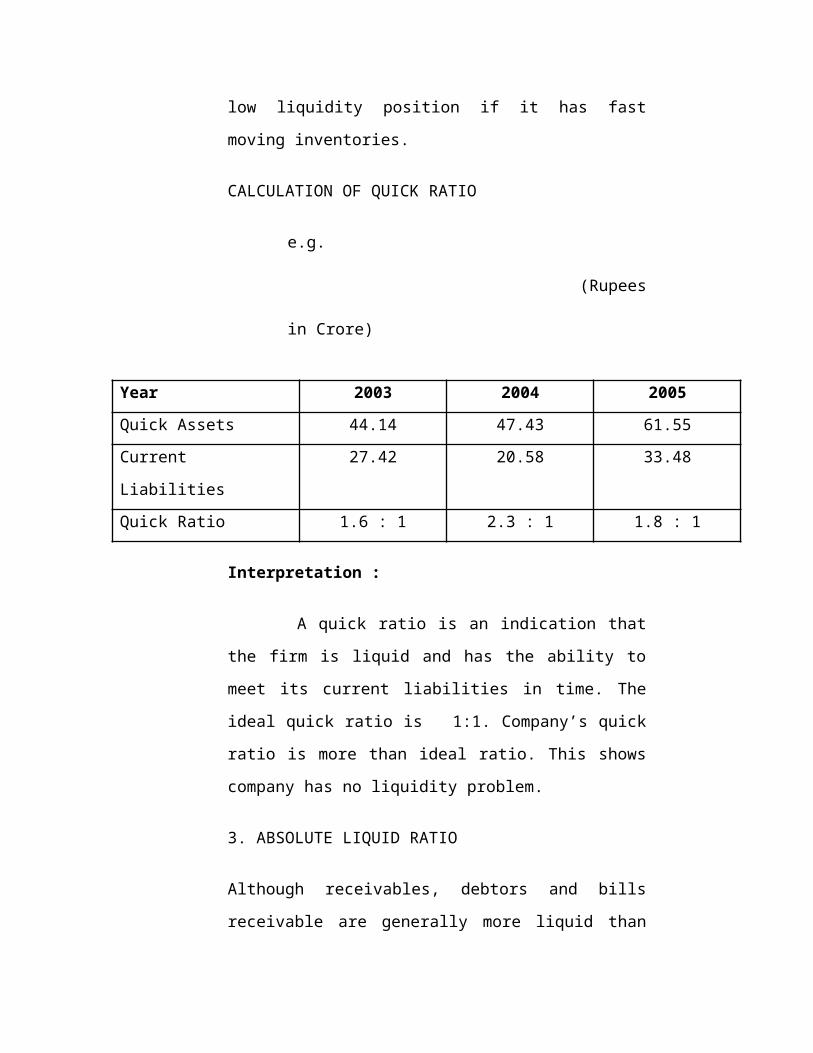
CALCULATION OF QUICK RATIO
e.g. (Rupees in
Crore)
Year 2003 2004 2005
Quick Assets 44.14 47.43 61.55
Current Liabilities 27.42 20.58 33.48
Quick Ratio 1.6 : 1 2.3 : 1 1.8 : 1
Interpretation :
A quick ratio is an indication that the firm is liquid and has
the ability to meet its current liabilities in time. The ideal quick
ratio is 1:1. Company’s quick ratio is more than ideal ratio. This
shows company has no liquidity problem.
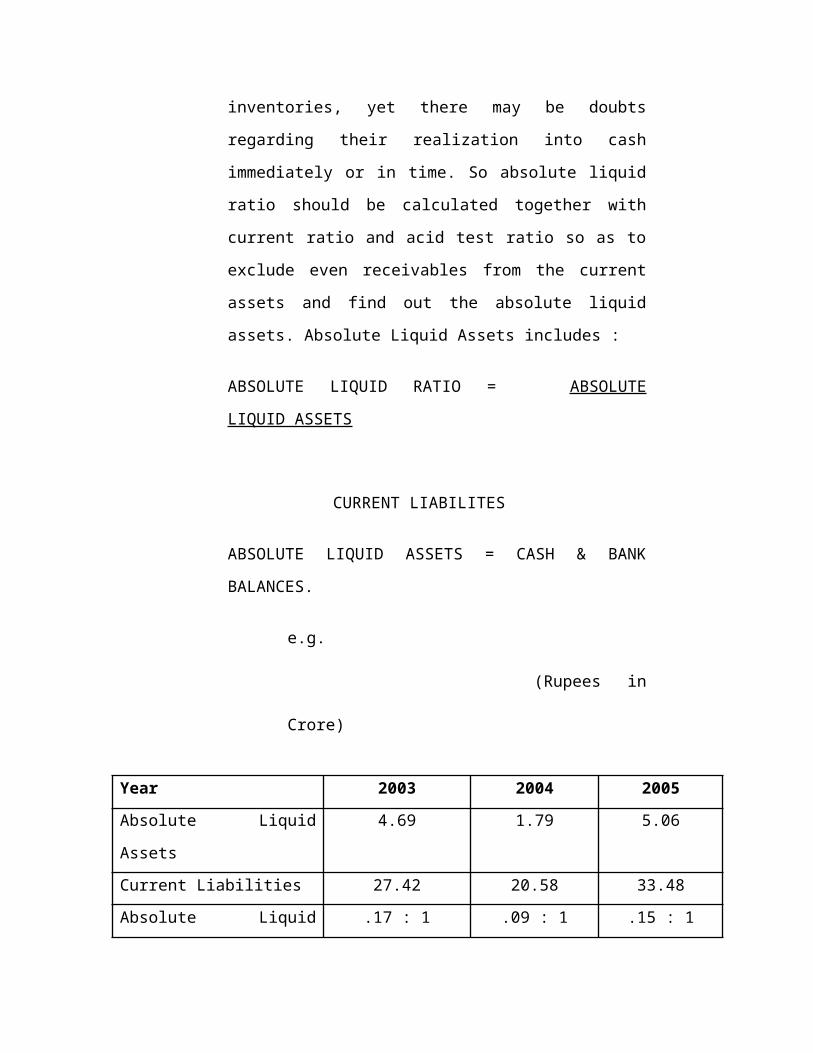
3. ABSOLUTE LIQUID RATIO
Although receivables, debtors and bills receivable are generally
more liquid than inventories, yet there may be doubts regarding
their realization into cash immediately or in time. So absolute
liquid ratio should be calculated together with current ratio and
acid test ratio so as to exclude even receivables from the current
assets and find out the absolute liquid assets. Absolute Liquid
Assets includes :
ABSOLUTE LIQUID RATIO = ABSOLUTE LIQUID
ASSETS
CURRENT LIABILITES
ABSOLUTE LIQUID ASSETS = CASH & BANK
BALANCES.
e.g. (Rupees in
Crore)
Year 2003 2004 2005
Absolute Liquid Assets 4.69 1.79 5.06
Current Liabilities 27.42 20.58 33.48
Absolute Liquid Ratio .17 : 1 .09 : 1 .15 : 1
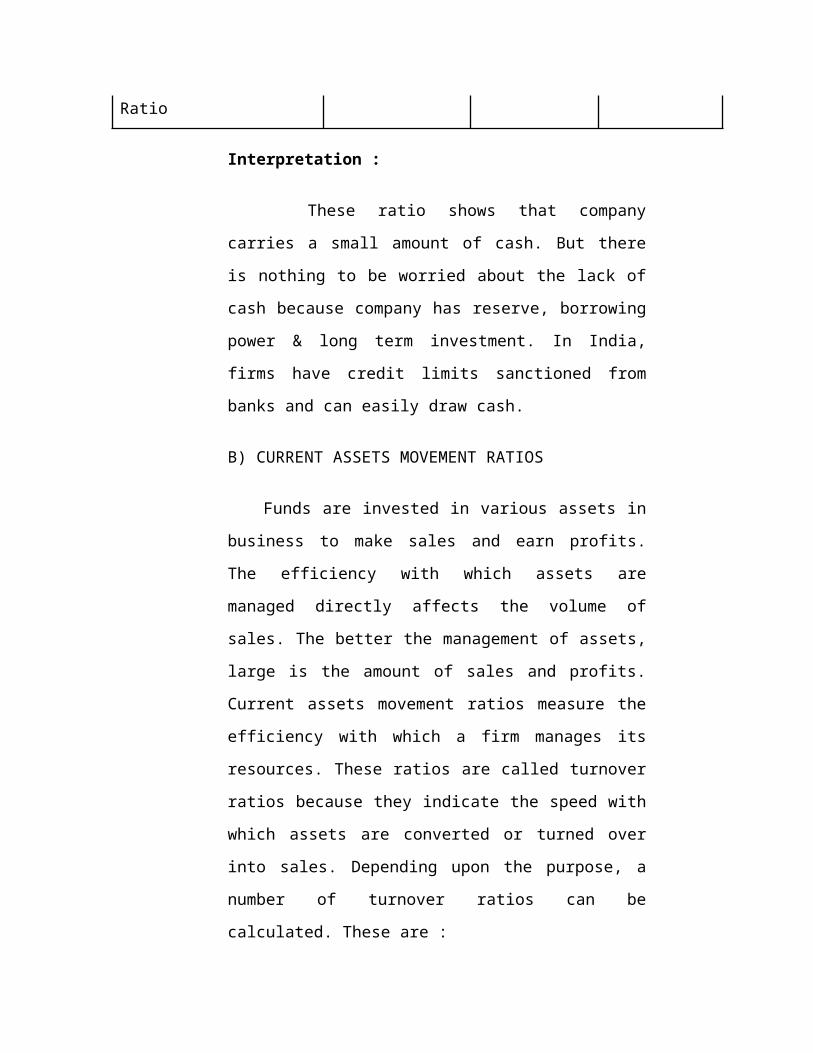
Interpretation :
These ratio shows that company carries a small amount of
cash. But there is nothing to be worried about the lack of cash
because company has reserve, borrowing power & long term
investment. In India, firms have credit limits sanctioned from
banks and can easily draw cash.
B) CURRENT ASSETS MOVEMENT RATIOS
Funds are invested in various assets in business to make
sales and earn profits. The efficiency with which assets are
managed directly affects the volume of sales. The better the
management of assets, large is the amount of sales and profits.
Current assets movement ratios measure the efficiency with
which a firm manages its resources. These ratios are called
turnover ratios because they indicate the speed with which assets
are converted or turned over into sales. Depending upon the
purpose, a number of turnover ratios can be calculated. These are
:
1. Inventory Turnover Ratio
2. Debtors Turnover Ratio
3. Creditors Turnover Ratio
4. Working Capital Turnover Ratio
The current ratio and quick ratio give misleading results if current
assets include high amount of debtors due to slow credit
collections and moreover if the assets include high amount of slow
moving inventories. As both the ratios ignore the movement of
current assets, it is important to calculate the turnover ratio.
1. INVENTORY TURNOVER OR STOCK
TURNOVER RATIO :
Every firm has to maintain a certain amount of inventory of
finished goods so as to meet the requirements of the
business. But the level of inventory should neither be too
high nor too low. Because it is harmful to hold more
inventory as some amount of capital is blocked in it and
some cost is involved in it. It will therefore be advisable to
dispose the inventory as soon as possible.
INVENTORY TURNOVER RATIO = COST OF GOOD
SOLD
AVERAGE INVENTORY
Inventory turnover ratio measures the speed with which the
stock is converted into sales. Usually a high inventory ratio
indicates an efficient management of inventory because
more frequently the stocks are sold ; the lesser amount of
money is required to finance the inventory. Where as low
inventory turnover ratio indicates the inefficient
management of inventory. A low inventory turnover
implies over investment in inventories, dull business, poor
quality of goods, stock accumulations and slow moving
goods and low profits as compared to total investment.
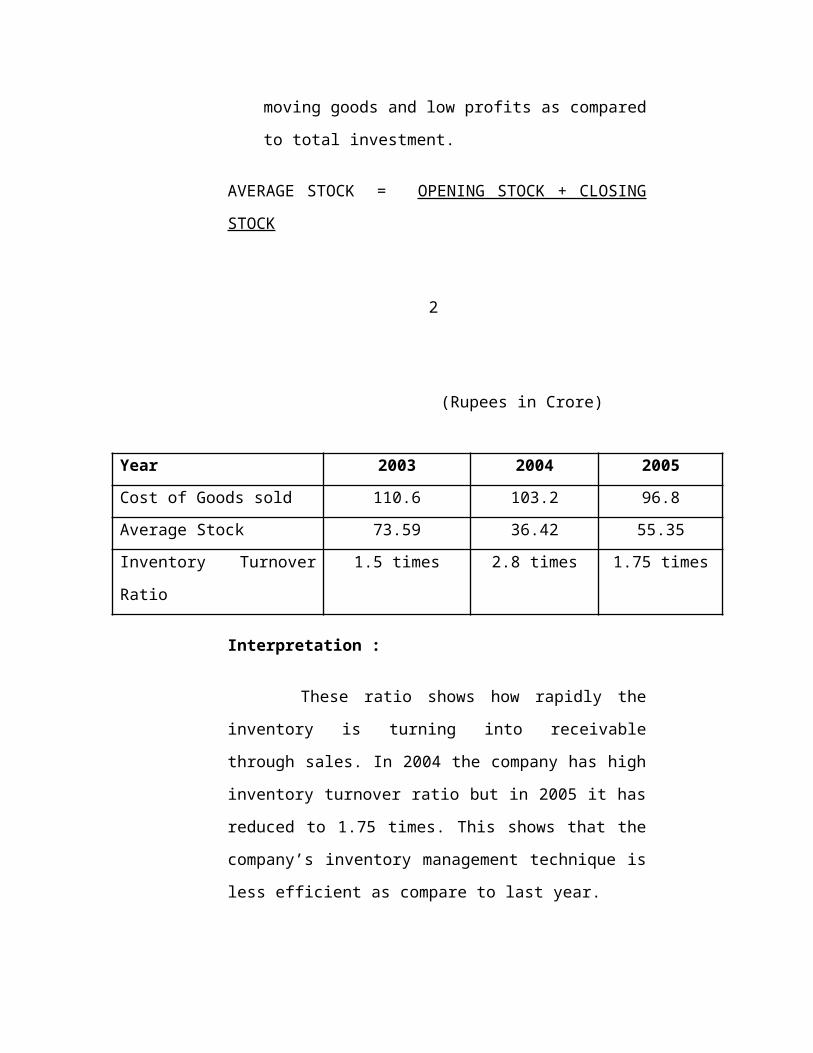
AVERAGE STOCK = OPENING STOCK + CLOSING
STOCK
2
(Rupees in Crore)
Year 2003 2004 2005
Cost of Goods sold 110.6 103.2 96.8
Average Stock 73.59 36.42 55.35
Inventory Turnover Ratio 1.5 times 2.8 times 1.75 times
Interpretation :
These ratio shows how rapidly the inventory is turning into
receivable through sales. In 2004 the company has high
inventory turnover ratio but in 2005 it has reduced to 1.75 times.
This shows that the company’s inventory management technique
is less efficient as compare to last year.
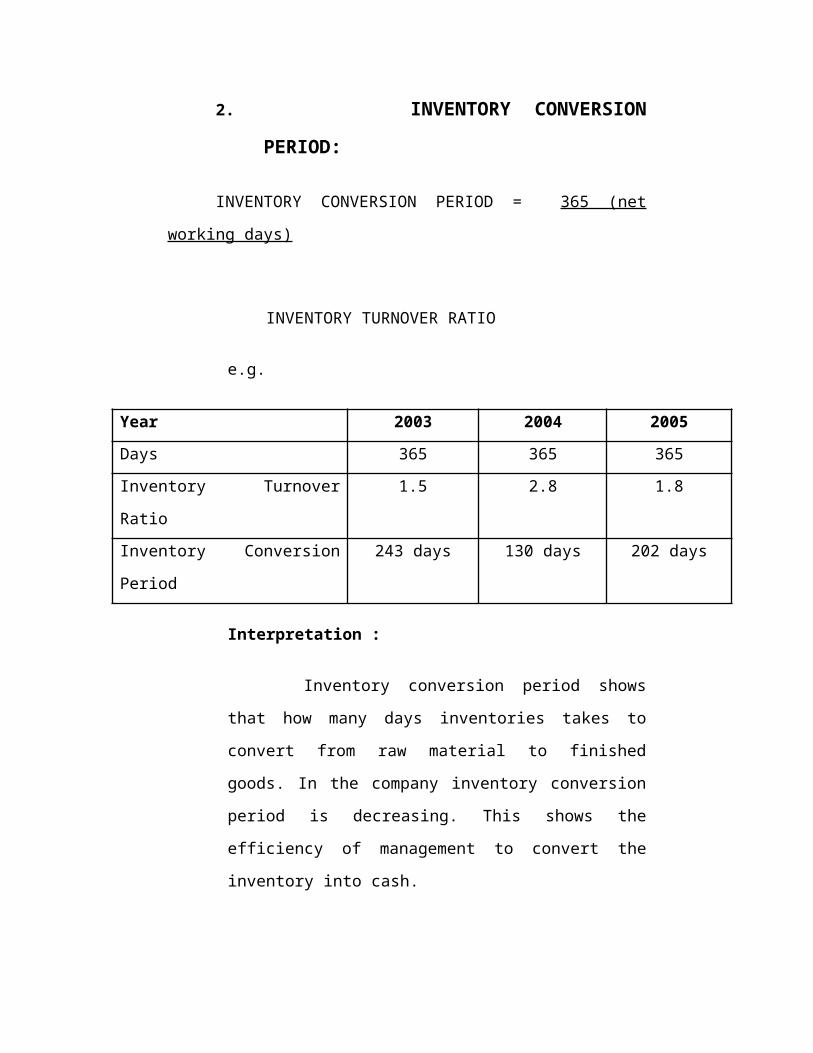
2. INVENTORY CONVERSION PERIOD:
INVENTORY CONVERSION PERIOD = 365 (net working
days)
INVENTORY TURNOVER
RATIO
e.g.
Year 2003 2004 2005
Days 365 365 365
Inventory Turnover Ratio 1.5 2.8 1.8
Inventory Conversion Period 243 days 130 days 202 days
Interpretation :
Inventory conversion period shows that how many days
inventories takes to convert from raw material to finished goods.
In the company inventory conversion period is decreasing. This
shows the efficiency of management to convert the inventory
into cash.
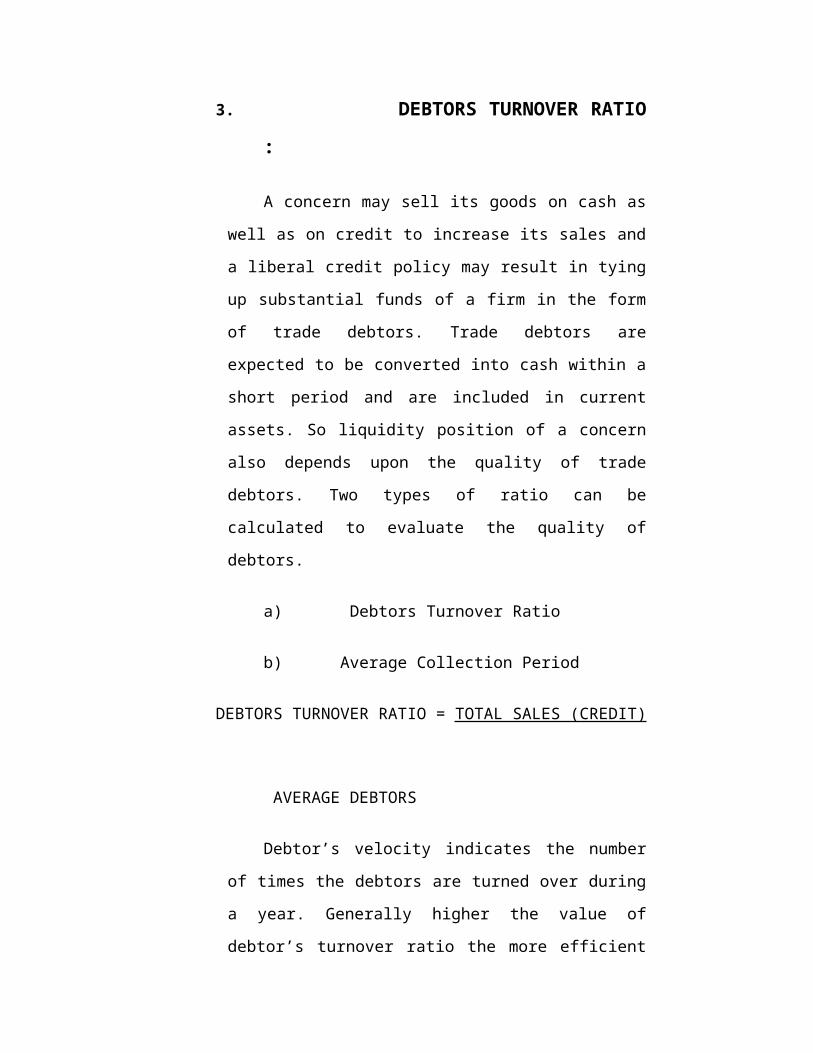
3. DEBTORS TURNOVER RATIO :
A concern may sell its goods on cash as well as on credit to
increase its sales and a liberal credit policy may result in tying up
substantial funds of a firm in the form of trade debtors. Trade
debtors are expected to be converted into cash within a short
period and are included in current assets. So liquidity position of
a concern also depends upon the quality of trade debtors. Two
types of ratio can be calculated to evaluate the quality of debtors.
a) Debtors Turnover Ratio
b) Average Collection Period
DEBTORS TURNOVER RATIO = TOTAL SALES (CREDIT)
AVERAGE DEBTORS
Debtor’s velocity indicates the number of times the debtors
are turned over during a year. Generally higher the value of
debtor’s turnover ratio the more efficient is the management of
debtors/sales or more liquid are the debtors. Whereas a low
debtors turnover ratio indicates poor management of
debtors/sales and less liquid debtors. This ratio should be
compared with ratios of other firms doing the same business and
a trend may be found to make a better interpretation of the ratio.
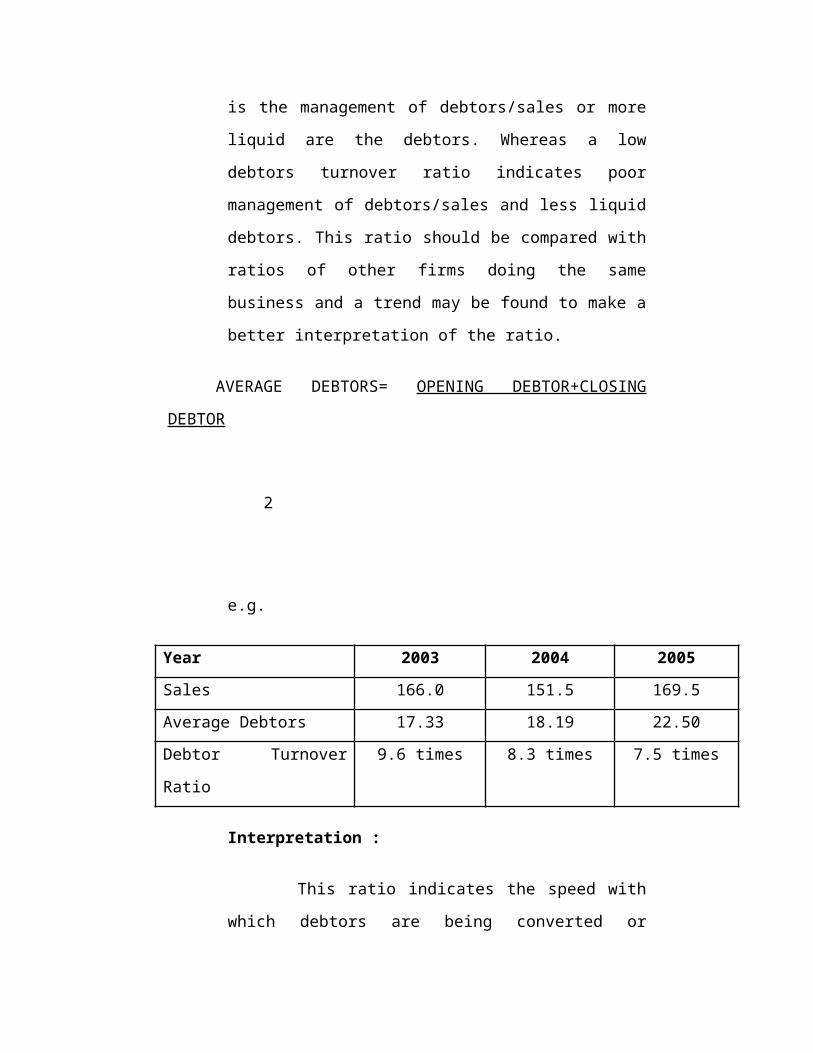
AVERAGE DEBTORS= OPENING DEBTOR+CLOSING
DEBTOR
2
e.g.
Year 2003 2004 2005
Sales 166.0 151.5 169.5
Average Debtors 17.33 18.19 22.50
Debtor Turnover Ratio 9.6 times 8.3 times 7.5 times
Interpretation :
This ratio indicates the speed with which debtors are being
converted or turnover into sales. The higher the values or
turnover into sales. The higher the values of debtors turnover, the
more efficient is the management of credit. But in the company
the debtor turnover ratio is decreasing year to year. This shows
that company is not utilizing its debtors efficiency. Now their
credit policy become liberal as compare to previous year.
4. AVERAGE COLLECTION PERIOD :
Average Collection Period = No. of Working Days
Debtors Turnover Ratio
The average collection period ratio represents the average
number of days for which a firm has to wait before its
receivables are converted into cash. It measures the quality of
debtors. Generally, shorter the average collection period the
better is the quality of debtors as a short collection period implies
quick payment by debtors and vice-versa.
Average Collection Period = 365 (Net Working Days)
Debtors Turnover Ratio
Year 2003 2004 2005
Days 365 365 365
Debtor Turnover Ratio 9.6 8.3 7.5
Average Collection Period 38 days 44 days 49 days
Interpretation :
The average collection period measures the quality of
debtors and it helps in analyzing the efficiency of collection
efforts. It also helps to analysis the credit policy adopted by
company. In the firm average collection period increasing year to
year. It shows that the firm has Liberal Credit policy. These
changes in policy are due to competitor’s credit policy.
5. WORKING CAPITAL TURNOVER RATIO :
Working capital turnover ratio indicates the velocity of
utilization of net working capital. This ratio indicates the
number of times the working capital is turned over in the
course of the year. This ratio measures the efficiency with
which the working capital is used by the firm. A higher
ratio indicates efficient utilization of working capital and
a low ratio indicates otherwise. But a very high working
capital turnover is not a good situation for any firm.
Working Capital Turnover Ratio = Cost of Sales
Net Working Capital
Working Capital Turnover = Sales
Networking Capital
e.g.
Year 2003 2004 2005
Sales 166.0 151.5 169.5
Networking Capital 53.87 62.52 103.09
Working Capital Turnover 3.08 2.4 1.64
Interpretation :
This ratio indicates low much net working capital
requires for sales. In 2005, the reciprocal of this ratio (1/1.64
= .609) shows that for sales of Rs. 1 the company requires 60
paisa as working capital. Thus this ratio is helpful to forecast the
working capital requirement on the basis of sale.
INVENTORIES
(Rs. in Crores)
Year 2002-2003 2003-2004 2004-2005
Inventories 37.15 35.69 75.01
Interpretation :
Inventories is a major part of current assets. If any company
wants to manage its working capital efficiency, it has to manage
its inventories efficiently. The graph shows that inventory in
2002-2003 is 45%, in 2003-2004 is 43% and in 2004-2005 is
54% of their current assets. The company should try to reduce
the inventory upto 10% or 20% of current assets.
CASH BNAK BALANCE :
(Rs. in Crores)
Year 2002-2003 2003-2004 2004-2005
Cash Bank Balance 4.69 1.79 5.05
Interpretation :
Cash is basic input or component of working capital. Cash is
needed to keep the business running on a continuous basis. So
the organization should have sufficient cash to meet various
requirements. The above graph is indicate that in 2003 the cash is
4.69 crores but in 2004 it has decrease to 1.79. The result of that
it disturb the firms manufacturing operations. In 2005, it is
increased upto approx. 5.1% cash balance. So in 2005, the
company has no problem for meeting its requirement as compare
to 2004.
DEBTORS :
(Rs. in Crores)
Year 2002-2003 2003-2004 2004-2005
Debtors 17.33 19.05 25.94
Interpretation :
Debtors constitute a substantial portion of total current
assets. In India it constitute one third of current assets. The above
graph is depict that there is increase in debtors. It represents an
extension of credit to customers. The reason for increasing credit
is competition and company liberal credit policy.
CURRENT ASSETS :
(Rs. in Crores)
Year 2002-2003 2003-2004 2004-2005
Current Assets 81.29 83.15 136.57
Interpretation :
This graph shows that there is 64% increase in current assets
in 2005. This increase is arise because there is approx. 50%
increase in inventories. Increase in current assets shows the
liquidity soundness of company.
CURRENT LIABILITY :
(Rs. in Crores)
Year 2002-2003 2003-2004 2004-2005
Current Liability 27.42 20.58 33.48
Interpretation :
Current liabilities shows company short term debts pay to
outsiders. In 2005 the current liabilities of the company
increased. But still increase in current assets are more than its
current liabilities.
NET WOKRING CAPITAL :
(Rs. in Crores)
Year 2002-2003 2003-2004 2004-2005
Net Working Capital 53.87 62.53 103.09
Interpretation :
Working capital is required to finance day to day operations
of a firm. There should be an optimum level of working capital.
It should not be too less or not too excess. In the company there
is increase in working capital. The increase in working capital
arises because the company has expanded its business.
RESEARCH METHODOLOGY
The methodology, I have adopted for my study is the various tools, which
basically analyze critically financial position of to the organization:
I. COMMON-SIZE P/L A/C II. COMMON-SIZE BALANCE SHEET
III. COMPARTIVE P/L A/C
IV. COMPARTIVE BALANCE SHEET
V. TREND ANALYSIS
VI. RATIO ANALYSIS
The above parameters are used for critical analysis of financial position. With the evaluation of each component, the financial position from different angles is tried to be presented in well and systematic manner. By critical analysis with the help of different tools, it becomes clear how the financial manager handles the finance matters in profitable manner in the critical challenging atmosphere, the recommendation are made which would suggest the organization in formulation of a healthy and strong position financially with proper management system.
I sincerely hope, through the evaluation of various percentage, ratios and comparative analysis, the organization would be able to conquer its in efficiencies and makes the desired changes.
ANALYSIS OF FINANCIAL STATEMENTS
FINANCIAL STATEMENTS:
Financial statement is a collection of data organized according to logical and consistent accounting procedure to convey an under-standing of some financial aspects of a business firm. It may show position at a moment in time, as in the case of balance sheet or may reveal a series of activities over a given period of time, as in the case of an income statement. Thus, the term ‘financial statements’ generally refers to the two statements
(1) The position statement or Balance sheet.
(2) The income statement or the profit and loss Account.
OBJECTIVES OF FINANCIAL STATEMENTS:
According to accounting Principal Board of America (APB) states
The following objectives of financial statements: -
1. To provide reliable financial information about economic resources and obligation of a business firm.
2. To provide other needed information about charges in such economic resources and obligation.
3. To provide reliable information about change in net resources (recourses less obligations) missing out of business activities.
4. To provide financial information that assets in estimating the learning potential of the business.
LIMITATIONS OF FINANCIAL STATEMENTS:
Though financial statements are relevant and useful for a concern, still they do not present a final picture a final picture of a concern. The utility of these statements is dependent upon a number of factors. The analysis and interpretation of these statements must be done carefully otherwise misleading conclusion may be drawn.
Financial statements suffer from the following limitations: -
1. Financial statements do not given a final picture of the concern. The data given in these statements is only approximate. The actual value can only be determined when the business is sold or liquidated.
2. Financial statements have been prepared for different accounting periods, generally one year, during the life of a concern. The costs and incomes are apportioned to different periods with a view to determine profits etc. The allocation of expenses and income depends upon the personal judgment of the accountant. The existence of contingent assets and liabilities also make the statements imprecise. So financial statement are at the most interim reports rather than the final picture of the firm.
3. The financial statements are expressed in monetary value, so they appear to give final and accurate position. The value of fixed assets in the balance sheet neither represent the value for which fixed assets can be sold nor the amount which will be required to replace these assets. The balance sheet is prepared on the presumption of a going concern. The concern is expected to continue in future. So fixed assets are shown at cost less accumulated deprecation. Moreover, there are certain assets in the balance sheet which will realize nothing at the time of liquidation but they are shown in the balance sheets.
4. The financial statements are prepared on the basis of historical costs Or original costs. The value of assets decreases with the passage of time current price changes are not taken into account. The statement are not prepared with the keeping in view the economic conditions. the balance sheet loses the significance of being an index of current economics realities. Similarly, the profitability shown by the income statements may be represent the earning capacity of the concern.
5. There are certain factors which have a bearing on the financial position and operating result of the business but they do not become a part of these statements because they cannot be measured in monetary terms. The basic limitation of the traditional financial statements comprising the balance sheet, profit & loss A/c is that they do not give all the information regarding the financial operation of the firm. Nevertheless, they provide some extremely useful information to the extent the balance sheet mirrors the financial position on a particular data in lines of the structure of assets, liabilities etc. and the profit & loss A/c shows the result of operation during a certain period in terms revenue obtained and cost incurred during the year. Thus, the financial position and operation of the firm.
FINANCIAL STATEMENT ANALYSIS
It is the process of identifying the financial strength and weakness of a firm from the available accounting data and financial statements. The analysis is done
CALCULATIONS OF RATIOS
Ratios are relationship expressed in mathematical terms between figures,
which are connected with each other in some manner.
CLASSIFICATION OF RATIOS
Ratios can be classified in to different categories depending upon the basis
of classification
The traditional classification has been on the basis of the financial
statement to which the determination of ratios belongs.