37
Working Group for the Fiscal and Economic Recovery of Puerto Rico Puerto Rico Fiscal and Economic Growth Plan Update Presentation January 18, 2016
| Date post: | 29-May-2018 |
| Category: |
Documents |
| Upload: | duongtuong |
| View: | 214 times |
| Download: | 0 times |

Working Group for
the Fiscal and
Economic
Recovery
of Puerto Rico
Puerto Rico Fiscal and Economic Growth Plan Update Presentation
January 18, 2016

Working Group for
the Fiscal and
Economic
Recovery
of Puerto Rico
Disclaimer The Working Group for the Fiscal and Economic Recovery of Puerto Rico (the “Working Group”), the Commonwealth of Puerto Rico (the
“Commonwealth”), the Government Development Bank for Puerto Rico (the “GDB”), and each of their respective officers, directors, employees,
agents, attorneys, advisors, members, partners or affiliates (collectively, with the Commonwealth and the GDB, the “Parties”) make no
representation or warranty, express or implied, to any third party with respect to the information contained herein and all Parties expressly
disclaim any such representations or warranties.
The Parties do not owe or accept any duty or responsibility to any reader or recipient of this presentation, whether in contract or tort, and shall
not be liable for or in respect of any loss, damage (including without limitation consequential damages or lost profits) or expense of whatsoever
nature of such third party that may be caused by, or alleged to be caused by, the use of this presentation or that is otherwise consequent upon
the gaining of access to this document by such third party.
This document does not constitute an audit conducted in accordance with generally accepted auditing standards, an examination of internal
controls or other attestation or review services in accordance with standards established by the American Institute of Certified Public
Accountants or any other organization. Accordingly, the Parties do not express an opinion or any other form of assurance on the financial
statements or any financial or other information or the internal controls of the Commonwealth and the information contained herein.
Any statements and assumptions contained in this document, whether forward-looking or historical, are not guarantees of future performance
and involve certain risks, uncertainties, estimates and other assumptions made in this document. The economic and financial condition of the
Commonwealth and its instrumentalities is affected by various financial, social, economic, environmental and political factors. These factors can
be very complex, may vary from one fiscal year to the next and are frequently the result of actions taken or not taken, not only by the
Commonwealth and its agencies and instrumentalities, but also by entities such as the government of the United States. Because of the
uncertainty and unpredictability of these factors, their impact cannot be included in the assumptions contained in this document. Future events
and actual results may differ materially from any estimates, projections, or statements contained herein. Nothing in this document should be
considered as an express or implied commitment to do or take, or to refrain from taking, any action by the Commonwealth, the GDB, or any
government instrumentality in the Commonwealth or an admission of any fact or future event. Nothing in this document shall be considered a
solicitation, recommendation or advice to any person to participate, pursue or support a particular course of action or transaction, to purchase
or sell any security, or to make any investment decision.
By accepting this document, the recipient shall be deemed to have acknowledged and agreed to the terms of these limitations.
This document may contain capitalized terms that are not defined herein, or may contain terms that are discussed in other documents or that
are commonly understood. You should make no assumptions about the meaning of capitalized terms that are not defined, and you should
consult with advisors of the Working Group should clarification be required.
1

Working Group for
the Fiscal and
Economic
Recovery
of Puerto Rico
Table of Contents
I. Executive Summary
II. Appendix
i. Updates to Original FEGP (FY 2016 – FY 2020)
ii. FEGP Model Extension (FY 2021 – FY 2025)
iii. Illustrative Surplus/(Gap) Before Debt Service
iv. Additional Projection Details
v. Debt Service Detail by Issuer
2

Working Group for
the Fiscal and
Economic
Recovery
of Puerto Rico
Executive Summary

Working Group for
the Fiscal and
Economic
Recovery
of Puerto Rico
Summary of Updated FEGP The fiscal and humanitarian crisis facing Puerto Rico has been further exacerbated since the original Fiscal and Economic Growth Plan (“FEGP”) was published on September 9, 2015, which is reflected in the larger estimated financing gaps in the updated FEGP projections summarized in this presentation
4
The update to the original FEGP involves two primary components:
1. Updating the projections from fiscal year (“FY”) 2016 to FY 2020 to account for year-to-date (“YTD”) actual results; and
2. At the request of creditors, extending the updated FEGP projections by another five years to FY 2025
The projected deficit over the first five years, inclusive of the estimated benefits of growth and implementation of the measures outlined in the original FEGP, has grown by approximately $2.1 billion since the release of the original FEGP
• Puerto Rico’s Treasury announced on December 14, 2015 that, based on revenues collected fiscal YTD, they were revising their full-year General Fund revenue projections significantly downward(1)
• Consequently, the General Fund revenues included in the FEGP have decreased from a previous estimate of $9.46 billion for FY 2016 to $9.21 billion;(2) this decrease in projected revenues is the largest single driver of the increase in the projected deficit from the original FEGP
In order to confront this decrease in expected revenues, the Commonwealth has been forced to continue certain extraordinary liquidity measures in order to continue to provide essential services to the people of Puerto Rico and to comply with its constitutional obligations for the payment of its public debt
FEGP Financing Gap(3)(4) – Original vs. Updated ($ millions)
(1) See the press release from the Office of the Secretary of the Treasury of the Commonwealth of Puerto Rico dated December 14, 2015. (2) Numbers are reported inclusive of the 4.5% increase in the Sales and Use Tax (“SUT”) and the estimated benefit of the planned transition to a Value Added Tax (“VAT”). (3) For illustrative and comparative purposes only, the updated financing gaps shown on this slide (and only on this slide) use the same deposit replenishment assumption as those in the original FEGP, reflecting a build to $1.5 billion by FY
2017. The updated FEGP assumes deposit replenishments begin in FY 2017 and build to $1.5 billion evenly through FY 2020. This updated assumption is driven by the fact that the Commonwealth is unlikely, given its updated revenue projections and the time that will be required before a voluntary debt exchange can be executed, to be able to begin rebuilding its deposits in the Treasury Single Account until a later date than originally anticipated.
(4) For illustrative and comparative purposes only, the updated financing gaps shown on this slide (and only on this slide) use the same paydown of overdue accounts payable schedule as in the original FEGP. However, in the updated FEGP, paydown of overdue accounts payable is assumed on a more accelerated schedule compared to the original FEGP, to reduce pressure on local business activity, mitigate supply and service stoppages with respect to essential goods and services and avoid demands for COD. This acceleration of paydown is necessary to facilitate growth and private business activity.
Original FEGP 5-year Cumulative Financing Gap (FY ’16 – FY ’20): $14.0 billion | $15.9 billion ex. growth
Updated FEGP 5-year Cumulative Financing Gap (FY ’16 – FY ’20): $16.1 billion | $17.0 billion ex. growth
Updated FEGP 10-year Cumulative Financing Gap (FY ’16 – FY ‘25): $23.9 billion | $34.0 billion ex. growth
($3,205)($3,002)
($1 ,909)
($3,425)
($2,465)
($3,1 1 7 )
($2,231 )
($4,01 0)
($3,37 2)
($3,566)($3,381 )
($2,235)
($3,882)
($2,996)
($2,265)
($1 ,7 67 )($1 ,428)
($1 ,591 )
($7 60)
($2,324)
($4,1 85)
($3,568)($3,1 91 ) ($3,1 22)
($3,236)
($3,87 7 )($3,553)
FY 2016 FY 2017 FY 2018 FY 2019 FY 2020 FY 2021 FY 2022 FY 2023 FY 2024 FY 2025
($5,000)
($4,000)
($3,000)
($2,000)
($1,000)
$0
Original FEGP Financing Gap Original FEGP Financing Gap w/o Growth Updated FEGP Financing Gap Updated FEGP Financing Gap w/o Growth

Working Group for
the Fiscal and
Economic
Recovery
of Puerto Rico
Bridge to Updated FEGP
5
A summary of the key variances from the original FEGP to the updated FEGP projections over the first five years is provided below (additional detail is provided in the Appendix), which include:
A reduction in revenue estimates based on YTD results; all future year projections beyond FY 2016 are grown from the FY2016 base, so lower FY 2016 revenues impact not only FY 2016, but all subsequent years as well (assuming similar growth rates)
A delay in the assumed start of economic growth by one year as compared to the original FEGP, as the timing of any voluntary debt exchange and the implementation of the structural reforms required to promote growth are likely to take longer than originally anticipated by the team that developed the Krueger Report(1)
A reduction in assumed loan disbursements by the Government Development Bank for Puerto Rico (“GDB”) to entities not included in the FEGP
The addition of assumed contributions from the State Insurance Fund (“SIF”) beyond FY 2016 using historical averages(2)
Bridge to Updated FEGP Cumulative 5-year Financing Gap ($ millions)
(1) The “Krueger Report” refers to the report titled “Puerto Rico - A Way Forward“ (as updated July 13, 2015), which was developed by a team of former International Monetary Fund (“IMF”) economists. (2) Represents historical average from FY 2010 to FY 2014, using the Commonwealth’s unaudited and preliminary 2014 Comprehensive Annual Financial Report (“CAFR”) and the published CAFR for 2010 to 2013. Transfers in FY 2016 are still assumed
to be $105 million, as they were in the original FEGP.
($1 6,060)
($1 4,007)
($1 ,733)
($964)
$368
$262 $1 3
($17,000)
($16,500)
($16,000)
($15,500)
($15,000)
($14,500)
($14,000)
($13,500)
($13,000)
Original FEGPFinancing Gap
Reduction in GeneralFund Revenue
Estimates(including SUT/VAT)
Estimated Benefit ofEconomic Growth
Decrease in AssumedGDB Loan
Disbursements toEntities not included in
the FEGP
Addition of SIFContributions
Other Updated FEGPFinancing Gap

Working Group for
the Fiscal and
Economic
Recovery
of Puerto Rico
Summary of Extended FEGP Projections
6
The updated FEGP projections beyond FY 2020 show that, even with economic growth and all of the measures outlined in the FEGP, the cumulative deficit, assuming current contractual debt service is paid, will continue to grow to approximately $23.9 billion over the ten-year projection period
Projected FEGP Financing Gap over the 10-year Projection Period (FY 2016 – FY 2025) ($ millions)
Key assumptions used in the extended FEGP, in addition to the measures outlined in the original FEGP, are:
• By FY 2022 the Commonwealth economy reaches the long-term growth rate of the United States, as estimated by the Krueger Team(1)
This projection, while possible, is optimistic given the Commonwealth’s real GNP growth has been below that of the United States since 2001(2)
• The measures outlined in the original FEGP are assumed to continue, and the Act 66 expense freeze is assumed to end in FY 2020, after which point expenses are generally assumed to grow in line with inflation
Note that the updated FEGP assumes the deposit replenishment schedule begins in FY 2017 (as opposed to FY 2016 in the original FEGP) and builds to $1.5 billion evenly by FY 2020, lowering the financing gap in FY 2016
Furthermore, the updated FEGP assumes paydown of overdue accounts payable on a more accelerated schedule compared to the original FEGP, to reduce pressure on local business activity, mitigate supply and service stoppages with respect to essential goods and services, and avoid demands for COD. This acceleration of paydown is necessary to facilitate growth and private business activity
See the Appendix for additional details on the assumptions supporting the extended FEGP projections
Total
2016P 2017P 2018P 2019P 2020P 2021P 2022P 2023P 2024P 2025P 5 Yr 10 Yr
Total Rev enues $1 7 ,389 $1 7 ,358 $1 7 ,560 $1 7 ,7 1 0 $1 7 ,841 $1 7 ,954 $1 8,080 $1 8,21 9 $1 8,368 $1 8,51 7 $87 ,858 $1 7 8,995
Total Non-interest Expenditure (1 7 ,091 ) (1 7 ,1 1 3) (1 7 ,331 ) (1 8,031 ) (1 8,21 4) (1 8,495) (1 8,7 41 ) (1 9,000) (1 9,331 ) (1 9,606) (87 ,7 80) (1 82,955)
Total Additional Expenses (Current Policies) – – (1 ,082) (2,680) (2,81 2) (2,896) (2,958) (3,028) (3,089) (3,1 57 ) (6,57 4) (21 ,7 02)
Total Debt Serv ice (4,1 21 ) (3 ,396) (3,27 2) (3,861 ) (3 ,463) (3,41 2) (3,1 7 3) (3,1 09) (3,522) (3,021 ) (1 8,1 1 3) (34,350)
Identified Financing Sources / (Uses) 448 (1 ,1 88) (1 ,1 27 ) (87 6) (626) – – – – – (3 ,369) (3 ,369)
Total Est. Financing Gap before Measures ($3,376) ($4,339) ($5,252) ($7,738) ($7,274) ($6,850) ($6,793) ($6,918) ($7,574) ($7,268) ($27,979) ($63,381)
Rev enue Measures $1 ,006 $1 ,202 $1 ,7 68 $2,329 $2,346 $2,359 $2,37 3 $2,386 $2,399 $2,41 3 $8,652 $20,582
Expense Measures 51 443 1 ,1 04 1 ,468 1 ,7 7 8 1 ,7 7 9 1 ,7 81 1 ,7 82 1 ,7 87 1 ,7 95 4,844 1 3 ,7 68
Incremental Cost of Measures (262) (549) (57 0) (61 9) (543) (481 ) (482) (486) (489) (493) (2,542) (4,97 3)
Incremental Rev enues from Economic Growth – – 89 303 57 3 927 1 ,355 1 ,808 2,286 2,7 93 965 1 0,1 33
Total Est. Financing Gap after Measures ($2,580) ($3,243) ($2,860) ($4,257) ($3,120) ($2,265) ($1,767) ($1,428) ($1,591) ($760) ($16,060) ($23,871)
Memo: Debt Service as a % of:
Adjusted Revenues(3)
(Excluding Growth) 36% 29% 28% 32% 29% 28% 26% 25% 29% 24% 31% 29%
Adjusted Revenues(3)
(Including Growth) 36% 29% 27% 32% 27% 26% 23% 22% 24% 20% 30% 26%
(1) See the report “Puerto Rico – A Way Forward,” updated as of July 13, 2015. (2) Source: St. Louis Federal Reserve Database (FRED) for the Untied States historical GNP growth rates, and the Government Development Bank for Puerto Rico (“GDB”) for Puerto Rico’s GNP growth rates. (3) Adjusted revenues shown represent revenues as shown in the FEGP, excluding Federal Transfers and GDB net loan inflows, plus revenue measures (and in the case of “Including Growth,” the projected benefits of growth).
Working Group for
the Fiscal and
Economic
Recovery
of Puerto Rico
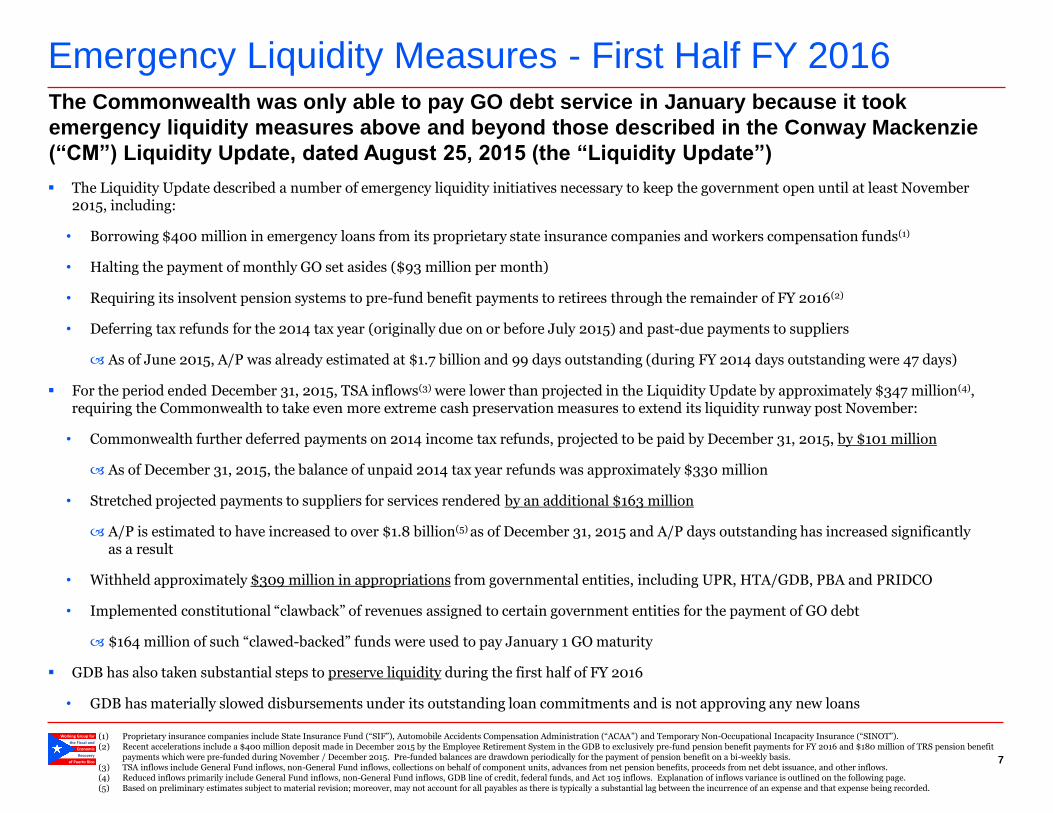
Emergency Liquidity Measures - First Half FY 2016
The Liquidity Update described a number of emergency liquidity initiatives necessary to keep the government open until at least November 2015, including:
• Borrowing $400 million in emergency loans from its proprietary state insurance companies and workers compensation funds(1)
• Halting the payment of monthly GO set asides ($93 million per month)
• Requiring its insolvent pension systems to pre-fund benefit payments to retirees through the remainder of FY 2016(2)
• Deferring tax refunds for the 2014 tax year (originally due on or before July 2015) and past-due payments to suppliers
As of June 2015, A/P was already estimated at $1.7 billion and 99 days outstanding (during FY 2014 days outstanding were 47 days)
For the period ended December 31, 2015, TSA inflows(3) were lower than projected in the Liquidity Update by approximately $347 million(4), requiring the Commonwealth to take even more extreme cash preservation measures to extend its liquidity runway post November:
• Commonwealth further deferred payments on 2014 income tax refunds, projected to be paid by December 31, 2015, by $101 million
As of December 31, 2015, the balance of unpaid 2014 tax year refunds was approximately $330 million
• Stretched projected payments to suppliers for services rendered by an additional $163 million
A/P is estimated to have increased to over $1.8 billion(5) as of December 31, 2015 and A/P days outstanding has increased significantly as a result
• Withheld approximately $309 million in appropriations from governmental entities, including UPR, HTA/GDB, PBA and PRIDCO
• Implemented constitutional “clawback” of revenues assigned to certain government entities for the payment of GO debt
$164 million of such “clawed-backed” funds were used to pay January 1 GO maturity
GDB has also taken substantial steps to preserve liquidity during the first half of FY 2016
• GDB has materially slowed disbursements under its outstanding loan commitments and is not approving any new loans
The Commonwealth was only able to pay GO debt service in January because it took
emergency liquidity measures above and beyond those described in the Conway Mackenzie
(“CM”) Liquidity Update, dated August 25, 2015 (the “Liquidity Update”)
7
(1) Proprietary insurance companies include State Insurance Fund (“SIF”), Automobile Accidents Compensation Administration (“ACAA”) and Temporary Non-Occupational Incapacity Insurance (“SINOT”). (2) Recent accelerations include a $400 million deposit made in December 2015 by the Employee Retirement System in the GDB to exclusively pre-fund pension benefit payments for FY 2016 and $180 million of TRS pension benefit
payments which were pre-funded during November / December 2015. Pre-funded balances are drawdown periodically for the payment of pension benefit on a bi-weekly basis. (3) TSA inflows include General Fund inflows, non-General Fund inflows, collections on behalf of component units, advances from net pension benefits, proceeds from net debt issuance, and other inflows. (4) Reduced inflows primarily include General Fund inflows, non-General Fund inflows, GDB line of credit, federal funds, and Act 105 inflows. Explanation of inflows variance is outlined on the following page. (5) Based on preliminary estimates subject to material revision; moreover, may not account for all payables as there is typically a substantial lag between the incurrence of an expense and that expense being recorded.

Working Group for
the Fiscal and
Economic
Recovery
of Puerto Rico
($345)
$66
($400)
($300)
($200)
($100)
$0
$100
$200
$300
$400
$500
Prior TSAEnd. Balance
Post-GODec. 31st
Deferralsto
Gov't Entities
Deferral ofSupplier &Third PartyPayments
Deferralof
Tax Refunds
Clawbacks FavorablePayroll &Pension
Variances
Lower thanExpected
GF and Non-GFInflows
(Jul. - Dec.)
Other NetWorking Capital
Variances
TSA EndingBalancePost-GODec. 31st
$309
$163
$101
$164
$21
($177)
($263)
($170)
Bridge to December 31, 2015 TSA Cash Balance
8
A bridge from the TSA balance as of December 31, 2015 projected in the Liquidity Update, to the actual TSA balance on such date, is provided below:
Bridge to December 31, 2015 Bank Cash Balance ($ millions) – Post January Debt Service Payments
(1) Represents projected ending cash balance of $205 million from the Liquidity Update, adjusted to exclude the benefit of pension system advances inherent in the projection. (2) Government entities primarily include University of Puerto Rico, Puerto Rico Highway and Transportation Authority/Government Development Bank, Public Buildings Authority, and Puerto Rico Industrial Development Company. (3) Deferrals are calculated based on CM’s Liquidity Update dated August 25, 2015 as compared to the latest cash flow projection prepared by the Puerto Rico Treasury Department. (4) Other net working capital variances include reduced availability of GDB line of credit ($300 million); partially offset by favorable inflows related to Federal Funds ($54 million); Act 105 inflows ($96 million) and other net working capital variances
($20 million). (5) Cash balance has been adjusted to reflect disbursement for General Obligation debt service in January. $66 million represents the ending bank cash balance; after adjusting for deposits in transit and outstanding checks the book cash balance, was
$263 million. Includes TSA operating account and investment account; does not include amounts advanced by the Commonwealth’s pension systems, which by law are restricted for the payment of retiree benefits.
(5) (1) (3) (2) (3)
The TSA bank cash balance (net of January debt service payments) was $66 million as of December 31, 2015. Treasury needs to maintain a minimum cash balance in the TSA in order to honor outstanding checks, account for deposits in transit and fund essential services net of projected collections
As of December 31, 2015, the TSA’s actual book cash balance was negative $263 million after accounting for outstanding checks and deposits in transit
(4)
Working Group for
the Fiscal and
Economic
Recovery
of Puerto Rico
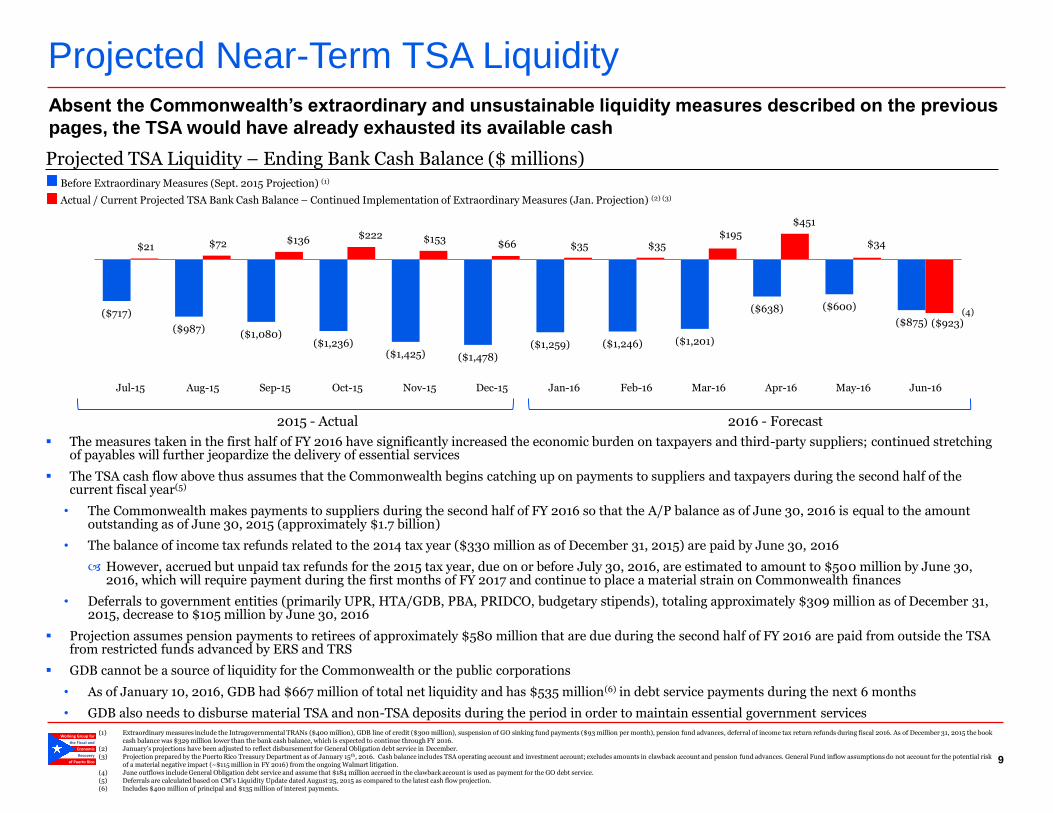
Projected Near-Term TSA Liquidity Absent the Commonwealth’s extraordinary and unsustainable liquidity measures described on the previous
pages, the TSA would have already exhausted its available cash
9
2015 - Actual 2016 - Forecast
Before Extraordinary Measures (Sept. 2015 Projection) (1)
Projected TSA Liquidity – Ending Bank Cash Balance ($ millions)
The measures taken in the first half of FY 2016 have significantly increased the economic burden on taxpayers and third-party suppliers; continued stretching of payables will further jeopardize the delivery of essential services
The TSA cash flow above thus assumes that the Commonwealth begins catching up on payments to suppliers and taxpayers during the second half of the current fiscal year(5)
• The Commonwealth makes payments to suppliers during the second half of FY 2016 so that the A/P balance as of June 30, 2016 is equal to the amount outstanding as of June 30, 2015 (approximately $1.7 billion)
• The balance of income tax refunds related to the 2014 tax year ($330 million as of December 31, 2015) are paid by June 30, 2016
However, accrued but unpaid tax refunds for the 2015 tax year, due on or before July 30, 2016, are estimated to amount to $500 million by June 30, 2016, which will require payment during the first months of FY 2017 and continue to place a material strain on Commonwealth finances
• Deferrals to government entities (primarily UPR, HTA/GDB, PBA, PRIDCO, budgetary stipends), totaling approximately $309 million as of December 31, 2015, decrease to $105 million by June 30, 2016
Projection assumes pension payments to retirees of approximately $580 million that are due during the second half of FY 2016 are paid from outside the TSA from restricted funds advanced by ERS and TRS
GDB cannot be a source of liquidity for the Commonwealth or the public corporations
• As of January 10, 2016, GDB had $667 million of total net liquidity and has $535 million(6) in debt service payments during the next 6 months
• GDB also needs to disburse material TSA and non-TSA deposits during the period in order to maintain essential government services
Actual / Current Projected TSA Bank Cash Balance – Continued Implementation of Extraordinary Measures (Jan. Projection) (2) (3)
(1) Extraordinary measures include the Intragovernmental TRANs ($400 million), GDB line of credit ($300 million), suspension of GO sinking fund payments ($93 million per month), pension fund advances, deferral of income tax return refunds during fiscal 2016. As of December 31, 2015 the book cash balance was $329 million lower than the bank cash balance, which is expected to continue through FY 2016.
(2) January’s projections have been adjusted to reflect disbursement for General Obligation debt service in December. (3) Projection prepared by the Puerto Rico Treasury Department as of January 15th, 2016. Cash balance includes TSA operating account and investment account; excludes amounts in clawback account and pension fund advances. General Fund inflow assumptions do not account for the potential risk
of a material negative impact (~$115 million in FY 2016) from the ongoing Walmart litigation. (4) June outflows include General Obligation debt service and assume that $184 million accrued in the clawback account is used as payment for the GO debt service. (5) Deferrals are calculated based on CM’s Liquidity Update dated August 25, 2015 as compared to the latest cash flow projection. (6) Includes $400 million of principal and $135 million of interest payments.
($717)
($987) ($1,080)
($1,236) ($1,425) ($1,478)
($1,259) ($1,246) ($1,201)
($638) ($600)
($875)
$21 $72 $136 $222 $153 $66 $35 $35 $195
$451
$34
($923)
Jul-15 Aug-15 Sep-15 Oct-15 Nov-15 Dec-15 Jan-16 Feb-16 Mar-16 Apr-16 May-16 Jun-16
(4)

Working Group for
the Fiscal and
Economic
Recovery
of Puerto Rico
T otal
2016P 2017 P 2018P 2019P 2020P 2021P 2022P 2023P 2024P 2025P 5 Yr 10 Yr
Fin. Surplus/(Gap) including Measures, before Growth (4) ($2,580) ($3,243) ($2,950) ($4,560) ($3,693) ($3,191) ($3,122) ($3,236) ($3,87 7 ) ($3,553) ($17 ,025) ($34,004)
Plus: Removal of Remaining Debt Service (5) 2,7 24 3,396 3,27 2 3,861 3,463 3,412 3,17 3 3,109 3,522 3,021 16,7 16 32,953
Fin. Surplus/(Gap) (before Debt Service & Growth) 144 154 322 (699) (230) 220 52 (127 ) (355) (532) (310) (1,052)
Plus: Estimated Benefit of Growth – – 89 303 57 3 927 1,355 1,808 2,286 2,7 93 965 10,133
Fin. Surplus/(Gap) (incl. Growth) 144 154 411 (396) 343 1,147 1,406 1,680 1,931 2,261 655 9,082
Plus: Replacement/Renewal of ACA Funds – – 544 1,605 1,7 37 1,821 1,883 1,953 2,014 2,082 3,887 13,640
Fin. Surplus/(Gap) (incl. ACA Replacem ent & Growth) $144 $154 $956 $1,209 $2,080 $2,968 $3,289 $3,633 $3,945 $4,343 $4,542 $22,7 21
Memo: Total Debt Service 4,121 3,396 3,272 3,861 3,463 3,412 3,173 3,109 3,522 3,021 18,113 34,350
Key Takeaways As in the original FEGP, the updated FEGP projections illustrate that the Commonwealth does not have a sufficient projected surplus to pay existing contractual debt service and a debt modification is necessary
10
The baseline FEGP projections assumes 1.0% nominal growth per year (-1.0% real, 2.0% inflation) until FY 2018, at which point the Commonwealth experiences flat real economic growth (2.0% nominal), before gradually rising to a long-term nominal rate of 4.5% (2.5%
real)
• This long-term growth rate, while achievable and inline with the estimates in the Krueger Report for both long-term U.S. and Puerto Rico economic growth,(1) is optimistic given that Puerto Rico’s real GNP growth has been below that of the U.S. every year since 2001(2)
Even after assuming all of the measures outlined in the FEGP are implemented and the potential benefit of economic growth, the
Commonwealth has only a $9.1 billion cumulative surplus over the ten-year projection period, as compared to ~$34.4 billion of remaining contractual debt service (including $1.4 billion already paid in FY 2016)
• If one were to further assume that the U.S. government does not reduce its current level of programmatic support of Puerto Rico
(which is to say, most importantly, assuming that Affordable Care Act (“ACA”) funding is either renewed or the Commonwealth receives an equivalent amount of Federal Transfers starting in FY 2018), the Commonwealth would have a ~$22.7 billion cumulative
surplus over the ten-year projection period, which is still significantly below contractually required debt service
Accordingly, a significant restructuring of the Commonwealth’s debt is inevitable in order to avoid a disorderly default and allow the Commonwealth to implement the FEGP measures, so as to stop further erosion of business and
consumer confidence and to optimize creditor recoveries
• The Obama Administration has already called upon Congress to provide Puerto Rico with equitable healthcare funding treatment and tax policy changes to reward work and support growth, as well as access to a broad debt restructuring regime(3)
(1) See the report “Puerto Rico – A Way Forward,” updated as of July 13, 2015. Note that the 2.5% projection is based on the Krueger Team’s review of IMF estimates of potential growth in the United States in the previous decade (3%) and current projections of growth for the U.S. economy in the absence of needed structural reforms (2%). The projections going forward from FY 2021 are the midpoint (2.5%) of the aforementioned range.
(2) Source: St. Louis Federal Reserve Database (FRED) for the Untied States historical GNP growth rates, and the Government Development Bank for Puerto Rico (“GDB”) for Puerto Rico’s GNP growth rates. (3) See “Addressing Puerto Rico’s Economic and Fiscal Crisis and Creating a Path to Recovery: Roadmap for Congressional Action,” released on October 21, 2015. (4) This surplus/(gap) includes the updated deposit replenishment schedule, which assumes deposit replenishments begin in FY 2017 and build to $1.5 billion evenly through FY 2020. This also includes the accelerated paydown schedule for overdue
accounts payable. (5) FY 2016 only includes addback of debt service due after January 1, 2016, except for PRIFA Rum (inclusive of January 1, 2016 debt service withheld) and PFC (inclusive of debt service withheld since partial payment made on August 1, 2015). For all
other years, total debt service is shown.
Estimated Available Surplus/(Gap) before Debt Service ($ millions)

Working Group for
the Fiscal and
Economic
Recovery
of Puerto Rico
Appendix

Working Group for
the Fiscal and
Economic
Recovery
of Puerto Rico
Appendix - Updates to Original FEGP
(FY 2016 – FY 2020)
Working Group for
the Fiscal and
Economic
Recovery
of Puerto Rico
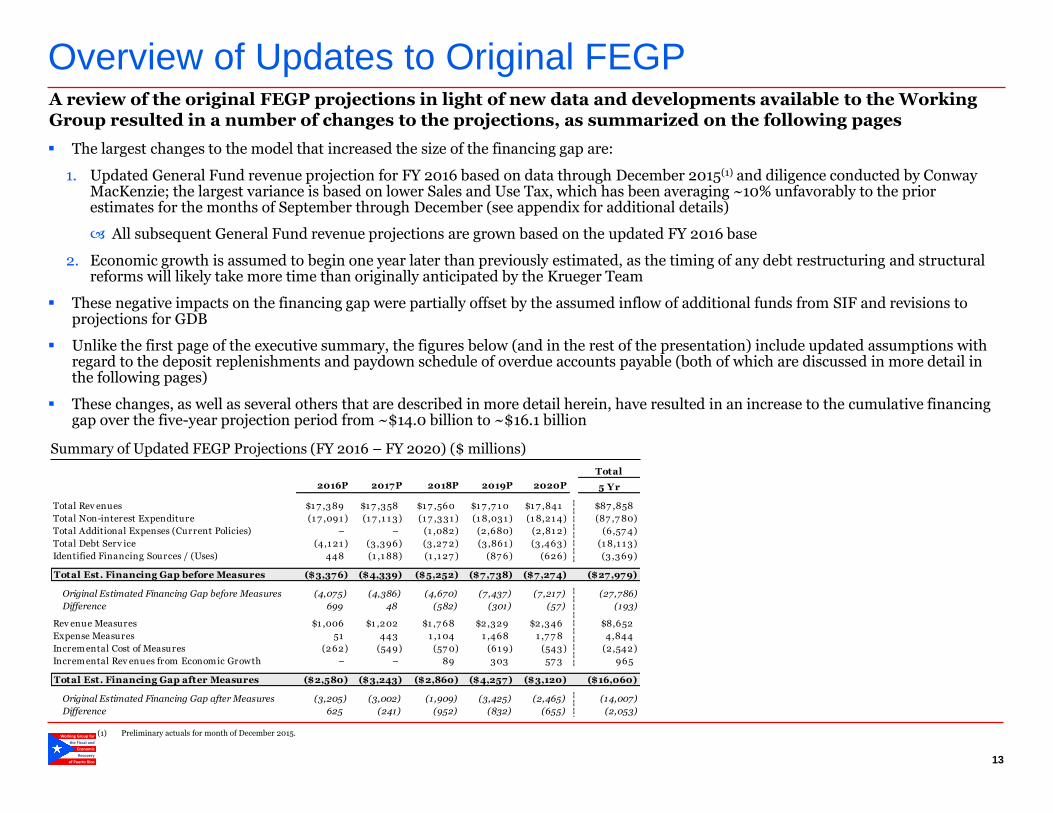
Overview of Updates to Original FEGP A review of the original FEGP projections in light of new data and developments available to the Working Group resulted in a number of changes to the projections, as summarized on the following pages
13
The largest changes to the model that increased the size of the financing gap are:
1. Updated General Fund revenue projection for FY 2016 based on data through December 2015(1) and diligence conducted by Conway MacKenzie; the largest variance is based on lower Sales and Use Tax, which has been averaging ~10% unfavorably to the prior estimates for the months of September through December (see appendix for additional details)
All subsequent General Fund revenue projections are grown based on the updated FY 2016 base
2. Economic growth is assumed to begin one year later than previously estimated, as the timing of any debt restructuring and structural reforms will likely take more time than originally anticipated by the Krueger Team
These negative impacts on the financing gap were partially offset by the assumed inflow of additional funds from SIF and revisions to projections for GDB
Unlike the first page of the executive summary, the figures below (and in the rest of the presentation) include updated assumptions with regard to the deposit replenishments and paydown schedule of overdue accounts payable (both of which are discussed in more detail in the following pages)
These changes, as well as several others that are described in more detail herein, have resulted in an increase to the cumulative financing gap over the five-year projection period from ~$14.0 billion to ~$16.1 billion
Summary of Updated FEGP Projections (FY 2016 – FY 2020) ($ millions)
(1) Preliminary actuals for month of December 2015.
Total
2016P 2017P 2018P 2019P 2020P 5 Yr
Total Rev enues $1 7 ,389 $1 7 ,358 $1 7 ,560 $1 7 ,7 1 0 $1 7 ,841 $87 ,858
Total Non-interest Expenditure (1 7 ,091 ) (1 7 ,1 1 3) (1 7 ,331 ) (1 8,031 ) (1 8,21 4) (87 ,7 80)
Total Additional Expenses (Current Policies) – – (1 ,082) (2,680) (2,81 2) (6,57 4)
Total Debt Serv ice (4,1 21 ) (3 ,396) (3,27 2) (3,861 ) (3 ,463) (1 8,1 1 3)
Identified Financing Sources / (Uses) 448 (1 ,1 88) (1 ,1 27 ) (87 6) (626) (3,369)
Total Est. Financing Gap before Measures ($3,376) ($4,339) ($5,252) ($7,738) ($7,274) ($27,979)
Original Estimated Financing Gap before Measures (4,075) (4,386) (4,670) (7,437) (7,217) (27,786)
Difference 699 48 (582) (301) (57) (193)
Rev enue Measures $1 ,006 $1 ,202 $1 ,7 68 $2,329 $2,346 $8,652
Expense Measures 51 443 1 ,1 04 1 ,468 1 ,7 7 8 4,844
Incremental Cost of Measures (262) (549) (57 0) (61 9) (543) (2,542)
Incremental Rev enues from Economic Growth – – 89 303 57 3 965
Total Est. Financing Gap after Measures ($2,580) ($3,243) ($2,860) ($4,257) ($3,120) ($16,060)
Original Estimated Financing Gap after Measures (3,205) (3,002) (1,909) (3,425) (2,465) (14,007)
Difference 625 (241) (952) (832) (655) (2,053)
Working Group for
the Fiscal and
Economic
Recovery
of Puerto Rico
$48,407
$46,674
$81 2
$456
$31 4
$207 $3
$60
$46,000
$46,500
$47,000
$47,500
$48,000
$48,500
$49,000
Original FEGP GeneralFund Revenue (incl.Transition to VAT)
SUT/VATCollections
Change in B2BLegislation
Individual andCorporate Taxes
Act 154 / ForeignCompany Tax
Revenues
Other (Alcohol,Cigarettes, Motor
Vehicle, and Other)
Non-ResidentWithholdings
Updated FEGPGeneral Fund Revenue
(incl. Transition toVAT)
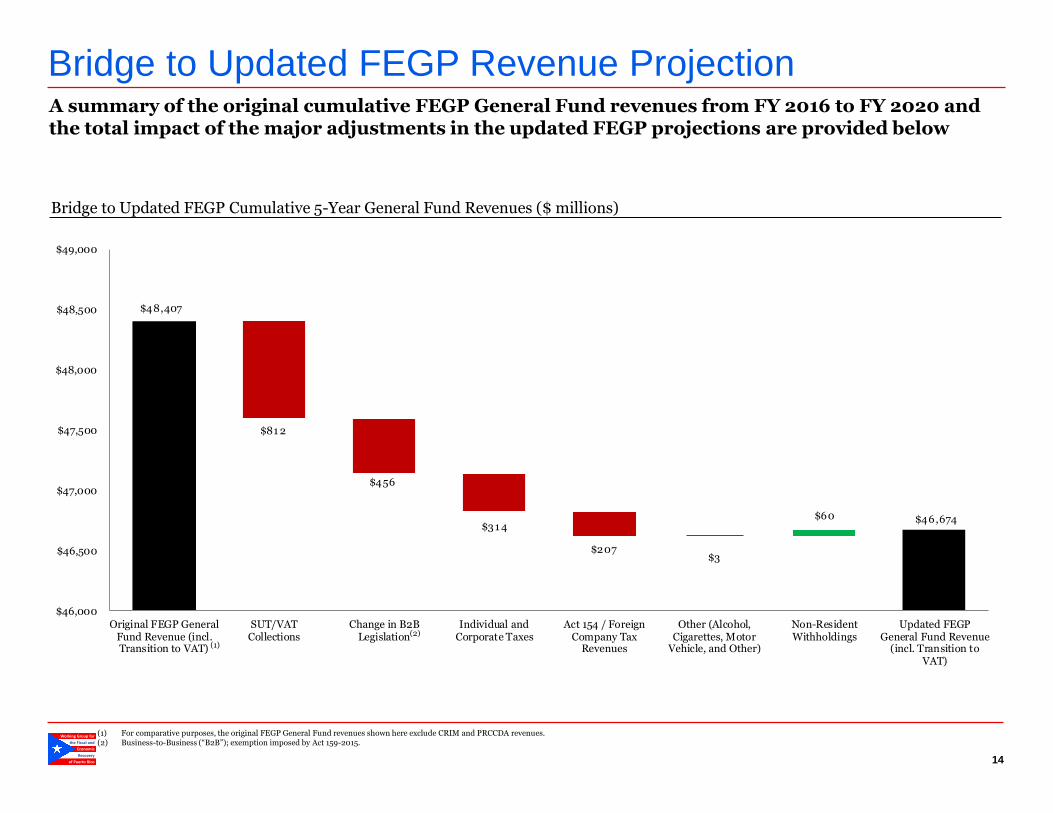
Bridge to Updated FEGP Revenue Projection
14
A summary of the original cumulative FEGP General Fund revenues from FY 2016 to FY 2020 and the total impact of the major adjustments in the updated FEGP projections are provided below
Bridge to Updated FEGP Cumulative 5-Year General Fund Revenues ($ millions)
(1) For comparative purposes, the original FEGP General Fund revenues shown here exclude CRIM and PRCCDA revenues. (2) Business-to-Business (“B2B”); exemption imposed by Act 159-2015.
(1)
(2)
Working Group for
the Fiscal and
Economic
Recovery
of Puerto Rico
Detailed Bridge to Updated FEGP
15
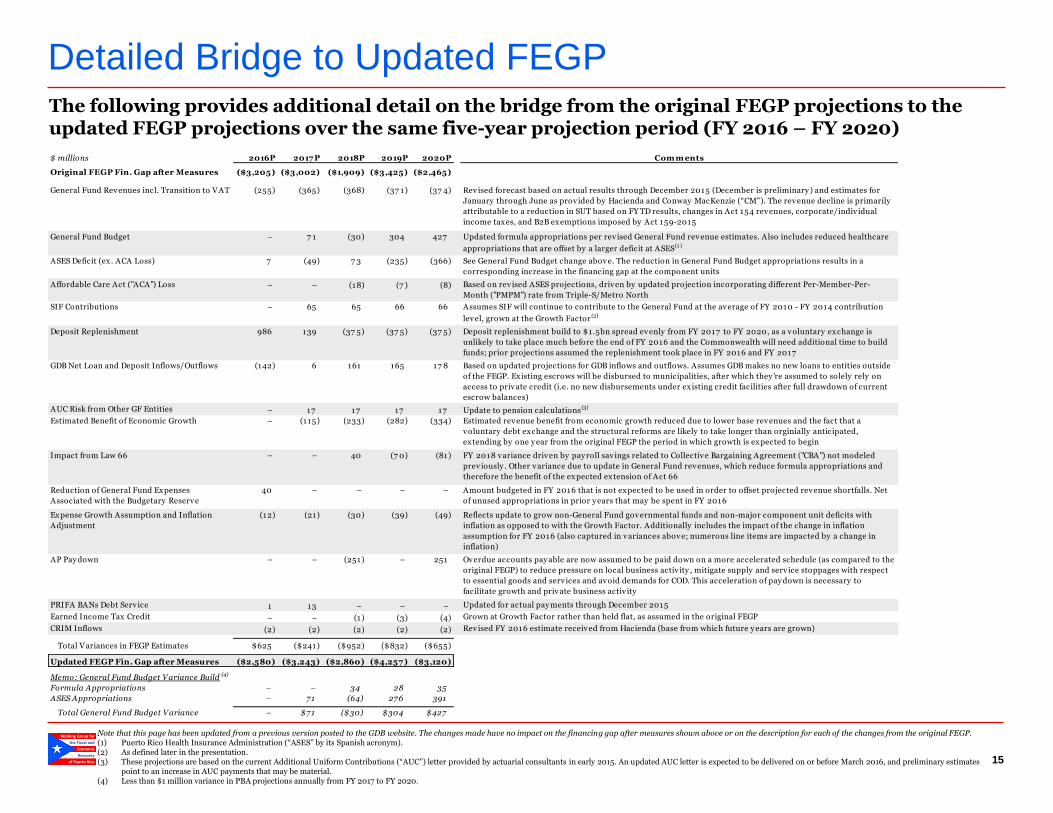
The following provides additional detail on the bridge from the original FEGP projections to the updated FEGP projections over the same five-year projection period (FY 2016 – FY 2020)
Note that this page has been updated from a previous version posted to the GDB website. The changes made have no impact on the financing gap after measures shown above or on the description for each of the changes from the original FEGP. (1) Puerto Rico Health Insurance Administration (“ASES” by its Spanish acronym). (2) As defined later in the presentation. (3) These projections are based on the current Additional Uniform Contributions (“AUC”) letter provided by actuarial consultants in early 2015. An updated AUC letter is expected to be delivered on or before March 2016, and preliminary estimates
point to an increase in AUC payments that may be material. (4) Less than $1 million variance in PBA projections annually from FY 2017 to FY 2020.
$ millions 2016P 2017 P 2018P 2019P 2020P Com m ents
Original FEGP Fin. Gap after Measures ($3,205) ($3,002) ($1,909) ($3,425) ($2,465)
(255) (365) (368) (37 1) (37 4)
General Fund Budget – 7 1 (30) 304 427
ASES Deficit (ex. ACA Loss) 7 (49) 7 3 (235) (366)
Affordable Care Act ("ACA") Loss – – (18) (7 ) (8)
SIF Contributions – 65 65 66 66
Deposit Replenishment 986 139 (37 5) (37 5) (37 5)
GDB Net Loan and Deposit Inflows/Outflows (142) 6 161 165 17 8
AUC Risk from Other GF Entities – 17 17 17 17 Update to pension calculations(3)
Estimated Benefit of Economic Growth – (115) (233) (282) (334)
Impact from Law 66 – – 40 (7 0) (81)
40 – – – –
(12) (21) (30) (39) (49)
AP Pay down – – (251) – 251 Overdue accounts pay able are now assumed to be paid down on a more accelerated schedule (as compared to the
original FEGP) to reduce pressure on local business activ ity , mitigate supply and serv ice stoppages with respect
to essential goods and serv ices and avoid demands for COD. This acceleration of pay down is necessary to
facilitate growth and private business activ ity
PRIFA BANs Debt Serv ice 1 13 – – – Updated for actual pay ments through December 2015
Earned Income Tax Credit – – (1) (3) (4) Grown at Growth Factor rather than held flat, as assumed in the original FEGP
CRIM Inflows (2) (2) (2) (2) (2) Revised FY 2016 estimate received from Hacienda (base from which future y ears are grown)
Total Variances in FEGP Estimates $625 ($241) ($952) ($832) ($655)
Updated FEGP Fin. Gap after Measures ($2,580) ($3,243) ($2,860) ($4,257 ) ($3,120)
Memo: General Fund Budget Variance Build (4)
Formula Appropriations – – 34 28 35
ASES Appropriations – 71 (64) 276 391
Total General Fund Budget Variance – $71 ($30) $304 $427
Reflects update to grow non-General Fund governmental funds and non-major component unit deficits with
inflation as opposed to with the Growth Factor. Additionally includes the impact of the change in inflation
assumption for FY 2016 (also captured in variances above; numerous line items are impacted by a change in
inflation)
Expense Growth Assumption and Inflation
Adjustment
Updated formula appropriations per rev ised General Fund revenue estimates. Also includes reduced healthcare
appropriations that are offset by a larger deficit at ASES(1 )
General Fund Revenues incl. Transition to VAT
Amount budgeted in FY 2016 that is not expected to be used in order to offset projected revenue shortfalls. Net
of unused appropriations in prior y ears that may be spent in FY 2016
Assumes SIF will continue to contribute to the General Fund at the average of FY 2010 - FY 2014 contribution
level, grown at the Growth Factor (2)
Reduction of General Fund Expenses
Associated with the Budgetary Reserve
Estimated revenue benefit from economic growth reduced due to lower base revenues and the fact that a
voluntary debt exchange and the structural reforms are likely to take longer than orginially anticipated,
extending by one y ear from the original FEGP the period in which growth is expected to begin
Based on updated projections for GDB inflows and outflows. Assumes GDB makes no new loans to entities outside
of the FEGP. Existing escrows will be disbursed to municipalities, after which they 're assumed to solely rely on
access to private credit (i.e. no new disbursements under existing credit facilities after full drawdown of current
escrow balances)
Based on rev ised ASES projections, driven by updated projection incorporating different Per-Member-Per-
Month ("PMPM") rate from Triple-S/Metro North
Revised forecast based on actual results through December 2015 (December is preliminary ) and estimates for
January through June as provided by Hacienda and Conway MacKenzie (“CM”). The revenue decline is primarily
attributable to a reduction in SUT based on FY TD results, changes in Act 154 revenues, corporate/indiv idual
income taxes, and B2B exemptions imposed by Act 159-2015
See General Fund Budget change above. The reduction in General Fund Budget appropriations results in a
corresponding increase in the financing gap at the component units
FY 2018 variance driven by pay roll sav ings related to Collective Bargaining Agreement ("CBA") not modeled
prev iously . Other variance due to update in General Fund revenues, which reduce formula appropriations and
therefore the benefit of the expected extension of Act 66
Deposit replenishment build to $1.5bn spread evenly from FY 2017 to FY 2020, as a voluntary exchange is
unlikely to take place much before the end of FY 2016 and the Commonwealth will need additional time to build
funds; prior projections assumed the replenishment took place in FY 2016 and FY 2017

Working Group for
the Fiscal and
Economic
Recovery
of Puerto Rico
Layout Changes
For purposes of more clearly delineating revenues from expenditures, certain estimates that were previously shown on a net basis have been
broken out
• Puerto Rico Infrastructure Financing Authority (“PRIFA”) petroleum revenues have been shown separately rather than being consolidated
within GDB net operating revenue
• In the revenue total, GDB projections have been updated to only reflect loan-related inflows from its portfolio, with net deposit outflows and
loan outflows moved to the expenditure side
• Puerto Rico Convention Center District Authority (“PRCCDA”) revenues, as well as inflows from the Municipal Revenues Collection Center
(“CRIM” by its Spanish acronym), are broken out separately in order to show General Fund revenues without other select revenues
• Additionally, revenues from certain component units have also been broken out on the revenue side instead of being embedded with the net
deficit of component units
Puerto Rico Industrial Development Company (“PRIDCO”) revenues have been shown separately from expenses
Net revenues of component units that do not have bonded debt and that, after deducting expenses, historically result in positive earnings,
have been shown as revenue inflows (net of expenses)
– These component units were previously shown together with the component units that typically run a loss; as a result of this move to
revenues, the component unit expenses shown for these other entities increase
SIF contributions in FY 2016 have been moved to component unit revenues (all projected future SIF contributions are also included in
revenues)
• University of Puerto Rico (“UPR”) tuition and other revenues are now included in revenues and an offsetting expense is now shown as an
outflow, which is based on the assumption that, following the cuts in UPR appropriations called for in the FEGP, UPR will not build a
material positive cash balance (i.e. UPR revenues will be offset by expenses)
• Federal Transfers (and offsetting Federal Programs) now include estimated UPR Federal and State grants and contracts, as well as the
Federal Pell Grant Program
Additionally, as a result of requests received following the publication of the original FEGP, a
number of structural and organizational changes have been made to the layout of the FEGP
projections, which did not have an impact on the estimated financing gaps
16
Working Group for
the Fiscal and
Economic
Recovery
of Puerto Rico
Appendix - FEGP Model Extension
(FY 2021 – FY 2025)

Working Group for
the Fiscal and
Economic
Recovery
of Puerto Rico
FEGP Extension Assumptions
18
The following assumptions have been made in order to extend the FEGP an additional five years
General Fund (“GF”) and SUT /VAT Revenues
• GF revenues (with the exception of Act 154 revenues, which are held flat) and SUT/VAT revenues are grown by the product of estimated inflation and the assumed Puerto Rico real GNP growth (the “Growth Factor”)(1)
Assumed long-term inflation rates are based on discussions with the Commonwealth’s economic consultants
In the “Base” projections before measures, the original FEGP assumed real GNP growth to be -1.0% per year; that assumption has been held constant in the updated FEGP (the result of this -1.0% and 2.0% inflation (after FY 2016) is the “Base Growth Factor”)
To estimate the impact of growth, the prior model had assumed the Commonwealth economy experienced flat real GNP growth in FY 2017 and then ramped up to 2.0% by FY 2020 (the result of the higher growth rate and 2.0% inflation constituting the “High Growth Factor”)
– The new projections for the benefit of economic growth assume FY 2017 continues the -1.0% real GNP growth decline, flattens in FY 2018, and reaches 2.0% by FY 2021
– Beyond FY 2021, the new projections assume real GNP growth to be equal to the long-term growth rate estimated in the Krueger Report, which in turn is based on the authors of that report's review of IMF estimates of potential growth in the United States in the previous decade (3%) and current projections of growth for the U.S. economy in the absence of needed structural reforms (2%). The projections going forward from FY 2021 are the midpoint (2.5%) of the aforementioned range
Revenues
(1) Note that the GF revenue assumptions do not account for the potential risk of a material negative impact from the ongoing Walmart litigation. The preliminary estimated negative impact related to an unsuccessful outcome is approximately $115 million for FY 2016 and ~$1.3 billion over the ten-year projection period.
2016P 2017P 2018P 2019P 2020P 2021P 2022P 2023P 2024P 2025P
Original FEGP Projections
Estimated Inflation 2.0% 2.0% 2.0% 2.0% 2.0% 2.0% 2.0% 2.0% 2.0% 2.0%
Real GNP Growth Rate
Base Case (1.0%) (1.0%) (1.0%) (1.0%) (1.0%) (1.0%) (1.0%) (1.0%) (1.0%) (1.0%)
High Case (1.0%) – 1.0% 1.5% 2.0% 2.5% 2.5% 2.5% 2.5% 2.5%
Nominal GNP Growth Rate
Base Case 1.0% 1.0% 1.0% 1.0% 1.0% 1.0% 1.0% 1.0% 1.0% 1.0%
High Case 1.0% 2.0% 3.0% 3.5% 4.0% 4.5% 4.5% 4.5% 4.5% 4.5%
Revised FEGP Projections
Estimated Inflation 1.1% 2.0% 2.0% 2.0% 2.0% 2.0% 2.0% 2.0% 2.0% 2.0%
Real GNP Growth Rate
Base Case (1.0%) (1.0%) (1.0%) (1.0%) (1.0%) (1.0%) (1.0%) (1.0%) (1.0%) (1.0%)
High Case (1.0%) (1.0%) – 1.0% 1.5% 2.0% 2.5% 2.5% 2.5% 2.5%
Nominal GNP Growth Rate
Base Case 0.1% 1.0% 1.0% 1.0% 1.0% 1.0% 1.0% 1.0% 1.0% 1.0%
High Case 0.1% 1.0% 2.0% 3.0% 3.5% 4.0% 4.5% 4.5% 4.5% 4.5%
Working Group for
the Fiscal and
Economic
Recovery
of Puerto Rico
FEGP Extension Assumptions (cont’d)
19
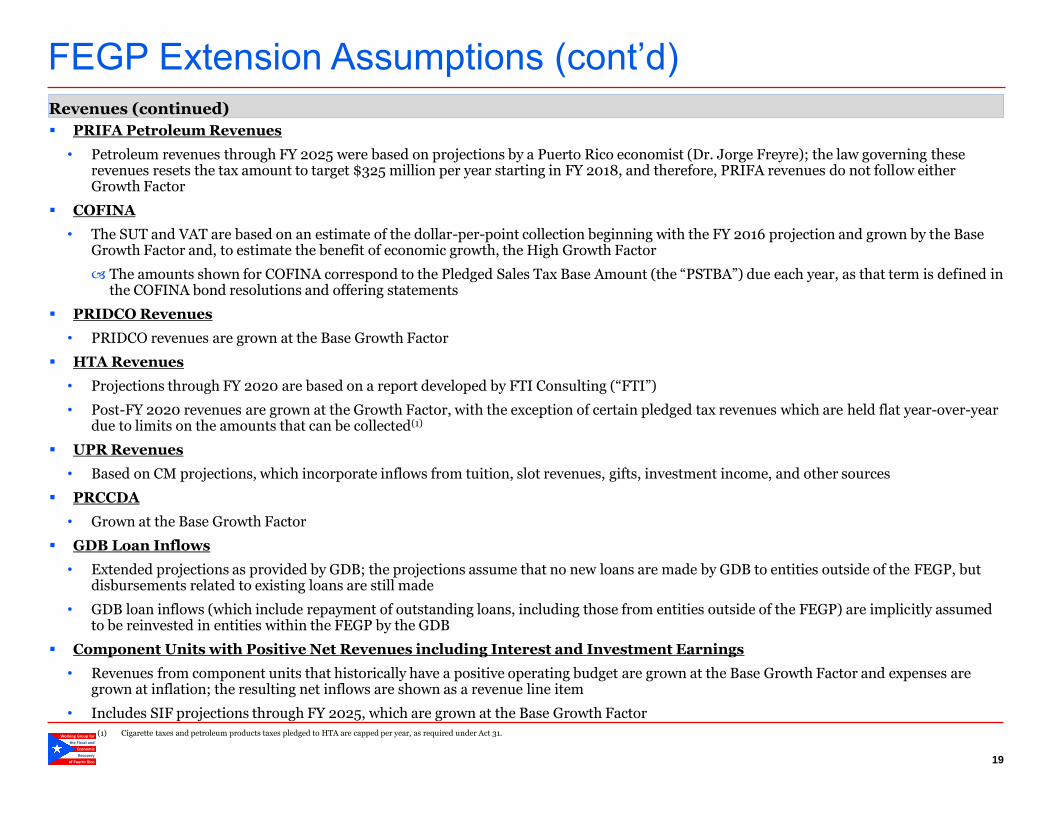
PRIFA Petroleum Revenues
• Petroleum revenues through FY 2025 were based on projections by a Puerto Rico economist (Dr. Jorge Freyre); the law governing these revenues resets the tax amount to target $325 million per year starting in FY 2018, and therefore, PRIFA revenues do not follow either Growth Factor
COFINA
• The SUT and VAT are based on an estimate of the dollar-per-point collection beginning with the FY 2016 projection and grown by the Base Growth Factor and, to estimate the benefit of economic growth, the High Growth Factor
The amounts shown for COFINA correspond to the Pledged Sales Tax Base Amount (the “PSTBA”) due each year, as that term is defined in the COFINA bond resolutions and offering statements
PRIDCO Revenues
• PRIDCO revenues are grown at the Base Growth Factor
HTA Revenues
• Projections through FY 2020 are based on a report developed by FTI Consulting (“FTI”)
• Post-FY 2020 revenues are grown at the Growth Factor, with the exception of certain pledged tax revenues which are held flat year-over-year due to limits on the amounts that can be collected(1)
UPR Revenues
• Based on CM projections, which incorporate inflows from tuition, slot revenues, gifts, investment income, and other sources
PRCCDA
• Grown at the Base Growth Factor
GDB Loan Inflows
• Extended projections as provided by GDB; the projections assume that no new loans are made by GDB to entities outside of the FEGP, but disbursements related to existing loans are still made
• GDB loan inflows (which include repayment of outstanding loans, including those from entities outside of the FEGP) are implicitly assumed to be reinvested in entities within the FEGP by the GDB
Component Units with Positive Net Revenues including Interest and Investment Earnings
• Revenues from component units that historically have a positive operating budget are grown at the Base Growth Factor and expenses are grown at inflation; the resulting net inflows are shown as a revenue line item
• Includes SIF projections through FY 2025, which are grown at the Base Growth Factor
Revenues (continued)
(1) Cigarette taxes and petroleum products taxes pledged to HTA are capped per year, as required under Act 31.

Working Group for
the Fiscal and
Economic
Recovery
of Puerto Rico
FEGP Extension Assumptions (cont’d)
20
Non-Interest Expenses
General Fund Budget
• Projections through FY 2025 were provided by the Office of Management and Budget (“OMB”) using a model developed in conjunction with CM; post-FY 2020, the net effects of the measures and payroll payments are assumed to grow at inflation
GDB Loan and Net Deposit Outflows
• Based on updated estimates of GDB outflows assuming no new loans are made to entities outside the model – this assumption results in positive net inflows as existing loans are repaid over time
Additional Uniform Contribution and Catch-Up (“AUC”)
• Employees Retirement System (“ERS”) and Teachers Retirement System (“TRS”) are projected through FY 2025 based on actuarial work completed by Milliman
• Judicial Retirement System (“JRS”) continues to be projected on a pay-as-you-go basis
• The current projections assume the AUCs are paid in full based on the latest AUC letter provided by actuarial consultants in early 2015. An updated AUC letter is expected to be delivered on or before March 2016, and preliminary estimates point to an increase in AUC payments that may be material
Net Operating Deficit of Non-GF Governmental Funds
• The deficits of the “non-budgeted funds” are projected to grow at inflation from FY 2016 through FY 2025
Component Units
• CM diligence and reports formed the basis for many of the largest component units included in the model
• The original PRIDCO and PRCCDA expenses were based on projections provided by those agencies; the expenses of these agencies are projected to grow at inflation
• UPR expenses post-FY 2020 are projected to evenly offset incremental UPR revenues
• Other component units are projected to grow at inflation through FY 2025
Capital Expenditures (“CapEx”)
• CapEx projections through FY 2020 were developed with the assistance of the Puerto Rico Public-Private Partnerships Authority and PRIFA
• From FY 2021 to FY 2025, CapEx is projected based on the average of the prior five years (with the exception of certain “Extraordinary Maintenance and Repairs,” which are based on the FY 2020 total) and grown at inflation
HTA Expenditures
• Projections through FY 2020 were based on the work of FTI; from FY 2021 on, expenses were assumed to grow at the rate of inflation

Working Group for
the Fiscal and
Economic
Recovery
of Puerto Rico
FEGP Extension Assumptions (cont’d)
21
Additional Expenses Based on Current Policies
Loss of ACA Funding
• The loss of ACA funding is estimated based on CM’s extended ASES projections
Act 154/Foreign Company Tax Losses
• The estimates of the potential loss were developed based on a review of past Act 154-related tax receipts and diligence sessions with PRIDCO
The loss was estimated based on a review of income that would result from a modified source rule and the potential loss of businesses if the tax is no longer creditable
These losses were held flat in the extended projection period as the benefits of the tax are not projected to grow on the revenue side
Debt Service
Identified Financing Sources
As previously scheduled
Change in Stock of Payables
• Non-tax refund related payables are projected to reach 35 days payable outstanding (“DPO”) by FY 2020
• There are no additional costs related with a pay down thereafter
• The account balance of past-due accounts payable may differ from that estimated to the extent that certain payables have not been entered into the Commonwealth’s systems. To the extent the balance of past-due accounts payable is larger than estimated, the required repayment of these payables may be larger, and may take longer, than estimated herein
• In addition, to the extent the payable balance is built in FY 2016, it is possible that the “deficit” in FY 2016 could be reduced, but future years would require high payable repayment
Net Deposit Draw/Replenishment
• The Treasury Single Account (“TSA”) deposit base is assumed to grow to $1.5 billion by FY 2020, after which it is held constant
Reserve Account Draws
• The updated FEGP continues to assume no debt service reserve draws; there is potential upside to the cash flows if any amounts in the existing debt service reserves are released as part of an exchange transaction and/or if the requirement to refill the reserves are waived
• In practice, certain debt service reserve accounts will continue to be drawn following the January 1, 2016 debt service payment assuming the clawbacks are extended. Under the current governing debt documents, these reserves would have to be refilled and therefore, over time (assuming the clawbacks eventually come to an end), it would not be expected to have a net impact on the cumulative financing gap

Working Group for
the Fiscal and
Economic
Recovery
of Puerto Rico
FEGP Extension Assumptions (cont’d)
22
Revenue Measures
Expense Measures
Complete Transition to VAT
• Dollar-per-point of tax projections continue to grow at the Base Growth Factor in the extended projection period; to estimate the impact of growth the High Growth Factor is used and then the differential from the Base Growth Factor is calculated
Stabilize Corporate Tax Revenue Base
• This is projected to match the estimated loss from not extending Act 154
Improve Tax Administration and Enforcement
• This source of additional revenue is projected to grow at the Base Growth Factor
Reduce Operating Costs and Cuts in Governmental Subsidies
• Beyond FY 2020, the expenses subject to Act 66 and the reduction in government subsidies are generally assumed to grow, from the net amount after the impacts of Act 66 and cuts in subsidies in FY 2020, by inflation
The impact of Act 66 on water utility expenses is not projected to continue past FY 2017. General Fund water utility expenses are projected to grow at 4.5% (as projected in PRASA’s business plan)
Right-Size Department of Education
• This expense measure is grown at projected inflation
Control Health Care Costs
• This expense measure is grown at projected inflation
Working Group for
the Fiscal and
Economic
Recovery
of Puerto Rico
(4.0%)
(3.0%)
(2.0%)
(1.0%)
–
1.0%
2.0%
3.0%
4.0%
2001 2002 2003 2004 2005 2006 2007 2008 2009 2010 2011 2012 2013 2014
Puerto Rico United States
FEGP Extension Assumptions (cont’d)
23
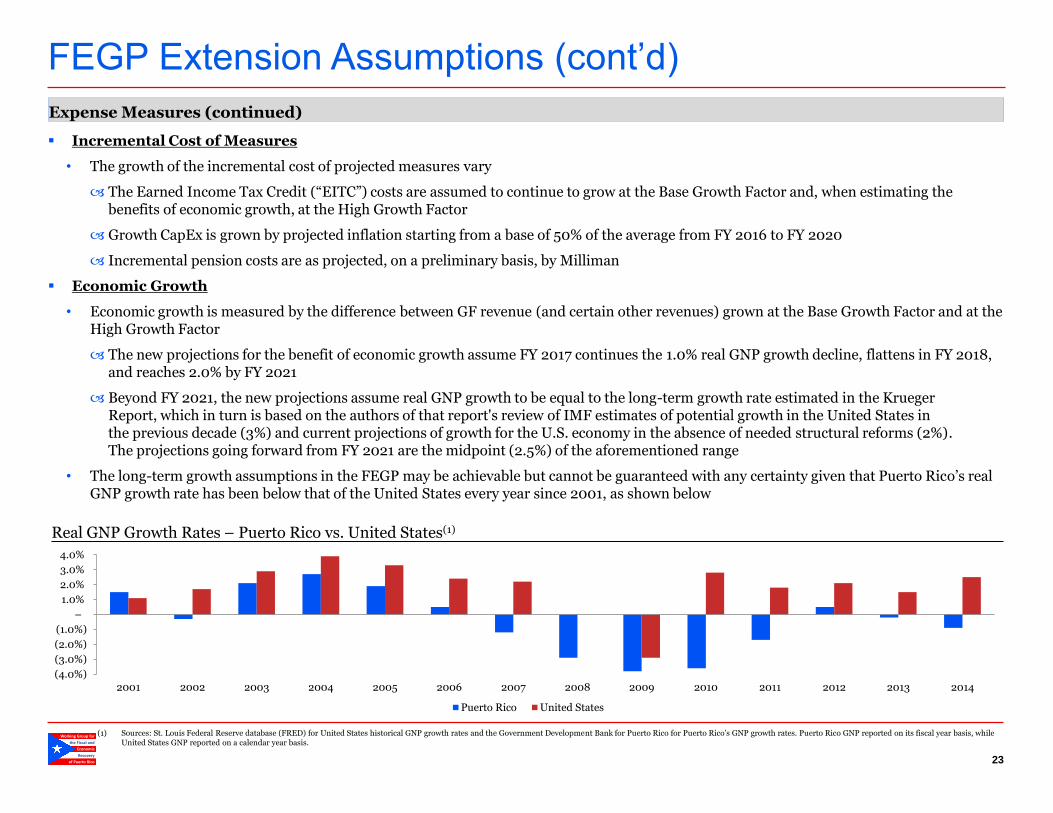
Incremental Cost of Measures
• The growth of the incremental cost of projected measures vary
The Earned Income Tax Credit (“EITC”) costs are assumed to continue to grow at the Base Growth Factor and, when estimating the benefits of economic growth, at the High Growth Factor
Growth CapEx is grown by projected inflation starting from a base of 50% of the average from FY 2016 to FY 2020
Incremental pension costs are as projected, on a preliminary basis, by Milliman
Economic Growth
• Economic growth is measured by the difference between GF revenue (and certain other revenues) grown at the Base Growth Factor and at the High Growth Factor
The new projections for the benefit of economic growth assume FY 2017 continues the 1.0% real GNP growth decline, flattens in FY 2018, and reaches 2.0% by FY 2021
Beyond FY 2021, the new projections assume real GNP growth to be equal to the long-term growth rate estimated in the Krueger Report, which in turn is based on the authors of that report's review of IMF estimates of potential growth in the United States in the previous decade (3%) and current projections of growth for the U.S. economy in the absence of needed structural reforms (2%). The projections going forward from FY 2021 are the midpoint (2.5%) of the aforementioned range
• The long-term growth assumptions in the FEGP may be achievable but cannot be guaranteed with any certainty given that Puerto Rico’s real GNP growth rate has been below that of the United States every year since 2001, as shown below
Expense Measures (continued)
Real GNP Growth Rates – Puerto Rico vs. United States(1)
(1) Sources: St. Louis Federal Reserve database (FRED) for United States historical GNP growth rates and the Government Development Bank for Puerto Rico for Puerto Rico’s GNP growth rates. Puerto Rico GNP reported on its fiscal year basis, while United States GNP reported on a calendar year basis.
Working Group for
the Fiscal and
Economic
Recovery
of Puerto Rico
Extended FEGP Projections (FY 2021 – FY 2025)
24
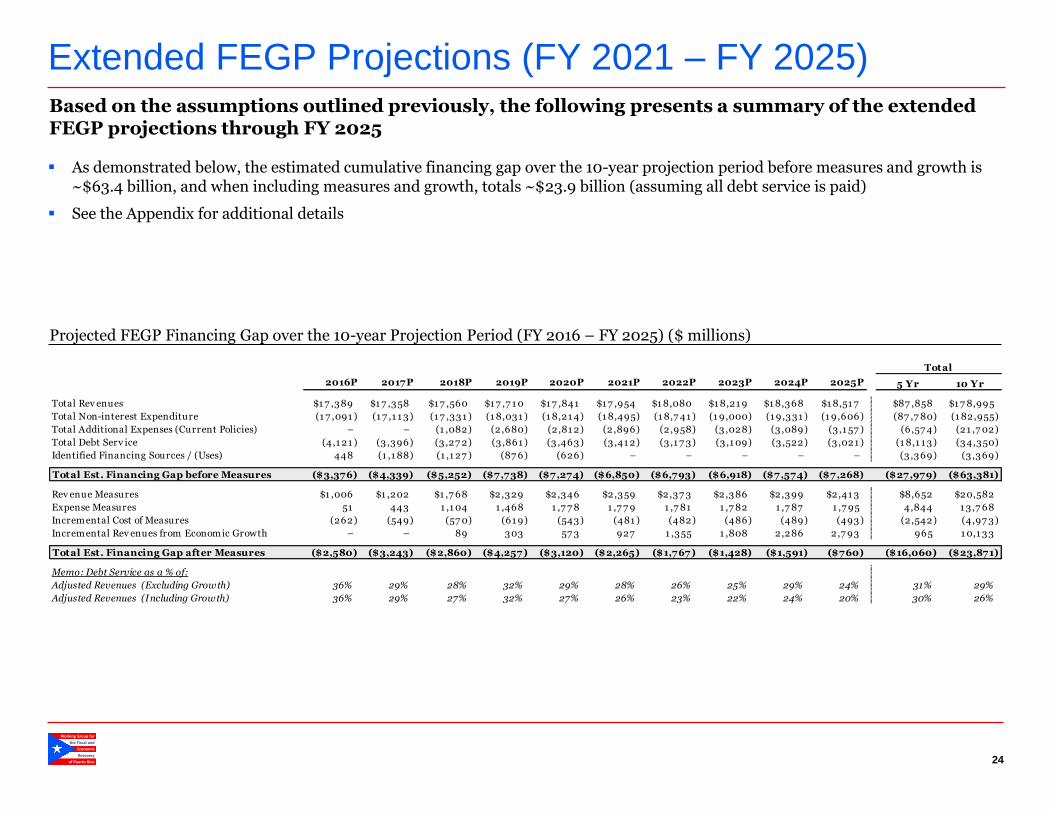
Based on the assumptions outlined previously, the following presents a summary of the extended FEGP projections through FY 2025
Projected FEGP Financing Gap over the 10-year Projection Period (FY 2016 – FY 2025) ($ millions)
As demonstrated below, the estimated cumulative financing gap over the 10-year projection period before measures and growth is ~$63.4 billion, and when including measures and growth, totals ~$23.9 billion (assuming all debt service is paid)
See the Appendix for additional details
Total
2016P 2017P 2018P 2019P 2020P 2021P 2022P 2023P 2024P 2025P 5 Yr 10 Yr
Total Rev enues $1 7 ,389 $1 7 ,358 $1 7 ,560 $1 7 ,7 1 0 $1 7 ,841 $1 7 ,954 $1 8,080 $1 8,21 9 $1 8,368 $1 8,51 7 $87 ,858 $1 7 8,995
Total Non-interest Expenditure (1 7 ,091 ) (1 7 ,1 1 3) (1 7 ,331 ) (1 8,031 ) (1 8,21 4) (1 8,495) (1 8,7 41 ) (1 9,000) (1 9,331 ) (1 9,606) (87 ,7 80) (1 82,955)
Total Additional Expenses (Current Policies) – – (1 ,082) (2,680) (2,81 2) (2,896) (2,958) (3,028) (3,089) (3,1 57 ) (6,57 4) (21 ,7 02)
Total Debt Serv ice (4,1 21 ) (3 ,396) (3,27 2) (3,861 ) (3 ,463) (3,41 2) (3,1 7 3) (3,1 09) (3,522) (3,021 ) (1 8,1 1 3) (34,350)
Identified Financing Sources / (Uses) 448 (1 ,1 88) (1 ,1 27 ) (87 6) (626) – – – – – (3 ,369) (3 ,369)
Total Est. Financing Gap before Measures ($3,376) ($4,339) ($5,252) ($7,738) ($7,274) ($6,850) ($6,793) ($6,918) ($7,574) ($7,268) ($27,979) ($63,381)
Rev enue Measures $1 ,006 $1 ,202 $1 ,7 68 $2,329 $2,346 $2,359 $2,37 3 $2,386 $2,399 $2,41 3 $8,652 $20,582
Expense Measures 51 443 1 ,1 04 1 ,468 1 ,7 7 8 1 ,7 7 9 1 ,7 81 1 ,7 82 1 ,7 87 1 ,7 95 4,844 1 3 ,7 68
Incremental Cost of Measures (262) (549) (57 0) (61 9) (543) (481 ) (482) (486) (489) (493) (2,542) (4,97 3)
Incremental Rev enues from Economic Growth – – 89 303 57 3 927 1 ,355 1 ,808 2,286 2,7 93 965 1 0,1 33
Total Est. Financing Gap after Measures ($2,580) ($3,243) ($2,860) ($4,257) ($3,120) ($2,265) ($1,767) ($1,428) ($1,591) ($760) ($16,060) ($23,871)
Memo: Debt Service as a % of:
Adjusted Revenues (Excluding Growth) 36% 29% 28% 32% 29% 28% 26% 25% 29% 24% 31% 29%
Adjusted Revenues (Including Growth) 36% 29% 27% 32% 27% 26% 23% 22% 24% 20% 30% 26%

Working Group for
the Fiscal and
Economic
Recovery
of Puerto Rico
Appendix - Illustrative Surplus/(Gap) Before
Debt Service

Working Group for
the Fiscal and
Economic
Recovery
of Puerto Rico
Illustrative Surplus/(Gap) Before Debt Service Based on the updated and extended FEGP projections previously outlined, the following presents a summary of the financing surpluses/(gaps) before debt service based on various different assumptions related to healthcare funding and economic growth, two of the critical variables impacting the projected financing gaps
In the updated FEGP projections, assuming Congress does not take action to provide Puerto Rico with a similar level of funding as it provides today, the cumulative deficit increases by an estimated $13.6 billion over the ten-year projection period, making healthcare funding one of the biggest drivers of the deficit in addition to existing debt service (and the potential for no meaningful economic growth)
The scenarios shown below assume various levels of replacements for existing ACA funding, which could be accomplished through Congressional action or by the Commonwealth drastically reducing the healthcare benefits it provides to its citizens, with the latter approach negatively impacting the Commonwealth economy and its citizens
The Obama administration has already called upon Congress to provide Puerto Rico with more equitable healthcare funding
26
Note: The cash flows above do not include certain expenses, such as banker and advisor fees, that could be owed in the event of a voluntary exchange or new capital raise. (1) FY 2016 only includes addback of debt service due after January 1, 2016, except for PRIFA Rum (inclusive of January 1, 2016 debt service withheld) and PFC (inclusive of debt service withheld since partial payment made on August 1, 2015). For all
other years, total debt service is shown.
The table below illustrates the cash flows available before debt service, assuming the loss of ACA funds and no economic growth
The cumulative financing gap over the ten-year projection period under these assumptions, even after removing debt service, is projected to be ~$1.1 billion, illustrating the need for equitable healthcare funding and the necessity of economic growth
Available Surplus/(Gap) with No Benefits of Economic Growth and No Replacement of ACA Funds ($ millions)
If the full estimated loss of ACA funds were replaced, whether by Congress or otherwise, ~$12.6 billion of cumulative surplus over the ten-year period could be realized, before current debt service (which totals ~$34.4 billion over the period, excluding $1.4 billion already paid in FY 2016)
Available Surplus/(Gap) with No Benefits of Economic Growth and Full Replacement of ACA Funds ($ millions)
T otal
2016P 2017 P 2018P 2019P 2020P 2021P 2022P 2023P 2024P 2025P 5 Yr 10 Yr
Financing Surplus/(Gap) before Growth ($2,580) ($3,243) ($2,950) ($4,560) ($3,693) ($3,191) ($3,122) ($3,236) ($3,87 7 ) ($3,553) ($17 ,025) ($34,004)
Plus: Removal of Remaining Debt Serv .(1 ) 2,7 24 3,396 3,27 2 3,861 3,463 3,412 3,17 3 3,109 3,522 3,021 16,7 16 32,953
Fin. Surplus/(Gap) (before Debt Serv. & Growth) $144 $154 $322 ($699) ($230) $220 $52 ($127 ) ($355) ($532) ($310) ($1,052)
Memo: Fin. Surplus/(Gap) as % of Adj. Rev. Without Growth 1.2% 1.3% 2.7% (5.9%) (1.9%) 1.8% 0.4% (1.0%) (2.9%) (4.3%) (0.5%) (0.9%)
Memo: Full Debt Service 4,121 3,396 3,272 3,861 3,463 3,412 3,173 3,109 3,522 3,021 18,113 34,350
T otal
2016P 2017 P 2018P 2019P 2020P 2021P 2022P 2023P 2024P 2025P 5 Yr 10 Yr
Financing Surplus/(Gap) before Growth ($2,580) ($3,243) ($2,950) ($4,560) ($3,693) ($3,191) ($3,122) ($3,236) ($3,87 7 ) ($3,553) ($17 ,025) ($34,004)
Plus: Removal of Remaining Debt Serv .(1 ) 2,7 24 3,396 3,27 2 3,861 3,463 3,412 3,17 3 3,109 3,522 3,021 16,7 16 32,953
Plus: Replacement/Renewal of ACA Funds – – 544 1,605 1,7 37 1,821 1,883 1,953 2,014 2,082 3,887 13,640
Fin. Surplus/(Gap) (Incl. ACA Loss Addback) $144 $154 $866 $906 $1,507 $2,042 $1,935 $1,826 $1,659 $1,551 $3,57 7 $12,588
Memo: Fin. Surplus/(Gap) as % of Adj. Rev. Without Growth 1.2% 1.3% 7.3% 7.6% 12.5% 16.9% 15.9% 14.9% 13.4% 12.5% 6.1% 10.5%
Memo: Full Debt Service 4,121 3,396 3,272 3,861 3,463 3,412 3,173 3,109 3,522 3,021 18,113 34,350

Working Group for
the Fiscal and
Economic
Recovery
of Puerto Rico
Illustrative Surplus Before Debt Service (cont’d)
27
(1) Assumes ramp up to projected real GDP growth for the United States by FY 2022 as estimated by the Krueger Team. (2) FY 2016 only includes addback of debt service due after January 1, 2016, except for PRIFA Rum (inclusive of January 1, 2016 debt service withheld) and PFC (inclusive of debt service withheld since partial payment made on August 1, 2015). For all
other years, total debt service is shown.
The table below summarizes the available surplus/(gap) assuming no replacement of ACA funds but various levels of real GNP growth rates beginning in FY 2018
• Real GNP stays at -1.0% for FY 2016 and FY 2017, while inflation remains at 1.1% for FY 2016 and 2.0% thereafter
Available Surplus/(Gap) Assuming Various Real GNP Growth Rates and No Replacement of ACA Funds
If the Commonwealth were to benefit from both 100% of the projected economic growth and Congress were to maintain its current level of support for the Commonwealth healthcare system, then by FY 2025 it would have nearly $4.3 billion of annual surplus before debt service
• While not enough to pay cumulative debt service over the projection period, by FY 2022 the annual surplus would be enough to cover the current contractual debt service payments for that year
This scenario, however, comes with substantial risks, as economic growth, as well as all of the measures outlined in the FEGP, would be necessary to reach the projected $4.3 billion annual surplus in FY 2025
Available Surplus with Full Benefits of Economic Growth and Full Replacement of ACA Funds ($ millions)
Financing Surplus/(Gap) before Debt Service ($ millions)
T otal
2016P 2017 P 2018P 2019P 2020P 2021P 2022P 2023P 2024P 2025P 5 Yr 10 Yr
Financing Surplus/(Gap) before Growth ($2,580) ($3,243) ($2,950) ($4,560) ($3,693) ($3,191) ($3,122) ($3,236) ($3,87 7 ) ($3,553) ($17 ,025) ($34,004)
Plus: Removal of Remaining Debt Serv .(2) 2,7 24 3,396 3,27 2 3,861 3,463 3,412 3,17 3 3,109 3,522 3,021 16,7 16 32,953
Plus: Replacement/Renewal of ACA Funds – – 544 1,605 1,7 37 1,821 1,883 1,953 2,014 2,082 3,887 13,640
Plus: Estimated Benefit of Growth – – 89 303 57 3 927 1,355 1,808 2,286 2,7 93 965 10,133
Fin. Surplus/(Gap) (Incl. ACA Loss Addback & Growth) $144 $154 $956 $1,209 $2,080 $2,968 $3,289 $3,633 $3,945 $4,343 $4,542 $22,7 21
Memo: Fin. Surplus/(Gap) as % of Adj. Rev. With Growth 1.2% 1.3% 8.0% 9.9% 16.5% 22.8% 24.3% 25.8% 26.9% 28.5% 7.7% 18.9%
Memo: Full Debt Service 4,121 3,396 3,272 3,861 3,463 3,412 3,173 3,109 3,522 3,021 18,113 34,350
Total
Real GNP Growth 2016P 2017P 2018P 2019P 2020P 2021P 2022P 2023P 2024P 2025P 5 Yr 10 Yr
(1.0%) $1 44 $1 54 $322 ($699) ($230) $220 $52 ($1 27 ) ($355) ($532) ($31 0) ($1 ,052)
0.0% 1 44 1 54 41 1 (51 7 ) 47 602 541 47 3 360 301 238 2,51 4
1.0% 1 44 1 54 530 (27 3) 423 1 ,1 24 1 ,21 8 1 ,31 2 1 ,37 0 1 ,491 97 7 7 ,493
2.0% 1 44 1 54 620 (87 ) 7 1 3 1 ,534 1 ,7 56 1 ,987 2,1 91 2,47 0 1 ,544 1 1 ,482
FEGP(1)
1 44 1 54 41 1 (396) 343 1 ,1 47 1 ,406 1 ,680 1 ,931 2,261 655 9,082
Memo: Total Debt Serv. 4,121 3,396 3,272 3,861 3,463 3,412 3,173 3,109 3,522 3,021 18,113 34,350

Working Group for
the Fiscal and
Economic
Recovery
of Puerto Rico
Appendix – Additional Projection Details
Working Group for
the Fiscal and
Economic
Recovery
of Puerto Rico
Detailed Model Projections
29
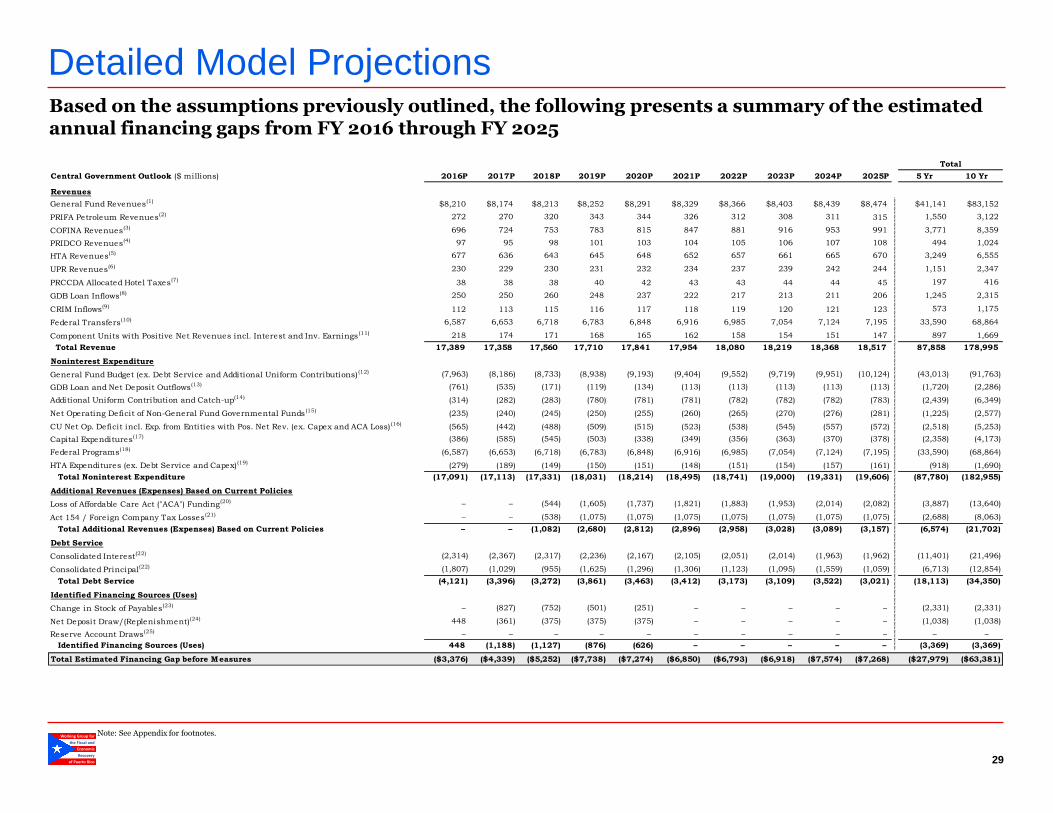
Based on the assumptions previously outlined, the following presents a summary of the estimated annual financing gaps from FY 2016 through FY 2025
Note: See Appendix for footnotes.
Total
Central Government Outlook ($ millions) 2016P 2017P 2018P 2019P 2020P 2021P 2022P 2023P 2024P 2025P 5 Yr 10 Yr
Revenues
General Fund Revenues(1) $8,210 $8,174 $8,213 $8,252 $8,291 $8,329 $8,366 $8,403 $8,439 $8,474 $41,141 $83,152
PRIFA Petroleum Revenues(2) 272 270 320 343 344 326 312 308 311 315 1,550 3,122
COFINA Revenues(3) 696 724 753 783 815 847 881 916 953 991 3,771 8,359
PRIDCO Revenues(4) 97 95 98 101 103 104 105 106 107 108 494 1,024
HTA Revenues(5) 677 636 643 645 648 652 657 661 665 670 3,249 6,555
UPR Revenues(6) 230 229 230 231 232 234 237 239 242 244 1,151 2,347
PRCCDA Allocated Hotel Taxes(7) 38 38 38 40 42 43 43 44 44 45 197 416
GDB Loan Inflows(8) 250 250 260 248 237 222 217 213 211 206 1,245 2,315
CRIM Inflows(9) 112 113 115 116 117 118 119 120 121 123 573 1,175
Federal Transfers(10) 6,587 6,653 6,718 6,783 6,848 6,916 6,985 7,054 7,124 7,195 33,590 68,864
Component Units with Positive Net Revenues incl. Interest and Inv. Earnings (11) 218 174 171 168 165 162 158 154 151 147 897 1,669
Total Revenue 17,389 17,358 17,560 17,710 17,841 17,954 18,080 18,219 18,368 18,517 87,858 178,995
Noninterest Expenditure
General Fund Budget (ex. Debt Service and Additional Uniform Contributions) (12) (7,963) (8,186) (8,733) (8,938) (9,193) (9,404) (9,552) (9,719) (9,951) (10,124) (43,013) (91,763)
GDB Loan and Net Deposit Outflows(13) (761) (535) (171) (119) (134) (113) (113) (113) (113) (113) (1,720) (2,286)
Additional Uniform Contribution and Catch-up(14) (314) (282) (283) (780) (781) (781) (782) (782) (782) (783) (2,439) (6,349)
Net Operating Deficit of Non-General Fund Governmental Funds (15) (235) (240) (245) (250) (255) (260) (265) (270) (276) (281) (1,225) (2,577)
CU Net Op. Deficit incl. Exp. from Entities with Pos. Net Rev. (ex. Capex and ACA Loss) (16) (565) (442) (488) (509) (515) (523) (538) (545) (557) (572) (2,518) (5,253)
Capital Expenditures(17) (386) (585) (545) (503) (338) (349) (356) (363) (370) (378) (2,358) (4,173)
Federal Programs(18) (6,587) (6,653) (6,718) (6,783) (6,848) (6,916) (6,985) (7,054) (7,124) (7,195) (33,590) (68,864)
HTA Expenditures (ex. Debt Service and Capex)(19) (279) (189) (149) (150) (151) (148) (151) (154) (157) (161) (918) (1,690)
Total Noninterest Expenditure (17,091) (17,113) (17,331) (18,031) (18,214) (18,495) (18,741) (19,000) (19,331) (19,606) (87,780) (182,955)
Additional Revenues (Expenses) Based on Current Policies
Loss of Affordable Care Act ("ACA") Funding(20) – – (544) (1,605) (1,737) (1,821) (1,883) (1,953) (2,014) (2,082) (3,887) (13,640)
Act 154 / Foreign Company Tax Losses(21) – – (538) (1,075) (1,075) (1,075) (1,075) (1,075) (1,075) (1,075) (2,688) (8,063)
Total Additional Revenues (Expenses) Based on Current Policies – – (1,082) (2,680) (2,812) (2,896) (2,958) (3,028) (3,089) (3,157) (6,574) (21,702)
Debt Service
Consolidated Interest(22) (2,314) (2,367) (2,317) (2,236) (2,167) (2,105) (2,051) (2,014) (1,963) (1,962) (11,401) (21,496)
Consolidated Principal(22) (1,807) (1,029) (955) (1,625) (1,296) (1,306) (1,123) (1,095) (1,559) (1,059) (6,713) (12,854)
Total Debt Service (4,121) (3,396) (3,272) (3,861) (3,463) (3,412) (3,173) (3,109) (3,522) (3,021) (18,113) (34,350)
Identified Financing Sources (Uses)
Change in Stock of Payables(23) – (827) (752) (501) (251) – – – – – (2,331) (2,331)
Net Deposit Draw/(Replenishment)(24) 448 (361) (375) (375) (375) – – – – – (1,038) (1,038)
Reserve Account Draws(25) – – – – – – – – – – – –
Identified Financing Sources (Uses) 448 (1,188) (1,127) (876) (626) – – – – – (3,369) (3,369)
Total Estimated Financing Gap before Measures ($3,376) ($4,339) ($5,252) ($7,738) ($7,274) ($6,850) ($6,793) ($6,918) ($7,574) ($7,268) ($27,979) ($63,381)

Working Group for
the Fiscal and
Economic
Recovery
of Puerto Rico
Detailed Model Projections (cont’d)
30
Note: See Appendix for footnotes.
Total
Central Government Outlook ($ millions) 2016P 2017P 2018P 2019P 2020P 2021P 2022P 2023P 2024P 2025P 5 Yr 10 Yr
Total Estimated Financing Gap before Measures ($3,376) ($4,339) ($5,252) ($7,738) ($7,274) ($6,850) ($6,793) ($6,918) ($7,574) ($7,268) ($27,979) ($63,381)
Revenue Measures(26)
Complete Transition to VAT 996 1,117 1,128 1,140 1,152 1,164 1,176 1,188 1,200 1,213 5,533 11,474
Stabilize Corporate Tax Revenue Base – – 538 1,075 1,075 1,075 1,075 1,075 1,075 1,075 2,688 8,063
Improve Tax Administration & Enforcement 10 85 103 115 119 120 122 123 124 125 432 1,046
Revenue Measures 1,006 1,202 1,768 2,329 2,346 2,359 2,373 2,386 2,399 2,413 8,652 20,582
Expense Measures(26)
Reduce Operating Costs 3 165 590 771 898 1,392 1,385 1,379 1,376 1,375 2,426 9,334
Cut Governmental Subsidies – 50 200 350 500 – – – – – 1,100 1,100
Right-Size Department of Education 12 78 135 193 249 254 259 264 269 275 666 1,987
Control Health Care Costs (4) 151 179 155 131 134 136 139 142 145 612 1,307
Reduction of General Fund Expenses Associated with the Budgetary Reserve 40 – – – – – – – – – 40 40
Expense Measures 51 443 1,104 1,468 1,778 1,779 1,781 1,782 1,787 1,795 4,844 13,768
Incremental Cost of Measures(27) (262) (549) (570) (619) (543) (481) (482) (486) (489) (493) (2,542) (4,973)
Est. Incremental Revenue from Economic Development and Structural Reforms (28) – – 89 303 573 927 1,355 1,808 2,286 2,793 965 10,133
Measures incl. Economic Growth 795 1,096 2,392 3,481 4,154 4,585 5,026 5,490 5,983 6,508 11,919 39,510
Residual Est. Financing Gap after Measures (incl. All Debt Service) ($2,580) ($3,243) ($2,860) ($4,257) ($3,120) ($2,265) ($1,767) ($1,428) ($1,591) ($760) ($16,060) ($23,871)

Working Group for
the Fiscal and
Economic
Recovery
of Puerto Rico
Detailed Model Summary Footnotes
31
1. General Fund revenues estimates were updated to reflect greater knowledge of actual collections in 2016, as detailed previously. 2. PRIFA petroleum tax receipts are consistent with the FEGP but, unlike in the original FEGP, are shown separately from GDB loan portfolio performance. 3. COFINA revenues were estimated using a SUT waterfall based that allocates monies to COFINA and then other entities, including the General Fund. The revenues shown each year correspond to the Pledged
Sales Tax Base Amount as defined in the COFINA bond documents. 4. PRIDCO revenues are consistent with the original FEGP but broken out separately. 5. HTA revenues include gas taxes, license fees, toll receipts, investments, petroleum taxes, cigarette taxes, Tren Urbano related receipts for FY2016, and other highway and operating receipts. The HTA projections
assume the Tren Urbano is transferred to PRITA in FY 2017. 6. UPR revenues in excess of appropriations broken out assuming (consistent with the FEGP) that incremental revenues are offset evenly by additional expenses. Includes inflows related to tuition, slot, gifts, and
investment income. 7. PRCCDA allocated hotel taxes are consistent with the original FEGP but broken out separately from General Fund revenues. 8. GDB loan inflows include cash flows from its loan portfolio to entities outside of the scope of the FEGP entities. Excludes deposit inflows, shown separately on a net basis with deposit outflows on the expense
side. Assumes GDB makes no new loans to entities outside of the FEGP (but disbursements related to existing loans are still made). 9. CRIM inflows are broken out separately from General Fund revenues and otherwise consistent with the original FEGP. 10. Adjusted the FEGP Federal transfers to include UPR Federal and state grants (including the Federal Pell Grant program). 11. Component unit revenues are consistent with the original FEGP but broken out to show net revenues of entities with a surplus after expenses (inclusive of investment earnings and other revenues). Also includes
State Insurance Fund contributions assuming that the SIF will continue to share profits with the General Fund as it has done so historically. 12. General Fund budget based on updated estimates of the budget from OMB. Excludes identified additional uniform contributions and debt service. Also adjusts appropriations to PBA and UPR to deduct debt
service (which is then included in the principal and interest lines shown separately, consistent with the original FEGP.) 13. GDB loan and net deposit outflows include cash flows from its loan portfolio to entities outside of the scope of the FEGP entities, including deposits on a net basis. Assumes no new loans are made to entities
outside of the FEGP (but disbursements related to existing loans are still made). 14. Calculated based on the current AUC letter and, as such, the calculated gap could change once the new AUC letter is submitted on or before March 2016. Consistent with the FEGP, reflects AUCs related to
General Fund payments to fund the retirement systems and certain catch-up payments related to unpaid AUC amounts in FY 2014 and FY 2015. Also includes component units which have not budgeted for additional uniform contributions. Excludes $58 million annually of estimated AUCs required by municipalities which, if not funded, would further deplete assets in the retirement system.
15. Represents updated estimates of “non-budgeted funds." Excludes any losses from agencies with independent treasuries, which were included in the Krueger Report, based on further diligence and the inclusion of such outflows in other lines (namely, capex).
16. Component unit deficit estimates exclude estimated capital expenditures (which are included in the capital expenditure line) and other delineated expenses and risks, such as the loss of ACA funding. Additionally removes and breaks out separately net revenues of component units with a surplus after expenses and investment earnings.
17. Capital expenditures based on GDB forecast of recommended projects not available at the time of the Krueger Report and includes maintenance capex and capex related to regulatory compliance, construction in progress, judgements, emergencies, and extraordinary maintenance and repairs. Does not include municipal capital expenditures, which have historically been largely funded by the Commonwealth via bond issuances and GDB credit facilities.
18. Evenly offsets Federal transfers (including additional UPR grants), consistent with the original FEGP. 19. HTA expenditure includes highway and Tren Urbano disbursements, excluding capital expenditures and debt service and including the payment of past-due payables. Tren Urbano related disbursements after
FY16 represent pay-down of past due payables, but not ongoing operating costs. 20. Per updated estimates based on further diligence done on ASES. 21. The currently estimated range of the impact of the loss of Act 154 is $650 million to $1,500 million. For illustrative purposes, the midpoint of this potential loss is included in the projections (with a half year
impact assumed for FY 2018). 22. Included debt service payments related to GO, GDB, PBA, PFC, COFINA, PRIFA, UPR, PRCCDA, PRIDCO, GSA, PRIFA BANs, ERS, and HTA. PRIFA BANs include actuals through December 2015 and are on
accelerated schedule with excess cash flow sweeps as estimated by GDB. 23. Accounts payable includes amounts owed to General Fund third parties, tax refunds, PRASA, PREPA, and police officer litigation. Excludes pay-downs by component units and HTA, which are embedded in the
forecasts for those entities. 24. The required legal minimum reserve fluctuates based on the amount of demand deposits. For illustrative purposes, the minimum statutory liquidity requirement is held at $350 million and the Commonwealth
will build to $1.5 billion in deposits evenly through FY 2020 beginning in FY 2017. 25. Assumes no draw on debt service reserve accounts. 26. See Fiscal and Economic Growth Plan for detail on various revenue and expense measures. 27. Incremental costs of the various measures consist of estimates of incremental capex necessary for the measures and growth, incremental pension contributions associated with the measures, cost of earned
income tax credits, investment in a new accounting system and the implementation of a new Institute of Statistics plan. 28. Represents the difference between forecasted General Fund and other revenues in a high growth scenario relative to a baseline forecast. Assumes that the Commonwealth is able to institute reforms leading to
economic growth.
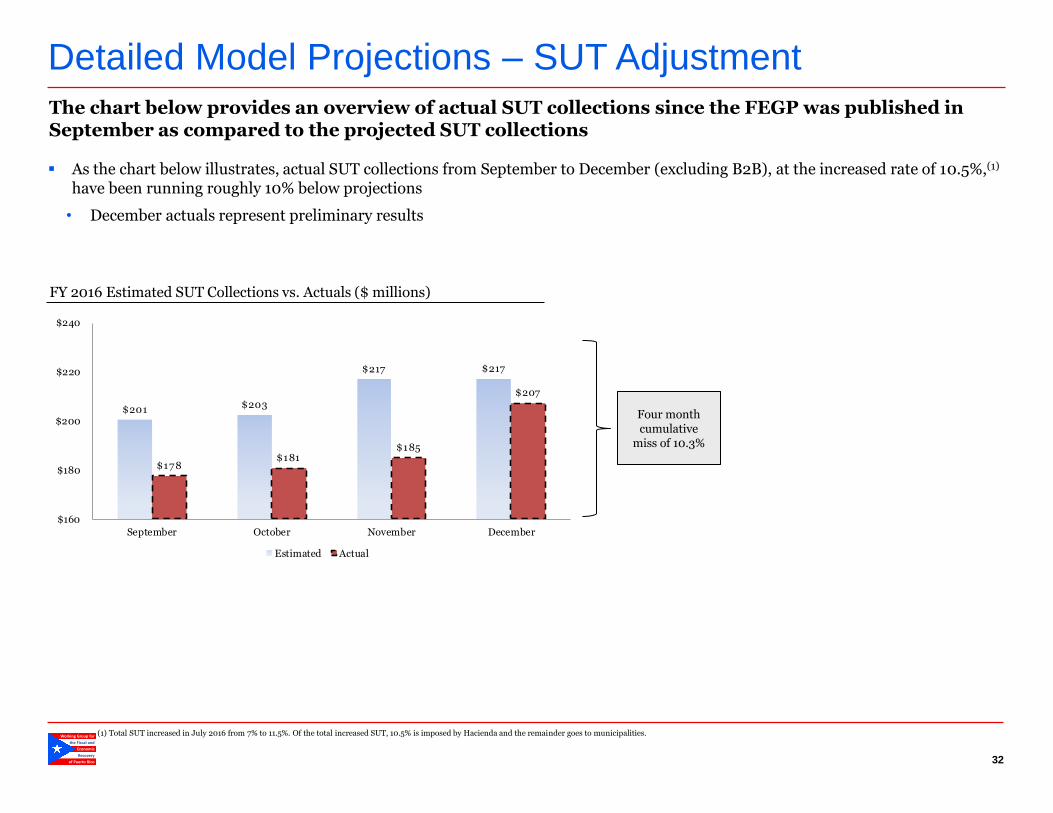
Working Group for
the Fiscal and
Economic
Recovery
of Puerto Rico
Detailed Model Projections – SUT Adjustment
32
The chart below provides an overview of actual SUT collections since the FEGP was published in September as compared to the projected SUT collections
As the chart below illustrates, actual SUT collections from September to December (excluding B2B), at the increased rate of 10.5%,(1) have been running roughly 10% below projections
• December actuals represent preliminary results
FY 2016 Estimated SUT Collections vs. Actuals ($ millions)
Four month cumulative
miss of 10.3%
(1) Total SUT increased in July 2016 from 7% to 11.5%. Of the total increased SUT, 10.5% is imposed by Hacienda and the remainder goes to municipalities.
$201 $203
$217 $217
$178$181
$185
$207
$160
$180
$200
$220
$240
September October November December
Estimated Actual

Working Group for
the Fiscal and
Economic
Recovery
of Puerto Rico
Appendix – Debt Service Detail by Issuer

Working Group for
the Fiscal and
Economic
Recovery
of Puerto Rico
Debt Service Detail by Issuer
34
Total interest and principal payments by issuer included in the updated FEGP are presented below
($ millions) 2016P 2017P 2018P 2019P 2020P 2021P 2022P 2023P 2024P 2025P
Interest
GO (1 ) $7 00 $7 57 $7 39 $7 07 $680 $658 $641 $621 $597 $57 1
GDB (2) 188 161 140 123 7 9 55 46 43 18 16
PBA (3) (4) 191 186 187 183 17 9 17 5 169 163 157 151
PFC 57 56 55 54 53 51 50 48 46 44
COFINA (5) (6) (7 ) 643 690 689 687 7 00 7 11 7 05 7 16 7 40 7 89
PRIFA (8) 84 82 80 7 7 7 5 7 2 69 65 61 57
UPR (9) 23 22 21 19 18 17 16 14 13 12
PRCCDA 19 19 18 17 17 16 15 15 14 13
PRIDCO 9 11 11 7 7 6 5 5 4 3
GSA (1 0) 1 1 1 0 0 – – – – –
PRIFA BANs (1 1 ) 12 1 – – – – – – – –
HTA (1 2) 220 215 211 193 193 17 9 17 1 165 158 151
ERS 167 167 167 167 167 167 164 159 155 154
Consolidated Interest $2,314 $2,367 $2,317 $2,236 $2,167 $2,105 $2,051 $2,014 $1,963 $1,962
Principal
GO $426 $37 1 $327 $383 $439 $334 $358 $37 8 $402 $428
GDB 87 6 269 27 7 848 432 434 143 47 541 –
PBA 86 91 66 7 0 7 4 101 106 96 103 107
PFC 36 29 30 32 33 34 36 37 39 41
COFINA (5) 38 19 48 80 99 120 159 182 194 183
PRIFA (8) 43 46 48 50 51 54 62 86 64 7 3
UPR (9) 20 21 22 23 24 25 27 28 30 31
PRCCDA 11 12 12 13 14 14 15 16 17 17
PRIDCO 17 7 7 11 11 12 13 13 14 15
GSA (1 0) 5 5 5 5 5 – – – – –
PRIFA BANs (1 1 ) 146 52 – – – – – – – –
HTA (1 2) 103 107 112 111 113 128 135 130 136 143
ERS – – – – – 50 7 0 80 19 22
Consolidated Principal $1,807 $1,029 $955 $1,625 $1,296 $1,306 $1,123 $1,095 $1,559 $1,059
Note: See Appendix for footnotes.

Working Group for
the Fiscal and
Economic
Recovery
of Puerto Rico
Debt Service Detail by Issuer (cont’d)
35
Total debt service by issuer included in the updated FEGP is presented below
($ millions) 2016P 2017P 2018P 2019P 2020P 2021P 2022P 2023P 2024P 2025P
Debt Service
GO (1 ) $1,126 $1 ,128 $1 ,066 $1 ,091 $1 ,119 $991 $999 $999 $999 $999
GDB (2) 1 ,064 430 417 97 1 512 488 189 91 559 16
PBA (3) (4) 27 7 27 7 253 253 253 27 6 27 5 259 260 258
PFC 94 86 86 86 85 85 85 85 85 85
COFINA (5) (6) (7 ) 682 7 09 7 37 7 67 7 99 831 864 899 934 97 2
PRIFA (8) 128 128 127 127 126 126 130 151 125 131
UPR (9) 43 43 43 43 43 43 43 43 43 43
PRCCDA 30 30 30 30 30 30 30 30 30 30
PRIDCO 26 18 18 18 18 18 18 18 18 18
GSA (1 0) 6 6 5 5 5 – – – – –
PRIFA BANs (1 1 ) 158 53 – – – – – – – –
HTA (1 2) 323 323 323 304 306 307 306 295 294 294
ERS 167 167 167 167 167 217 234 239 17 4 17 6
Consolidated Debt Service $4,121 $3,396 $3,27 2 $3,861 $3,463 $3,412 $3,17 3 $3,109 $3,522 $3,021
Note: See Appendix for footnotes.
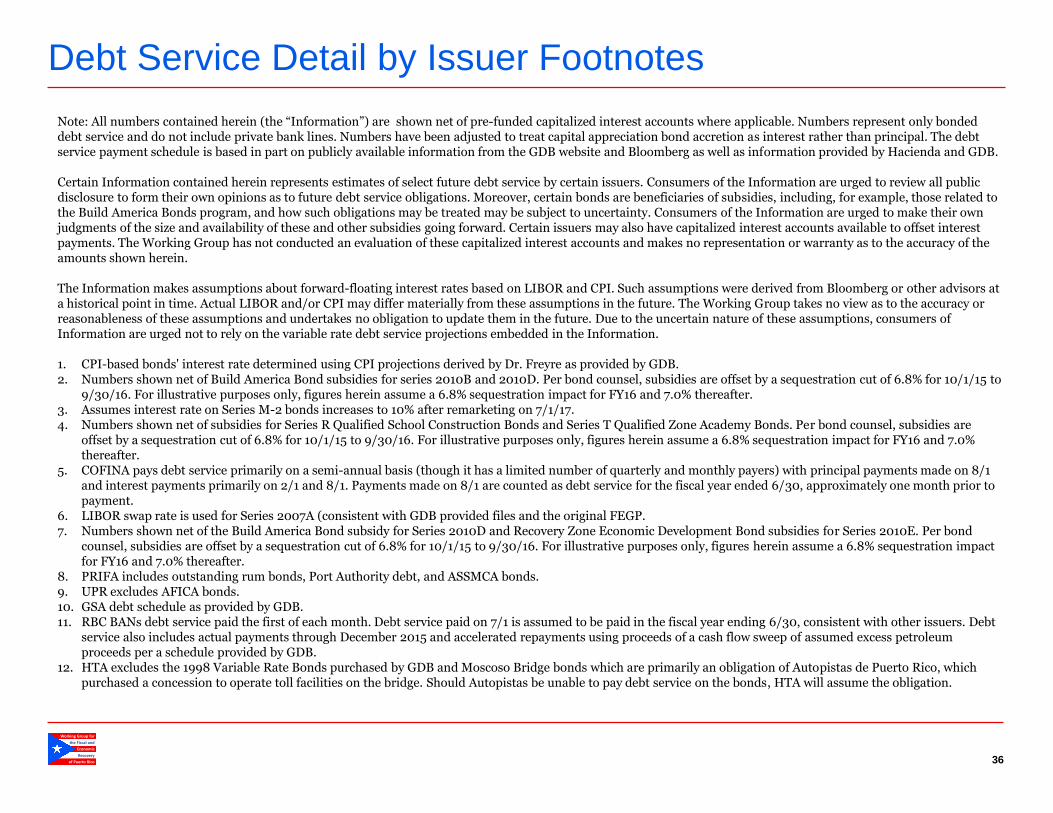
Working Group for
the Fiscal and
Economic
Recovery
of Puerto Rico
Debt Service Detail by Issuer Footnotes
36
Note: All numbers contained herein (the “Information”) are shown net of pre-funded capitalized interest accounts where applicable. Numbers represent only bonded debt service and do not include private bank lines. Numbers have been adjusted to treat capital appreciation bond accretion as interest rather than principal. The debt service payment schedule is based in part on publicly available information from the GDB website and Bloomberg as well as information provided by Hacienda and GDB. Certain Information contained herein represents estimates of select future debt service by certain issuers. Consumers of the Information are urged to review all public disclosure to form their own opinions as to future debt service obligations. Moreover, certain bonds are beneficiaries of subsidies, including, for example, those related to the Build America Bonds program, and how such obligations may be treated may be subject to uncertainty. Consumers of the Information are urged to make their own judgments of the size and availability of these and other subsidies going forward. Certain issuers may also have capitalized interest accounts available to offset interest payments. The Working Group has not conducted an evaluation of these capitalized interest accounts and makes no representation or warranty as to the accuracy of the amounts shown herein. The Information makes assumptions about forward-floating interest rates based on LIBOR and CPI. Such assumptions were derived from Bloomberg or other advisors at a historical point in time. Actual LIBOR and/or CPI may differ materially from these assumptions in the future. The Working Group takes no view as to the accuracy or reasonableness of these assumptions and undertakes no obligation to update them in the future. Due to the uncertain nature of these assumptions, consumers of Information are urged not to rely on the variable rate debt service projections embedded in the Information. 1. CPI-based bonds' interest rate determined using CPI projections derived by Dr. Freyre as provided by GDB. 2. Numbers shown net of Build America Bond subsidies for series 2010B and 2010D. Per bond counsel, subsidies are offset by a sequestration cut of 6.8% for 10/1/15 to
9/30/16. For illustrative purposes only, figures herein assume a 6.8% sequestration impact for FY16 and 7.0% thereafter. 3. Assumes interest rate on Series M-2 bonds increases to 10% after remarketing on 7/1/17. 4. Numbers shown net of subsidies for Series R Qualified School Construction Bonds and Series T Qualified Zone Academy Bonds. Per bond counsel, subsidies are
offset by a sequestration cut of 6.8% for 10/1/15 to 9/30/16. For illustrative purposes only, figures herein assume a 6.8% sequestration impact for FY16 and 7.0% thereafter.
5. COFINA pays debt service primarily on a semi-annual basis (though it has a limited number of quarterly and monthly payers) with principal payments made on 8/1 and interest payments primarily on 2/1 and 8/1. Payments made on 8/1 are counted as debt service for the fiscal year ended 6/30, approximately one month prior to payment.
6. LIBOR swap rate is used for Series 2007A (consistent with GDB provided files and the original FEGP. 7. Numbers shown net of the Build America Bond subsidy for Series 2010D and Recovery Zone Economic Development Bond subsidies for Series 2010E. Per bond
counsel, subsidies are offset by a sequestration cut of 6.8% for 10/1/15 to 9/30/16. For illustrative purposes only, figures herein assume a 6.8% sequestration impact for FY16 and 7.0% thereafter.
8. PRIFA includes outstanding rum bonds, Port Authority debt, and ASSMCA bonds. 9. UPR excludes AFICA bonds. 10. GSA debt schedule as provided by GDB. 11. RBC BANs debt service paid the first of each month. Debt service paid on 7/1 is assumed to be paid in the fiscal year ending 6/30, consistent with other issuers. Debt
service also includes actual payments through December 2015 and accelerated repayments using proceeds of a cash flow sweep of assumed excess petroleum proceeds per a schedule provided by GDB.
12. HTA excludes the 1998 Variable Rate Bonds purchased by GDB and Moscoso Bridge bonds which are primarily an obligation of Autopistas de Puerto Rico, which purchased a concession to operate toll facilities on the bridge. Should Autopistas be unable to pay debt service on the bonds, HTA will assume the obligation.


