38
Working Paper 111/11 FINANCIAL LITERACY AND PENSION PLAN PARTICIPATION IN ITALY Elsa Fornero Chiara Monticone
Working Paper 111/11
FINANCIAL LITERACY AND PENSION PLAN PARTICIPATION IN ITALY
Elsa Fornero
Chiara Monticone

1
Financial Literacy and Pension Plan Participation in Italy∗
Elsa Fornero♠ Chiara Monticone♦ By requiring individuals to decide whether to participate in (newly established) pension funds, how much to contribute and how to invest their retirement wealth, pension reforms have raised concerns about the ability of households to deal with financial decisions. Using the Bank of Italy's Survey on Household Income and Wealth, our empirical analysis shows that most individuals lack knowledge of basic concepts such as interest rates and inflation. Males, the more educated and residents in the Centre-North possess higher literacy. As for the effects, financial literacy has a positive and significant impact on the probability of pension plan participation. Keywords: Financial literacy, retirement planning, pension plan participation. JEL classification: D91
1 Introduction
Since the early '90s the Italian pension system has gone through a long reform process
aimed at improving its long-term sustainability and redressing its main distortions. The reform also
increased, particularly for younger generations, individual responsibility in the accumulation of
retirement wealth.
Two main features characterize the reform. The first consists in the shift of the PAYG
system from a Defined Benefit (DB) to a Defined Contribution (DC) formula. The latter determines
benefits according to “actuarial equivalence” – i.e. to the (capitalized worth of) payroll taxes
contributed during the entire working career and to the worker's retirement age - and entails, on
average, much lower and more uncertain replacements ratios with respect to past and current
benefits, determined on the basis of (an average of) the last earnings. The second feature consists in
a greater role for pension funds as a way to restore an adequate level of future pensions.
Participation to (privately managed) pension plans is voluntary but encouraged through
fiscal incentives and suitable design of default options; workers have to decide both how much to ∗ We thank Annamaria Lusardi, Tullio Jappelli, Luigi Guiso, Giovanni Mastrobuoni, Tabea Bucher-Koenen, participants to the “Financial Literacy around the World” conference in Turin, Italy (December 2010) and participants in the “Mathematical and Statistical Methods for Actuarial Sciences and Finance” conference in Ravello, Italy (April 2010) for helpful comments. Financial support from Netspar is gratefully acknowledged. ♠ University of Torino – CeRP-Collegio Carlo Alberto. ♦ University of Torino – CeRP-Collegio Carlo Alberto – Netspar. e-mail: [email protected]
2
contribute and how to allocate their pension wealth, which in turn require greater financial
sophistication in both savings and investment management.
This new situation happens at a time when technological progress, financial innovations and
increasing markets integration are making financial products more complex. And prompts questions
about households’ preparedness, the level of their financial knowledge, their ability to deal with
financial decisions, and the impact of ignorance on savings. Several institutions (e.g. the Bank of
Italy, the Authority for the Italian securities market (Consob), the Supervising Authority on Pension
Funds (Covip), etc.) expressed their concerns about the ability of citizens to face the current
challenges and initiatives have been promoted to address the issue of financial illiteracy, in terms of
both regulation and financial education (Banca d'Italia 2009; Banca d'Italia et al. 2010).
Our paper measures the current level and the distribution of financial literacy among the
Italian population, investigates its determinants and its effects on retirement planning behaviour.
Specifically, we examine whether financial literacy matters in the decision to join a pension plan.
The empirical analysis draws on the 2006 and 2008 waves of the Bank of Italy Survey on
Household Income and Wealth (SHIW).
The results show that most individuals lack knowledge of basic financial concepts, and that
they seem more familiar with inflation and stocks than with interest compounding. The distribution
of financial literacy among the population presents features similar to other countries’ records
(Lusardi and Mitchell 2006, 2007; Australia and New Zealand Banking Group 2008; Bernheim
1998; van Rooij et al. 2011), with women and individuals with low education having the worst
performance. A specific Italian feature is the regional divide between the North-Center and the
South, which is confirmed in relation to financial literacy. As for retirement planning, financial
literacy positively and significantly increases the probability of participating in a pension fund.
Robustness checks confirm that financial literacy increases the probability of: i) participation even
after controlling for financial literacy endogeneity; ii) a positive response to the change in the
default that occurred in 2007 as for diverting the Trattamento di Fine Rapporto (TFR) flows to a
pension fund (at least for those who explicitly chose to do so).
The rest of the paper is organized as follows. Section 2 describes the SHIW data. Section 3
reports the empirical evidence, in terms of how literate Italians are, which population sub-groups
know the least and the effects of financial literacy on saving for retirement through pension plan
participation. Section 4 concludes.
2 The data
Every two years, through the Survey on Household Income and Wealth (SHIW), the Bank
3
of Italy collects detailed data on household demographics, consumption, income, and wealth for a
representative sample of the Italian population. In 2006 the survey covered 7,768 households
(sampling units) and 19,551 individuals; in 2008 the survey covered 7,977 households and 19,907
individuals.1 The average age of household heads is about 57; 37% are females; 64% are married;
32% completed high school and only about 9% have a university degree (or more). The average
household is composed of 2.5 people. Median (net) household income is about euro 26,000 in both
years and 70% of households own their house, in line with aggregate data. 10% of the household
heads were already retired at the time of interview, 35% were working as employees and 10% were
self-employed.
In the 2006 wave, in addition to the standard questionnaire, about half of the sample (3,992
households whose head was born on an even year) was given an extra module on financial literacy,
answered by the individual identified as the household head (i.e. “the person primarily responsible
for the household budget”). Even though the survey has a quite long longitudinal component,
financial literacy questions were included in the 2006 SHIW for the first time, which excludes any
impact of the survey structure on respondents' sensitivity to the topic. In the subsequent 2008 wave,
a financial literacy module was again part of the survey, including new tests along with some of the
2006 ones.
The interviews for the 2006 survey were conducted, by a specialised company, between
March and October 2007; those for the 2008 wave in the period January-September 2009.2 Data are
mainly collected personally with the aid of computers, using the Computer-Assisted Personal
Interviewing program (CAPI). This is adopted for the vast majority of the interviews (about 79% in
both 2006 and 2008). The remaining interviews are conducted using paper-based questionnaires
(PAPI, Paper-And-pencil Personal Interviewing), which the survey company subsequently transfers
to a computer using the CAPI program as the input screen (Banca d'Italia 2010). Even though these
methodologies should be more effective in allowing the respondents to understand and think about
the financial literacy questions with respect to telephone interviews, respondents are not shown
cards with the questions, so they do not read them. Individuals do not get incentives to answer.
1 Descriptive statistics about both samples are displayed in Table A1 in the appendix, showing that the sample distribution across the main socio-demographic characteristics is very similar in the two waves. 2 Note that about 10-15% of the 2006 sample was interviewed after the outbreak of the financial crisis (August-September 2007). We chose two dates marking important events related to the crisis (August 9, 2007: main BCE and Fed operations, stock market fall; and September 14, 2007: run to Northern Rock) and checked whether individuals interviewed on or after these dates were more knowledgeable as a result of having being exposed to financial news and topics in the public debate. Since results show that those interviewed after the crisis know the same (or less) than those interviewed before, we neglect the issue of the interview date in the rest of the analysis.

4
3 Empirical evidence
3.1 How financially literate are individuals in Italy?
3.1.1 Measurement
For the sake of comparison, we will exploit only three out of the six financial literacy tests
included in the 2006 SHIW survey, choosing the most similar to the ones devised for the Health and
Retirement Study (HRS) by Annamaria Lusardi and Olivia Mitchell (Lusardi and Mitchell, 2006).
While the two questions on inflation and interest compounding use almost the same wording as the
corresponding questions in the HRS, the 2006 SHIW does not contain a question on risk
diversification, as stated in the HRS (i.e., based on the choice between individual stocks and a stock
mutual fund). In this study, the question about risk was replaced with another one capturing stock
market knowledge (question iii). The precise wording of the three tests is reported below.
i. Interest: Imagine leaving €1,000 in a current account that pays 2% annual interest and
has no charges. What sum do you think will be available at the end of 2 years? Less than
1,020 euros | Exactly 1,020 euros | More than 1,020 euros | Don't know
ii. Inflation: Imagine leaving 1,000 euros in a current account that pays 1% interest and has
no charges. Imagine also that inflation is running at 2%. Do you think that if you
withdraw the money in a year's time you will be able to buy the same amount of goods
as if you spent the 1,000 euros today? Yes | No, I will be able to buy less | No, I will be
able to buy more | Don't know
iii. Stocks: Imagine you have only equity funds and stock market prices fall. Are you...?
(Read aloud) Better off | Worse off | As well off as before | Don't know
The 2008 does not contain exactly the same set of questions as in 2006, but allows to
recover a test on risk diversification that is very similar to the HRS one (question ii), that was
missing in the previous survey. The three tests are again reported below.
i. Inflation: same as in the 2006 survey
ii. Risk HRS: Which of the following investment strategies do you think entails the greatest
risk of losing your capital? Investing in the shares of a single company | Investing in the
shares of more than one company | Don't know
iii. Risk 2: A company can be financed by issuing either shares (equity securities) or bonds
(debt securities). Which do you think is most risky for the investor? Shares | Bonds |
They are equally risky | I don't know the difference between shares and bonds | Don't
know

5
Note that “Don't know” (DK) is always a response option. This means the respondents are
not forced to give a (random) answer and should therefore minimize guessing. Among the coded
answers there is no explicit category for “refusals”. Since only two observations in the 2006 wave
(out of 3,992) report missing answers for the financial literacy task, these can be interpreted as
refusals and we thus drop the corresponding households from the analysis. There are no missing
values/refusals to the financial literacy tests in the 2008 survey.
3.1.2 Descriptive statistics
Table 1 present the ‘raw’ answers to the tests. Panel A of Table 1 reports the answers to the
interest compounding question, showing that 40% gives a correct answer, while about 28% does not
know. Among those giving a wrong answer (32%), 25% answers “exactly €102” which represents a
relatively less serious mistake than “less than €102” (7%). The answers to the inflation tests are
shown in Panel B, where almost 60% gives the correct answer, 30% does not know and few provide
an incorrect answer (10%). Finally, in the question about stocks slightly more than half sample
(52%) gives the correct answer (Panel C). Overall, about one fourth of the 2006 sample gives three
correct answers, one fourth gives no correct answer, and almost one fifth does not know the answer
to all the tests (Panel D). Comparing the answers on the three tests, Italians seem more familiar with
inflation and stocks than with interest compounding. This may be related, among other factors, to
the personal memory of an inflationary environment, as a large share of the sample experienced
relatively high inflation during their prime age (in the ‘70s and ‘80s). On the contrary, knowledge of
the stock market is more unexpected, given that households’ propensity to hold risky financial
assets is quite low: as of 2008 only 9.2% of households held government securities, 6.1% held
shares (directly), and 19.2% held risky assets, including private bonds, stocks, funds, etc. (Banca
d’Italia 2010).
[Table 1 here]
The only test that is included in both the 2006 and 2008 waves is the one about inflation. By
comparing Panel B in Table 1 and Panel A in Table 2, it is possible to see that the share of correct
answers increased and the DK decreased over time, although remaining still quite high. This
“learning effect” does not seem to be not related to a “measurement effect” (i.e. respondents learned
because they were tested) but could be attributed to media exposure during the financial crisis. By
comparing – among the 2008 respondents who were interviewed also in 2006 – the two sub-
samples of those who were (randomly) chosen for the financial literacy tests in 2006 and those who
were not (and thus received the FL module in 2008 for the first time), we check that the answers to
the inflation test are not statistically different between the two groups (not reported).
6
As for the remaining questions in the 2008 survey, about 45% of the whole sample can
correctly indicate that holding shares of a single company exposes to a higher risk of losses than
holding shares of several companies (Panel B). Moreover, 34% correctly indicates that shares are
riskier as an investment than (private) bonds (7%), while almost 13% declares that they do not
know the difference and an additional 18% does not know the answer at all (Panel C). About 26%
indicates that bonds and stocks are equally risky, possibly because they are aware that corporate
bonds are usually riskier than government bonds. Observing Tables 1 and 2, it is noticeable that the
share of DK is very high (around 30% of the 2006 sample on average; between 19% and 28% in the
2008 one), which mirrors the extremely low refusal rate.
[Table 2 here]
Again, these results are consistent with a low stock market participation rate and scarce
familiarity with risky assets. Moreover, the topics covered by these five questions are not taught in
standard school programs in lower secondary schools and only in some types of high schools, so
respondents can hardly rely upon previous knowledge acquired in school.
3.2 Who knows the least?
Tables 3 and 4 show financial literacy performance by socio-demographic characteristics in
the 2006 and 2008 samples respectively. The financial literacy age profile is hump-shaped, with a
peak in performance in the age class 36-50 (note, however, that in the 2008 sample the performance
of the age groups 36-50 and 51-65 is hardly significantly different). As expected, the age classes
with the highest share of correct answers also report the lowest proportion of DK. This pattern is the
same across all questions. Men are more knowledgeable than women in all questions and in both
waves, and the difference is always statistically significant at 1% level. As in other countries,
women have also a very high proportion of DK. On the one hand, the fact that all respondents are
household heads should reduce gender differences, because this sample is relatively more
homogeneous than a sample of the general population. On the other hand, the gender gap can have
to do with age and marital status, as a large share of female respondents are elderly widows (38% in
both waves, while widowers are only about 5% among male respondents). Financial literacy is
strongly monotonically increasing with the level of education. This is true when looking at both
correct and DK answers. For instance, in the 2008 SHIW only 12% of those with at most primary
education (representing 26% of households heads) could answer all three questions correctly,
compared to 47% among those with a university degree.
The self-employed (including small business owners, owners or members of a family
business, and members of ‘liberal professions’ such as lawyers, architects, and so forth) display

7
better knowledge than employees, as they are wealthier and more used to managing their
personal/business finances (however, in the 2006 sample the difference in financial literacy between
employees and self-employed is almost never statistically significant, while it is always significant
in the 2008 sample, probably due to the higher sample size). The fact that employees perform better
than the retired might hide age effects and declining cognitive abilities. The non-employed
(including the unemployed, homemakers, students and so on) have the lowest performance in all
measures.
[Tables 3 and 4 about here]
Housing tenure is also related to financial literacy (not reported). Homeownership rate in
Italy is very high (around 71% according to the 2001 census, Istat 2004, and 70% in the SHIW
sample used for this analysis), and housing equity constitutes – not considering social security
wealth – the largest fraction of households' wealth. Homeowners display higher financial literacy
than renters, consistently with the fact that financial knowledge is usually associated with higher
household wealth (van Rooji et al. 2008). Moreover, among homeowners, households currently
paying a mortgage demonstrate higher knowledge than those who do not, which suggests that
contracting housing debts constitutes a learning opportunity.3
3.2.1 Regional disparities
A peculiarity of Italy is the stark disparity between northern and southern regions as
captured by important economic and social indicators, such as employment rates, per capita income
and average education. Financial literacy is no exception.
Figures 1 and 2 depict the financial literacy distribution across Italian regions according to
the 2006 and 2008 tests respectively. Figures in the left panel report the ‘raw’ distribution of
financial literacy (number of correct answers and proportion of three correct answers) as measured
by the SHIW. The four categories represent quartiles of each variable. As expected, the usual
North-South disparity emerges: broadly speaking, households living in southern regions (and isles,
i.e. Sicily and Sardinia) tend to perform worse in all questions than those living in the Centre and in
the North-east. However, there is some variation across regions beyond the simple north-south
divide: for instance, in 2008 north-western regions fall in the lowest literacy quartile for both
measures.
Figures on the right panel, instead, show the level of financial literacy that is predicted by an
3 The category of households not paying a mortgage at the time of interview includes both those who already repaid in the past and those who never took out a mortgage. This may bias the results, reducing the difference in financial literacy between owners with and without a mortgage; thus the effect of mortgages is likely to be even larger.
8
econometric model with demographics and regional dummies as explanatory variables.4 As before,
the four categories represent quartiles of the corresponding variable. These figures suggest that the
regional gap is not simply explained by a different population composition; even after controlling
for socio-demographic characteristics (including household income), southern regions have lower
financial literacy.
[Figures 1 and 2 here]
3.3 Does financial literacy matter?
Recent literature has shown that financial literacy is associated with a wide range of
financial decisions, such as stock market participation, portfolio diversification, and the tendency to
avoid over-indebtedness (Guiso and Jappelli 2008; Kimball and Shumway 2007; Lusardi and
Tufano 2008; van Rooij et al. 2011). Moreover, Lusardi and Mitchell (2007) have shown that
financial literacy is positively related to planning for retirement and that planners have significantly
higher wealth at retirement than non-planners (where planning affects accumulation, and not vice
versa). This evidence is corroborated by other studies pointing out the role of the propensity to plan
for wealth accumulation (Ameriks at al. 2003), and documenting a positive and significant effect of
financial literacy on the net worth of Dutch households (van Rooij et al. 2008).
An aspect of planning and saving for retirement that deserves attention is pension plan
participation. For instance, Agnew et al. (2007) study pension plan participation in the US, finding
that in voluntary enrolment 401(k) plans, the effect of financial literacy on saving is substantial, and
that under automatic enrolment, low levels of literacy are strongly linked to employees' decision to
quit their employer's savings plan.
In this section we investigate the role of financial literacy on pension plan participation in
Italy, an issue which the large cuts in public pension benefits due to pension reforms has brought to
the forefront.
Despite a rather generous tax treatment, participation in pension funds is still quite low
(Covip 2008). This has certainly to do with high mandatory payroll tax rates (33% for employees;
20% for self-employed), generous pension benefits and a general mistrust towards financial markets
(Castellino and Fornero 2001, 2008).
4 When the dependent variable is the number of correct answers a linear model is estimated by OLS, while when the dependent variable is a dummy for giving three correct answers a probit model is used. Covariates include age and age squared, gender, years of education, marital status, number of children in the household, household total net income, a dummy for self-employment, a dummy for home-ownership, and regional dummies. The inclusion of interactions terms between regional dummies and age, years of education and income does not change the results. The cut-off points for the four categories displayed in the maps are based on the quartiles of each variable.

9
To counteract a rather disappointing performance, in 2007 a new reform of the system of
severance payments (Trattamento di Fine Rapporto, TFR) was introduced, aimed at encouraging a
higher take-up. The TFR consists in a fraction of the worker's wage (approximately equal to one
month's pay) that is retained as a book reserve by the employer, and paid back to the worker upon
leaving the firm, whether voluntarily or not. The annual flows are compounded by using a return
rate established by the law and partially indexed to inflation.5 The reform allowed employees to
choose, in the period January-June 2007 whether to maintain their future flows of TFR within the
firm or divert them to a pension fund, to be invested in the financial market.6
Moreover, the reform introduced a default option. For new entrants the choice has to be
made within six months from hiring, and in case no choice is expressed within this time period,
participation in the pension fund is considered the default option and the TFR flows are
automatically transferred to an occupational fund (chosen according to specific and rather complex
rules).
Participation rates increased after the reform, but not as much as expected. Apart from a
possibly inadequate communication campaign, the irreversibility of the choice was one of the
elements that most likely reduced the effectiveness of the reform: a worker keeping her TFR within
the firm can at any time opt for a pension fund, but when she does so she cannot reverse her choice.
Pension plan participants were about 3.2 millions (of which 2.1 private sector employees) in 2006
and grew to 4.8 in 2008 (3.6 private sector employees). This implies that the participation rate over
the total employed population went approximately from 14% in 2006 to 21% in 2008.7 An
increasing participation rate emerges also from the SHIW data, where participation rates among all
workers are about 11% and 13.5%, in the 2006 and 2008 samples respectively. Given the relevance
of private pensions take-up in Italy, the rest of the paper is devoted to examine the relation between
financial literacy and pension plan participation, as an important example of the effects of literacy
5 The TFR is capitalized annually at 1.5% plus 3/4 of the inflation rate measured by the Italian Statistics Institute (Istat). 6 The reform treated differently workers in firms with more ore less than 50 employees. While small-firm employees faced the choice between leaving their future TFR flows with the firm or transferring them to a pension fund, employees in larger firms could opt for a pension fund or for having their TFR administered by the National Institute for Social Security (INPS), instead of their firm, at the same conditions as if it remained at the firm’s disposal. This difference in treatment induced different participation rates in the two groups, with small firms’ employees being more likely to leave their TFR in the firm and large firms’ employees being more willing to transfer them to a pension scheme. Several reasons may account for this different behaviour, including mistrust towards financial institutions and INPS (Boeri and Zingales 2008) and fears of negatively affecting one’s firm source of financing (and therefore one’s own future employment prospects) (Corsini et al. 2010). 7 Own computations based on administrative data from the Authority for Pension Funds Supervision (Commissione di Vigilanza sui Fondi Pensione, Covip). See for reference Covip (2008, 2009, 2010) and Istat (2010).

10
on retirement planning.8
3.3.1 Pension plan participation
To investigates the effect of financial literacy on pension plan participation we use both pre-
reform and post-reform data from the 2006 and 2008 SHIW. The analysis is restricted to the sample
of employees and self-employed aged 25-65, excluding the unemployed and other respondents out
of the labor force (retirees, students, homemakers, etc.). Simple univariate statistics reported in
Tables 5 and 6 show that financial literacy is higher for respondents with a supplementary pension
than for those without, and the difference between the two groups is highly statically significant for
most measures and in both samples.
[Tables 5 and 6 here]
A multivariate analysis of the impact of financial literacy on pension plan participation is
conducted estimating a linear probability model by ordinary least squares (OLS) of the following
specification
P = X1 β1 + FLγ + u1 (1)
where P takes the value of one if the respondent (household head) participates in a private
pension scheme at the time of interview. Financial literacy FL is measured in two ways: first, we
use a dummy that takes the value of one when the respondent is able to answer all three questions
correctly; second, we use a variable counting the number of correct answers to the three questions
(taking values from 0 to 3). X1 is a vector of covariates, including a second-order polynomial in age,
a gender dummy for females, four dummies indicating the highest level of education attained by the
respondent, marital status dummies, the number of children living in the household, household
income quartiles dummies, a dummy taking the value of one for home-owners (as a proxy for
household wealth), a dummy for being self-employed, and regional dummies.
Table 7 reports the OLS estimation results for 2006. The first and third columns show that
giving an additional correct answer raises the participation probability by 2 percentage points, while
being able to answer all three questions correctly increases the chances of participation by 3
percentage points (but its effect is significant only at 10% level). Moreover, participation is
associated with being male and the age profile is slightly concave. Higher income is positively
associated with the probability of having a pension plan, while home-ownership and self-
employment have no effect.
[Table 7 here]
8 Unfortunately, explicit information on planning behavior is not available in the SHIW, except as far as pension plan participation is concerned.
11
In a separate regression (not reported) we use different measures of financial literacy,
including dummies for answering correctly one question (each test included separately), dummies
for answering correctly two questions (each couple separately), the number of DK and a dummy for
answering at least one DK. All these measures have a significant effect, except the dummy on
inflation. The dummy for answering correctly the interest question seems to be the most effective (it
increases the probability of participation by 4.9 percentage points).
Some other factors might affect the propensity to join a pension plan, such as risk
preferences, and expectations about longevity, retirement age and public pension system
replacement rate (Guiso et al. 2009). In a separate regression (not reported) we add a dummy for
being very risk tolerant, the expected replacement rate and the expected retirement age elicited by
the SHIW. Moreover, since the SHIW does not report subjective estimates of life expectancy, we
add two dummy variables indicating whether the respondent's parents are alive, and their
interactions with parents' age, as proxies for longevity. According to the life cycle model,
individuals expecting to live longer should be more likely to retire later, or to save more for
retirement, or a combination of the two. Risk tolerant individuals show a higher probability of
having a pension plan, while those expecting to retire later are less likely to do so. The expected
replacement rate and proxies for longevity have no effect. After controlling for these additional
variables, the effect of financial literacy measured by the number of correct answer is substantially
unchanged, while the dummy for three correct answers becomes not significant.
As a second step, we allow for the possibility that financial literacy is endogenously
determined. Jappelli and Padula (2011) illustrate theoretically the endogeneity of financial literacy
with respect to saving decisions, showing how literacy and wealth are accumulated jointly. In our
case, financial literacy endogeneity may derive from experience (i.e. experience of opening and
managing one's plan), from individuals' effort to learn to better manage their investments, or from
an unobserved factor simultaneously driving both the decision to join a pension plan and that of
acquiring better financial knowledge (e.g. an unobserved taste for financial issues). Moreover,
financial literacy is difficult to measure and it is likely to be measured with error, possibly leading
to a downward bias in the OLS estimate of the financial literacy.
Building on (1) we estimate the following linear probability model using the generalized
method of moments (GMM), controlling for the (possible) endogeneity of financial literacy:
P = X1 β1 + FLγ + u1 (2)
FL = X1 β1 + X2 β2 + v2

12
where X1 is a vector of controls as before and X2 is a vector of financial literacy instruments.
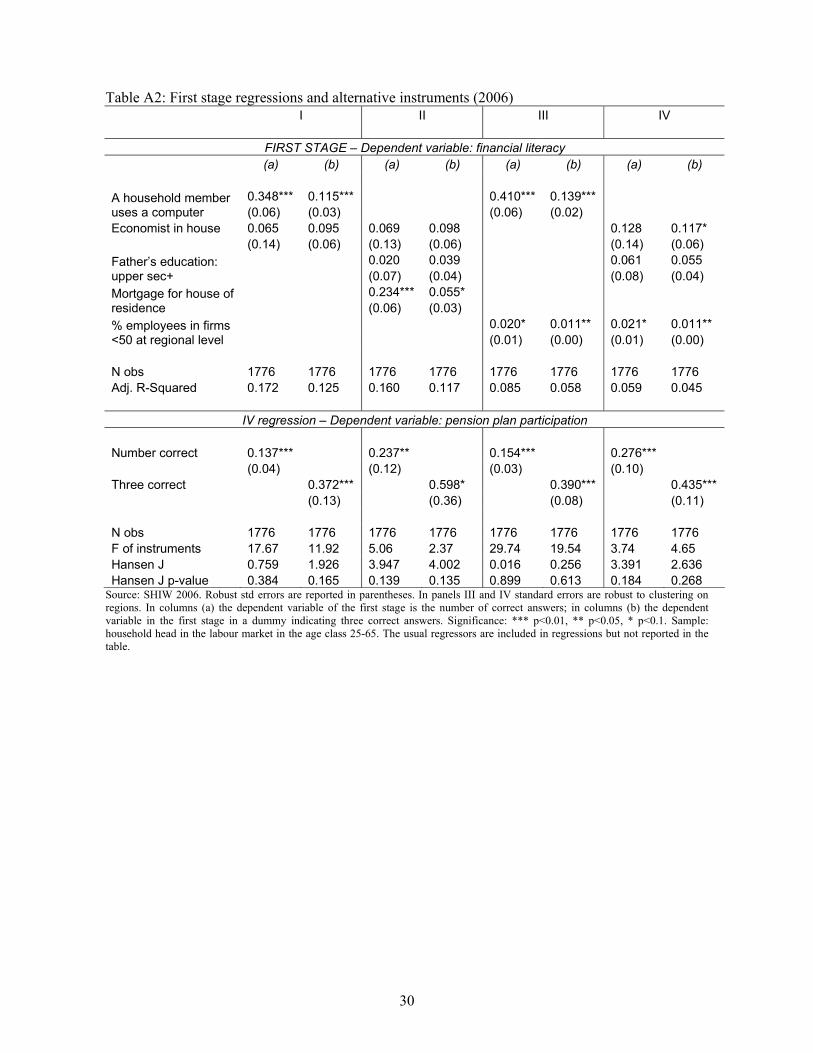
Despite the great difficulty in finding valid instruments for financial literacy, we propose
two variables related to the cost of learning and acquiring financial knowledge and information. 9
The instruments for financial literacy include a dummy taking the value of one if (at least) one
household member has a degree in economics,10 and a dummy taking the value of one if (at least)
one household member uses a computer (either at home, at work or elsewhere). The validity of
these instruments rests on the hypothesis that the presence of an economist and/or a computer user
in the household makes it easier for the respondent to acquire knowledge and information about
financial investments, while not being determined by respondents’ decision to join a pension fund.
This is supported by the results of the Hansen’s test, that do not reject the null of instruments
validity (p-value 0.384 and 0.165 for the two financial literacy measures). Moreover, the F test is
relatively high (> 10), suggesting that instruments are not weak. First stage estimates are reported in
column I of Table A2 in the appendix. Table 7 (second and fourth columns) reports the GMM
estimation results for 2006. Giving an additional correct answer raises the participation probability
by 13 percentage points.
In spite of the tests, it may be hard to argue that these instruments are completely
exogenous. For instance, the presence of an economics graduate may correlate with an unobserved
taste for economics/finance within the household, or it may affect pension plan participation
directly, and not though financial literacy. To support the robustness of our IV results, we report in
Table A2 (columns II to IV) in the appendix the estimates obtained using other sets of instruments.
These alternative instruments may provide a more exogenous variation in literacy, but tend to be
weaker. Nevertheless the IV financial literacy coefficients are quite robust. These instruments
include a dummy taking value one if the father of the respondent attained at least upper secondary
education (high school), a dummy indicating whether the family is re-paying a mortgage to buy or
restructure its house of residence (at the time of interview), and the share of employees working in
small firms (up to 50 employees) at regional level (Istat 2002). Parents’ education can be
transmitted to children’s education and affect their financial literacy (Lusardi, Mitchell and Curto
2010). As for the mortgage dummy, in section 3.2 we noted that mortgagers have higher financial
literacy, probably because taking out a mortgage offers an opportunity for learning about interest 9 Given the difficulty in finding valid instruments for financial literacy, several potential instruments were turned down because they either were not correlated with financial literacy, or they violated the hypothesis of instruments validity (Hansen’s test). These include education related variables at the regional level (e.g. college graduates), readership of financial newspapers at regional level, various measures of adult literacy at regional level in 2005 from the “Adult literacy and life skills” survey conducted by the OECD, and numeracy level in the 50+ population at regional level from the SHARE survey. 10 Results are unchanged if we substitute the economics graduate dummy with a dummy for having a graduate in economics, politics or law (degrees in politics and law in Italy include at least one course in economics).

13
rates and inflation. Moreover, mortgages are typically taken out before pension plans. Finally, the
share of employees working in small firms within each region captures regional differences in
entrepreneurship, and Tables 3 and 4 suggest that the self-employed have higher financial literacy
(analogous results are obtained with the share of employees in small-medium firms). Overall, the
results obtained by using (various combinations of) these instruments suggest that financial literacy
increases the probability of pension plan participation also when controlling for its potential
endogeneity.
As a robustness check to the previous analysis, the relations in (1) and (2) are estimated
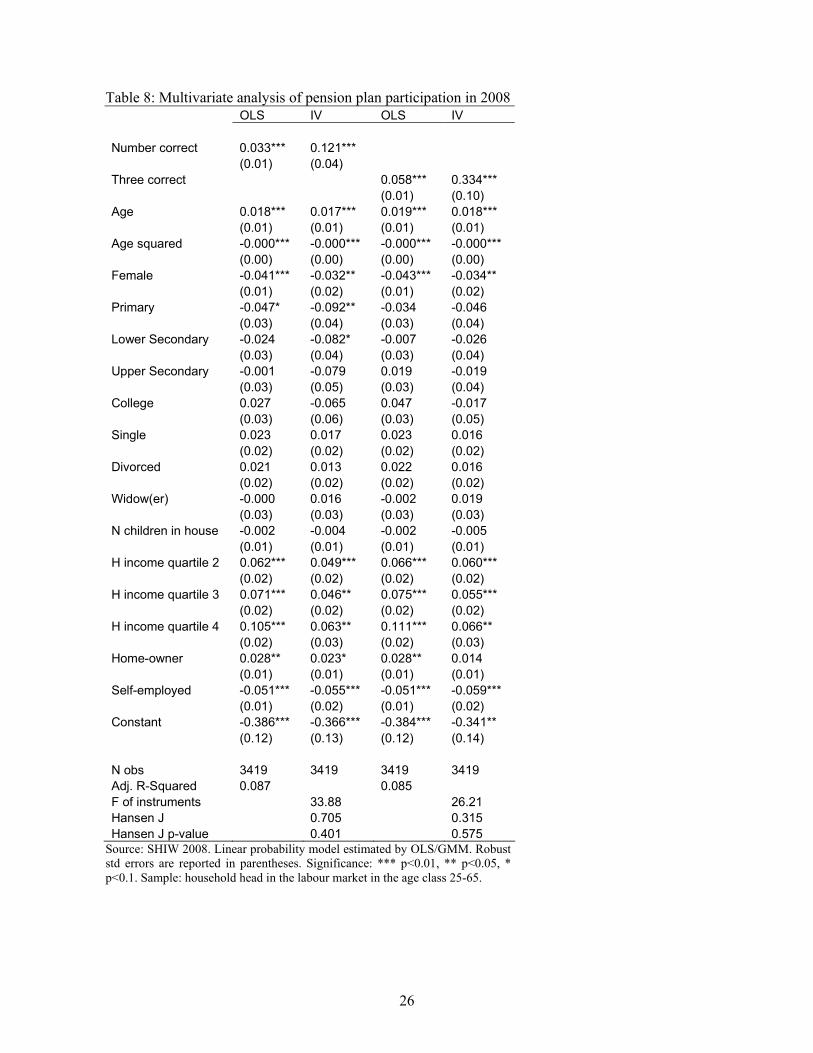
again using the 2008 SHIW data. The overall results displayed in Table 8 broadly confirm 2006
results, also in terms of magnitude, despite the fact that the financial literacy measures are partially
different in the two waves.. We check the robustness of OLS estimates using different measures of
financial literacy (i.e., dummies for giving one/two correct answers, the number of DKs and a
dummy for at least one ‘do not know’) and all of them are significant, with very little difference in
magnitude across questions. When the additional regressors are used (including, as before, risk
aversion, expected retirement age, expected replacement rate and longevity), the effect of financial
literacy decreases by about one percentage point with respect to the baseline of Table 8 but it
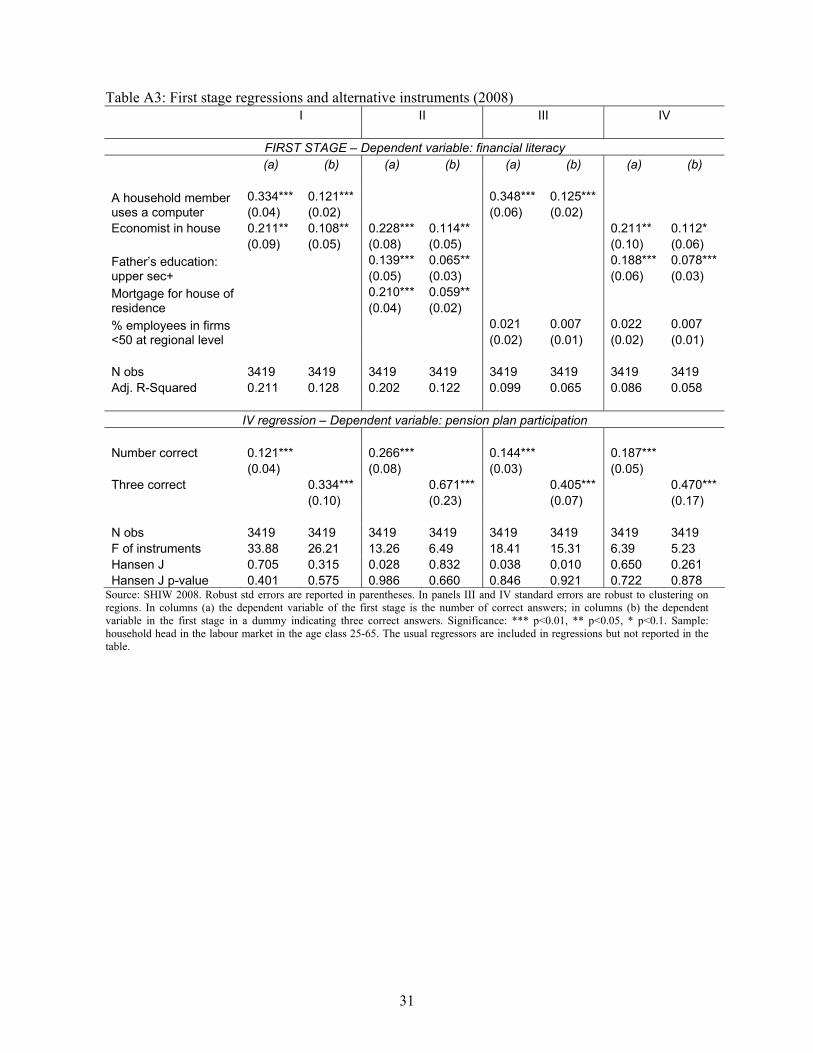
remains highly significant. Finally, we perform IV regressions with the same instruments used for
the 2006 sample. Despite the potential shortcomings of the instrumental variables and the different
tests measuring financial literacy, results for 2008 are remarkably similar to the 2006 ones. Again,
first stage regressions for various instruments are relegated to the appendix in Table A3.
[Table 8 here]
3.3.3 The choice about the TFR destination
As was previously mentioned, a closely related topic to pension plan participation is
employees' decision about the destination of their TFR after January 2007. The recent 2008 wave of
the SHIW allows to investigate this issue, as the choice about the TFR destination is captured by the
following question:
“(If the household member is an employee and present at time of interview) Has (household
member's name)'s severance pay fund been transferred to some form of supplementary
pension scheme (pension fund or private retirement plan)? Yes | No | Do not know”.

14
where about 82% of employees in the sample left the TFR at pre-reform conditions,11 10%
transferred it to a pension fund and 8% report that they don't know. This allocation is consistent
with the one emerging from an ad hoc survey conducted soon after the reform on a sample of
private sector employees (Boeri and Zingales 2008), where the share of workers explicitly choosing
to maintain their TFR at the same conditions as before the reform is about 65%.
It is not entirely clear how to interpret the behavior of the 8% who answered “do not know”
to the above question. Given the default option embedded in the reform (i.e., the TFR of workers
not making any explicit choice is to be transferred to an occupational fund) it is legitimate to
assume that their TFR was transferred to a pension plan. Alternatively, they may have answered this
way because they truly did not remember. We will allow for both interpretations in the empirical
analysis that follows.
As in the previous section, the expected result is that more literate individuals should be
more willing to transfer their TFR flows to a pension fund, not only to benefit from higher expected
returns (at least before the reform, which took place before the crisis), but also to take advantage of
generous fiscal incentives.
Bivariate statistics in Table 9 confirm this hypothesis. The analysis is restricted to the
sample of (household head) employees aged 25-65.12 The table reports the average number of
correct and do not know answers in the three groups of workers who moved their TFR to a pension
fund (PF), who explicitly decided to maintain it in its previous form (FIRM), and who do not know
(DK). Respondents who transferred their TFR to a pension fund have higher literacy than the other
two groups, and the FIRM group has higher literacy that the DKs. When testing the differences in
mean literacy between these groups we obtain that the difference between the PF and FIRM groups
is always statistically significant at 1%, and the difference between FIRM and DK is significant at
1% in most cases. Moreover, also the difference in mean literacy between the ‘active decision-
makers’ (PF and FIRM) versus the DKs is significant, while the difference between FIRM and the
rest (i.e. those who joined a pension fund actively or passively) is not. This indicates that financial
ignorance is to some extent correlated with inertial behaviour (since the DKs have the lowest
11 Note that – as was mentioned before in section 3.3 – workers in firms with more than 50 employees cannot actually maintain their TFR within the firm, but can only choose between transferring it to a pension fund or having it administered by the National Institute for Social Security (INPS), at the same conditions as if it remained at the firm’s disposal. For ease of exposition, in the following analysis we will refer to the latter option as “firm” regardless of firm size. 12 Even though the 2007 reform is directed at private sector employees, also public sector employees are included in the analysis, since some of them report that they transferred their TFR to pension fund. This may not necessarily be a mistake in answering. For instance, it is not easy to disentangle employees in the public or private health and education sectors. Moreover, (public) school teachers hired after 2000 have the possibility to transfer their TFR to an occupation fund, like all private employees.

15
knowledge). However, it is not easy to reconcile the link between inertia and lack of literacy with
the fact that more than 80% of the workers actively decided not to join pension funds. This needs to
be investigated more thoroughly.
[Table 9 here]
We analyze workers’ choice in a multivariate analysis, where the following linear
probability model is estimated by OLS:
TFR = X1 β1+ FLγ + u1 (3)
and where TFR equals one when the TFR is transferred to a pension fund. As before,
financial literacy FL is measured by the number of correct answers and by a dummy indicating
whether the respondent is able to answer all three questions correctly. X1 is a vector of covariates,
including a second-order polynomial in age, a gender dummy for females, four dummies indicating
the highest level of education attained by the respondent, marital status dummies, the number of
children living in the household, household income quartiles dummies, a dummy taking the value of
one for home-owners (as a proxy for household wealth), a dummy for being self-employed, and
regional dummies.
The results are displayed in Table 10 and confirm the descriptive findings of Table 9. First,
financial literacy increases the probability of putting the TFR in a pension scheme when DK
respondents are excluded from the regression (i.e. comparing PF to FIRM). Second, financial
literacy is non-significant when DK respondents are considered to have (unconsciously) joined a
pension plan (i.e. comparing the active and passive PF to FIRM). This is because the group of DK
respondents has much lower literacy than the rest of the sample (see Table 9). Third, financial
literacy (number of correct answers) increases the probability of expressing an active decision
(either for PF or FIRM) with respect to not making any explicit choice (DK). These findings
indicate that financial literacy is a driver of the decision to voluntarily transfer one's own TFR to a
pension fund but it is (obviously) ineffective on those who cannot tell their TFR destination. This is
exactly the spirit behind the default option embedded in the reform, that is of encouraging pension
plan participation among the undecided. At the same time, financial literacy is more strongly
associated with an active decision-making in favour of pension funds rather than in favour of the
firm.
[Table 10 here]
We perform a further robustness check, including additional controls in the regression. The
explanatory power of financial literacy is hardly affected when risk aversion and expectations about

16
public pensions (replacement rate and retirement age) are controlled for. However, as was
mentioned previously, the decision about TFR destination may be related not only to determinants
of pension plan participation (such as risk preferences and expectations about public pensions), but
also to the size of the firm. This is because of the ‘discontinuity’ induced by the reform itself,
treating differently workers in firms with more or less than 50 employees. When we add firm size
dummies as regressors we obtain that workers in larger firms (more than 100 employees) are more
likely to join pension funds, consistently with the evidence of Boeri and Zingales (2008) and
Corsini et al. (2010). At the same time, when firm size dummies are included the effect of financial
literacy on the probability of transferring one’s own TFR to a pension fund (excluding the DKs) is
reduced and becomes non-significant when measured by the three-correct dummy. Overall, this
evidence suggests that the decision about TFR destination is a complex one and that the effect of
financial literacy, while non-negligible, is not fully robust.
4 Discussion and Conclusions
The Italian pension reforms will enhance individual responsibility in the accumulation of
retirement wealth and confer a greater role to private pensions in ensuring old age income. Both the
number and the complexity of personal choices will increase, particularly for younger workers, at a
time when financial innovation and increasing markets integration are making the task of saving for
retirement more difficult.
This evolving context demands more financial sophistication on the part of Italian citizens to
manage their savings, and prompts concerns about the level of their knowledge and ability to deal
with complex financial decisions. This paper exploits new questions about financial literacy
recently introduced in the Survey on Household Income and Wealth to investigate financial literacy
distribution in the Italian population and its impact on retirement planning. In particular, we
concentrated on pension plan participation, also by considering workers’ response to the 2007
severance pay (TFR) reform.
The empirical results show that most individuals lack knowledge of basic financial concepts,
even if they seem more familiar with inflation and stocks than with interest compounding. Similarly
to other countries' findings, women and less educated individuals display the worst performance. A
stark regional divide between the Center-North and the South is also shown by the data.
As for the effects, financial literacy has a positive and significant impact on the propensity
to save for retirement through a private pension plan. Robustness checks corroborate this result.
First, financial literacy increases the probability of participating to a pension fund even after
controlling for financial literacy endogeneity. Second, when looking at employees' response to the

17
2007 reform, financial literacy increases workers' probability of transferring their TFR flows to a
pension fund (at least for those who do so willingly).
These findings confirm and reinforce previous results about the positive impact of financial
literacy on financial behaviour (on planning, saving, wealth diversification etc.), and provide a
further rationale for public intervention to improve the level of financial literacy in the Italian
population. At the same time, results indicate that some population sub-groups face higher risks of
not possessing sufficient financial knowledge and skills to adequately face the challenges posed by
the reformed pension system. While an improved level of financial knowledge would be beneficial
in general, public policies on financial education should primarily be directed at these groups.
References Agnew, J. R., L. Szykman, S. P. Utkus, and J. A. Young (2007). Literacy, trust and 401(k) savings behavior. Working paper CRR WP 2007-10, Center for Retirement Research at Boston College. Ameriks, J., Caplin, A., and Leahy, J. (2003). Wealth accumulation and the propensity to plan, Quarterly Journal of Economics, 118, 1007-1047. Australia and New Zealand Banking Group (2008). ANZ Survey of Adult Financial Literacy in Australia. Melbourne, Australia: Australia and New Zealand Banking Group. Banca d'Italia (2009). Trasparenza delle operazioni e dei servizi bancari e finanziari. Correttezza delle relazioni tra intermediari e clienti. Rome, Italy: Banca d'Italia. Banca d'Italia (2010). Indagini campionarie. I bilanci delle famiglie italiane nell'anno 2008. Supplementi al Bollettino Statistico Nuova serie N 8. Anno XX - 10 febbraio 2010. Banca d'Italia, Consob, Covip, Isvap, Autorità Garante della Concorrenza e del Mercato (2010). Protocollo d'intesa tra Autorità in materia di educazione finanziaria. Rome, 9 June 2010. Bernheim, D. D. (1998). Financial illiteracy, education, and retirement saving. In O. S. Mitchell and S. J. Schieber (Eds.), Living with Defined Contribution Pensions, pp. 38–68. The Pension Research Council, Wharton School Pension Research Council, University of Pennsylvania. Boeri, Tito and Luigi Zingales, (2008), Chi ha paura dei fondi pensione?, Anima FinLab, Numero 1 2008 (https://www.animasgr.it/ANIMA/IT/AnimaFinLab/) Castellino, O. and E. Fornero (eds.) (2001). “La riforma del sistema previdenziale italiano. Opzioni e proposte” Bologna: ll Mulino Castellino, O. and E. Fornero (2008). “Public Policy and the Transition to Private Pension Provision in the United States and Europe”, in S. Sanhari Mishra (ed.), Pension Reforms. Some Concepts and Country Experiences, ICFAI University Press, Punjagutta.

18
Corsini, Lorenzo, Pier Mario Pacini and Luca Spataro, (2010), Workers' Choice on Pension Schemes: an Assessment of the Italian TFR Reform Through Theory and Simulations, University of Pisa Discussion Paper 96/2010 Covip, 2008. La previdenza complementare nel 2007, Commissione di Vigilanza sui Fondi Pensione, Roma (27 Febbraio 2008) Covip, 2009. Relazione per l'anno 2008, Commissione di Vigilanza sui Fondi Pensione, Roma (27 Febbraio 2008) Covip, 2010. La previdenza complementare. Principali dati statistici dati aggiornati a dicembre 2009. Commissione di Vigilanza sui Fondi Pensione, Roma. Guiso, L. and T. Jappelli (2008). Financial literacy and portfolio diversification. EUI Working Paper (ECO 2008/31). Guiso, L., T. Jappelli, and M. Padula (2009). Pension risk, retirement saving and insurance, CSEF Working Paper n. 223, March 2009. Istat (2002). Forze di lavoro – Media 2001. http://www.istat.it/dati/catalogo/20020611_01/ Istat (2004). Edifici ed Abitazioni. Censimento 2001. Rome, Italy: Istituto Nazionale di Statistica. Istat (2010). Forze di lavoro – Media 2009. http://www.istat.it/dati/catalogo/20101116_00/ Jappelli, T. and M. Padula (2011). Investment in financial literacy and saving decisions. CERP Discussion Paper No. 8220. Kimball, M. S. and T. Shumway (2007). Investor sophistication and the home bias, diversification, and employer stock puzzles. mimeo, University of Michigan. Lusardi, A. and O. Mitchell (2006). Financial literacy and planning: Implications for retirement wellbeing. PRC Working Paper No. 1/2006. Lusardi, A. and O. S. Mitchell (2007). Baby boomer retirement security: The roles of planning, financial literacy, and housing wealth. Journal of Monetary Economics 54 (1), 205-224. Lusardi, A., O. S. Mitchell, and V. Curto (2010). Financial literacy among the young. Journal of Consumer Affairs 44 (2), 358–380. Lusardi, A. and P. Tufano (2008). Debt literacy, financial experience and overindebtedness. NBER Working Paper No. W14808, National Bureau of Economic Research. van Rooij, M., A. Lusardi, and R. Alessie (2008). Financial literacy, retirement planning, and household wealth. Paper presented at the ECB-CFS Conference on Household Finances and Consumption, Frankfurt, Germany (September 2008). van Rooij, M., A. Lusardi, and R. Alessie (2011). Financial literacy and stock market participation. Journal of Financial Economics (forthcoming).

19
Figure 1: Financial literacy at regional level (2006)
(1.76,2.14](1.56,1.76](1.28,1.56][0.95,1.28]
Source: SHIW 2006 - Weighted data.
Number of correct answers - 2006
(1.70,2.09](1.54,1.70](1.21,1.54][0.96,1.21]
Source: SHIW 2006 - Weighted data.
Number of correct answers (predicted) - 2006
(0.36,0.48](0.23,0.36](0.15,0.23][0.07,0.15]
Source: SHIW 2006 - Weighted data.
Three correct answers - 2006
(0.32,0.51](0.22,0.32](0.17,0.22][0.06,0.17]
Source: SHIW 2006 - Weighted data.
Three correct answers (predicted) - 2006

20
Figure 2: Financial literacy at regional level (2008)
(1.86,2.05](1.44,1.86](1.12,1.44][0.75,1.12]
Source: SHIW 2008 - Weighted data.
Number of correct answers - 2008
(1.81,2.01](1.45,1.81](1.11,1.45][0.79,1.11]
Source: SHIW 2008 - Weighted data.
Number of correct answers (predicted) - 2008
(0.33,0.38](0.20,0.33](0.13,0.20][0.00,0.13]
Source: SHIW 2008 - Weighted data.
Three correct answers - 2008
(0.32,0.39](0.24,0.32](0.12,0.24][0.00,0.12]
Source: SHIW 2008 - Weighted data.
Three correct answers (predicted) - 2008

21
Table 1: Answers to the 2006 financial literacy questions
All household
heads
Household heads 25-65
Panel A -- Interest
Less than 1,020 euros 6.76 7.39Exactly 1,020 euros 25.03 28.12More than 1,020 euros (correct) 40.02 44.57Don’t know 28.19 19.92
Panel B -- Inflation Exactly same amount 3.83 4.33Less (correct) 59.3 65.44More 6.18 6.7Don’t know 30.7 23.53
Panel C -- Stocks Better off 1.65 1.86Worse off (correct) 52.17 59.23As before 12.52 12.7Don’t know 33.66 26.21
Panel D -- Overall performance Correct answers to interest and inflation 31.51 35.69All answers correct 24.88 28.33No correct answer 26.43 19.76At least one “do not know” 44.88 36.95All “do not know” 19.93 12.91 N obs 3992 2594
Source: SHIW 2006 – Weighted data. The text of questions is the following: - Interest: Imagine leaving €1,000 in a current account that pays 2% annual
interest and has no charges. What sum do you think will be available at the end of 2 years?
- Inflation: Imagine leaving 1,000 euros in a current account that pays 1% interest and has no charges. Imagine also that inflation is running at 2%. Do you think that if you withdraw the money in a year's time you will be able to buy the same amount of goods as if you spent the 1,000 euros today?
- Stocks: Imagine you have only equity funds and stock market prices fall. Are you...?

22
Table 2: Answers to the 2008 financial literacy questions
All household
heads
Household heads 25-65
Panel A -- Inflation
Exactly same amount 4.2 5.05Less (correct) 72.99 77.83More 2.75 2.7Don't know 20.05 14.42
Panel B -- Risk HRS One company shares (correct) 45.13 50.13Shares of several companies 26.43 28.5Do not know 28.45 21.37
Panel C -- Risk 2 Shares (correct) 34.04 38.77Bonds 7.45 8.03Equally risky 26.88 28.45I don't know the difference 12.85 11.23Don't know 18.78 13.52
Panel D -- Overall performance All answers correct 24.33 28.3No correct answer 21.09 16.08At least one “do not know” 42.27 34.62All “do not know” 13.05 8.16 N obs 7977 5063
Source: SHIW 2008 – Weighted data. The text of questions is the following: - Inflation: Imagine leaving 1,000 euros in a current account that pays 1%
interest and has no charges. Imagine that inflation is running at 2%. Do you think that if you withdraw the money in a year's time you will be able to buy the same amount of goods as if you spent the 1,000 euros today
- Risk HRS: Which of the following investment strategies do you think entails the greatest risk of losing your capital?
- Risk 2: A company can be financed by issuing either shares (equity securities) or bonds (debt securities). Which do you think is most risky for the investor?

23
Table 3: Performance by socio-demographic characteristics (2006) Interest Inflation Stocks Overall
Correct DK Correct DK Correct DK Three
Correct At least 1 DK
Age Age <=35 39.25 27.24 57.85 28.79 49.69 32.07 22.9 42.35Age 36-50 45.64 16.24 68.58 19.88 62.09 23.1 30.29 32.59Age 51-65 44.75 22.59 64.04 26.66 58.88 28.36 27.51 41.24Age 65+ 30.32 46.13 45.73 46.47 36.66 50.04 17.44 62.15
Gender Men 45.47 21.28 65.77 24.18 58.08 28.23 29.51 37.85Women 30.78 39.9 48.34 41.74 42.14 42.87 17.04 56.78
Education No education 13.67 72.21 23.22 72.72 18.36 75.21 7.17 87.07Primary (Isced 1) 27.87 47.8 44.75 47.51 33.96 52.62 12.96 67.37Lower sec (Isced 2) 38.49 24.69 59.32 29.82 53.71 32.52 22.24 44.97Upper sec (Isced 3) 50.91 14.69 71.11 17.48 64.02 18.8 35.03 27.79Degree + (Isced 5+) 54.3 8.72 77.7 10.38 73.42 14.78 39.12 20.55
Occupational status Self-employed 49.98 9.4 71.2 15.07 67.19 15.74 28.92 24.72Employees 45.33 17.27 66.79 22.07 60.11 24.6 28.74 35.11Non-employed 31.76 38.07 49.66 40.08 47.14 40.04 20.3 55.77Retired 34.52 41.68 50.59 41.3 41.39 46.01 20.65 57.41
Source: SHIW 2006 – Weighted data. Sample: all household heads (N = 3992) Table 4: Performance by socio-demographic characteristics (2008) Inflation Risk (HRS) Risk 2 Overall
Correct DK Correct DK Correct DK Three
Correct At least 1 DK
Age Age <=35 73.91 16.02 47.72 21.16 32.41 29.89 24.38 39.86Age 36-50 78.36 14.28 50.91 20.61 40.75 23.71 29.55 33.05Age 51-65 78.88 13.85 49.81 22.58 38.46 24.03 28.01 34.66Age 65+ 62.32 32.5 34.44 43.87 24.16 46.6 15.95 58.82
Gender Men 77.51 15.86 50.18 23.86 38.87 25.62 28.22 36.07Women 65.36 27.13 36.59 36.2 25.88 41.79 17.76 52.76
Education No education 37.32 57.09 15.52 72.15 5.743 80.23 3.607 87.65Primary (Isced 1) 59.09 35.17 31.28 45.84 19.86 51.78 11.96 64.75Lower sec (Isced 2) 74.77 17.4 42.38 27.77 32.67 31.37 22.24 43.05Upper sec (Isced 3) 82.51 10.04 54.94 16.25 42.13 16.34 31.13 26.54Degree + (Isced 5+) 86.41 7.307 67.69 8.524 58.51 11.94 47.15 17.18
Occupational status Self-employed 83.83 7.955 60.23 10.96 49.86 16.55 38.26 23.99Employees 78.86 13.47 51.28 20.22 38.95 23.77 28.8 33.51Non-employed 59.98 29.35 34.17 36.28 22.86 44.5 12.52 57.76Retired 66.8 27.92 37.34 39.48 27.53 40.76 18.71 52.78
Source: SHIW 2008 – Weighted data. Sample: all household heads (N = 7977)

24
Table 5: Financial literacy by pension plans participation (2006)
Household head has pension plan
Household head has no pension plan t-test
Inflation Correct 65.24 44.03 *** Do not know 5.74 16.71 ***
Interest Correct 74.92 67.20 * Do not know 11.43 21.57 ***
Stocks Correct 77.08 60.08 *** Do not know 15.17 23.51 **
Overall performance Correct on interest and inflation 51.48 35.26 *** Number correct 2.17 1.71 *** 3 correct 42.92 27.62 *** At least one DK 21.85 34.09 *** N obs 188 1588
Source: SHIW 2006. Significance: *** p<0.01, ** p<0.05, * p<0.1. Sample: household head in the labour market in the age class 25-65 (N = 1776). The table reports the percentage of correct / DK answers in any question, by pension plan participation Table 6: Financial literacy by pension plans participation (2008)
Household head has pension plan
Household head has no pension plan t-test
Inflation Correct 77.85 93.18 *** Do not know 13.85 2.32 ***
Risk (HRS) Correct 50.79 68.38 *** Do not know 19.51 10.91 ***
Risk 2 Correct 38.73 57.74 *** Do not know 23.89 10.93 ***
Overall performance Number correct 1.67 2.19 *** 3 correct 28.40 46.81 *** At least one DK 33.11 19.04 *** N obs 471 2948
Source: SHIW 2008. Significance: *** p<0.01, ** p<0.05, * p<0.1. Sample: household head in the labour market in the age class 25-65 (N = 3419). The table reports the percentage of correct / DK answers in any question, by pension plan participation

25
Table 7: Multivariate analysis of pension plan participation in 2006 OLS IV OLS IV Number correct 0.023*** 0.137*** (0.01) (0.04) Three correct 0.034* 0.372*** (0.02) (0.13) Age 0.027*** 0.020** 0.028*** 0.022*** (0.01) (0.01) (0.01) (0.01) Age squared -0.000*** -0.000*** -0.000*** -0.000*** (0.00) (0.00) (0.00) (0.00) Female -0.071*** -0.050** -0.072*** -0.042* (0.02) (0.02) (0.02) (0.02) Primary -0.073** -0.106* -0.063* -0.019 (0.03) (0.06) (0.03) (0.06) Secondary -0.060* -0.125* -0.046 -0.040 (0.03) (0.07) (0.03) (0.06) Tertiary -0.013 -0.101 0.002 -0.021 (0.04) (0.07) (0.03) (0.06) College 0.004 -0.096 0.021 -0.010 (0.04) (0.08) (0.04) (0.06) Single 0.003 -0.003 0.004 -0.000 (0.02) (0.02) (0.02) (0.03) Divorced 0.065** 0.048* 0.066** 0.041 (0.03) (0.03) (0.03) (0.03) Widow(er) 0.114** 0.117** 0.113** 0.113** (0.05) (0.06) (0.05) (0.06) N children in house -0.004 -0.007 -0.004 -0.006 (0.01) (0.01) (0.01) (0.01) H income quartile 2 0.052*** 0.029 0.055*** 0.040* (0.02) (0.02) (0.02) (0.02) H income quartile 3 0.050*** 0.019 0.055*** 0.044** (0.02) (0.02) (0.02) (0.02) H income quartile 4 0.102*** 0.059** 0.107*** 0.066** (0.02) (0.03) (0.02) (0.03) Home-owner 0.016 -0.004 0.019 -0.000 (0.02) (0.02) (0.02) (0.02) Self-employed 0.015 0.004 0.018 0.024 (0.02) (0.02) (0.02) (0.02) Constant -0.555*** -0.474*** -0.561*** -0.466*** (0.16) (0.18) (0.16) (0.18) N obs 1776 1776 1776 1776 Adj. R-Squared 0.105 0.102 F of instruments 17.67 11.92 Hansen J 0.759 1.926 Hansen J p-value 0.384 0.165
Source: SHIW 2006. Linear probability model estimated by OLS/GMM. Robust std errors are reported in parentheses. Significance: *** p<0.01, ** p<0.05, * p<0.1. Sample: household head in the labour market in the age class 25-65.
26
Table 8: Multivariate analysis of pension plan participation in 2008 OLS IV OLS IV Number correct 0.033*** 0.121*** (0.01) (0.04) Three correct 0.058*** 0.334*** (0.01) (0.10) Age 0.018*** 0.017*** 0.019*** 0.018*** (0.01) (0.01) (0.01) (0.01) Age squared -0.000*** -0.000*** -0.000*** -0.000*** (0.00) (0.00) (0.00) (0.00) Female -0.041*** -0.032** -0.043*** -0.034** (0.01) (0.02) (0.01) (0.02) Primary -0.047* -0.092** -0.034 -0.046 (0.03) (0.04) (0.03) (0.04) Lower Secondary -0.024 -0.082* -0.007 -0.026 (0.03) (0.04) (0.03) (0.04) Upper Secondary -0.001 -0.079 0.019 -0.019 (0.03) (0.05) (0.03) (0.04) College 0.027 -0.065 0.047 -0.017 (0.03) (0.06) (0.03) (0.05) Single 0.023 0.017 0.023 0.016 (0.02) (0.02) (0.02) (0.02) Divorced 0.021 0.013 0.022 0.016 (0.02) (0.02) (0.02) (0.02) Widow(er) -0.000 0.016 -0.002 0.019 (0.03) (0.03) (0.03) (0.03) N children in house -0.002 -0.004 -0.002 -0.005 (0.01) (0.01) (0.01) (0.01) H income quartile 2 0.062*** 0.049*** 0.066*** 0.060*** (0.02) (0.02) (0.02) (0.02) H income quartile 3 0.071*** 0.046** 0.075*** 0.055*** (0.02) (0.02) (0.02) (0.02) H income quartile 4 0.105*** 0.063** 0.111*** 0.066** (0.02) (0.03) (0.02) (0.03) Home-owner 0.028** 0.023* 0.028** 0.014 (0.01) (0.01) (0.01) (0.01) Self-employed -0.051*** -0.055*** -0.051*** -0.059*** (0.01) (0.02) (0.01) (0.02) Constant -0.386*** -0.366*** -0.384*** -0.341** (0.12) (0.13) (0.12) (0.14) N obs 3419 3419 3419 3419 Adj. R-Squared 0.087 0.085 F of instruments 33.88 26.21 Hansen J 0.705 0.315 Hansen J p-value 0.401 0.575
Source: SHIW 2008. Linear probability model estimated by OLS/GMM. Robust std errors are reported in parentheses. Significance: *** p<0.01, ** p<0.05, * p<0.1. Sample: household head in the labour market in the age class 25-65.

27
Table 9: Financial literacy by TFR destination TFR in PF TFR in firm TFR: DK
Inflation Correct 90.76 79.39 55.37Do not know 3.24 13.46 29.04
Risk (HRS) Correct 66.04 50.45 41.98Do not know 11.51 19.92 33.79
Risk 2 Correct 53.73 38.10 27.91Do not know 11.05 23.55 46.75
Overall performance Number correct 2.11 1.68 1.253 correct 43.04 28.17 16.28At least one DK 20.80 33.00 56.30 N obs 289 2,178 164
Source: SHIW 2008. Sample: household heads working as employees aged 25-65.

28
Table 10: Probability of transferring TFR into a pension fund
Dependent var: TFR in PF (vs. firm, excluding DKs)
Dependent var: TFR in PF (including DKs) vs. firm
Dependent var: Explict decision (PF or firm) vs. DK
Number correct 0.021*** 0.004 0.018*** (0.01) (0.01) (0.01) Three correct 0.035** 0.019 0.017* (0.02) (0.02) (0.01) Age 0.007 0.007 -0.004 -0.004 0.012** 0.013** (0.01) (0.01) (0.01) (0.01) (0.01) (0.01) Age squared -0.000 -0.000 0.000 0.000 -0.000** -0.000** (0.00) (0.00) (0.00) (0.00) (0.00) (0.00) Female -0.030* -0.030* -0.026 -0.026 -0.003 -0.004 (0.02) (0.02) (0.02) (0.02) (0.01) (0.01) Primary -0.043 -0.044 -0.162 -0.162 0.108 0.112 (0.03) (0.03) (0.13) (0.13) (0.12) (0.12) Lower Secondary 0.003 0.006 -0.152 -0.151 0.140 0.146 (0.03) (0.03) (0.13) (0.13) (0.12) (0.12) Upper Secondary 0.010 0.015 -0.154 -0.154 0.149 0.158 (0.03) (0.03) (0.13) (0.13) (0.12) (0.12) College -0.006 -0.001 -0.159 -0.160 0.137 0.147 (0.04) (0.04) (0.13) (0.13) (0.12) (0.12) Single -0.002 -0.001 -0.031 -0.031 0.032* 0.033** (0.02) (0.02) (0.02) (0.02) (0.02) (0.02) Divorced 0.017 0.018 -0.018 -0.019 0.035** 0.036** (0.02) (0.02) (0.03) (0.03) (0.02) (0.02) Widow(er) -0.017 -0.020 -0.009 -0.008 -0.009 -0.012 (0.03) (0.03) (0.04) (0.04) (0.04) (0.04) N children in house 0.009 0.009 0.006 0.005 0.003 0.003 (0.01) (0.01) (0.01) (0.01) (0.01) (0.01) H income quartile 2 0.065*** 0.067*** 0.052** 0.052** 0.006 0.008 (0.02) (0.02) (0.02) (0.02) (0.02) (0.02) H income quartile 3 0.078*** 0.082*** 0.047* 0.047* 0.028 0.032* (0.02) (0.02) (0.02) (0.02) (0.02) (0.02) H income quartile 4 0.065*** 0.070*** 0.040 0.038 0.021 0.027 (0.02) (0.02) (0.03) (0.03) (0.02) (0.02) Home-owner 0.047*** 0.047*** 0.007 0.006 0.041*** 0.041*** (0.01) (0.01) (0.02) (0.02) (0.01) (0.01) Constant -0.159 -0.152 0.392* 0.395* 0.432** 0.430** (0.14) (0.14) (0.21) (0.21) (0.17) (0.17) N obs 2467 2467 2631 2631 2631 2631 Adj. R-Squared 0.069 0.068 0.035 0.036 0.030 0.026 Source: SHIW 2008. Std errors robust to heteroskedasticity are reported in parentheses. Significance: *** p<0.01, ** p<0.05, * p<0.1. Sample: household heads working as employees aged 25-65.

29
Appendix Table A1: Socio-demographic characteristics 2006 2008
Mean Median Std. Dev. Mean Median
Std. Dev.
Age (years) 57.646 58 15.613 58.240 58 15.828Age <=35 0.078 0 0.268 0.078 0 0.268Age 36-50 0.276 0 0.447 0.268 0 0.443Age 51-65 0.301 0 0.459 0.296 0 0.457Age 65+ 0.344 0 0.475 0.358 0 0.479Female 0.370 0 0.483 0.381 0 0.486No edu 0.055 0 0.228 0.053 0 0.223Primary 0.265 0 0.441 0.258 0 0.437Lower secondary 0.282 0 0.450 0.287 0 0.452Upper secondary 0.309 0 0.462 0.308 0 0.462College+ 0.089 0 0.285 0.094 0 0.292Single 0.116 0 0.320 0.113 0 0.317Married 0.632 1 0.482 0.633 1 0.482Divorced 0.071 0 0.257 0.073 0 0.261Widow(er) 0.182 0 0.385 0.181 0 0.385Num H components 2.517 2 1.265 2.496 2 1.256N children in house 0.771 0 0.965 0.757 0 0.968Household total net income (th) 31.893 26.217 27.276 32.344 26.702 24.357Home-owner 0.700 1 0.458 0.707 1 0.455Employees 0.348 0 0.477 0.345 0 0.475Self-employed 0.076 0 0.266 0.073 0 0.260Retired 0.095 0 0.293 0.096 0 0.294Not employed 0.095 0 0.293 0.096 0 0.294North-west 0.256 0 0.436 0.250 0 0.433North-east 0.222 0 0.415 0.219 0 0.414Center 0.203 0 0.402 0.206 0 0.404South 0.209 0 0.406 0.218 0 0.413Isles 0.111 0 0.314 0.108 0 0.310Household head has private pension plan 0.061 0 0.239 0.061 0 0.240Economist in house 0.024 0 0.153 0.023 0 0.150A household member uses a computer 0.414 0 0.493 0.473 0 0.499Mortgage for house of residence 0.100 0 0.300 0.092 0 0.289Father’s education: upper secondary+ 0.088 0 0.284 0.088 0 0.283% employees in firms <50 at regional level 67.97 68.18 4.147 67.86 67.97 4.255
Source: SHIW 2006, 2008. Sample: all household heads
30
Table A2: First stage regressions and alternative instruments (2006) I II III IV
FIRST STAGE – Dependent variable: financial literacy (a) (b) (a) (b) (a) (b) (a) (b)
0.348*** 0.115*** 0.410*** 0.139*** A household member uses a computer (0.06) (0.03) (0.06) (0.02) Economist in house 0.065 0.095 0.069 0.098 0.128 0.117* (0.14) (0.06) (0.13) (0.06) (0.14) (0.06)
0.020 0.039 0.061 0.055 Father’s education: upper sec+ (0.07) (0.04) (0.08) (0.04)
0.234*** 0.055* Mortgage for house of residence (0.06) (0.03)
0.020* 0.011** 0.021* 0.011** % employees in firms <50 at regional level (0.01) (0.00) (0.01) (0.00) N obs 1776 1776 1776 1776 1776 1776 1776 1776 Adj. R-Squared 0.172 0.125 0.160 0.117 0.085 0.058 0.059 0.045
IV regression – Dependent variable: pension plan participation Number correct 0.137*** 0.237** 0.154*** 0.276*** (0.04) (0.12) (0.03) (0.10) Three correct 0.372*** 0.598* 0.390*** 0.435*** (0.13) (0.36) (0.08) (0.11) N obs 1776 1776 1776 1776 1776 1776 1776 1776 F of instruments 17.67 11.92 5.06 2.37 29.74 19.54 3.74 4.65 Hansen J 0.759 1.926 3.947 4.002 0.016 0.256 3.391 2.636 Hansen J p-value 0.384 0.165 0.139 0.135 0.899 0.613 0.184 0.268
Source: SHIW 2006. Robust std errors are reported in parentheses. In panels III and IV standard errors are robust to clustering on regions. In columns (a) the dependent variable of the first stage is the number of correct answers; in columns (b) the dependent variable in the first stage in a dummy indicating three correct answers. Significance: *** p<0.01, ** p<0.05, * p<0.1. Sample: household head in the labour market in the age class 25-65. The usual regressors are included in regressions but not reported in the table.
31
Table A3: First stage regressions and alternative instruments (2008) I II III IV
FIRST STAGE – Dependent variable: financial literacy (a) (b) (a) (b) (a) (b) (a) (b)
0.334*** 0.121*** 0.348*** 0.125*** A household member uses a computer (0.04) (0.02) (0.06) (0.02) Economist in house 0.211** 0.108** 0.228*** 0.114** 0.211** 0.112* (0.09) (0.05) (0.08) (0.05) (0.10) (0.06)
0.139*** 0.065** 0.188*** 0.078*** Father’s education: upper sec+ (0.05) (0.03) (0.06) (0.03)
0.210*** 0.059** Mortgage for house of residence (0.04) (0.02)
0.021 0.007 0.022 0.007 % employees in firms <50 at regional level (0.02) (0.01) (0.02) (0.01) N obs 3419 3419 3419 3419 3419 3419 3419 3419 Adj. R-Squared 0.211 0.128 0.202 0.122 0.099 0.065 0.086 0.058
IV regression – Dependent variable: pension plan participation Number correct 0.121*** 0.266*** 0.144*** 0.187*** (0.04) (0.08) (0.03) (0.05) Three correct 0.334*** 0.671*** 0.405*** 0.470*** (0.10) (0.23) (0.07) (0.17) N obs 3419 3419 3419 3419 3419 3419 3419 3419 F of instruments 33.88 26.21 13.26 6.49 18.41 15.31 6.39 5.23 Hansen J 0.705 0.315 0.028 0.832 0.038 0.010 0.650 0.261 Hansen J p-value 0.401 0.575 0.986 0.660 0.846 0.921 0.722 0.878
Source: SHIW 2008. Robust std errors are reported in parentheses. In panels III and IV standard errors are robust to clustering on regions. In columns (a) the dependent variable of the first stage is the number of correct answers; in columns (b) the dependent variable in the first stage in a dummy indicating three correct answers. Significance: *** p<0.01, ** p<0.05, * p<0.1. Sample: household head in the labour market in the age class 25-65. The usual regressors are included in regressions but not reported in the table.

Our papers can be downloaded at:
http://cerp.unito.it/index.php/en/publications
CeRP Working Paper Series
N° 1/00 Guido Menzio Opting Out of Social Security over the Life Cycle
N° 2/00 Pier Marco Ferraresi Elsa Fornero
Social Security Transition in Italy: Costs, Distorsions and (some) Possible Correction
N° 3/00 Emanuele Baldacci Luca Inglese
Le caratteristiche socio economiche dei pensionati in Italia. Analisi della distribuzione dei redditi da pensione (only available in the Italian version)
N° 4/01 Peter Diamond Towards an Optimal Social Security Design
N° 5/01 Vincenzo Andrietti Occupational Pensions and Interfirm Job Mobility in the European Union. Evidence from the ECHP Survey
N° 6/01 Flavia Coda Moscarola The Effects of Immigration Inflows on the Sustainability of the Italian Welfare State
N° 7/01 Margherita Borella The Error Structure of Earnings: an Analysis on Italian Longitudinal Data
N° 8/01 Margherita Borella Social Security Systems and the Distribution of Income: an Application to the Italian Case
N° 9/01 Hans Blommestein Ageing, Pension Reform, and Financial Market Implications in the OECD Area
N° 10/01 Vincenzo Andrietti and Vincent Hildebrand
Pension Portability and Labour Mobility in the United States. New Evidence from the SIPP Data
N° 11/01 Mara Faccio and Ameziane Lasfer
Institutional Shareholders and Corporate Governance: The Case of UK Pension Funds
N° 12/01 Roberta Romano Less is More: Making Shareholder Activism a Valuable Mechanism of Corporate Governance
N° 13/01 Michela Scatigna Institutional Investors, Corporate Governance and Pension Funds
N° 14/01 Thomas H. Noe Investor Activism and Financial Market Structure
N° 15/01 Estelle James How Can China Solve ist Old Age Security Problem? The Interaction Between Pension, SOE and Financial Market Reform
N° 16/01 Estelle James and Xue Song
Annuities Markets Around the World: Money’s Worth and Risk Intermediation
N° 17/02 Richard Disney and Sarah Smith
The Labour Supply Effect of the Abolition of the Earnings Rule for Older Workers in the United Kingdom
N° 18/02 Francesco Daveri Labor Taxes and Unemployment: a Survey of the Aggregate Evidence
N° 19/02 Paolo Battocchio Francesco Menoncin
Optimal Portfolio Strategies with Stochastic Wage Income and Inflation: The Case of a Defined Contribution Pension Plan
N° 20/02 Mauro Mastrogiacomo Dual Retirement in Italy and Expectations
N° 21/02 Olivia S. Mitchell David McCarthy
Annuities for an Ageing World
N° 22/02 Chris Soares Mark Warshawsky
Annuity Risk: Volatility and Inflation Exposure in Payments from Immediate Life Annuities
N° 23/02 Ermanno Pitacco Longevity Risk in Living Benefits
N° 24/02 Laura Ballotta Steven Haberman
Valuation of Guaranteed Annuity Conversion Options
N° 25/02 Edmund Cannon Ian Tonks
The Behaviour of UK Annuity Prices from 1972 to the Present
N° 26/02 E. Philip Davis Issues in the Regulation of Annuities Markets
N° 27/02 Reinhold Schnabel Annuities in Germany before and after the Pension Reform of 2001
N° 28/02 Luca Spataro New Tools in Micromodeling Retirement Decisions: Overview and Applications to the Italian Case
N° 29/02 Marco Taboga The Realized Equity Premium has been Higher than Expected: Further Evidence
N° 30/03 Bas Arts Elena Vigna
A Switch Criterion for Defined Contribution Pension Schemes
N° 31/03 Giacomo Ponzetto Risk Aversion and the Utility of Annuities
N° 32/04 Angelo Marano Paolo Sestito
Older Workers and Pensioners: the Challenge of Ageing on the Italian Public Pension System and Labour Market
N° 33/04 Elsa Fornero Carolina Fugazza Giacomo Ponzetto
A Comparative Analysis of the Costs of Italian Individual Pension Plans
N° 34/04 Chourouk Houssi Le Vieillissement Démographique : Problématique des Régimes de Pension en Tunisie
N° 35/04 Monika Bütler Olivia Huguenin Federica Teppa
What Triggers Early Retirement. Results from Swiss Pension Funds
N° 36/04 Laurence J. Kotlikoff Pensions Systems and the Intergenerational Distribution of Resources
N° 37/04 Jay Ginn Actuarial Fairness or Social Justice? A Gender Perspective on Redistribution in Pension Systems
N° 38/05 Carolina Fugazza Federica Teppa
An Empirical Assessment of the Italian Severance Payment (TFR)
N° 39/05 Anna Rita Bacinello Modelling the Surrender Conditions in Equity-Linked Life Insurance
N° 40/05 Carolina Fugazza Massimo Guidolin Giovanna Nicodano
Investing for the Long-Run in European Real Estate. Does Predictability Matter?
N° 41/05 Massimo Guidolin Giovanna Nicodano
Small Caps in International Equity Portfolios: The Effects of Variance Risk.
N° 42/05 Margherita Borella Flavia Coda Moscarola
Distributive Properties of Pensions Systems: a Simulation of the Italian Transition from Defined Benefit to Defined Contribution
N° 43/05 John Beshears James J. Choi David Laibson Brigitte C. Madrian
The Importance of Default Options for Retirement Saving Outcomes: Evidence from the United States

N° 44/05 Henrik Cronqvist Advertising and Portfolio Choice
N° 45/05 Claudio Campanale Increasing Returns to Savings and Wealth Inequality
N° 46/05 Annamaria Lusardi Olivia S. Mitchell
Financial Literacy and Planning: Implications for Retirement Wellbeing
N° 47/06 Michele Belloni Carlo Maccheroni
Actuarial Neutrality when Longevity Increases: An Application to the Italian Pension System
N° 48/06 Onorato Castellino Elsa Fornero
Public Policy and the Transition to Private Pension Provision in the United States and Europe
N° 49/06 Mariacristina Rossi Examining the Interaction between Saving and Contributions to Personal Pension Plans. Evidence from the BHPS
N° 50/06 Andrea Buffa Chiara Monticone
Do European Pension Reforms Improve the Adequacy of Saving?
N° 51/06 Giovanni Mastrobuoni The Social Security Earnings Test Removal. Money Saved or Money Spent by the Trust Fund?
N° 52/06 Luigi Guiso Tullio Jappelli
Information Acquisition and Portfolio Performance
N° 53/06 Giovanni Mastrobuoni Labor Supply Effects of the Recent Social Security Benefit Cuts: Empirical Estimates Using Cohort Discontinuities
N° 54/06 Annamaria Lusardi Olivia S. Mitchell
Baby Boomer Retirement Security: The Roles of Planning, Financial Literacy, and Housing Wealth
N° 55/06 Antonio Abatemarco On the Measurement of Intra-Generational Lifetime Redistribution in Pension Systems
N° 56/07 John A. Turner Satyendra Verma
Why Some Workers Don’t Take 401(k) Plan Offers: Inertia versus Economics
N° 57/07 Giovanni Mastrobuoni Matthew Weinberg
Heterogeneity in Intra-Monthly Consumption. Patterns, Self-Control, and Savings at Retirement
N° 58/07 Elisa Luciano Jaap Spreeuw Elena Vigna
Modelling Stochastic Mortality for Dependent Lives
N° 59/07 Riccardo Calcagno Roman Kraeussl Chiara Monticone
An Analysis of the Effects of the Severance Pay Reform on Credit to Italian SMEs
N° 60/07 Riccardo Cesari Giuseppe Grande Fabio Panetta
La Previdenza Complementare in Italia: Caratteristiche, Sviluppo e Opportunità per i Lavoratori
N° 61/07 Irina Kovrova Effects of the Introduction of a Funded Pillar on the Russian Household Savings: Evidence from the 2002 Pension Reform
N° 62/07 Margherita Borella Elsa Fornero Mariacristina Rossi
Does Consumption Respond to Predicted Increases in Cash-on-hand Availability? Evidence from the Italian “Severance Pay”
N° 63/07 Claudio Campanale Life-Cycle Portfolio Choice: The Role of Heterogeneous Under-Diversification
N° 64/07 Carlo Casarosa Luca Spataro
Rate of Growth of Population, Saving and Wealth in the Basic Life-cycle Model when the Household is the Decision Unit
N° 65/07 Annamaria Lusardi Household Saving Behavior: The Role of Literacy, Information and Financial Education Programs (Updated version June 08: “Financial Literacy: An Essential Tool for Informed Consumer Choice?”)

N° 66/07 Maarten van Rooij Annamaria Lusardi Rob Alessie
Financial Literacy and Stock Market Participation
N° 67/07 Carolina Fugazza Maela Giofré Giovanna Nicodano
International Diversification and Labor Income Risk
N° 68/07 Massimo Guidolin Giovanna Nicodano
Small Caps in International Diversified Portfolios
N° 69/07 Carolina Fugazza Massimo Guidolin Giovanna Nicodano
Investing in Mixed Asset Portfolios: the Ex-Post Performance
N° 70/07 Radha Iyengar Giovanni Mastrobuoni
The Political Economy of the Disability Insurance. Theory and Evidence of Gubernatorial Learning from Social Security Administration Monitoring
N° 71/07 Flavia Coda Moscarola Women participation and caring decisions: do different institutional frameworks matter? A comparison between Italy and The Netherlands
N° 72/08 Annamaria Lusardi Olivia Mitchell
Planning and Financial Literacy: How Do Women Fare?
N° 73/08 Michele Belloni Rob Alessie
The Importance of Financial Incentives on Retirement Choices: New Evidence for Italy
N° 74/08 Maela Giofré Information Asymmetries and Foreign Equity Portfolios: Households versus Financial Investors
N° 75/08 Harold Alderman Johannes Hoogeveen Mariacristina Rossi
Preschool Nutrition and Subsequent Schooling Attainment: Longitudinal Evidence from Tanzania
N° 76/08 Riccardo Calcagno Elsa Fornero Mariacristina Rossi
The Effect of House Prices on Household Saving: The Case of Italy
N° 77/08 Giovanni Guazzarotti Pietro Tommasino
The Annuity Market in an Evolving Pension System: Lessons from Italy
N° 78/08 Margherita Borella Giovanna Segre
Le pensioni dei lavoratori parasubordinati: prospettive dopo un decennio di gestione separata
N° 79/08 Annamaria Lusardi Increasing the Effectiveness of Financial Education in the Workplace
N° 80/08 Claudio Campanale Learning, Ambiguity and Life-Cycle Portfolio Allocation
N° 81/09 Fabio Bagliano Claudio Morana
Permanent and Transitory Dynamics in House Prices and Consumption: Cross-Country Evidence
N° 82/09 Carolina Fugazza Massimo Guidolin Giovanna Nicodano
Time and Risk Diversification in Real Estate Investments: Assessing the Ex Post Economic Value
N° 83/09 Annamaria Lusardi Peter Tufano
Debt Literacy, Financial Experiences, and Overindebtedness
N° 84/09 Luca Spataro Il sistema previdenziale italiano dallo shock petrolifero del 1973 al Trattato di Maastricht del 1993
N° 85/09 Cathal O’Donoghue John Lennon Stephen Hynes
The Life-Cycle Income Analysis Model (LIAM): A Study of a Flexible Dynamic Microsimulation Modelling Computing Framework

N° 86/09 Margherita Borella Flavia Coda Moscarola
Microsimulation of Pension Reforms: Behavioural versus Nonbehavioural Approach
N° 87/09 Elsa Fornero Annamaria Lusardi Chiara Monticone
Adequacy of Saving for Old Age in Europe
N° 88/09 Maela Giofré Convergence of EMU Equity Portfolios
N° 89/09 Elena Vigna Mean-variance inefficiency of CRRA and CARA utility functions for portfolio selection in defined contribution pension schemes
N° 90/09 Annamaria Lusardi Olivia S. Mitchell
How Ordinary Consumers Make Complex Economic Decisions: Financial Literacy and Retirement Readiness
N° 91/09 Annamaria Lusardi Olivia S. Mitchell Vilsa Curto
Financial Literacy among the Young: Evidence and Implications for Consumer Policy
N° 92/10 Rob Alessie Michele Belloni
Retirement choices in Italy: what an option value model tells us
N° 93/10 Mathis Wagner The Heterogeneous Labor Market Effects of Immigration
N° 94/10 John A. List Sally Sadoff Mathis Wagner
So you want to run an experiment, now what? Some Simple Rules of Thumb for Optimal Experimental Design
N° 95/10 Flavia Coda Moscarola Elsa Fornero Mariacristina Rossi
Parents/children “deals”: Inter-Vivos Transfers and Living Proximity
N° 96/10 Riccardo Calcagno Mariacristina Rossi
Portfolio Choice and Precautionary Savings
N° 97/10 Carlo Maccheroni Tiziana Barugola
E se l’aspettativa di vita continuasse la sua crescita? Alcune ipotesi per le generazioni italiane 1950-2005
N° 98/10 Annamaria Lusardi Daniel Schneider Peter Tufano
The Economic Crisis and Medical Care Usage
N° 99/10 Fabio Bagliano Claudio Morana
The effects of US economic and financial crises on euro area convergence
N° 100/10 Laura Piatti Giuseppe Rocco
L’educazione e la comunicazione previdenziale - Il caso italiano
N° 101/10 Tetyana Dubovyk Macroeconomic Aspects of Italian Pension Reforms of 1990s
N° 102/10 Nuno Cassola Claudio Morana
The 2007-? financial crisis: a money market perspective
N° 103/10 Fabio Bagliano Claudio Morana
The Great Recession: US dynamics and spillovers to the world economy
N° 104/11 Ambrogio Rinaldi Pension awareness and nation-wide auto-enrolment: the Italian experience
N° 105/11 Agnese Romiti Immigrants-natives complementarities in production: evidence from Italy
N° 106/11 Annamaria Lusardi Olivia S. Mitchell
Financial Literacy Around the World: An Overview

N° 107/11 Annamaria Lusardi Olivia S. Mitchell
Financial Literacy and Retirement Planning in the United States
N° 108/11 Shizuka Sekita Financial Literacy and Retirement Planning in Japan
N° 109/11 Tabea Bucher-Koenen Annamaria Lusardi
Financial Literacy and Retirement Planning in Germany
N° 110/11 Rob Alessie Maarten Van Rooij Annamaria Lusardi
Financial Literacy, Retirement Preparation and Pension Expectations in the Netherlands
N° 111/11 Elsa Fornero Chiara Monticone
Financial Literacy and Pension Plan Participation in Italy


