WORKING PAPER 2006-03 Resource Economics and Policy Analysis (REPA) Research Group Department of Economics University of Victoria A Dynamic Bioeconomic Model of Ivory Trade: Details and Extended Results G. Cornelis van Kooten July 2006
Transcript
WORKING PAPER 2006-03
Resource Economics
and Policy Analysis (REPA)
Research Group
Department of Economics
University of Victoria
A Dynamic Bioeconomic Model of Ivory Trade: Details and Extended Results
G. Cornelis van Kooten
July 2006
ii
REPA Working Papers: 2003-01 – Compensation for Wildlife Damage: Habitat Conversion, Species Preservation and Local Welfare (Rondeau & Bulte) 2003-02 – Demand for Wildlife Hunting in British Columbia (Sun, van Kooten, & Voss) 2003-03 – Does Inclusion of Landowners’ Non-Market Values Lower Costs of Creating Carbon
Forest Sinks? (Shaikh, Suchánek, Sun, and van Kooten) 2003-04 – Smoke and Mirrors: The Kyoto Protocol and Beyond (van Kooten) 2003-05 – Creating Carbon Offsets in Agriculture through No-Till Cultivation: A Meta-Analysis
of Costs and Carbon Benefits (Manley, van Kooten, Moeltner, and Johnson) 2003-06 – Climate Change and Forest Ecosystem Sinks: Economic Analysis (van Kooten
and Eagle) 2003-07 – Resolving Range Conflict in Nevada? The Potential for Compensation via
Monetary Payouts and Grazing Alternatives (Hobby and van Kooten) 2003-08 – Social Dilemmas and Public Range Management: Results from the Nevada
Ranch Survey (van Kooten, Thomsen, Hobby, and Eagle) 2004-01 – How Costly are Carbon Offsets? A Meta-Analysis of Forest Carbon Sinks (van
Kooten, Eagle, Manley, and Smolak) 2004-02 – Managing Forests for Multiple Tradeoffs: Compromising on Timber, Carbon and
Biodiversity Objectives (Krcmar, van Kooten, and Vertinsky) 2004-03 – Tests of the EKC Hypothesis using CO2 Panel Data (Shi) 2004-04 – Are Log Markets Competitive? Empirical Evidence and Implications for Canada-U.S.
Trade in Softwood Lumber (Niquidet and van Kooten) 2004-05 – Conservation Payments under Risk: A Stochastic Dominance Approach (Benítez,
Kuosmanen, Olschewski and van Kooten) 2004-06 – Modeling Alternative Zoning Strategies in Forest Management (Krcmar, Vertinsky, and van Kooten) 2004-07 – Another Look at the Income Elasticity of Non-Point Source Air Pollutants: A
Semiparametric Approach (Roy and van Kooten) 2004-08 – Anthropogenic and Natural Determinants of the Population of a Sensitive Species: Sage
Grouse in Nevada (van Kooten, Eagle, and Eiswerth) 2004-09 – Demand for Wildlife Hunting in British Columbia (Sun, van Kooten, and Voss) 2004-10 – Viability of Carbon Offset Generating Projects in Boreal Ontario (Biggs and Laaksonen-
Craig) 2004-11 – Economics of Forest and Agricultural Carbon Sinks (van Kooten) 2004-12 – Economic Dynamics of Tree Planting for Carbon Uptake on Marginal Agricultural Lands
(van Kooten) (Copy of paper published in the Canadian Journal of Agricultural Economics 48(March): 51-65.)
2004-13 – Decoupling Farm Payments: Experience in the US, Canada, and Europe (Ogg & van Kooten)
2004–14 – Afforestation Generated Kyoto Compliant Carbon Offsets: A Case Study in Northeastern Ontario (Jeff Biggs)
2005–01 – Utility-scale Wind Power: Impacts of Increased Penetration (Pitt, van Kooten, Love and Djilali)
2005–02 – Integrating Wind Power in Electricity Grids: An Economic Analysis (Liu, van Kooten and Pitt)
iii
2005–03 – Resolving Canada-U.S. Trade Disputes in Agriculture and Forestry: Lessons from Lumber (Biggs, Laaksonen-Craig, Niquidet and van Kooten)
2005–04 – Can Forest Management Strategies Sustain The Development Needs Of The Little Red River Cree First Nation? (Krcmar, Nelson, van Kooten, Vertinsky and Webb)
2005–05 – Economics of Forest and Agricultural Carbon Sinks (van Kooten) 2005–06 – Divergence Between WTA & WTP Revisited: Livestock Grazing on Public Range (Sun,
van Kooten and Voss) 2005–07 – Dynamic Programming and Learning Models for Management of a Nonnative Species
(Eiswerth, van Kooten, Lines and Eagle) 2005–08 – Canada-US Softwood Lumber Trade Revisited: Examining the Role of Substitution Bias
in the Context of a Spatial Price Equilibrium Framework (Mogus, Stennes and van Kooten) 2005–09 – Are Agricultural Values a Reliable Guide in Determining Landowners’ Decisions to
Create Carbon Forest Sinks?* (Shaikh, Sun and van Kooten) *Updated version of Working Paper 2003-03
2005–10 – Carbon Sinks and Reservoirs: The Value of Permanence and Role of Discounting (Benitez and van Kooten)
2005–11 – Fuzzy Logic and Preference Uncertainty in Non-Market Valuation (Sun and van Kooten) 2005–12 – Forest Management Zone Design with a Tabu Search Algorithm (Krcmar, Mitrovic-
Minic, van Kooten and Vertinsky) 2005–13 – Resolving Range Conflict in Nevada? Buyouts and Other Compensation Alternatives
(van Kooten, Thomsen and Hobby) *Updated version of Working Paper 2003-07 2005–14 – Conservation Payments Under Risk: A Stochastic Dominance Approach (Benítez,
Kuosmanen, Olschewski and van Kooten) *Updated version of Working Paper 2004-05 2005–15 – The Effect of Uncertainty on Contingent Valuation Estimates: A Comparison (Shaikh,
Sun and van Kooten) 2005–16 – Land Degradation in Ethiopia: What do Stoves Have to do with it? (Gebreegziabher, van
Kooten and.van Soest) 2005–17 –The Optimal Length of an Agricultural Carbon Contract (Gulati and Vercammen) 2006–01 – Economic Impacts of Yellow Starthistle on California (Eagle, Eiswerth, Johnson,
Schoenig and van Kooten) 2006–02 – The Economics of Wind Power with Energy Storage (Benitez, Dragulescu and
van Kooten) 2006–03 – A Dynamic Bioeconomic Model of Ivory Trade: Details and Extended Results (van
Kooten)
iv
For copies of this or other REPA working papers contact:
REPA Research Group Department of Economics
University of Victoria PO Box 1700 STN CSC Victoria, BC V8W 2Y2 CANADA Ph: 250.472.4415 Fax: 250.721.6214
http://repa.econ.uvic.ca This working paper is made available by the Resource Economics and Policy Analysis (REPA) Research Group at the University of Victoria. REPA working papers have not been peer reviewed and contain preliminary research findings. They shall not be cited without the expressed written consent of the author(s).
A Dynamic Bioeconomic Model of Ivory Trade: Details and Extended Results
G. Cornelis van Kooten Department of Economics University of Victoria, Canada Draft: May 25, 2006 COMMENTS WELCOME ________________________________________________________________________
ABSTRACT
Trade in ivory is banned under CITES in an effort to protect the African elephant. The trade ban is supported by some range states, most notably Kenya, because they see the ban as an effective means for protecting a ‘flagship’ species, one that attracts tourists and foreign aid. It is opposed by some states, mainly in southern Africa, because their elephant populations are exceeding the capacity of local ecosystems with culling and other sources have resulted in the accumulation of large stocks of ivory. They argue that ivory trade will benefit elephant populations. The question of whether an ivory trade ban will protect elephant populations is addressed in this paper using a dynamic partial-equilibrium model that consists of four ivory exporting regions and a single demand region. Results indicate that a trade ban might not be successful in maintaining elephant populations, even if it leads to a stigma effect that reduces demand and increases the marginal costs of marketing ivory. The modeling results suggest that the species will survive only if the non-market value of elephants is taken into account. If rich countries compensate African range states according to marginal willingness to pay for elephants, optimal populations are lower than under an average payment, and, perhaps surprisingly, the interaction between tourism benefits and marginal compensation can lead to the demise of elephants in some regions where this would not occur otherwise. Finally, elephant populations are even projected to crash if range states can operate an effective quota scheme, even one that excludes poaching. Free trade in ivory and effective institutions that translate numbers of elephants into monetary payments may be the best hope for the elephant. Key Words: economics of elephant conservation; economics of ivory trade; trade bans;
cartels and quota
I. BACKGROUND
Ivory has been a traded commodity since at least Old Testament times – King Solomon’s ships brought back ivory from Africa (I Kings 10:22) and his palace was inlaid with ivory (I Kings 22:39). Ivory was “commercially exploited by the Romans in ancient times and later by Arab traders and Europeans. ... Between 1890 and 1900, nearly 3.7 million kg of ivory were traded in the London market alone, ... and some 60,000 elephants
reached European markets every year during that period” (Blanc et al. 2002, p.15). Ivory exports from Africa had increased by 400% between 1850 and 1875, but losses in West Africa were particularly high, with the region dubbed the ‘ivory coast’ for good reason (Fischer 2005). As human population expanded during the 20th Century, elephants were increasingly ‘confined’ to protected areas.1 Beginning sometime in the 1960s or early 1970s, speculation grew that a complex combination of commercial trade and human-elephant interactions were causing a serious decline in elephant numbers. In Ivory Coast, for example, there were an estimated 1790 savanna and 3050 forest elephants in 41 isolated groups in 1984, but this declined to approximately 270 total elephants in perhaps 20 isolated groups by the early 2000s; numbers were reported to be declining at a rate of 300 poached and 90 legally killed elephants per year between 1976 and 1984, with poaching continuing to the present (Fischer 2005).2
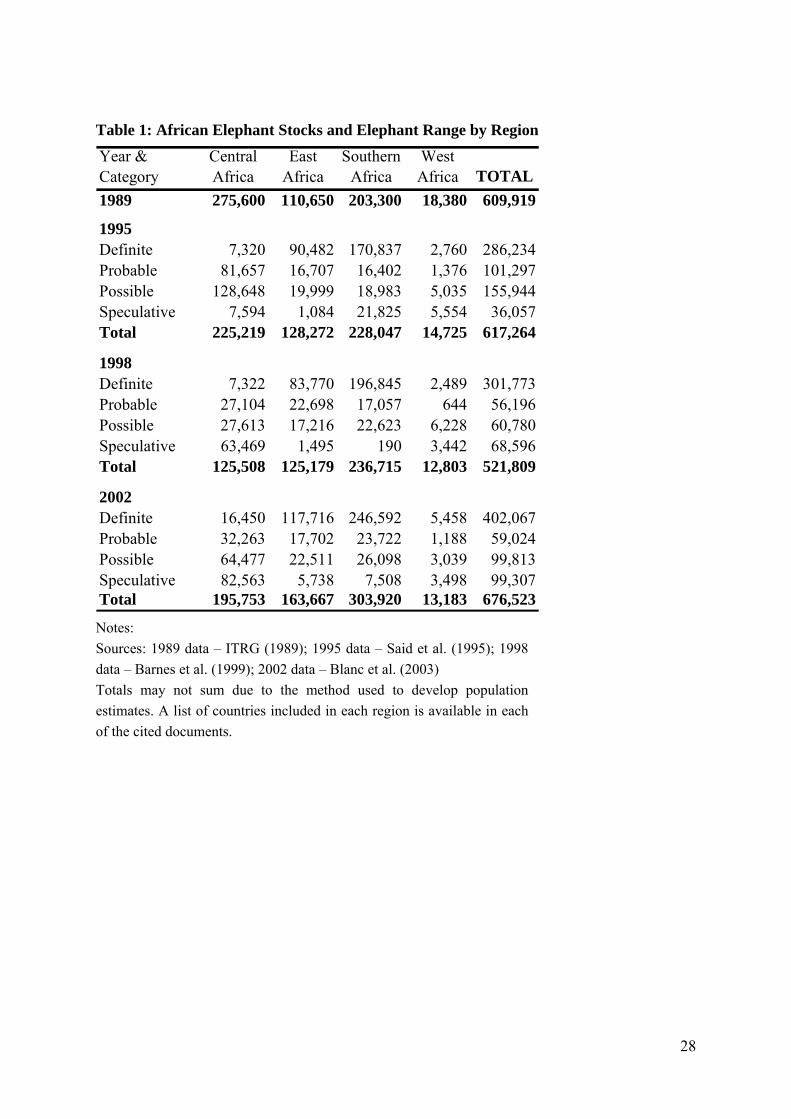
Iain Douglas-Hamilton was the first to compile data on elephant range, numbers and trends in the 1970s and 1980s (Burrill and Douglas-Hamilton 1987; Douglas-Hamilton 1977-1979, 1993), but the first continent-wide population estimates became available in 1987 and are reported in Table 1 as 1989 estimates (see ITRG 1989).3 A comparison of first and subsequent estimates suggests that elephant populations in some areas may have fallen by half between 1981 and 1987 (Said et al. 1995, p.1); researchers speculate that the African elephant (Laxadonta africana) declined in population from 1.2 million to 600,000 elephants in one decade, although the supporting evidence for this is sparse (Barnes et al. 1999; Blanc et al. 2002). The magnitude of the estimated drop in numbers is difficult to believe because of the large scale of killings this would have entailed.
Trade in ivory became regulated under the 1973 United Nations’ Convention on International Trade in Endangered Species of Wild Fauna and Flora (CITES). CITES regulates commercial trade in endangered species using a ranking scheme: Appendix I contains species banned from international commercial trade; Appendix II lists species that may be traded but for which export permits are needed (issued at the discretion of the exporting state); and Appendix III includes species that are threatened and could become endangered in the future. Importing countries agree not to trade in species (or parts of or products from species) listed in Appendix I, and ensure that proper export permits accompany imports of species listed under Appendix II. States can apply sanctions on species listed under Appendix III at their discretion.
Several modifications have been made to CITES that have had an impact on the status of the African elephant. In 1981, a provision was added at New Delhi (Conference
1 Elephants appear to know the boundaries between hunting zones and protected areas, having been observed to dash to and from watering holes located in the hunting zone and visibly relaxing again once inside the park boundary (Scully 2002, p.87). 2 Fischer quotes data from Roth and Douglas-Hamilton (1991) and Barnes (1999) among others. 3 These are likely an update of the 1987 values. Interestingly, funding for this research was provided primarily by the U.S. Fish and Wildlife Service.
2
Resolution 3.15) that would permit transfer of certain populations from Appendix I (no trade) to Appendix II (limited trade) for the purposes of sustainable resource management, a provision that became known as the ‘ranching criterion’. In 1985, Resolution 5.21 provided for the systematic re-listing of species from Appendix I to II in cases where countries of origin could agree on a quota system that would enable countries to manage species sustainably. There was no provision for external (third-party) verification/control as quota was to be determined solely by participating states. At the same time, under Resolution 5.12, a Management Quota System (MQS) was created for the African elephant. The MQS relied solely on management decisions taken by the producing countries, with consuming (second-party) states agreeing to prohibit imports of ivory (and other elephant products) from these countries unless accompanied by an MQS permit. There were no externally enforced incentives for sustainable use, with most states basing their quotas on expected confiscations of poached ivory. Since consumer states could obtain ivory from non-MSQ states without question, and due to lack of border controls on illegal ivory, public confidence in the MQS failed and, in 1989, the elephant was moved to Appendix I status despite a population of around 600,000 elephants (Table 1), well above what might be considered a minimum viable population for survival of the species.4
Five southern African elephant range states – Zimbabwe, Namibia, Botswana, Malawi and South Africa – have generally opposed the Appendix I listing, because they have relatively large elephant stocks and elephants have become a nuisance in some Parks. These countries lobbied unsuccessfully in 1990 and 1994 to down-list their populations and re-open (limited) trade in ivory and other elephant products. While lifting the restrictions on trade is unlikely to happen in the short run, lobbying by the five southern African countries resulted in a decision in June 1997 (based on Resolutions 3.15 and 5.21), to permit Botswana, Namibia and Zimbabwe to sell off nearly 50 tons of stockpiled ivory on a one-time basis. This constituted less than 60% of the ivory that these countries had accumulated as a result of confiscations from poachers, natural mortality, culling and destruction of problem animals. The ivory was sold to Japan in 1999 at a price of US$103 per kg.5 At COP12, in 2002, another one-off sale by Botswana, Namibia and South Africa was approved, but that sale had not yet been completed by the end of 2004. These one-off sales have re-opened debates about how the African elephant is to be sustainably managed,
4 Soulé (1987) suggests that 2000 animals are adequate to ensure survival of a large mammal species (although with great expense a species can recover even from small populations), while Kontoleon and Swanson (2003) use a minimum viable population of 500 for the Giant Panda. 5 Citing Milliken (African Elephants and the Eleventh Meeting of the Conference of the Parties to CITES, TRAFFIC Network Briefing Doc., www.traffic.org/briefings/elephants-11thmeeting.html), Bulte, Horan and Shogren (2001) indicate that COP10 agreed to permit non-commercial donors to buy ivory from stockpiles to enable range states to reduce their financial and security liabilities associated with the stockpiles, under the proviso that none of the ivory purchased in this way gets re-sold in any form at any future date. Other than the Japanese purchase, we know of no other purchases that have taken place.
3
and what role trade will play.
Population data presented in Table 1 suggest that the ivory trade ban has had at least some success. The rapid decline in elephant abundance that is thought to have occurred prior to and during the 1980s appears to have been halted, and indeed may even have been reversed. However, the underlying data for any such conclusion are not very good – estimates of elephant populations are contentious at best; few reliable estimates are available before 1989, and even those in Table 1 are categorized according to whether estimates are ‘definite’, ‘probable’, ‘possible’ or ‘speculative’. Further, the area surveyed in each of the four years varied, being lowest for the 1998 population estimates. Thus, population trends are indicative at best.
The ivory trade ban remains controversial. Critics of the ban allege that endangered species might be placed at risk by the perverse incentives that a trade ban generates. Banning trade makes elephant conservation a less attractive activity, inadvertently promoting conversion of elephant habitat to other uses. In addition, by reducing or entirely eliminating revenues from elephant management and exploitation, a trade ban might undermine the incentive to manage the stock carefully and enforce property rights to elephants and/or their habitat (see Bulte, van Kooten and Swanson 2003). Conversely, supporters of the trade ban argue that enforcing property rights and sustainable harvesting regimes in (semi-) open access habitats is difficult and expensive. Hence, trade may stimulate illegal harvesting. In addition, it is suggested that the legal trade may facilitate the laundering of illegal ivory products.
The purpose in this paper is to investigate the effects of the ivory trade ban on elephant stocks compared to the situation where trade is permitted. As long as rents from elephant exploitation remain in place (so the marginal benefits of harvesting elephants and marketing ivory exceed the marginal costs), a trade ban is unable to prevent some harvest of elephants and the sale of ivory in international markets. International poaching gangs will be able to capture some of the rent and market ivory through a variety of channels. However, the marginal costs of providing ivory will likely be higher under a trade ban than under legal trade, while demand will be reduced because some potential buyers will have a stigma against purchases of ivory (Fischer 2004). Under legal trade, the marginal costs of providing ivory will be lower, while the stigma factor will no longer apply as buyers assume elephant populations are being managed sustainably.
We develop a dynamic bioeconomic mathematical programming model of ivory trade with four African exporting regions and one global importing region. Africa is divided into four regions because of differences in the size of their elephant populations, the institutional and biological challenges to protecting elephant stocks, the extent of poaching, and the importance of elephants in attracting tourists. The model is used in this paper to study the impacts of various institutional arrangements on economic well being and elephant numbers. In particular, if property rights to elephants can be clearly defined, there may be alternative institutional arrangements that lead to larger elephant numbers and a
4
lower chance that the African elephant becomes extinct. One possibility is a quota regime, such as the MQS, but with stronger enforcement. A regime that permits sales of ivory but also pays elephant ‘owners’ according to the actual size of the elephant stock in a country may lead to greater holdings of elephants while providing ‘owners’ with revenues to police elephant herds against poachers. Different regimes are investigated to determine whether the trade ban is indeed the ‘best’ means to protect elephants. Results indicate that neither free trade nor a quota system can effectively protect the elephant unless accompanied by conservation payments from rich countries to range states or recognition that elephants provide important tourism benefits, or both. Since conservation payments are unlikely at this time, a trade ban appears to be the most effective policy for maintaining elephant herds in African range states where tourism is of little importance or the link between elephants and tourism benefits is not properly recognized.
A theoretical model of ivory trade is presented in the next section, while the mathematical programming formulations are described in section III. How the programming model is parameterized is the subject of section IV, while results of alternative policy options and views about the effect of trade on demand and (legal and illegal) supply are provided in section V. The conclusions ensue.
II. IVORY TRADE MODEL
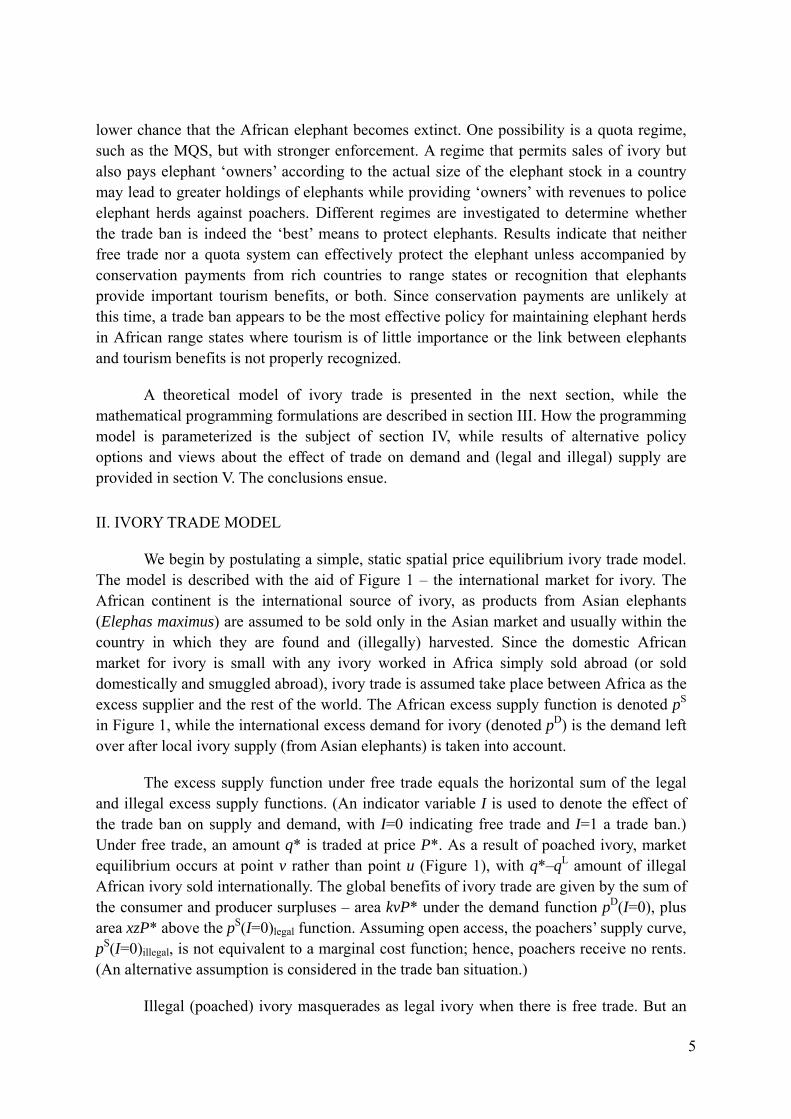
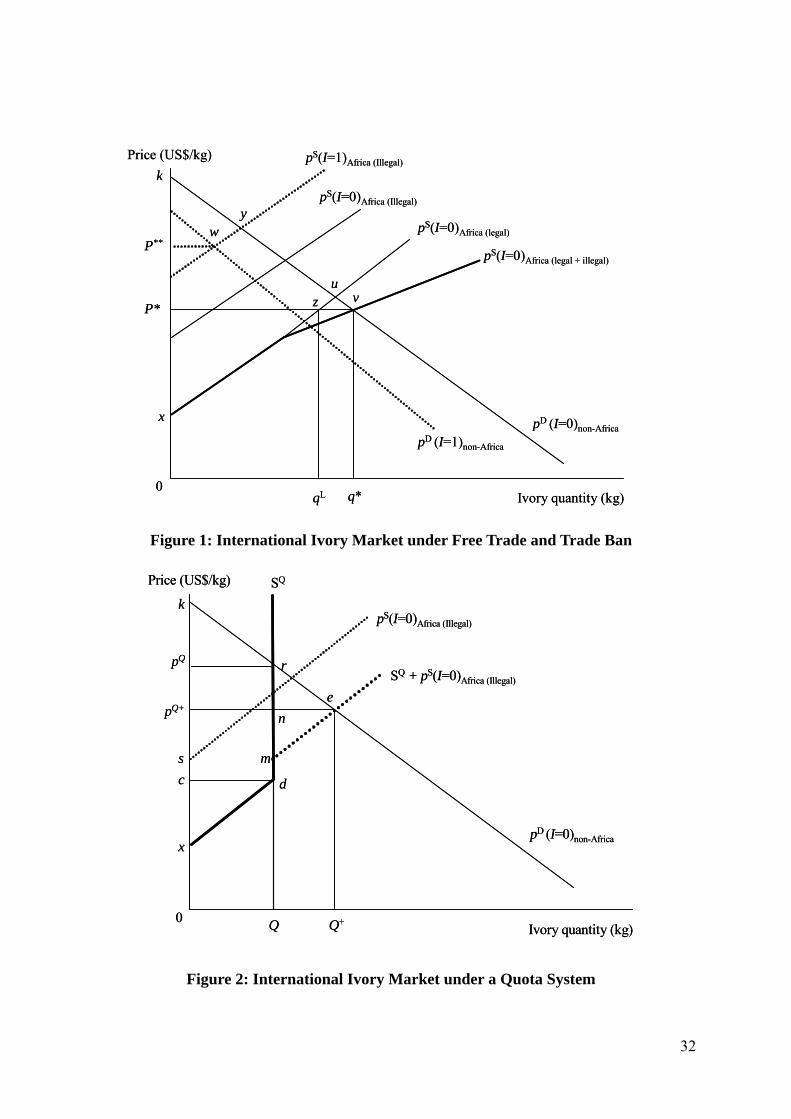
We begin by postulating a simple, static spatial price equilibrium ivory trade model. The model is described with the aid of Figure 1 – the international market for ivory. The African continent is the international source of ivory, as products from Asian elephants (Elephas maximus) are assumed to be sold only in the Asian market and usually within the country in which they are found and (illegally) harvested. Since the domestic African market for ivory is small with any ivory worked in Africa simply sold abroad (or sold domestically and smuggled abroad), ivory trade is assumed take place between Africa as the excess supplier and the rest of the world. The African excess supply function is denoted pS in Figure 1, while the international excess demand for ivory (denoted pD) is the demand left over after local ivory supply (from Asian elephants) is taken into account.
The excess supply function under free trade equals the horizontal sum of the legal and illegal excess supply functions. (An indicator variable I is used to denote the effect of the trade ban on supply and demand, with I=0 indicating free trade and I=1 a trade ban.) Under free trade, an amount q* is traded at price P*. As a result of poached ivory, market equilibrium occurs at point v rather than point u (Figure 1), with q*–qL amount of illegal African ivory sold internationally. The global benefits of ivory trade are given by the sum of the consumer and producer surpluses – area kvP* under the demand function pD(I=0), plus area xzP* above the pS(I=0)legal function. Assuming open access, the poachers’ supply curve, pS(I=0)illegal, is not equivalent to a marginal cost function; hence, poachers receive no rents. (An alternative assumption is considered in the trade ban situation.)
Illegal (poached) ivory masquerades as legal ivory when there is free trade. But an
5
ivory trade ban does not halt all trade in ivory, although it does have two effects: First, the poachers’ supply function shifts upwards as the transaction costs of marketing ivory increase. While poachers always incur costs associated with illegal activities (e.g., avoiding anti-poaching patrols), costs of illegal activities increase as the costs of finding buyers and avoiding ban-imposed custom controls rise. Second, a trade ban shifts the (excess) demand function inwards because the ban creates a stigma associated with the purchase of things made from ivory (Fischer 2004). Under a trade ban competitive equilibrium occurs at w, although it would occur at y if there were no stigma effect or added marketing costs for poachers. What worries many environmental groups is that removal of trade restrictions will reduce the stigma of buying and owning ivory, implying greater numbers of elephants being harvested (at equilibrium v rather than w).
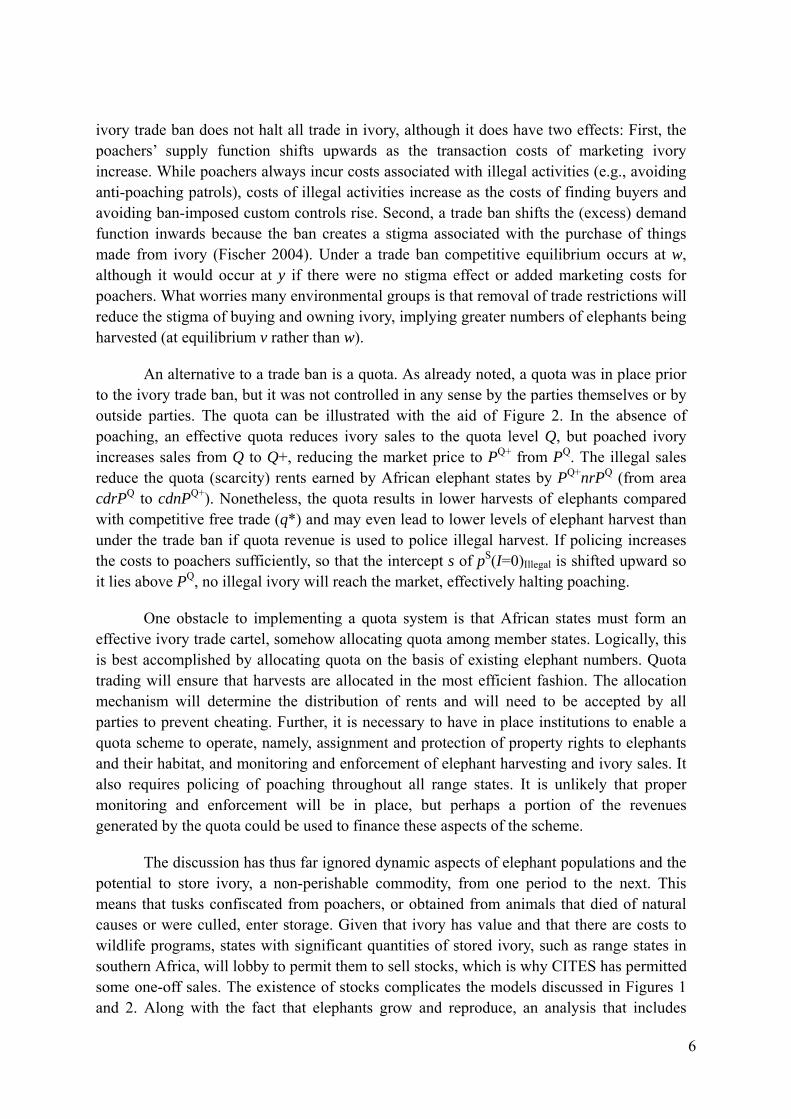
An alternative to a trade ban is a quota. As already noted, a quota was in place prior to the ivory trade ban, but it was not controlled in any sense by the parties themselves or by outside parties. The quota can be illustrated with the aid of Figure 2. In the absence of poaching, an effective quota reduces ivory sales to the quota level Q, but poached ivory increases sales from Q to Q+, reducing the market price to PP
Q+ from PQP . The illegal sales
reduce the quota (scarcity) rents earned by African elephant states by PP
Q+nrPQ (from area cdrPQ to cdnPQ+). Nonetheless, the quota results in lower harvests of elephants compared with competitive free trade (q*) and may even lead to lower levels of elephant harvest than under the trade ban if quota revenue is used to police illegal harvest. If policing increases the costs to poachers sufficiently, so that the intercept s of pS(I=0) is shifted upward so it lies above PQ
Illegal
P , no illegal ivory will reach the market, effectively halting poaching.
One obstacle to implementing a quota system is that African states must form an effective ivory trade cartel, somehow allocating quota among member states. Logically, this is best accomplished by allocating quota on the basis of existing elephant numbers. Quota trading will ensure that harvests are allocated in the most efficient fashion. The allocation mechanism will determine the distribution of rents and will need to be accepted by all parties to prevent cheating. Further, it is necessary to have in place institutions to enable a quota scheme to operate, namely, assignment and protection of property rights to elephants and their habitat, and monitoring and enforcement of elephant harvesting and ivory sales. It also requires policing of poaching throughout all range states. It is unlikely that proper monitoring and enforcement will be in place, but perhaps a portion of the revenues generated by the quota could be used to finance these aspects of the scheme.
The discussion has thus far ignored dynamic aspects of elephant populations and the potential to store ivory, a non-perishable commodity, from one period to the next. This means that tusks confiscated from poachers, or obtained from animals that died of natural causes or were culled, enter storage. Given that ivory has value and that there are costs to wildlife programs, states with significant quantities of stored ivory, such as range states in southern Africa, will lobby to permit them to sell stocks, which is why CITES has permitted some one-off sales. The existence of stocks complicates the models discussed in Figures 1 and 2. Along with the fact that elephants grow and reproduce, an analysis that includes
6
ivory stocks is necessarily dynamic (since user costs of current harvests on future populations and harvests must be taken into account). Hence, a dynamic mathematical programming approach is used.
Another aspect not considered in the spatial price equilibrium model is the non-market component to ivory trade, namely, the elephant’s role as a flagship species for attracting tourists and the willingness of the international community to protect elephants in situ, which is one reason for the ban on ivory trade. The ivory trade model needs to incorporate potential payments by rich (European and North American) countries to African states on the basis of the numbers of elephants that are retained in situ. To be effective, however, payments must be made to those with property rights to elephants and/or their habitat. It is the owners, whether states, individuals or communities, that need to have appropriate incentives to harvest or protect elephants. Payments to protect elephants will increase numbers beyond what they are currently, or at least possibly preventing elephants from being added to the list of endangered species.
III. MODEL FORMULATION
Consider first an idealized dynamic bioeconomic model in which the global net benefits from ivory trade and elephant conservation are maximized over time. There is one net consuming region and several regions that ‘produce’ elephants (range states) and market ivory. Initially there is no poaching, and institutions are such that payments from rich countries to range states for elephant conservation have the desired conservation effect. The model is modified to include poaching and then expanded to examine the failure of conservation payments, the potential of a quota regime, and the costs and benefits of an ivory trade ban. Compared to Fischer (2004), the advantage of the current approach is that it permits richer detail, although many of her results are confirmed.
The model also permits countries (but not poachers) to store ivory, which they will do under free trade as long as the expected increase in price exceeds the costs of holding stocks. Under a trade ban, stock holding is non-voluntary. Kremer and Morcom (2000), and Bulte, Horan and Shogren (2001), also consider the interplay between elephant harvests and ivory stocks. They point out that: (1) governments can use stockpiled ivory as a threat against poachers – threatening to release ivory and drive prices low enough to stop poaching; and (2) it might be possible for an agent to hoard sufficient stocks to make it worthwhile for the agent to drive elephants to extinction. These researchers provide no evidence that either of these outcomes is likely, but extinction of elephants dominates conservation in all the realistic scenarios they examine and it never appears to pay for an agent to hoard ivory.
Our objective is to maximize the discounted net global benefits of selling ivory and conserving elephants over some planning horizon. It is given by the sum of consumer and producer surpluses from marketing and selling ivory, ivory storage costs, elephant harvest costs, the spillover costs elephants impose on the ecosystem (here taken to be landowners), benefits from tourism, and the off-site preservation benefits of keeping elephants in situ:
7
(1) . [ ]∑ ∑∫ ∑ ∫= == ⎥
⎥⎦
⎤
⎢⎢⎣
⎡−+−−−+
∑−
T
ttt
N
jtjtjtj
q N
j
qdt
tjtjxBIxDsShIkxRdaaIcdqqIp
hqMax tj tj
1 1,,,
0 1 0,,)()1()()()(),(),(
,
, ,
β
Here pd(I, q) is the inverse (excess) demand function for ivory; qj,t is the quantity of ivory at time t made available for sale on the international market by region j (of which there are N); I is an indicator variable set equal to 1 when trade is prohibited and 0 otherwise; and c(I, a), where a is an integration variable, is the marginal cost function associated with the production and marketing of ivory once elephants (denoted by x) have been harvested (denoted h). Thus, the first two terms in expression (1) are the consumer surplus plus the quasi-rent accruing to ivory sellers. Note that the marginal cost function is not quite the same as the supply function, pS(I) in Figure 1, because it does not include elephant harvesting and opportunity costs that are taken into account by the other terms in (1). In expression (1), k(I) is the per unit cost of harvesting animals and s is a fixed cost of holding ivory stocks (S). Given the importance of elephants in attracting tourists, which is of greater relevance in some regions of Africa than others, R(xj,t) is a function linking elephant numbers to a region’s tourism benefits. D(xt) is a measure of the damage elephants impose on the ecosystem, and B(xt) is conservation or in situ
benefits that elephants provide at time t, with xt = . The cost of harvesting elephants is
not density dependent as elephants are quite large and assumed to be easily tracked, but the cost is higher when trade is banned and poaching occurs. The factor β=1/(1+δ), where δ is the social rate of discount, is used to discount future returns.
∑=
N
jtjx
1,
At any time, the stock of ivory in a given region, Sj,t, will depend on the stock in the preceding period plus additions to the stock from elephant ‘harvests’ minus any sales of ivory. For convenience, it is assumed that no stocks of ivory are held outside of the elephant range states. Elephant harvests may be the result of decisions to eliminate troublesome animals, cull animals because there are too many for the particular ecosystem, or simply harvest animals for sale of ivory, as well as incidental take due to natural mortality or confiscations of illegal ivory. The stock equation is given by:
where γ is a parameter that converts elephants to ivory. Countries can sell ivory or hold it until a later period, but sales of ivory cannot exceed available stocks in any period:
(3) qj,t ≤ Sj,t, . (Sales of ivory cannot exceed available stock) tj,∀
In addition to a stock constraint, an equation is needed to describe the growth and harvest of elephant populations:
where g(xj,t) is the elephant growth function that might exhibit logistic or depensational growth (van Kooten and Bulte 2000, pp.184-189). It is discussed in greater detail below.
For each region, initial (opening) stocks of ivory and elephants need to be identified:
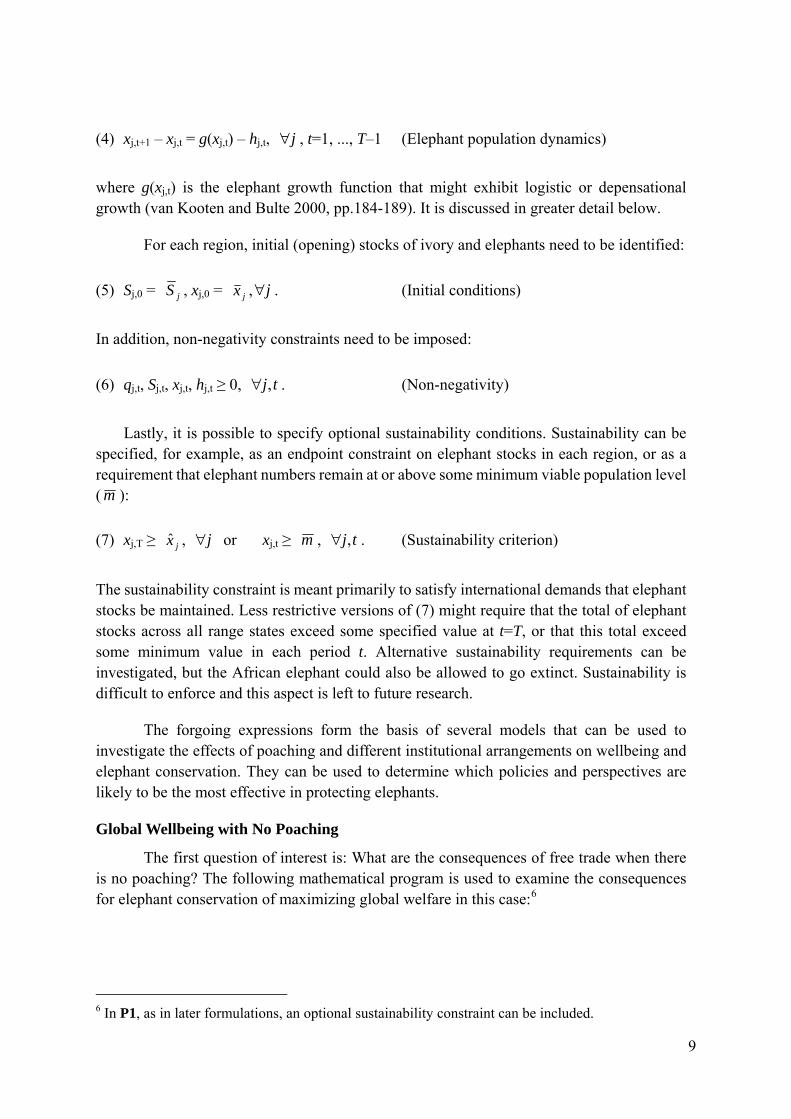
Lastly, it is possible to specify optional sustainability conditions. Sustainability can be specified, for example, as an endpoint constraint on elephant stocks in each region, or as a requirement that elephant numbers remain at or above some minimum viable population level ( m ):
(7) xj,T ≥ , or xjx̂ j∀ j,t ≥ m , tj,∀ . (Sustainability criterion)
The sustainability constraint is meant primarily to satisfy international demands that elephant stocks be maintained. Less restrictive versions of (7) might require that the total of elephant stocks across all range states exceed some specified value at t=T, or that this total exceed some minimum value in each period t. Alternative sustainability requirements can be investigated, but the African elephant could also be allowed to go extinct. Sustainability is difficult to enforce and this aspect is left to future research.
The forgoing expressions form the basis of several models that can be used to investigate the effects of poaching and different institutional arrangements on wellbeing and elephant conservation. They can be used to determine which policies and perspectives are likely to be the most effective in protecting elephants.
Global Wellbeing with No Poaching
The first question of interest is: What are the consequences of free trade when there is no poaching? The following mathematical program is used to examine the consequences for elephant conservation of maximizing global welfare in this case:6
6 In P1, as in later formulations, an optional sustainability constraint can be included.
9
P1:
[ ]∑ ∑∫ ∑ ∫= == ⎥
⎥⎦
⎤
⎢⎢⎣
⎡+−−−+
∑−
T
ttt
N
jtjtjtj
q N
j
qdt
tjtjxBxDsShkxRdaacdqqp
hqMax tj tj
1 1,,,
0 1 0,,)()()0()(),0(),0(
,
, ,
β
Subject to: (2), (3), (4), (5), and (6).
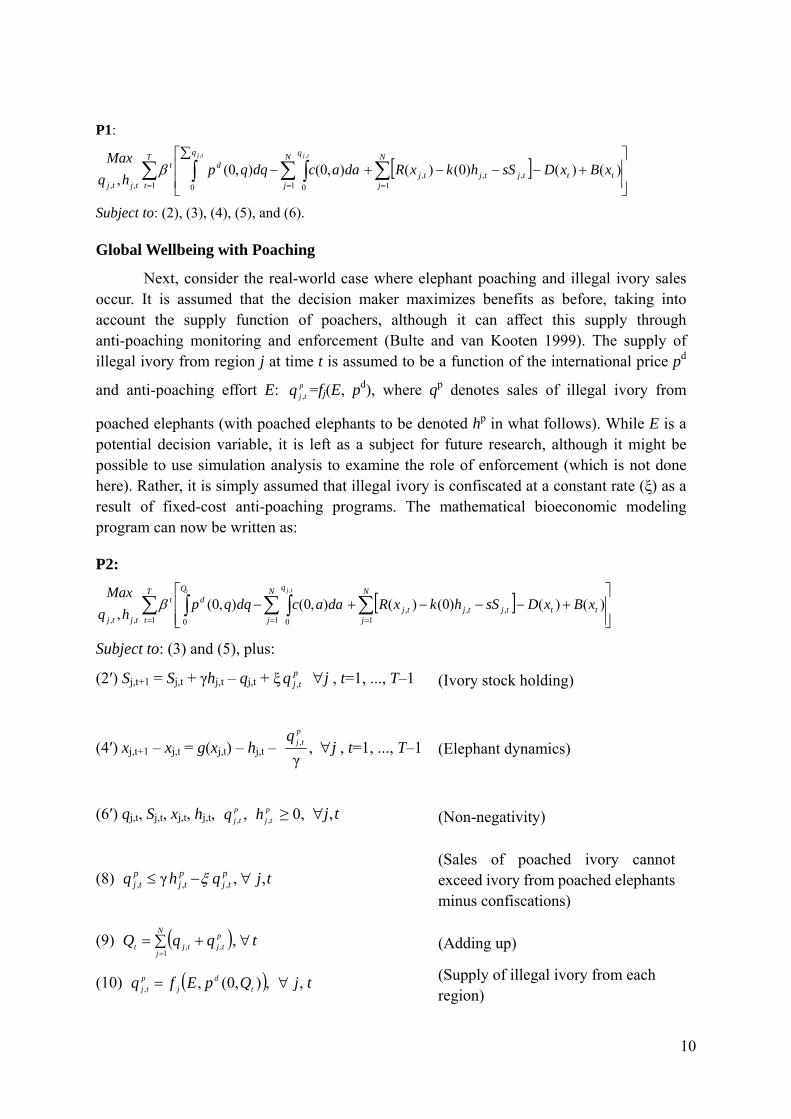
Global Wellbeing with Poaching
Next, consider the real-world case where elephant poaching and illegal ivory sales occur. It is assumed that the decision maker maximizes benefits as before, taking into account the supply function of poachers, although it can affect this supply through anti-poaching monitoring and enforcement (Bulte and van Kooten 1999). The supply of illegal ivory from region j at time t is assumed to be a function of the international price pd
and anti-poaching effort E: =fptjq , j(E, pd), where qp denotes sales of illegal ivory from
poached elephants (with poached elephants to be denoted hp in what follows). While E is a potential decision variable, it is left as a subject for future research, although it might be possible to use simulation analysis to examine the role of enforcement (which is not done here). Rather, it is simply assumed that illegal ivory is confiscated at a constant rate (ξ) as a result of fixed-cost anti-poaching programs. The mathematical bioeconomic modeling program can now be written as:
(Sales of poached ivory cannot exceed ivory from poached elephants minus confiscations)
(9) ( ) tqqQN
j
ptjtjt ∀∑ +=
=,
1,, (Adding up)
(10) ( ) tjQpEfq td
jp
tj ,,),0(,, ∀= (Supply of illegal ivory from each region)
10
Constraint (8) is required so that sales of illegal ivory cannot exceed ivory available from poached elephants; it is assumed that illegal ivory is sold in the same period the poached elephants are killed and that poachers do not stockpile ivory (although some of the poached ivory is confiscated). Relaxation of this assumption is a topic for future research. Constraints (9) and (10) determine the global price of ivory and the amounts of illegal ivory sold by each region.7 The last term in (4′) indicates the number of elephants that poachers would harvest. It is also assumed that poachers do not hold ivory stocks but that confiscated ivory enters stocks.
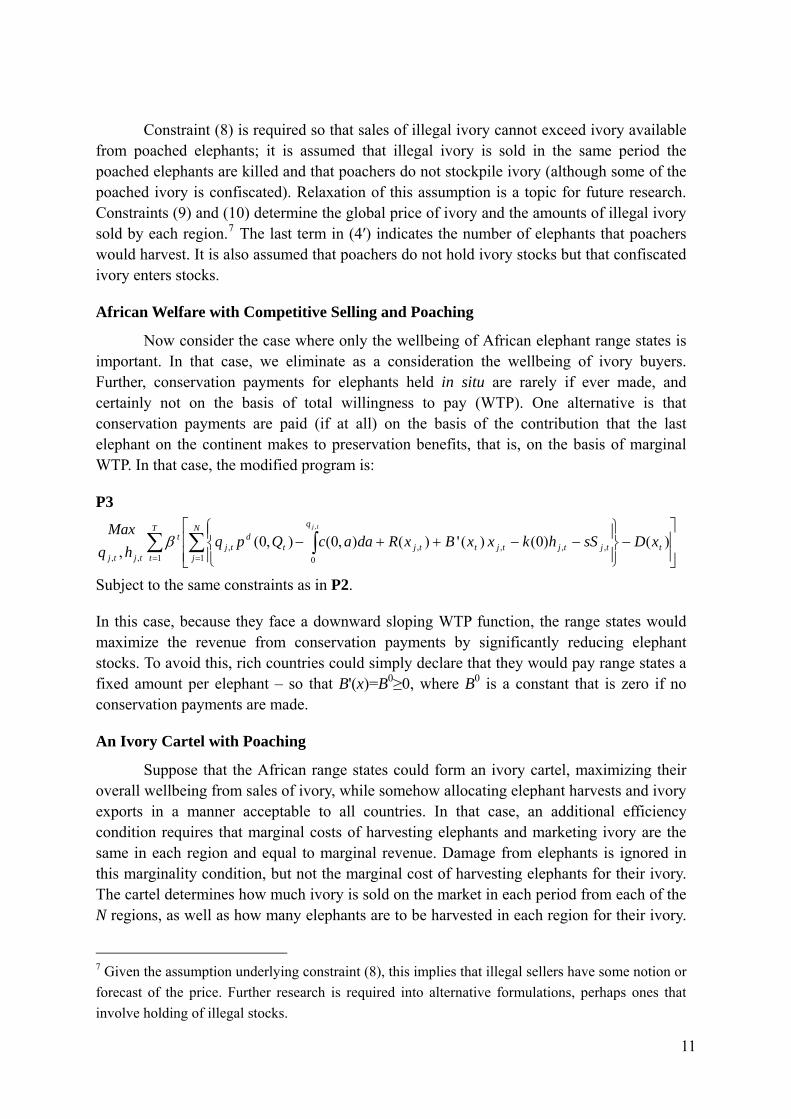
African Welfare with Competitive Selling and Poaching
Now consider the case where only the wellbeing of African elephant range states is important. In that case, we eliminate as a consideration the wellbeing of ivory buyers. Further, conservation payments for elephants held in situ are rarely if ever made, and certainly not on the basis of total willingness to pay (WTP). One alternative is that conservation payments are paid (if at all) on the basis of the contribution that the last elephant on the continent makes to preservation benefits, that is, on the basis of marginal WTP. In that case, the modified program is:
P3
∑ ∑ ∫= = ⎥
⎥⎦
⎤
⎢⎢⎣
⎡−
⎪⎭
⎪⎬⎫
⎪⎩
⎪⎨⎧
−−++−T
tt
N
jtjtjtjttj
q
td
tjt
tjtjxDsShkxxBxRdaacQpq
hqMax tj
1 1,,,,
0,
,,)()0()(')(),0(),0(
,
,
β
Subject to the same constraints as in P2.
In this case, because they face a downward sloping WTP function, the range states would maximize the revenue from conservation payments by significantly reducing elephant stocks. To avoid this, rich countries could simply declare that they would pay range states a fixed amount per elephant – so that B'(x)=B0≥0, where B0 is a constant that is zero if no conservation payments are made.
An Ivory Cartel with Poaching
Suppose that the African range states could form an ivory cartel, maximizing their overall wellbeing from sales of ivory, while somehow allocating elephant harvests and ivory exports in a manner acceptable to all countries. In that case, an additional efficiency condition requires that marginal costs of harvesting elephants and marketing ivory are the same in each region and equal to marginal revenue. Damage from elephants is ignored in this marginality condition, but not the marginal cost of harvesting elephants for their ivory. The cartel determines how much ivory is sold on the market in each period from each of the N regions, as well as how many elephants are to be harvested in each region for their ivory.
7 Given the assumption underlying constraint (8), this implies that illegal sellers have some notion or forecast of the price. Further research is required into alternative formulations, perhaps ones that involve holding of illegal stocks.
11
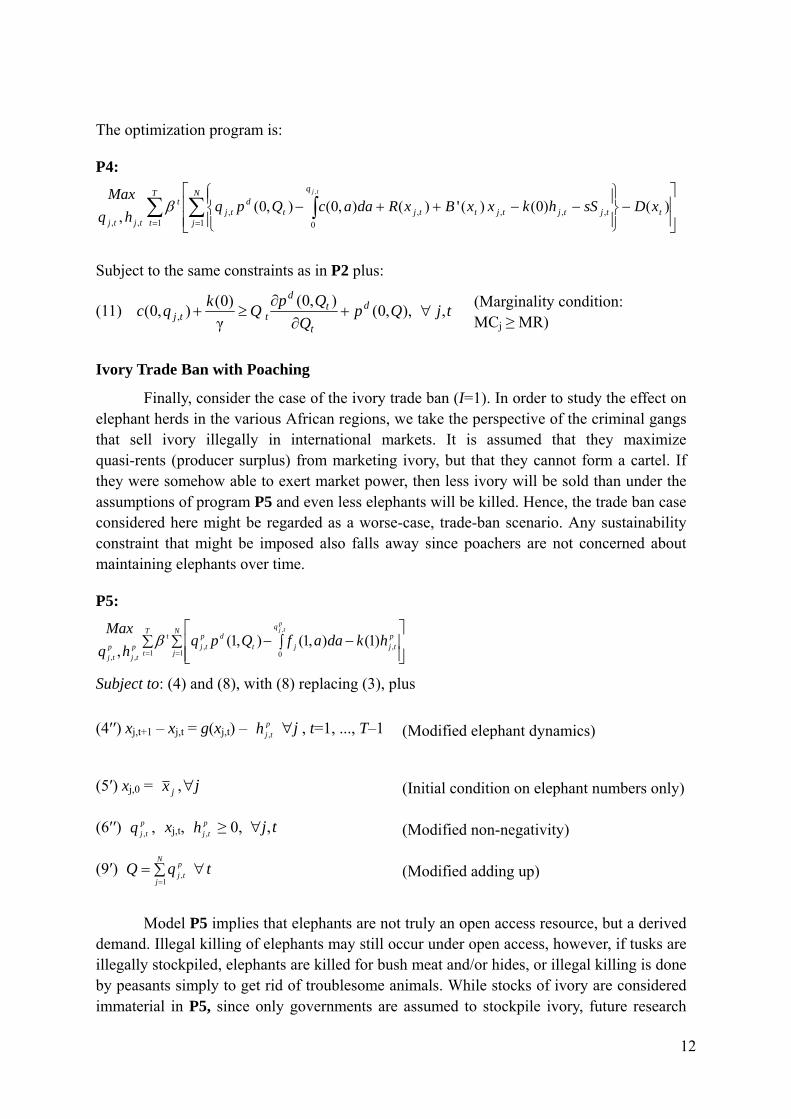
The optimization program is:
P4:
∑ ∑ ∫= = ⎥
⎥⎦
⎤
⎢⎢⎣
⎡−
⎪⎭
⎪⎬⎫
⎪⎩
⎪⎨⎧
−−++−T
tt
N
jtjtjtjttj
q
td
tjt
tjtjxDsShkxxBxRdaacQpq
hqMax tj
1 1,,,,
0,
,,)()0()(')(),0(),0(
,
,
β
Subject to the same constraints as in P2 plus:
(11) tjQpQ
QpQkqc d
t
td
ttj ,),,0(),0(γ
)0(),0( , ∀+∂
∂≥+ (Marginality condition:
MCj ≥ MR)
Ivory Trade Ban with Poaching
Finally, consider the case of the ivory trade ban (I=1). In order to study the effect on elephant herds in the various African regions, we take the perspective of the criminal gangs that sell ivory illegally in international markets. It is assumed that they maximize quasi-rents (producer surplus) from marketing ivory, but that they cannot form a cartel. If they were somehow able to exert market power, then less ivory will be sold than under the assumptions of program P5 and even less elephants will be killed. Hence, the trade ban case considered here might be regarded as a worse-case, trade-ban scenario. Any sustainability constraint that might be imposed also falls away since poachers are not concerned about maintaining elephants over time.
P5:
∑ ∑⎥⎥⎦
⎤
⎢⎢⎣
⎡−∫−
= =
T
t
N
j
ptj
q
jtdp
tjt
ptj
ptj
hkdaafQpqhq
Max ptj
1 1,
0,
,,
)1(),1(),1(,
,
β
Subject to: (4) and (8), with (8) replacing (3), plus
Model P5 implies that elephants are not truly an open access resource, but a derived
demand. Illegal killing of elephants may still occur under open access, however, if tusks are illegally stockpiled, elephants are killed for bush meat and/or hides, or illegal killing is done by peasants simply to get rid of troublesome animals. While stocks of ivory are considered immaterial in P5, since only governments are assumed to stockpile ivory, future research
12
might be able to separate illegal and legal stock holding, thereby enabling ‘criminals’ to hold ivory stocks as a hedge against unforeseen future price changes, for example.
IV. DATA AND MODEL PARAMETERIZATION
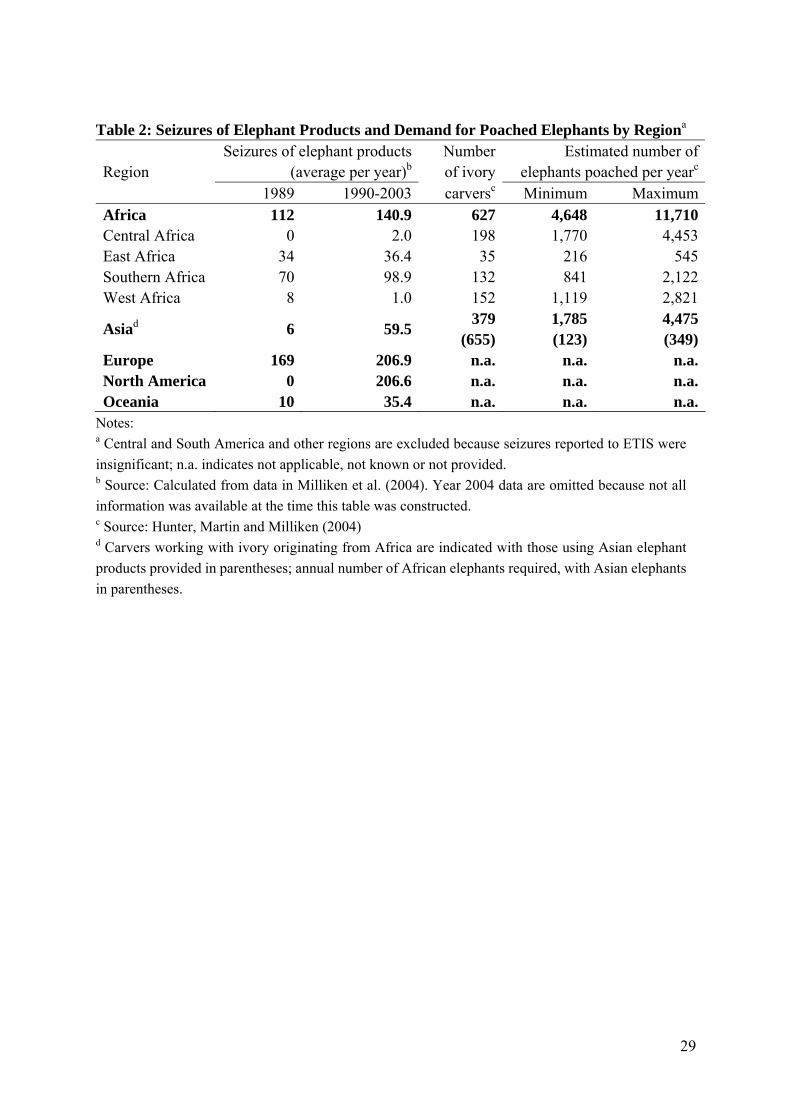
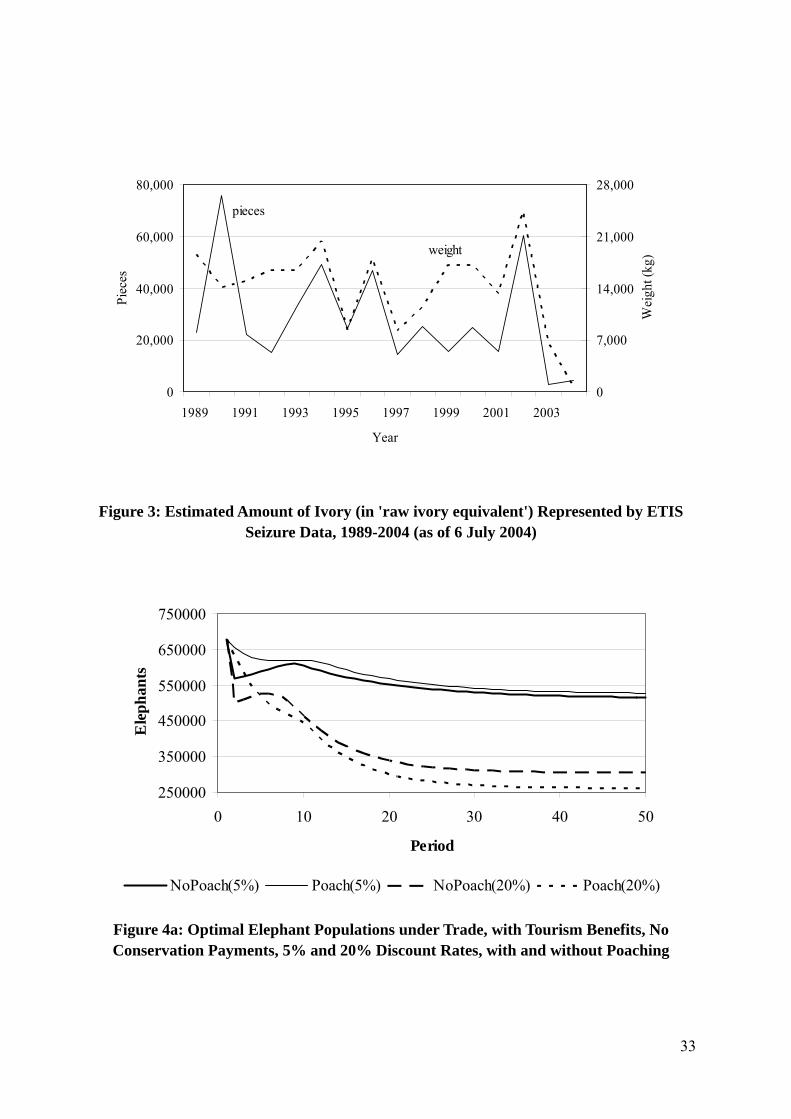
A major problem in implementing the forgoing models concerns the availability of data. Few data are available and much of that is based on local observations in range states (e.g., Menon 2002). The IUCN Species Survival Commission has tracked elephant numbers for the past decade and a half (ITGR 1989; Said et al. 1995; Barnes et al. 1999; Blanc et al. 2003), while the international community has implemented Monitoring the Illegal Kill of Elephants (MIKE) and the Elephant Trade Information System (ETIS) to keep an eye on illegal activities exacerbated by the trade ban. MIKE started in October 2001 and is managed by the CITES Secretariat through a Central Coordinating Unit headed by a Director based in Nairobi, while ETIS is managed by TRAFFIC (http://www.traffic.org/) – a joint program of the World Wildlife Fund and the World Conservation Union (IUCN). MIKE represents an effort to monitor illegal elephant killing in elephant states by developing the capacity of wildlife agencies to use their anti-poaching patrols and other methods for detecting carcasses, recording what they find and entering information into a standardized database. The agencies also undertake to conduct population surveys on a two to three year cycle. ETIS is an international monitoring system to track illegal trade in elephant products (mainly ivory), but it relies on individual countries to report seizures. While ETIS has published time series of seizure data by country that could provide a starting point for an analysis of the impact of species’ listing and trade on seizures (see Figure 3) (Milliken et al. 2004), progress on MIKE has been more limited because it is taking time to get the system up and running (Hunter, Martin and Milliken 2004).
A detailed specification of the consumer and producer surplus components of the objective function (1) as employed in the mathematical programming model is provided in Appendix A. There is insufficient information to determine the pre-ban and post-ban demand functions, pd(0, q) and pd(1, q), respectively. Fischer (2004) reports that ivory was trading for about $150 per kg in the pre-ban period, with price peaking at over $1,200 per kg shortly after the ban’s imposition and then settling at some $450/kg thereafter.8
The only information about quantities traded pertains to reported seizures of elephant products. The first year for which these are reported is 1989, the year of the trade ban. From Table 2, the average number of annual seizures of illegal elephant products (as they crossed international borders) increased by 120% after 1989, although, as indicated in Figure 3, there is no real discernable trend in the amount of illegal ivory sold in the years following the trade ban, at least based on reported seizures. It appears that illegal activity continues unabated. Hunter, Martin and Milliken (2004) use observations on ivory carvers 8 In comparison, Kremer and Morcom (2000) cite Simmons and Kreuter (1989) for prices of uncarved elephant tusks: $7/lb ($9.20/kg) in 1969, $52/lb ($114.40/kg) in 1978, and $66/lb ($145.20/kg) in 1989 (with 2.2 lb = 1 kg).
13
in various regions of Africa and Asia to estimate that between 6,433 and 16,185 African elephants (and 123 to 349 Asian elephants) are still supplied illegally to the market each year (Table 2). This implies that between 44.4 and 111.7 tonnes of illegal ivory from African elephants still enter the market annually, or about one-tenth of what was marketed (legally and illegally) under free trade.
Given a dearth of additional information, we simply assume that the excess demand function in Figure 1 can be written as:9
(12) pd(I=0) = 720 – 0.0005 q.
According to (12), at a real pre-ban price of $150/kg, some 1140 tonnes of ivory would be traded. What would be sold under a trade ban assuming the demand curve changes due to a stigma effect? If the pre-ban demand function (12) continued to describe the situation, the market price of the ivory would be $664-$698 per kg. As noted, however, it is reported to be nearer $450 per kg. We assume that the intercept on the post-ban excess demand curve has shifted down by this difference, or by about $220 (=$670 – $450), so that the no-trade excess demand function can be described by:
(13) pd(I=1) = 500 – 0.0005 q.
At a price of $450 per kg, only 100 tonnes of African ivory would be sold internationally, well within the range estimated by Hunter, Martin and Milliken (2004) and indicated above.10
On the supply side, the African continent is divided into four regions that represent different elephant subspecies – the savanna elephant (Laxodonta africana africana) and the forest elephant (Laxodonta africana cyclotis) – and elephant economics. The forest elephant is difficult to view and is found primarily in West and Central Africa, with populations in West Africa rather small and insignificant in continental terms (Table 1). The savanna elephant is an important flagship species for the tourism industry. While important in all states of East and Southern Africa, populations in the latter region have threatened the ecosystem carrying capacity, so elephants have been culled and ivory stockpiled. Thus, while Kenya is concerned about the adverse impacts of ivory trade, states in Southern Africa have lobbied to sell ivory. 9 Based on seven pre-ban observations on price and presumed ivory sales from various CITES sources, deflated prices (2000 US$ per kg) were regressed on quantity (kg of ivory) and time (with 1960=1 and 1989=29) to obtain: P = 220.025 – 0.00046 q + 16.581 t, R2 = 0.883 F=7.059* (1.83) (–2.37)* (3.73)**
where the t-statistics are provided in parentheses, ** indicates statistical significance at the 1% level or better and * indicates significance at the 5% level. Assuming this regression result is a demand function (ignoring identification and other problems) and taking t=30 gives result (12). 10 Based on the calculations provided here, the price paid by Japan in 1999 ($103/kg) is likely low.
14
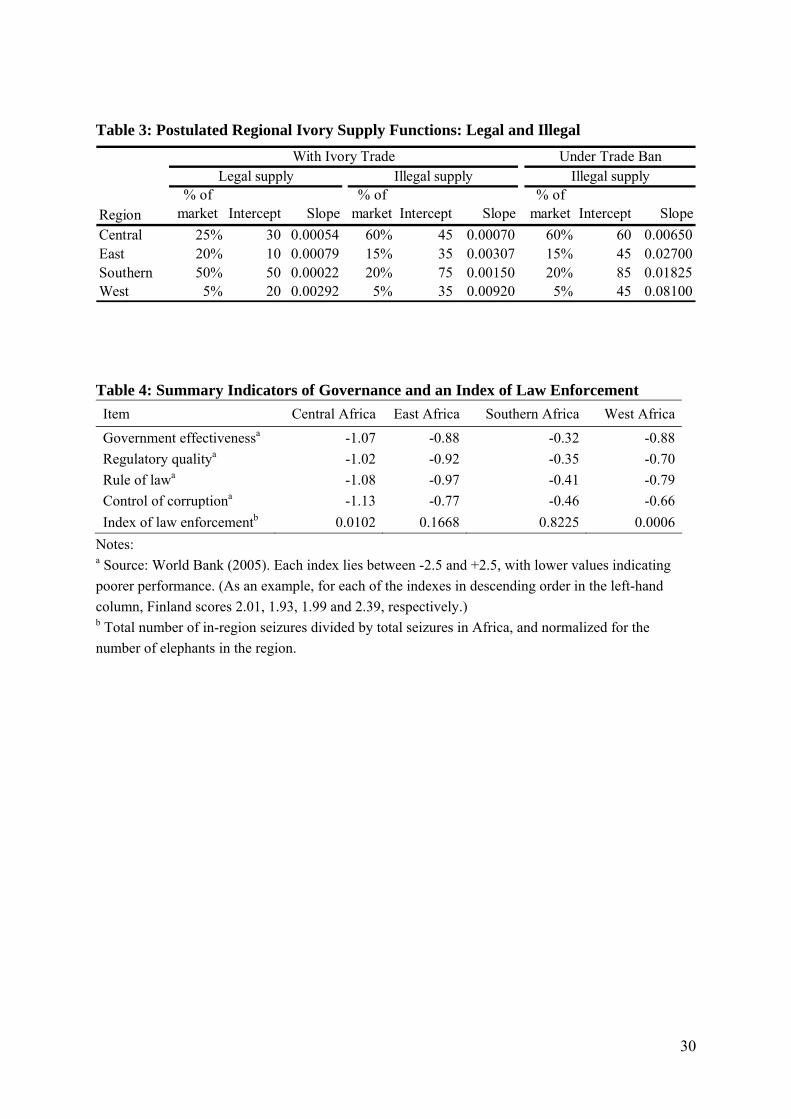
It is assumed that, in addition to the costs of harvesting elephants (see equation (1)), there is a fixed cost plus a per unit cost of taking ivory out of stocks and bringing it to market. The fixed cost represents the transportation and search costs (finding markets). Both fixed and per unit costs are higher when a trade ban is in place as transactions are illegal. To determine the supply functions in each region, we begin by assuming that under a trade ban, 100,000 kg of ivory would sell for $450/kg. To determine the regional illegal supply functions, we further assume that 60% of the illegal supply (or 60,000 kg) comes from Central Africa, since Hunter, Martin and Milliken (2004) argue that much of the illegal supply originates in this region. The amounts coming from the other regions are indicated in Table 3. If we assume linear supply functions and guesstimates of the intercepts, it is then possible to determine the slopes of the supply curves based on the share of the total quantity of illegal ivory that each region contributes to the market. The intercept and slope parameters for the illegal supply (marginal cost) functions under a trade ban are provided in Table 3.
In order to construct the legal and illegal supply functions, a number of assumptions need to be made. Under free-trade, 1140 tonnes of ivory are traded at a price of $150/kg. At that price, regions are assumed to supply legal ivory to the market according the proportions indicated in Table 3 (roughly based on the proportions in Table 1). However, not all of the ivory sold is from legal stocks. Under a ban, 100 tonnes of ivory are assumed to be supplied illegally (as noted above); with free trade, we assume that 200 tonnes are provided illegally with the proportion of the illegal supply from each region the same as under the ban. Thus, 780 tonnes per annum are supplied legally. We assume that the illegal supply functions are flatter and have shifted down compared to the trade-ban case, because trade reduces anti-poaching effort and makes it easier to launder poached ivory. The legal supply functions are assumed to have a lower ordinate intercept and to be flatter than the illegal supply curves, as marginal costs of supplying ivory to the international market must be lower for legal suppliers than illegal ones. The intercept and slope parameters for the illegal and legal supply functions in the case of trade are also provided in Table 3.
Anti-poaching effort can affect the supply of illegal ivory. Unfortunately, there is little information about the effect that law enforcement has on the illegal supply of ivory. Milliken et al. (2004) provide two measures of law enforcement effort – the Corruption Perception Index score (which for a region would be the average of the country scores) and an index of enforcement given by “the total number of in-country seizures divided by the total number of seizures” (p.23). Arguably, the World Bank’s (2005) Governance and Anti-corruption indicators are a better indicator of enforcement ability than the Corruption Perception Index. Thus, rather than a single index for each region, four indexes are provided for each of the regions in the model (see Table 4). Further, Milliken et al.’s index of enforcement, but then adjusted for elephant populations and normalized for Africa, is also provided in Table 4 for each region. West and Central Africa have the worst scores, respectively, in terms of enforcing the ivory trade ban, and these low scores accord with the World Bank’s low measures of performance related to government effectiveness, rule of law and corruption. East Africa performs just as poorly on the World Bank’s indicators, but does
15
relatively better in the enforcement of the ivory trade ban, perhaps because of the importance of the elephant to the economies of East African states. States in Southern Africa are more prone to enforce ivory trade laws and are generally better performers on other measures as well, but all states in Africa lag well behind states in Asia that purchase elephants and countries of Europe and North America (see Bulte, van Kooten and Swanson 2004). As part of the analysis, it is assumed that African range states can do better in the enforcement of illegal killing of elephants and trade in elephant parts.
To describe the fecundity, mortality and growth characteristics of elephants, we specify the following simple linear function:11
(14) xt+1 = (1+r) xj,t, with xj,t ≤ Kj tj,∀ ,
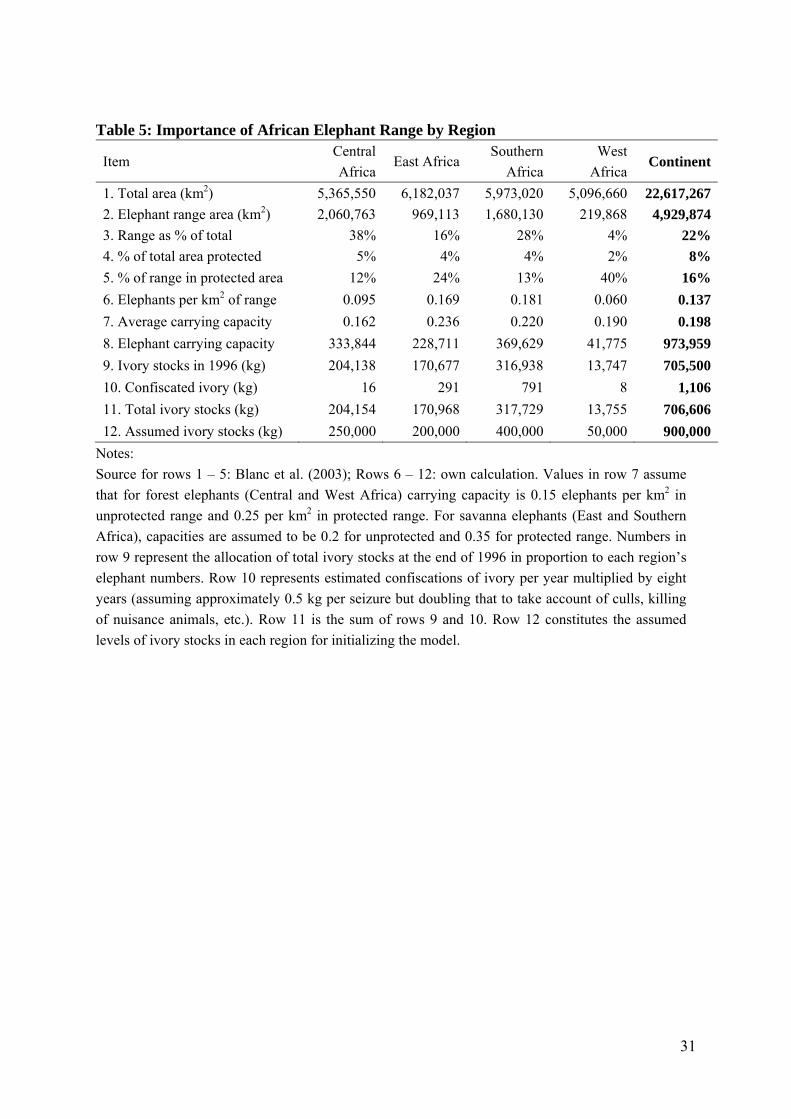
where r is the growth rate in elephant stocks and Kj is the elephant carrying capacity for ecosystems in region j. Set r=0.067 (Milner-Gulland and Leader-Williams 1992) and initial elephant populations equal to the elephant totals for each region in 2002 (Table 1). The carrying capacity of each region is determined from information about elephant range and the proportion of elephant range that is protected. For the forest elephant, it is assumed that unprotected elephant range has a carrying capacity of 0.15 elephants per km2, while it is 0.25 elephants per km2 for protected range. The carrying capacity of open range is higher, so it is assumed to be 0.20 per km2 for unprotected and 0.35 for protected range in the case of the savanna elephant. Background information and carrying capacities are provided in Table 5. The estimated continental carrying capacity of about 974,000 elephants is lower than numbers existing in the early 1970s (some 1.2 million), but elephant range has also decreased significantly since then due to rising human populations and encroachment.
Ivory stocks are largely unknown, although Milliken (1997) estimates that there are some 462.5 tonnes of verifiable and legitimately held stocks of ivory in Africa, and another 243 tonnes of undeclared (perhaps illegal) ivory, or a total of 705.5 tonnes. This amount is allocated across regions in proportion to each region’s number of elephants. One estimate of extant stocks is to add to these estimates the increase in stockpiled ivory over the period 1997-2004 relying on information reported by Milliken et al. (2004). Average seizures by region are provided in Table 2 for the period 1990-2003, while the raw ivory equivalent weight of an average seizure over the period 1989-2004 was 0.498 kg. Assume that seized ivory accounted for half of the increase in ivory stocks, with the remainder coming from culling, killings of troublesome animals, and, in some regions, legal hunting for monetary gain. Using this information to determine the increase in stocks since 1996 gives the estimates provided in the next to last row of Table 5. One could also argue that, using
11 An alternative is to employ the standard logistics growth function: xt+1 – xt = r xt (1– xt/K), where r is the intrinsic growth rate in elephant stocks and K is the ecosystem’s elephant carrying capacity. However, for this discrete form and the parameters used in this model, it leads to an immediate reduction in elephant numbers by half even without harvests.
16
Milliken’s (1997) estimate of 1996 stocks, an average of 88.2 tonnes of ivory were added to stocks each year. If this continued up to 2004, there would be some 1300 tonnes of stockpiled ivory. As the exact number is unknown, we assume 900 tonnes of stocks allocated as indicated in the last row of Table 5. Further, we assume a constant rate of confiscations of 5%, so ξ =0.05.
Milner-Gulland and Leader-Williams (1992) estimate poaching costs to be about $180 per elephant. Thus, it is assumed that c(I=1)=$180; arbitrarily choose one-third of this amount to be legal harvesting costs, c(I=0)=$60. While Kenya and Mozambique, for example, do not permit hunting of elephants, hunting is allowed in some states. Nonetheless, Scully (2002, pp.47, 86, 122) reports that, in 1999, Safari Club International members could pay some $10,000 for the ‘privilege’ of hunting an elephant (likely in southern Africa and specifically Zimbabwe). Although left to future research, for southern Africa at least, we could consider elephant harvests yielding a benefit of $10,000.
The costs of holding ivory stocks consist of the forgone opportunity cost (given by the discount rates) and a physical cost of holding ivory, which is assumed to be small, s=$0.50/kg each period.
Average tusk weight has dropped significantly since 1970, probably because older animals with larger tusks were killed first, so current stocks of elephants tend to be much younger. Scully (2004, p.123) points out that it took 55 elephants to obtain 1 tonne of ivory in 1979, compared to 113 elephants around 1990 (p.123) – a decline from 18.18 to 8.85 kg of ivory per animal.12 Not only is tusk size (and the age of elephants) declining, but more are born without tusks. Yacob et al. (2004) measured 31 tusks of elephants in Eritrea and found an average tusk weight of 8.7 kg, while Hunter, Martin and Milliken (2004) report that, based on 7800 ivory seizures, the average tusk weighs 3.68 kg – they use this information to convert estimates of ivory being carved into number of elephants killed illegally. Both male and female African elephants grow tusks (while only male Asian elephants have tusks), but for whatever reason the average number of tusks per African elephant is 1.88. Thus, the above values convert to 16.4 kg and 6.9 kg of ivory per elephant. Because of the disparity in estimates and that weights have declined over time, we choose γ=7.5 kg of ivory per elephant.
Bulte and van Kooten (1996) assume a linear damage function, D(x)=dx, with the constant cost imposed by elephants on the ecosystem, d, determined by the amount of forage that an elephant consumes annually (which is equivalent to the consumption of 4.7
12 Scully quotes David Chadwick. Scully (2002, pp.69-71) also reports that, after making ‘donations’ to several local Mozambique causes (including a hospital), three members of the Safari Club International killed, among other animals, three elephants in July 1998, despite an unambiguous 1990 law prohibiting elephant hunting in Mozambique. The largest of the elephants had tusks weighing an incredible 92 lbs (41.8 kg) each!
17
cows or about 36,500 kg of dry matter). This forage is valued at d=$165.13
East Africa (particularly Kenya) benefits from wildlife tourism, with the elephant considered to be a charismatic flagship species. The same is true of Southern Africa, but probably to a slightly lesser extent. Bulte, Horan and Shogren (2001) assume the following relationship for tourist benefits: R(x) = 14.4 million × ln(x). However, their relationship is for all Africa, so that the total tourism benefits peak at about $900 million per year for the total population of elephants. This is a large value compared to the estimated gain to Kenya of $45 million in 1995 from wildlife tourism (Earnshaw and Emerton 2000, as cited by Bulte et al. 2001). Suppose we more than triple this value to $150 million to account for potential increases in tourism, inflation and other countries in East Africa. Then, based on 150,000 elephants in East Africa (see Table 1), we postulate the following linear marginal tourism benefit function assuming further that marginal benefits are zero at the extant population:14
(15) R′(x) = 2000 – 0.0133 x. (East Africa)
Assume that, for Southern Africa, total tourism benefits amount to $250 million, based on approximately 300,000 elephants; for Central Africa, tourism is assumed to provide only $20 million of tourist-related benefits to approximately 200,000 elephants; comparable values for West Africa are $2 million in benefits for 20,000 animals. Based on these values and making the same calculations as for East Africa, we get the following marginal tourist-related benefit functions:
(16) R′(x) = 1680 – 0.0056 x. (Southern Africa)
(17) R′(x) = 200 – 0.0010 x. (Central Africa)
(18) R′(x) = 267 – 0.0178 x. (West Africa)
Lastly, it is necessary to determine the benefits that accrue as a result of holding elephants in situ. These benefits accrue primarily to people in developed countries and represent their annual willingness to pay to preserve elephant populations in Africa. Assume there are 200 million households in Europe and North America and each is WTP some amount annually to preserve elephants. Assume that the marginal benefit (marginal WTP) function is linear: B′(x)=a–bx, and that people are unwilling to pay to preserve elephants in 13 In a recent issue of Pachyderm (vol. 38, http://www.iucn.org/themes/ssc/sgs/afesg/pachy/), several articles report on human-elephant encounters and crop damage. These suggest that overall damages are small (except perhaps for the few farmers whose crops are affected) and a function of the land’s nearness to an elephant conservation area. As noted earlier, elephants appear to avoid leaving protected areas except to raid when the need arises. 14 Let m be the vertical intercept of R′(x). Then, based on the formula for the area of a triangle, m = (assumed total tourist-related benefits) ÷ (½ × elephant population). The slope of R′(x) is simply the negative of m divided by the elephant population.
18
situ beyond extant numbers (Table 1). Consider three cases that are labeled ‘Lo’, ‘Mid’ or ‘Hi’ according to the amount households are willing to pay each year for elephant conservation. For the ‘Lo’ scenario assume a=1500 and b=0.0022, so that B(x=676,500)=$511.3 million with each household contributing $2.56/year on average. For the ‘Mid’ scenario, assume a=3600, b=0.0053, so that B(x=676,500)=$1222.6 million with each household paying some $6.11 per year; and, finally, for the ‘Hi’ scenario, assume a=5400, b=0.0079, so that B(x=676,500)=$1845.4 million with each household paying $9.23 per year.15 Alternatively, it is assumed that rich countries provide a fixed conservation payment of $75 per elephant in the ‘Lo’ scenario, and $175 and $260 per animal in the ‘Mid’ and ‘Hi’ scenarios, respectively. These payments amount to a transfer of about 10% of total benefits (as calculated above) that elephants provide rich countries. Unlike tourism benefits, conservation payments are based on total elephants in Africa, regardless of the region in which they are found.
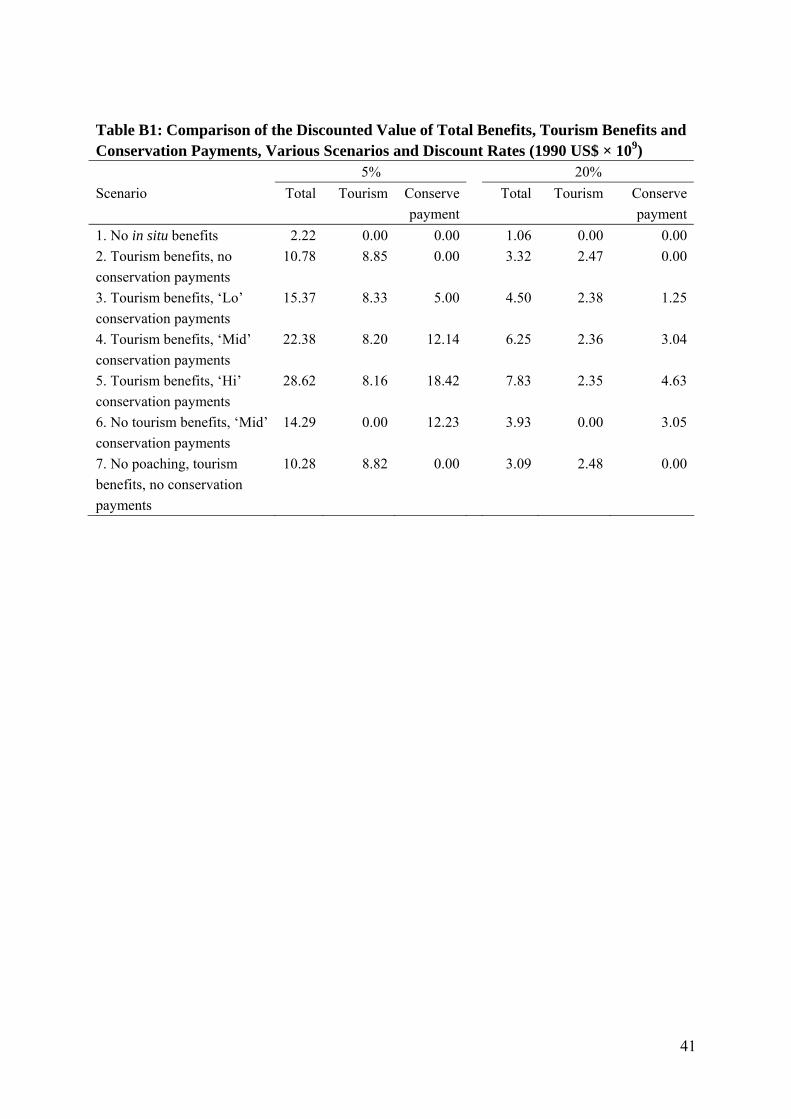
V. RESULTS
The outcomes of different strategies are examined using a series of mathematical programs coded in GAMS and solved using the MINOS5 nonlinear solver, and the CPLEX quadratic programming solver (Brooke et al. 2005). The simulations are for 200 years (periods), although data are reported only for 50 periods. This is done to eliminate the ‘end-point effect’: it is optimal to harvest the entire stock of animals in the last several periods if they have no (‘salvage’) value beyond the end of the planning horizon. That is, as one nears the end of the 200-year planning horizon, all animals will be harvested unless they have no value, or the (marginal) cost of harvesting the next animal is less than the marginal benefit.16
Given the richness of the model, it is possible to explore only a limited number of scenarios and variables. Since a major concern of animal welfare groups is the conservation of elephants in the wild, the focus is primarily on the effects of various scenarios on animal numbers. The most surprising result of the analysis relates to non-market benefits, namely, the contribution of elephants to countries’ tourism benefits and the effect that conservation payments from rich countries to range states have on optimal elephant stocks. Tourist benefits accrue to regions on the basis of a region’s elephant herd and its attractiveness to tourists, while per animal conservation payment are made on the basis of the total number of elephants preserved in any given year – each region is paid some amount per animal multiplied by the total number of elephants conserved in that region.
15 See previous footnote regarding the method of calculation. Using the values in the text, the marginal WTP function intersects the abscissa at 692,307 elephants for the ‘Lo’ scenario, 679,245 elephants for the ‘Mid’ case, and 683,544 elephants in the ‘Hi’ scenario. 16 At a discount rate of 5%, $1 accruing in 50 (100) years is worth $0.0872 ($0.0076) today; at 20%, it is worth $0.0001 ($0) today. Values 200 years from now are worth nothing today.
19
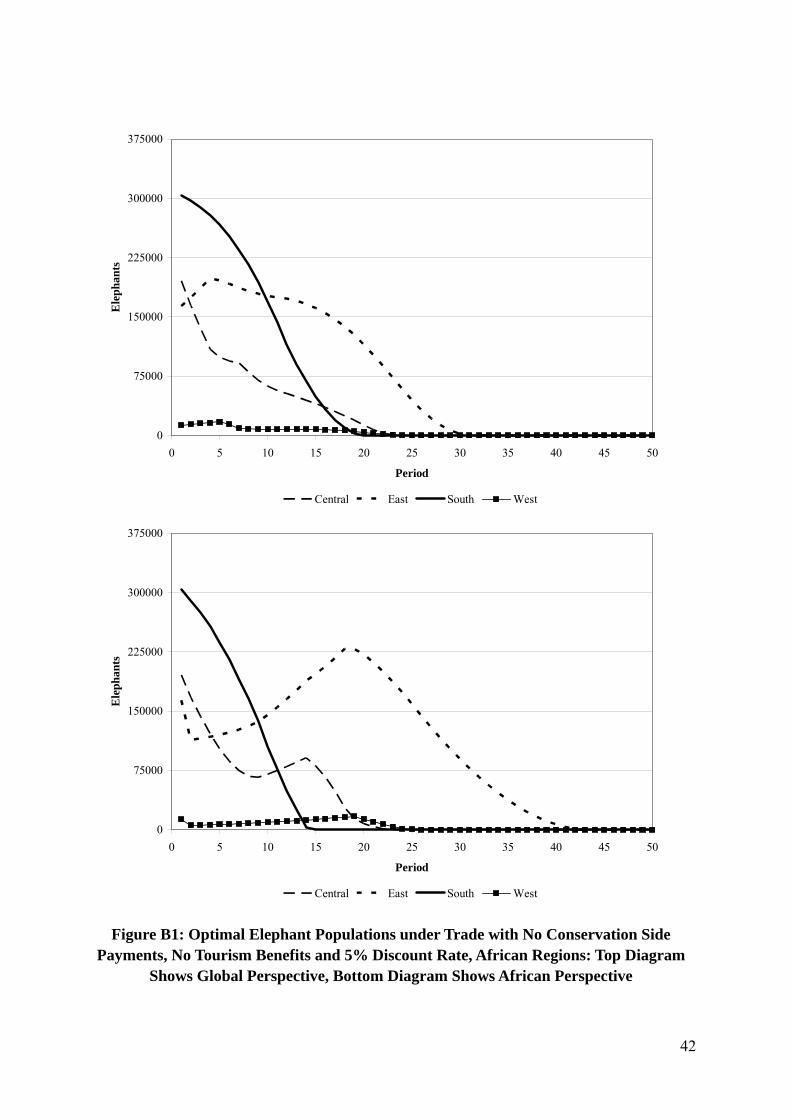
The Effect of Poaching in a Free-Trade Environment
Consider first the case of free trade. The model can be solved by either maximizing global or African well being. The difference between these two perspectives concerns the surplus accruing to consumers of ivory – the first term in the objective function (1). As indicated in Appendix B for a variety of scenarios, the optimal population of elephants to conserve is slightly higher from the African as opposed to global perspective, because the global decision maker would take into account the surplus accruing to consumers of ivory products, thus selling more ivory and harvesting more animals. Since there is no global planner and decisions regarding elephants ultimately reside with the range states, only the African perspective is considered in what follows.
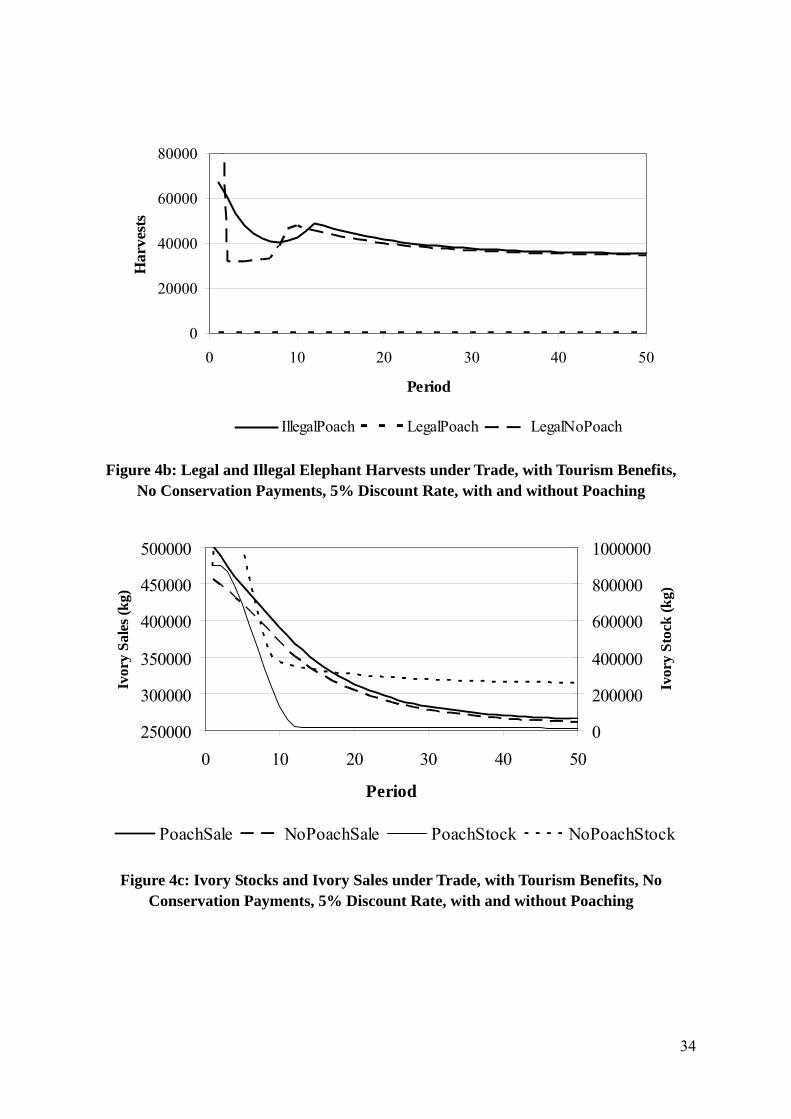
It is argued that poaching is the major problem of elephant conservation. Would the elimination of poaching benefit the African elephant? We eliminate poaching in the model by setting the confiscation rate at 100% – since any elephants taken by poachers would be confiscated, there are no illegal harvests. A comparison of optimal elephant stocks, harvests and sales of ivory under free trade with and without poaching for discount rates of 5% and 20% (and with inclusion of tourism benefits) is found in Figure 4. Optimal elephant stocks are slightly higher when a 5% discount rate and free trade with poaching are assumed than when there is no poaching, although the difference is very small (Figure 4a). The optimal elephant stock is just under 550,000 elephants in both cases. For a 20% discount rate, however, the presence of poachers reduces optimal elephant stocks from about 250,000 to about 300,000.
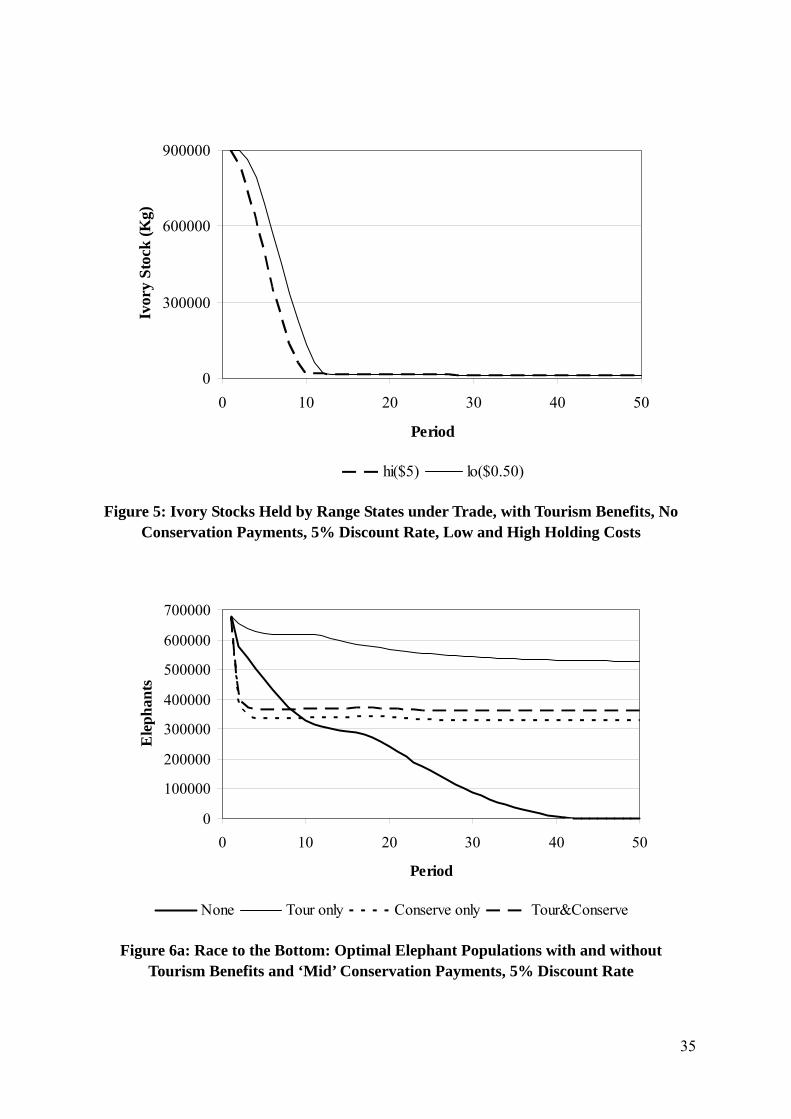
When poachers are present, states take into account sales of illegal ivory by reducing legal harvests to such an extent that illegal harvests nearly replace all state-sanctioned harvests, which fall to zero regardless of the discount rate, although sales of legal ivory from stockpiles continue (see Figures 4b, 4c and 5). Total harvests are nearly the same whether poachers are present or not, although harvests in the 5% scenario are higher than those in the 20% scenario (not shown), mainly because of the higher levels of harvesting early on in the latter case (as future harvests have lower present value). Note in Figure 4b the spike in legal and illegal harvests around the 10th and 12th periods, respectively, for the no poaching and poaching cases. This is due to the rapid depletion of ivory stocks, which fall to nearly zero in the case of poaching and approach zero in the longer run in the no poaching case (Figure 4c).
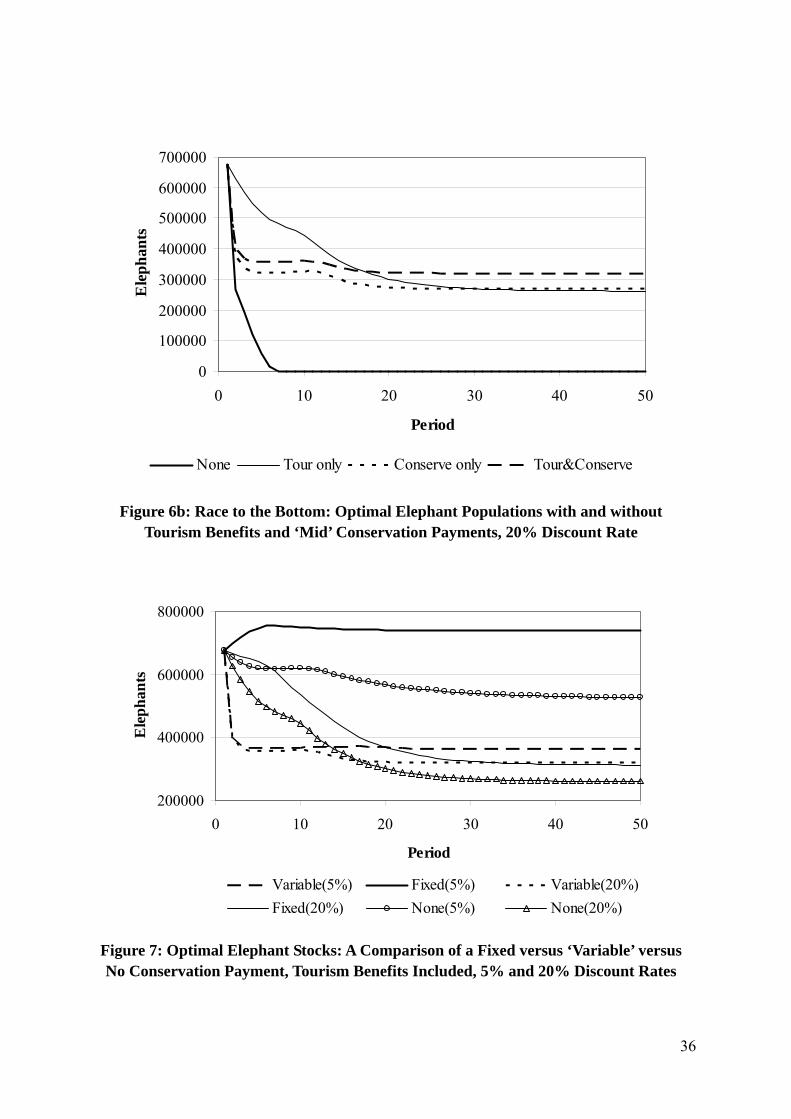
Surprisingly, poaching seems to have little impact: in the absence of poaching, optimal elephant numbers will be only very slightly higher than when poachers are present. The key is earnings related to in situ stocks. Because tourism benefits are significant, range states simply adjust to the activities of poachers. In the first few years of free trade, range states sell off as much of their stockpiled ivory as is optimal, with the speed at which this is done directly related to the cost of holding stocks (see Figure 5). Once stocks have been reduced, legal ivory is occasionally sold as range states participate in the market only to sell off any ivory stocks they may have accumulated as a result of confiscations, and rarely kill
20
elephants for that purpose. Almost all ivory that is sold comes from illegal harvests. Thus, when comparing the trade case with and without poaching, range states only lose to poachers the surplus associated with the sale of ivory, but they make up for it through tourism benefits and/or conservation payments from developed countries.
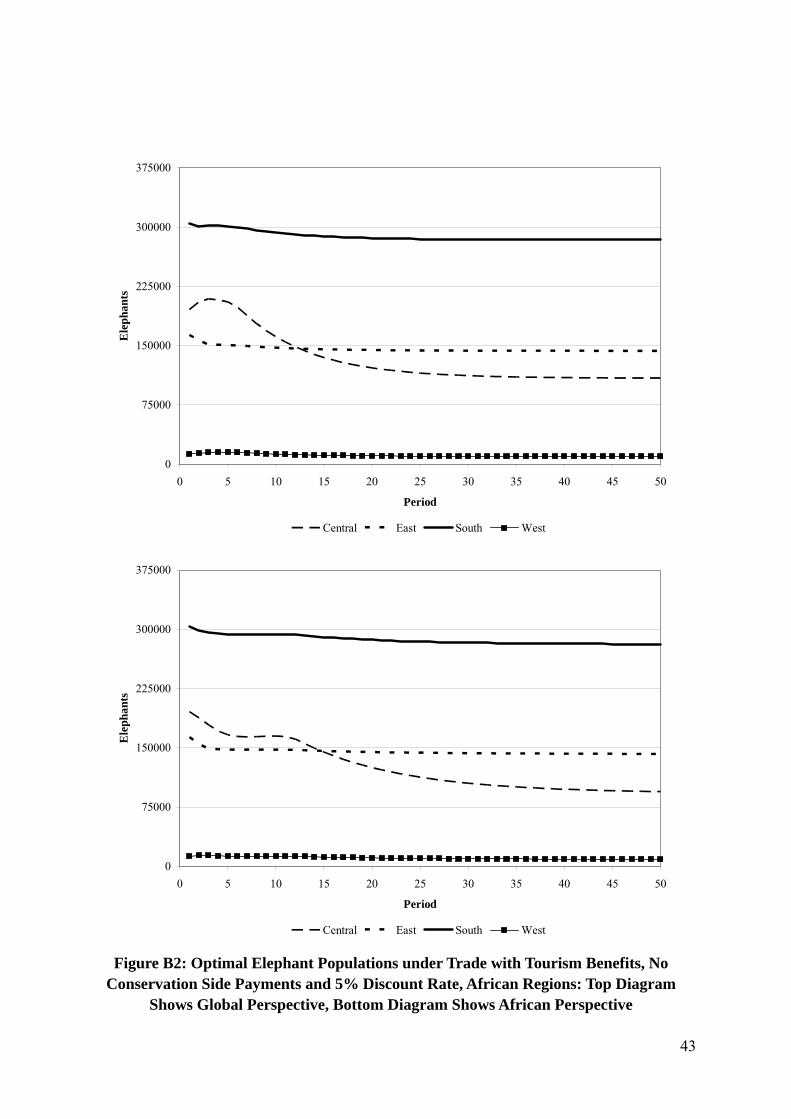
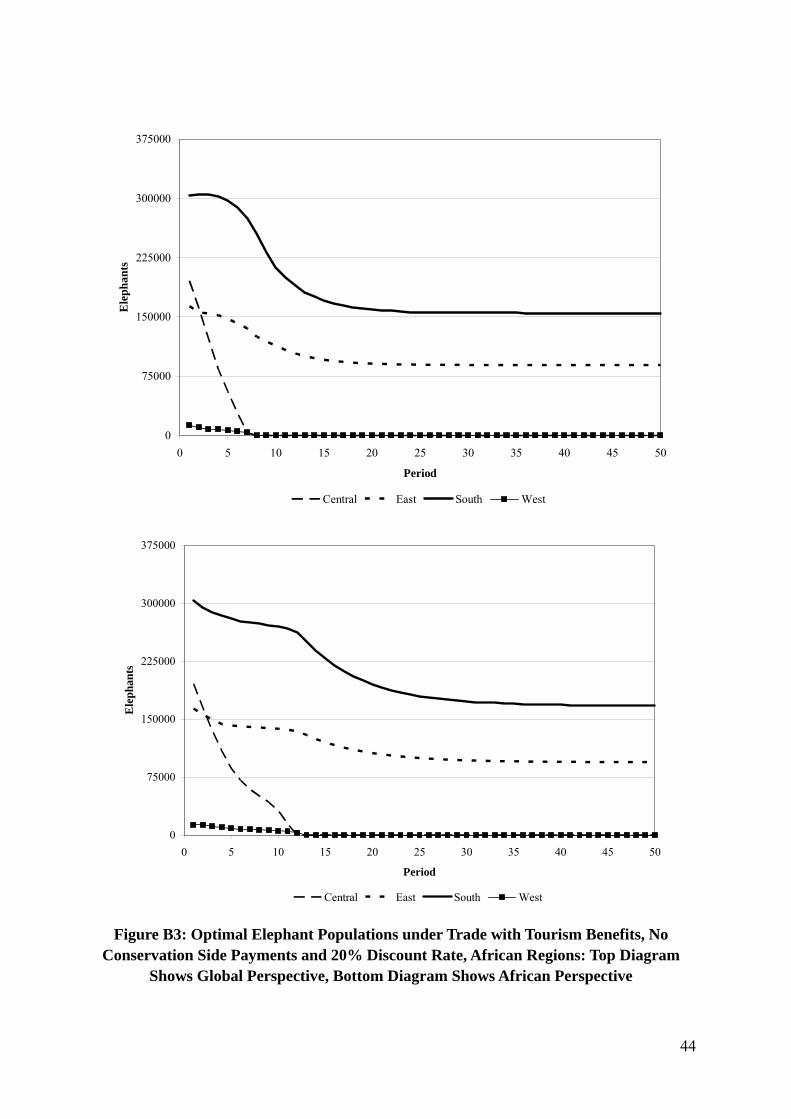
Benefits of Tourism versus Conservation Payments
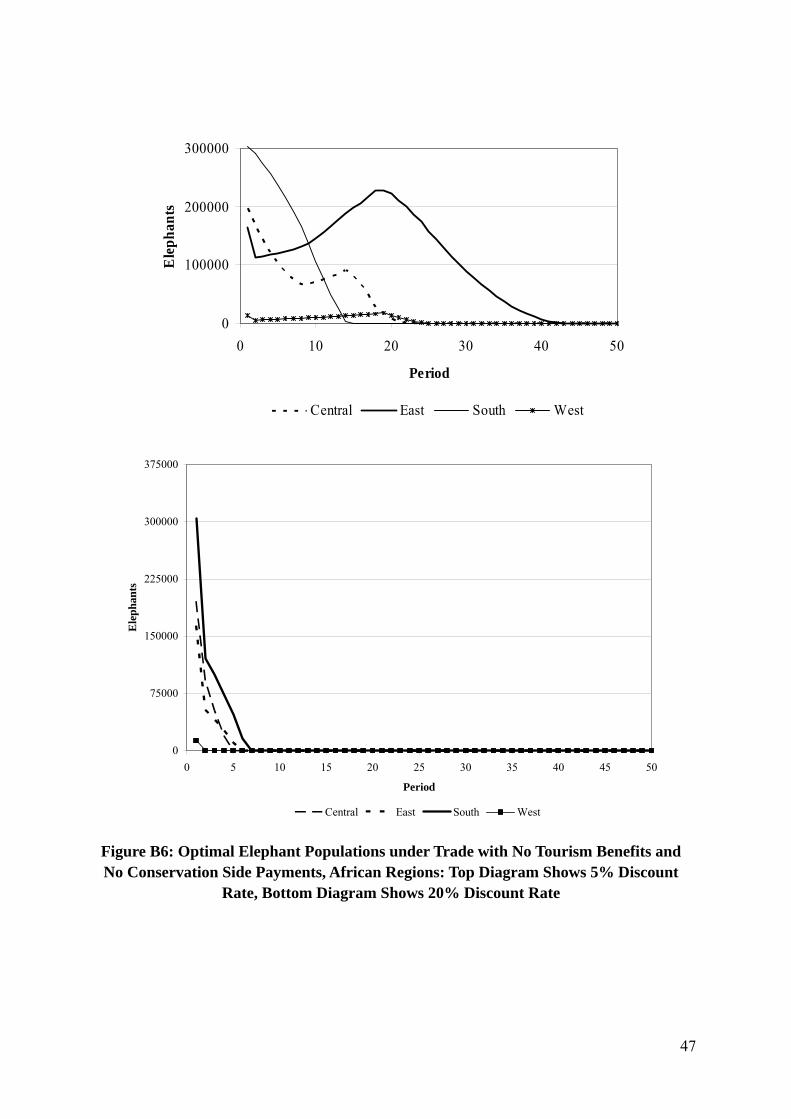
Although not shown here, if countries receive payments for preserving elephants in situ (and they take into account the tourism benefits that elephants provide), the effect of poaching on elephant numbers is nearly insignificant. In the absence of tourism benefits, conservation payments can prevent elephants from going extinct, assuming that appropriate institutions are in place and the amount that rich countries actually pay depends on the choices elephant owners (presumably range state governments) make. The simulation results do indicate that, under free trade and in the absence of conservation payments and/or recognition of the elephant’s contribution to tourism, there is a ‘race to the bottom’ as it is optimal to drive the elephant to extinction (Figure 6). The rate of decline in elephant populations is determined by the (social) discount rate. As indicated in Figure 6a, at a discount rate of 5%, it takes some 40 years for the elephant to disappear, but it takes less than 10 years if the discount rate is 20% (Figure 6b). Given that real rates of discount in developing countries tend to be high (perhaps 20% or higher), this result provides strong support for the possibility that elephant populations declined by half during the 1980s and that the ivory trade ban prevented the total demise of the species.
The simulation results in Figure 6 also indicate that, in order to protect the elephant, it really does not matter whether it is conservation transfers from rich countries to range states or recognition by range states that elephants contribute to tourism. Rather, as long as a meaningful link is made between elephant numbers and their non-market value, it is optimal for countries to protect elephants and keep them from going extinct.17 In the case of tourism benefits, range states will find it optimal to maintain more than 500,000 animals if a discount rate of 5% is employed, and about 300,000 if the higher rate of 20% is used.
It is interesting to note that, when conservation payments vary according to marginal WTP, optimal stock levels are lower than in the case where only tourism benefits are taken into account. This is clear from Figures 6a and 6b, where the introduction of conservation payments actually reduces the optimal stock level. Indeed, it is optimal for countries to reduce their stocks of elephants in the first several periods so as to increase the total transfer from rich countries for in situ elephants (as the ‘price’ increase offsets the reduced numbers for which payment is made). This is most pronounced for the lower discount rate (Figure 6a). This result holds because (some) range states recognize that they can influence the per animal conservation payment by manipulating elephant stocks. The alternative option is that rich countries provide a fixed conservation payment per elephant. If a fixed conservation 17 The link between elephant populations and non-market benefits might be meaningless if institutions and governance structures are lacking. This is a real problem in Africa, as indicated in Table 4 and noted by Bulte, van Kooten and Swanson (2003).
21
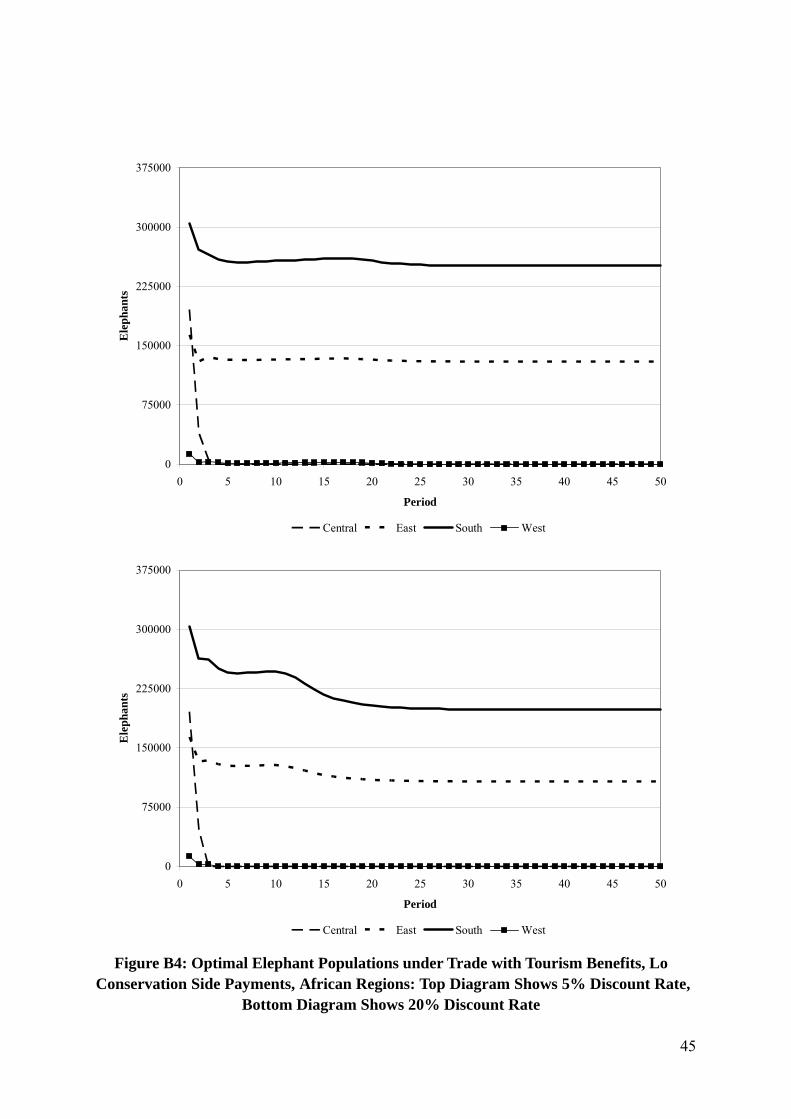
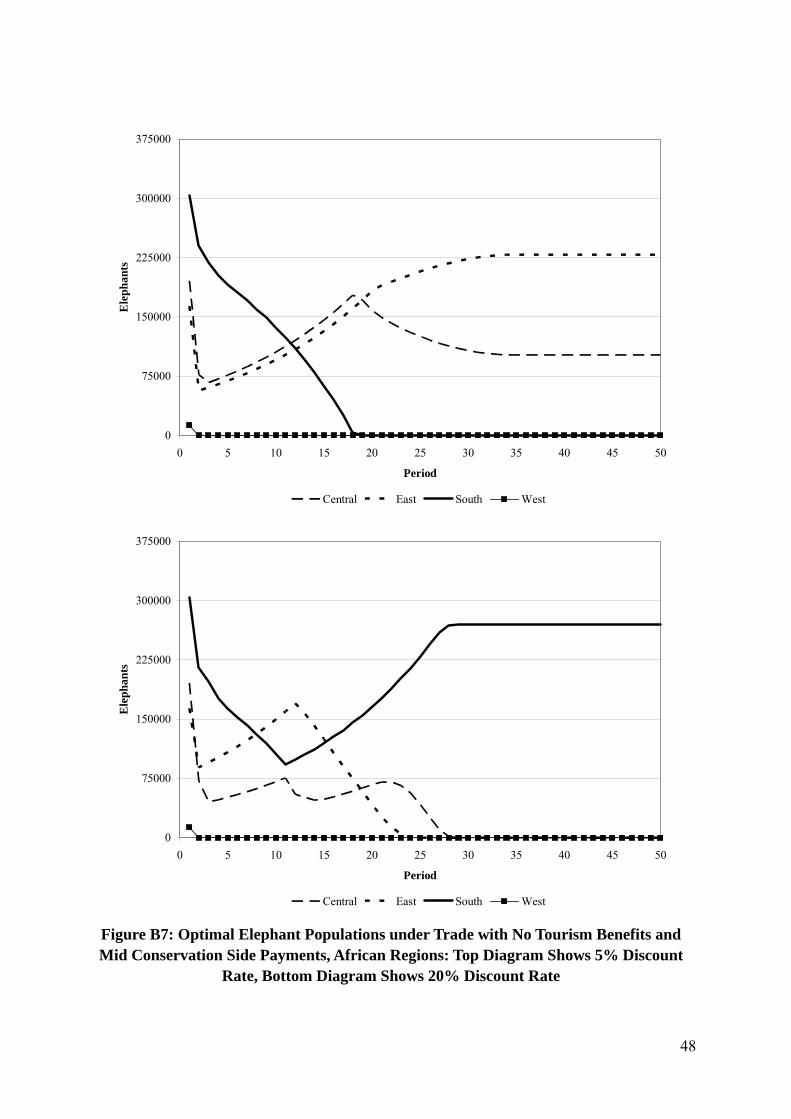
payment of $175 per elephant is provided, this has an enormous impact on the optimal stock of elephants, generally raising it above that associated with a ‘variable’ payment based on marginal willingness to pay (Figure 7).
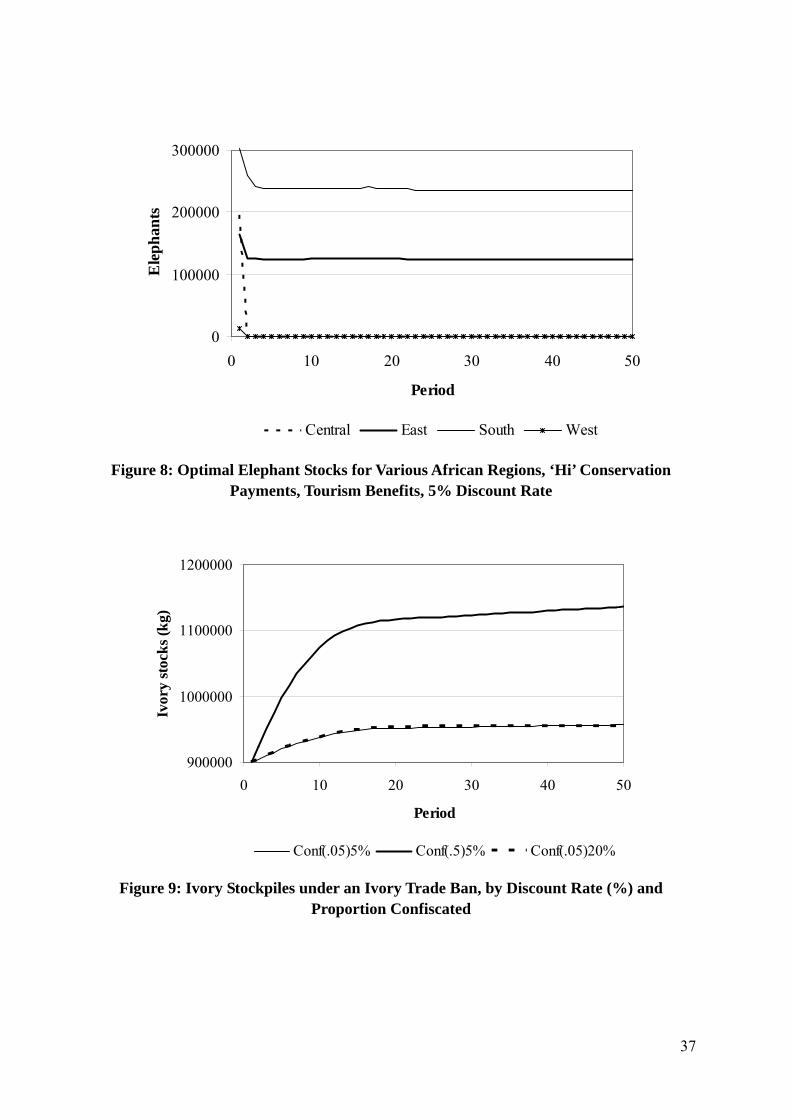
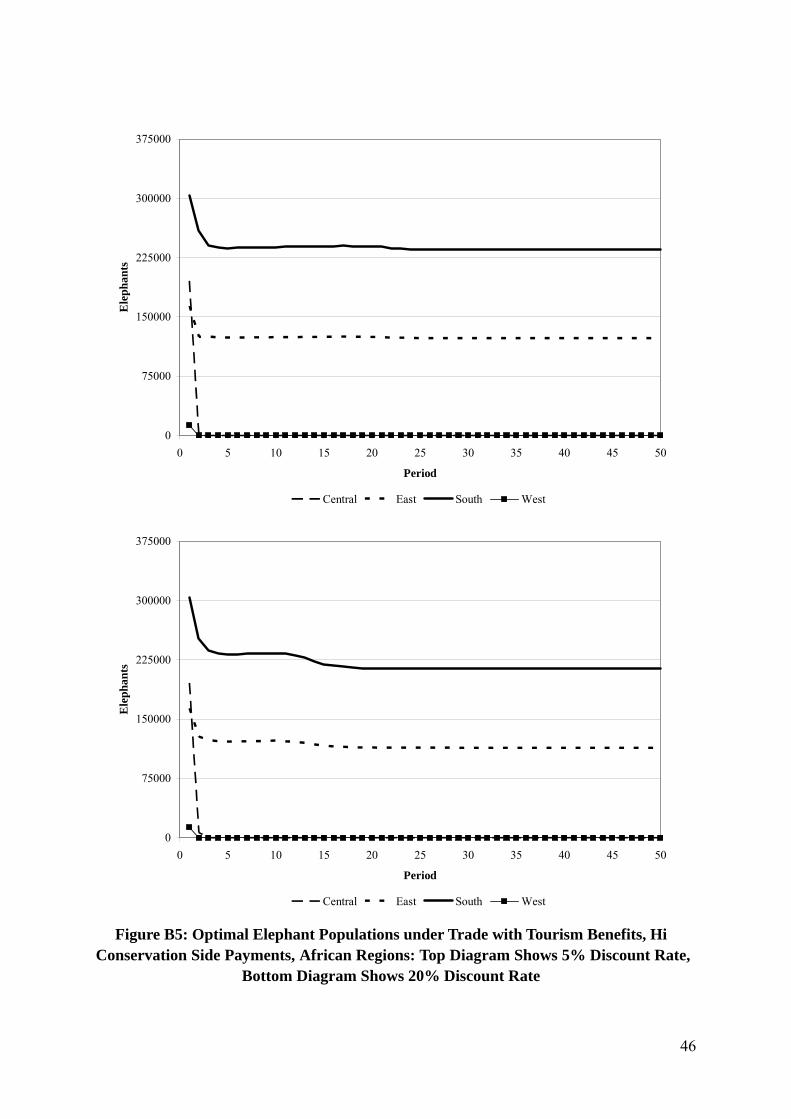
Finally, just because in situ values are taken into account, this does not guarantee that the elephant survives in all regions. In Figure 8, the following scenario is provided: ‘Hi’ conservation payments, recognition of tourism benefits and a low discount rate. (See Appendix B for other scenarios.) In this case, it is optimal to allow the elephant to go extinct in Central and West Africa. Nonetheless, the good news is that extinction can be avoided and their long-term survival ensured even when the future is heavily discounted if non-market benefits are ‘sufficiently large’ and such benefits are actually tied to animal numbers. In the absence of the ‘non-market benefit effect’, the crucial question is: Can a trade ban mitigate the species’ demise?
Ivory Trade Ban
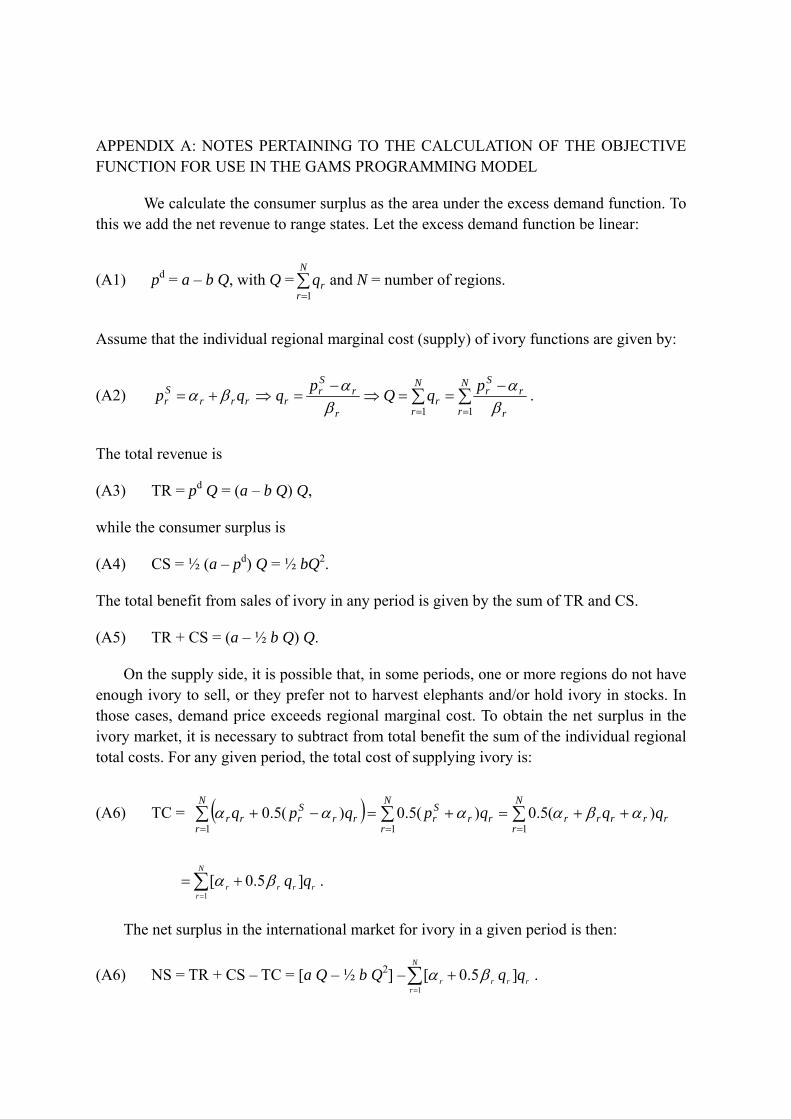
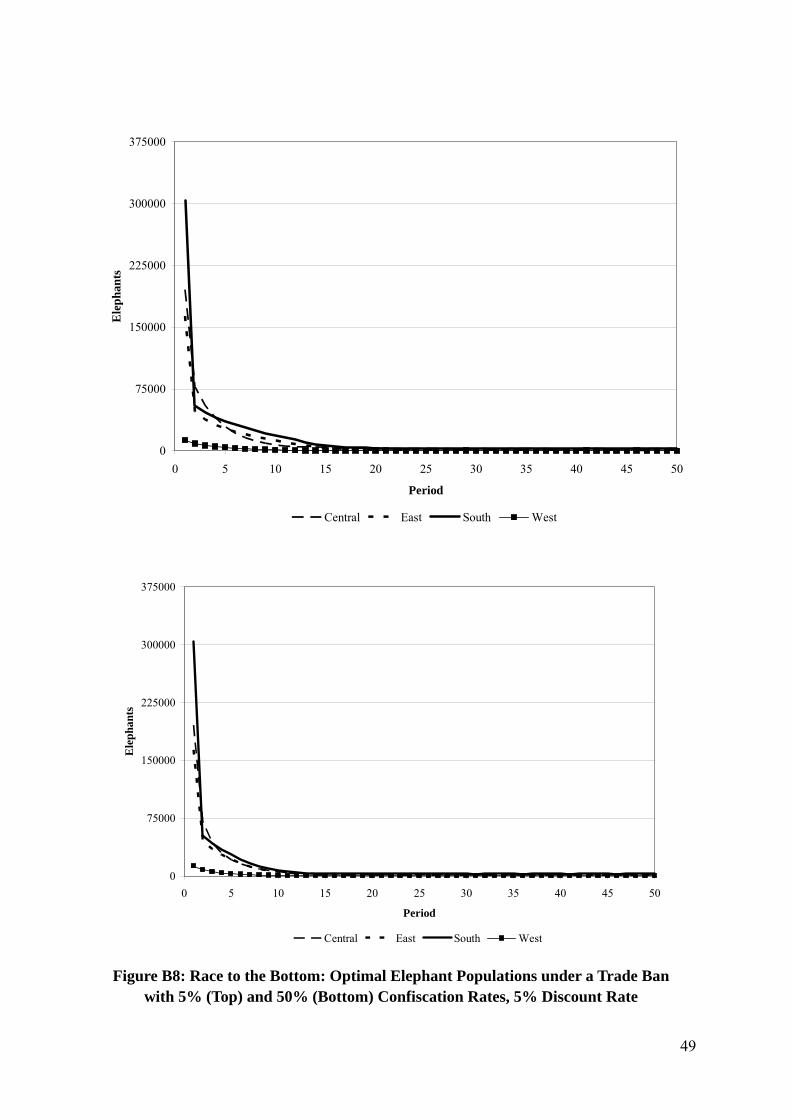
The simulation results indicate that a trade ban on ivory may or may not be successful in conserving the African elephant. Regardless of the discount rate used, for the supply-curve intercept parameter values found in Table 3, poaching will cause the elephant to go extinct in less than twenty years (see Appendix B), despite the fact that the demand curve has shifted inwards as a result of the so-called stigma effect. That is, the stigma effect brought about by the trade ban is not a sufficient condition for protecting the elephant. Indeed, for the parameters of the illegal, trade-ban supply functions given in Table 3, even an increase in the confiscation rate from 5% to 50% is unable to protect the elephant. This is obvious from Figure 9 which shows the rising stockpile of ivory that occurs in range states – it quickly comes to an equilibrium (indicating extirpation of the elephant), with the equilibrium higher when poaching gangs use a lower discount rate (which is unlikely).18
Although not shown, it is possible to specify intercept and slope parameters for the poaching supply functions (while maintaining the initial equilibrium condition) that lead to rising elephant populations. This suggests that actions to control the international movement of ivory might be more effective than on-the-ground attempts to increase policing of poachers, although this needs to be investigated further using data from MIKE and ETIS (see Bulte, Damania and van Kooten 2006). Whatever the case, if range states and international organizations are not vigilant in monitoring and enforcing a trade ban, it is unlikely to be effective.
One problem with a trade ban is that it leads to increasing stockpiles of ivory as a result of anti-poaching enforcement (confiscations) and culling of animals. Since range states are currently unable to sell these stocks without permission, stockpiles will rise: In the current simulations, legally-held ivory stockpiles could rise by between 5% and more than 20%. If the trade ban is effective, however, stockpiles could potentially rise much more in the long run. As a result, some range states will continue to agitate for continued sales of 18 Notice in Figure 9 that the confiscation rate is more important than the discount rate.
22
ivory and the existence of stockpiles is likely to continue to be a major irritant in international negotiations. One alternative is to return to a quota system – or an ivory cartel.
Ivory Cartel
It is assumed that, if range states can form an ivory cartel, they can also cooperate to eliminate poaching (perhaps using genetic coding to ensure that only ‘approved’ ivory enters the market). Further, since the formation of a cartel constitutes a signal that African range states are concerned only about their own well being, conservation payments from developed countries for in situ elephants are ignored. Under these assumptions, unfortunately, an ivory cartel does not ensure the elephant’s survival. Indeed, a cartel is only effective in protecting the elephant if in situ values are taken into account. In that case, there is little difference between the cartel and no cartel results.
VI. DISCUSSION AND CONCLUSIONS
The analysis of this study provides one very important conclusion: Unless the contribution of living elephants to the well being of citizens in range states (via the tourist sector) or in rich countries (through their willingness to pay to ensure the existence of elephants now and in the future) is taken into account, the elephant is most likely to remain a species under threat of extinction. This is not enough, however: Range states must recognize and act upon the link between elephants and tourism benefits and/or citizens in rich countries must make effectual payments for elephant preservation. Further, to prevent the stock of elephants from falling to the lowest level required to ensure their flagship or preservation status, non-market benefits must increase with elephant numbers (albeit at a decreasing rate) and must reach those with the ability to take action.
Any solution that involves payments to range states or a requirement on their part to increase monitoring and enforcement is bound to involve some risk. The reason is that African range states in general lack the institutions and governance structures that characterize developed countries (see Table 4; Bulte, van Kooten and Swanson 2003). Low incomes, lack of property rights, government corruption and other characteristics of these countries do not bode well for their ability to prevent further declines in elephant populations, as least not without the vigilance of developed countries and the aid of international agencies. In some ways, the elephant is similar to the bison that once roamed the Great Plains of North America. Despite the emergence of institutional entrepreneurs who exploited the natural resources available on the frontier, the bison was doomed because the land was much more valuable in cattle production than it was producing bison, even if these could somehow be domesticated (see Anderson and Hill 2004, pp.94-102). Likewise, without conservation or some other form of side payments made to those with a stake in the land, elephants are less valuable than agricultural crops, and unable to compete for land.
Given the situation in many (if not all) range states, tourism benefits are unlikely to be realized, which is certainly the case of countries in Central Africa. Clearly, the role of countries outside of Africa is crucial. One option implemented by the international
23
community (with the support of most African states) has been a trade ban. The ban is an attempt to reduce demand for ivory through a stigma effect, while increasing the costs of poaching and marketing ivory by monitoring and enforcement that are funded by rich countries. While the stigma and supply-side effects of a trade ban are important, their existence is essentially speculative. Research of a different kind than that reported here is required to determine if they are indeed real. If they are not real and/or organized gangs of poachers are able to mitigate increases in supply-side costs or even reduce them, the trade ban cannot be relied upon on its own (as evidenced by the results of this study). If tourism benefits are also not realized, one can only conclude that intervention by rich countries is required in the form of conservation payments tied to the numbers of elephants that range states conserve. As indicated in Figure 7, the payment schedule will have a large impact on range states’ optimal elephant numbers, and the subsequent effort that range states make in policing herds. In the case of international transfer payments, it will be necessary to design an appropriate incentive scheme that does not enable range states to reduce elephant numbers in order to maximize returns from such payments.
The results of the model presented here are indicative only. Further research is certainly warranted to make the relations in the model more realistic. The demand function in the analysis is essentially static, but it should perhaps be modeled as a function of time. It is not clear, however, whether demand should be modeled as shifting outwards or inwards over time – whether on a global level increasing aversion to the killing of elephants outweighs other factors that might increase the demand for elephant products (e.g., bush meat). Further, it is necessary to consider the relationship between the legal and illegal takings of elephants. The effect of monitoring and enforcement needs to be explicitly taken into account; the supply of illegal ivory needs to be modeled as a function of anti-poaching expenditures and of the supply of legal ivory. At the same time, it is necessary to take into account the reactions of the state to supplies of illegal ivory when free trade is permitted, or when states act to form an ivory cartel. Currently, illegal marketing of ivory is taken as given, while, in the case of the cartel, it was simply assumed that poachers were driven out of the market, which may simply be too expensive a proposition. These interactions certainly warrant further investigation.
ACKNOWLEDGEMENTS
The author wishes to thank Peter Kennedy and participants at the 4th Annual BIOECON Conference in Cambridge, UK, 19-21 September for comments on an earlier draft of this paper, and Nigel Hunter for helpful email discussions. Remaining errors are attributable solely to the author.
24
REFERENCES
Anderson, Terry L. and Peter J. Hill, 2004. The Not So Wild, Wild West. Property Rights on the Frontier. Stanford, CA: Stanford University Press.
Barnes, Robert F.W., 1999. Is There a Future for Elephants in West Africa? Mammalian Review 29(3): 175-199.
Barnes, R.F.W., C.G.. Craig, H.T. Dublin, G. Overton, W. Simmons and C.R. Thouless, 1999. African Elephant Database 1998. Occasional Paper of the IUCN Species Survival Commission No. 22. Gland, Switzerland and Cambridge, UK: IUCN, UNEP. 250pp.
Blanc, J. Julian, Richard F.W. Barnes, G. Colin Craig, Iain Douglas-Hamilton, Holly T. Dublin, John A. Hart and Chris R. Thouless, 2005. Changes in Elephant Numbers in Major Savanna Populations in Eastern and Southern Africa Pachyderm 38(January-June): 19-28.
Blanc, J.J., C.R. Thouless, J.A. Hart, H.T. Dublin, I. Douglas-Hamilton, G.C. Craig and R.F.W. Barnes, 2003. African Elephant Status Report 2002. An Update from the African Elephant Database. Occasional Paper of the IUCN Species Survival Commission No. 29. Gland, Switzerland and Cambridge, UK: IUCN, UNEP. 304pp.
Brooke, A., D. Kendrick, A. Meeraus and R. Raman. 2005. GAMS. A User’s Guide. Washington, DC: GAMS Development Corporation.
Bulte, E.H. and G.C. van Kooten, 1999. Economics of Anti-Poaching Enforcement and the Ivory Trade Ban, American Journal of Agricultural Economics 81(May): 453-66.
Bulte, E.H. and G.C. van Kooten, 1996. A Note on Ivory Trade and Elephant Conservation, Environment & Development Economics 1: 433-443.
Bulte, E.H., R. Damania and G.C. van Kooten, 2006. Do One-off Ivory Sales Encourage Illegal Elephant Harvests? Journal of Wildlife Management In press.
Bulte, E.H., G.C. van Kooten and T. Swanson, 2003. Economic Incentives and Wildlife Conservation. Paper prepared for the CITES Workshop on Economic Incentives and Trade Policy, Geneva, Switzerland, 1-3 December. 37pp. As viewed 26 October 2005 at: < http://www.cites.org/eng/prog/economics/CITES-draft6-final.pdf >.
Bulte, Erwin H., Richard D. Horan, and Jason F. Shogren, 2001. Banking on Extinction: Ivory Storage and Elephant Conservation. Selected paper, AAEA Annual Meeting, Chicago, Illinois, 5-8 August 2001. 17pp. As viewed 26 Ocotober 2005 at: <http://agecon.lib.umn.edu/cgi-bin/pdf_view.pl?paperid=2518&ftype=.pdf>.
Burrill, A. and I. Douglas-Hamilton, 1987. African Elephant Database Project: Final Report – Phase One. United Nations Environment Programme. GRID Case Study Series No.2 June 1987.
CITES (Convention on International Trade in Endangered Species of Wild Fauna and Flora), 2002. CoP12 Doc. 34.1. Final Document of the Twelfth Meeting of the Conferences of the Parties, Santiago, Chile, 3-15 November. 72pp.
Douglas-Hamilton, I., 1977-1979. The African Elephant Survey and Conservation Programme. Annual Report Summaries in WWF Yearbooks.
Douglas-Hamilton, I., 1979. African Elephant Ivory Trade – Final Report to U.S. Fish and Wildlife Service. Mimeograph.
Douglas-Hamilton, I., 1987. African Elephants: Population Trends and their Causes, Oryx 21: 11-24.
Douglas-Hamilton, I., 1993. The African Elephant Database, Pachyderm 16: 82-83. Dublin, H. T., T. Milliken and R. F. W. Barnes, 1995. Four Years After the CITES Ban:
Illegal Killing of Elephants, Ivory Trade and Stockpiles. Report of the IUCN/SSC African Elephant Specialist Group. January. 110pp.
Earnshaw, A. and L. Emerton, 2000. The Economics of Wildlife Tourism: Theory and Reality for Landowners in Africa. Chapter 16 (pp.315-334) in Wildlife Conservation by Sustainable Use edited by H. Prins, J. Grootenhuis and T. Dolan. Dordrecht, NL: Kluwer Academic Publishers.
Fischer, Frauke, 2005. Elephants in Cote d’Ivoire – A Warning for West African Conservation, Pachyderm 38(January-June): 64-75.
Fischer, Carolyn, 2004. The Complex Interactions of Markets for Endangered Species Products, Journal of Environmental Economics and Management 48: 926-953.
Hunter, Nigel, Esmond Martin and Tom Milliken, 2004. Determining the Number of Elephants Required to Supply Current Unregulated Ivory Markets in Africa and Asia, Pachyderm 36(January-June): 116-128.
ITRG., 1989. The Ivory Trade and the Future of the African Elephant: Interim Report. Mimeograph. Gaborone, Botswana.
Kontoleon, Andreas and Timothy Swanson, 2003. The Willingness to Pay for Property Rights for the Giant Panda: Can a Charismatic Species be an Instrument for Nature Conservation? Land Economics 79(November): 483-499.
Kremer, Michael and Charles Morcom, 2000. Elephants, American Economic Review 90(March): 212-234.
Martin, E. and D. Stiles, 2003. The Ivory Markets of East Asia. Nairobi, Kenya: Save the Elephants.
Menon, Vivek, 2002. Tusker. The Story of the Asian Elephant. New Delhi: Penguin Books India.
Milliken, T., 1997. The Status of Ivory Stocks in Africa 1990–1996, Traffic Bulletin 16(3): 93–106.
Milliken, T., R.W. Burn, F.M. Underwood and L. Sangalakula, 2004. The Elephant Trade Information System (ETIS) and the Illicit Trade in Ivory: A Report to the 13th Meeting of the Conference of the Parties to CITES, 20 August, TRAFFIC East/Southern Africa.
Milliken, T., R.W. Burn and L. Sangalakula, 2002. An Analysis of Trends of Elephant Product Seizure Data in ETIS; A Report to the 12th Meeting of the Conference of the Parties, 15 September, TRAFFIC East/Southern Africa.
Millner-Gulland, E. J. and N. Leader-Williams, 1992. A Model of Incentives for the Illegal Exploitation of Black Rhinos and Elephants: Poaching Pays in Luangwa Valley, Zambia, Journal of Applied Ecology 29: 388-401.
Roth, H.H. and I. Douglas-Hamilton, 1991. Distribution and Status of Elephants in West Africa. 1, Mammalia 55(4): 489-527.
26
Said, M. Y., R. N. Chunge, G. C. Craig, C. R. Thouless, R. F. W. Barnes and H. T. Dublin, 1995. African Elephant Database 1995. Occasional Paper of the IUCN Species Survival Commission No. 11. Gland, Switzerland: IUCN, UNEP. 225pp.
Scully, Matthew, 2002. Dominion. The Power of Man, the Suffering of Animals, and the Call to Mercy. New York: St. Martin’s Press.
Simmons, Randy T. and Urs P. Kreuter, 1989. Herd Mentality: Banning Ivory Sales is No Way to Save the Elephant, Policy Review Fall, 50, pp.46-49.
Soulé, M. E., 1987. Viable Populations for Conservation. Cambridge, UK: Cambridge University Press.
van Kooten, G.C. and E.H. Bulte, 2000. The Economics of Nature. Oxford, UK: Blackwell. World Bank, 2005. Data Profiles & Country Governance Tables. As viewed 21 March 2005
at: <http://info.worldbank.org/governance/kkz2002/>. Yacob, Yohannes, Jeheskel Shoshani, Yohannes Hagos and Emun Kebrom, 2004. The
Elephants (Loxodonta africana) of Zoba Gash Barka, Eritrea: Part 3: Ecological and Other Data from Tusks, Teeth and Carcasses Pachyderm 37(July-December): 45-58.
27
Table 1: African Elephant Stocks and Elephant Range by Region
2002Definite 16,450 117,716 246,592 5,458 402,067Probable 32,263 17,702 23,722 1,188 59,024Possible 64,477 22,511 26,098 3,039 99,813Speculative 82,563 5,738 7,508 3,498 99,307Total 195,753 163,667 303,920 13,183 676,523 Notes: Sources: 1989 data – ITRG (1989); 1995 data – Said et al. (1995); 1998 data – Barnes et al. (1999); 2002 data – Blanc et al. (2003) Totals may not sum due to the method used to develop population estimates. A list of countries included in each region is available in each of the cited documents.
28
Table 2: Seizures of Elephant Products and Demand for Poached Elephants by Regiona
Region Seizures of elephant products
(average per year)bNumber of ivory
Estimated number of elephants poached per yearc
1989 1990-2003 carversc Minimum MaximumAfrica 112 140.9 627 4,648 11,710Central Africa 0 2.0 198 1,770 4,453East Africa 34 36.4 35 216 545Southern Africa 70 98.9 132 841 2,122West Africa 8 1.0 152 1,119 2,821
Asiad 6 59.5 379(655)
1,785 (123)
4,475(349)
Europe 169 206.9 n.a. n.a. n.a.North America 0 206.6 n.a. n.a. n.a.Oceania 10 35.4 n.a. n.a. n.a.
Notes: a Central and South America and other regions are excluded because seizures reported to ETIS were insignificant; n.a. indicates not applicable, not known or not provided. b Source: Calculated from data in Milliken et al. (2004). Year 2004 data are omitted because not all information was available at the time this table was constructed. c Source: Hunter, Martin and Milliken (2004) d Carvers working with ivory originating from Africa are indicated with those using Asian elephant products provided in parentheses; annual number of African elephants required, with Asian elephants in parentheses.
29
Table 3: Postulated Regional Ivory Supply Functions: Legal and Illegal
With Ivory TradeIllegal supplyLegal supply Illegal supply
Under Trade Ban
Table 4: Summary Indicators of Governance and an Index of Law Enforcement Item Central Africa East Africa Southern Africa West Africa
Government effectivenessa -1.07 -0.88 -0.32 -0.88Regulatory qualitya -1.02 -0.92 -0.35 -0.70Rule of lawa -1.08 -0.97 -0.41 -0.79Control of corruptiona -1.13 -0.77 -0.46 -0.66Index of law enforcementb 0.0102 0.1668 0.8225 0.0006
Notes: a Source: World Bank (2005). Each index lies between -2.5 and +2.5, with lower values indicating poorer performance. (As an example, for each of the indexes in descending order in the left-hand column, Finland scores 2.01, 1.93, 1.99 and 2.39, respectively.) b Total number of in-region seizures divided by total seizures in Africa, and normalized for the number of elephants in the region.
30
Table 5: Importance of African Elephant Range by Region
Item Central Africa
East Africa Southern
Africa West
Africa Continent
1. Total area (km2) 5,365,550 6,182,037 5,973,020 5,096,660 22,617,2672. Elephant range area (km2) 2,060,763 969,113 1,680,130 219,868 4,929,8743. Range as % of total 38% 16% 28% 4% 22%4. % of total area protected 5% 4% 4% 2% 8%5. % of range in protected area 12% 24% 13% 40% 16%6. Elephants per km2 of range 0.095 0.169 0.181 0.060 0.1377. Average carrying capacity 0.162 0.236 0.220 0.190 0.1988. Elephant carrying capacity 333,844 228,711 369,629 41,775 973,9599. Ivory stocks in 1996 (kg) 204,138 170,677 316,938 13,747 705,50010. Confiscated ivory (kg) 16 291 791 8 1,10611. Total ivory stocks (kg) 204,154 170,968 317,729 13,755 706,60612. Assumed ivory stocks (kg) 250,000 200,000 400,000 50,000 900,000
Notes: Source for rows 1 – 5: Blanc et al. (2003); Rows 6 – 12: own calculation. Values in row 7 assume that for forest elephants (Central and West Africa) carrying capacity is 0.15 elephants per km2 in unprotected range and 0.25 per km2 in protected range. For savanna elephants (East and Southern Africa), capacities are assumed to be 0.2 for unprotected and 0.35 for protected range. Numbers in row 9 represent the allocation of total ivory stocks at the end of 1996 in proportion to each region’s elephant numbers. Row 10 represents estimated confiscations of ivory per year multiplied by eight years (assuming approximately 0.5 kg per seizure but doubling that to take account of culls, killing of nuisance animals, etc.). Row 11 is the sum of rows 9 and 10. Row 12 constitutes the assumed levels of ivory stocks in each region for initializing the model.
31
P*
pS(I=0)Africa (legal)
0q*
Price (US$/kg)
P** w
y
v
pD (I=0)non-Africa
Ivory quantity (kg)
pD (I=1)non-Africa
pS(I=0)Africa (Illegal)
z
x
pS(I=0)Africa (legal + illegal)
pS(I=1)Africa (Illegal)
qL
k
u
P*
pS(I=0)Africa (legal)
0q*
Price (US$/kg)
P** w
y
v
pD (I=0)non-Africa
Ivory quantity (kg)
pD (I=1)non-Africa
pS(I=0)Africa (Illegal)
z
x
pS(I=0)Africa (legal + illegal)
pS(I=1)Africa (Illegal)
qL
k
u
Figure 1: International Ivory Market under Free Trade and Trade Ban
x
0 Q+
Price (US$/kg)
pQ
c
e
m
d
Q
pD (I=0)non-Africa
Ivory quantity (kg)
SQ
pS(I=0)Africa (Illegal)
n
r
pQ+
SQ + pS(I=0)Africa (Illegal)
k
s
x
0 Q+
Price (US$/kg)
pQ
c
e
m
d
Q
pD (I=0)non-Africa
Ivory quantity (kg)
SQ
pS(I=0)Africa (Illegal)
n
r
pQ+
SQ + pS(I=0)Africa (Illegal)
k
s
Figure 2: International Ivory Market under a Quota System
32
0
20,000
40,000
60,000
80,000
1989 1991 1993 1995 1997 1999 2001 2003
Year
Piec
es
0
7,000
14,000
21,000
28,000
Wei
ght (
kg)
pieces
weight
Figure 3: Estimated Amount of Ivory (in 'raw ivory equivalent') Represented by ETIS Seizure Data, 1989-2004 (as of 6 July 2004)
250000
350000
450000
550000
650000
750000
0 10 20 30 40 5
Period
Ele
phan
ts
0
NoPoach(5%) Poach(5%) NoPoach(20%) Poach(20%)
Figure 4a: Optimal Elephant Populations under Trade, with Tourism Benefits, No Conservation Payments, 5% and 20% Discount Rates, with and without Poaching
33
0
20000
40000
60000
80000
0 10 20 30 40
Period
Har
vest
s
50
IllegalPoach LegalPoach LegalNoPoach
Figure 4b: Legal and Illegal Elephant Harvests under Trade, with Tourism Benefits, No Conservation Payments, 5% Discount Rate, with and without Poaching
250000
300000
350000
400000
450000
500000
0 10 20 30 40 50
Period
Ivor
y Sa
les (
kg)
0
200000
400000
600000
800000
1000000
Ivor
y St
ock
(kg)
PoachSale NoPoachSale PoachStock NoPoachStock
Figure 4c: Ivory Stocks and Ivory Sales under Trade, with Tourism Benefits, No Conservation Payments, 5% Discount Rate, with and without Poaching
34
0
300000
600000
900000
0 10 20 30 40 5
Period
Ivor
y St
ock
(Kg)
0
hi($5) lo($0.50)
Figure 5: Ivory Stocks Held by Range States under Trade, with Tourism Benefits, No Conservation Payments, 5% Discount Rate, Low and High Holding Costs
0
100000
200000
300000
400000
500000
600000
700000
0 10 20 30 40 5
Period
Ele
phan
ts
0
None Tour only Conserve only Tour&Conserve
Figure 6a: Race to the Bottom: Optimal Elephant Populations with and without Tourism Benefits and ‘Mid’ Conservation Payments, 5% Discount Rate
35
0
100000
200000
300000
400000
500000
600000
700000
0 10 20 30 40
Period
Ele
phan
ts
50
None Tour only Conserve only Tour&Conserve
Figure 6b: Race to the Bottom: Optimal Elephant Populations with and without Tourism Benefits and ‘Mid’ Conservation Payments, 20% Discount Rate
Figure 7: Optimal Elephant Stocks: A Comparison of a Fixed versus ‘Variable’ versus No Conservation Payment, Tourism Benefits Included, 5% and 20% Discount Rates
36
0
100000
200000
300000
0 10 20 30 40
Period
Ele
phan
ts
50
Central East South West
Figure 8: Optimal Elephant Stocks for Various African Regions, ‘Hi’ Conservation Payments, Tourism Benefits, 5% Discount Rate
900000
1000000
1100000
1200000
0 10 20 30 40 5
Period
Ivor
y st
ocks
(kg)
0
Conf(.05)5% Conf(.5)5% Conf(.05)20%
Figure 9: Ivory Stockpiles under an Ivory Trade Ban, by Discount Rate (%) and Proportion Confiscated
37
APPENDIX A: NOTES PERTAINING TO THE CALCULATION OF THE OBJECTIVE FUNCTION FOR USE IN THE GAMS PROGRAMMING MODEL
We calculate the consumer surplus as the area under the excess demand function. To this we add the net revenue to range states. Let the excess demand function be linear:
(A1) pd = a – b Q, with Q = and N = number of regions. ∑=
N
rrq
1
Assume that the individual regional marginal cost (supply) of ivory functions are given by:
(A2) ∑∑==
−==⇒
−=⇒+=
N
r r
rSr
N
rr
r
rSr
rrrrSr
pqQpqqp11 β
αβαβα .
The total revenue is
(A3) TR = pd Q = (a – b Q) Q,
while the consumer surplus is
(A4) CS = ½ (a – pd) Q = ½ bQ2.
The total benefit from sales of ivory in any period is given by the sum of TR and CS.
(A5) TR + CS = (a – ½ b Q) Q.
On the supply side, it is possible that, in some periods, one or more regions do not have enough ivory to sell, or they prefer not to harvest elephants and/or hold ivory in stocks. In those cases, demand price exceeds regional marginal cost. To obtain the net surplus in the ivory market, it is necessary to subtract from total benefit the sum of the individual regional total costs. For any given period, the total cost of supplying ivory is:
(A6) TC = ( ) ∑∑∑===
++=+=−+N
rrrrrr
N
rrr
Sr
N
rrr
Srrr qqqpqpq
111)(5.0)(5.0)(5.0 αβαααα
. ∑=
+=r
rrrr qq1
]5.0[ βαN
The net surplus in the international market for ivory in a given period is then:
(A6) NS = TR + CS – TC = [a Q – ½ b Q2] – . ∑=
+N
rrrrr qq
1]5.0[ βα
APPENDIX B: DETAILED RESULTS OF VARIOUS SCENARIOS
African versus Global Perspective
African range states have greater control than other countries over elephant numbers (through decisions regarding habitat conservation, rules governing property rights, funding for anti-poaching efforts, penalties for poaching, and so on) and movement/trade of raw and worked ivory. Thus, it is appropriate to take an African as opposed to global perspective. This does not rule out conservation payments made by rich countries to range states to protect elephants, however. A global decision maker includes the surplus to ivory consumers in objective function (1), while it is ignored by an African decision maker. Consider the implications of taking an African viewpoint in the case of free trade with poaching.
If non-market benefits from tourism and elephant conservation are completely ignored, and a discount rate of 5% is employed, there is a race to the bottom – elephant populations collapse in some 30 years if a global perspective is taken and 40 years if an African perspective is taken (Figure B1). Elephant populations first collapse in Southern, Central and West Africa followed by those in East Africa. The elephant’s demise occurs even sooner if a discount rate of 20% is used. Although not directly comparable because sales of ivory and harvests of elephants differ, the net discounted global surplus over the 200-year time horizon is $3.01 billion while the African surplus is $2.22 billion (see Table B1). The reason why the optimal population is higher from the perspective of an African as opposed to a global decision maker is that the African decision maker ignores benefits accruing to consumers of ivory.
If a low discount rate of 5% is employed and countries are concerned about tourism benefits, the elephant’s demise is preventable (see Figure B2). In this case, a decision maker with a global perspective will choose to conserve slightly more elephants in situ than would one who takes only an African perspective, although the differences in each region are small. The global surplus is $11.53 billion, while the African surplus is $10.79 billion (Table B1). However, if a discount rate of 20% is assumed (Figure B3), elephants will disappear in less than 10 years (global perspective) or somewhat more than 10 years (African perspective) in West and Central Africa, but will stabilize at about 80,000 animals in East Africa and slightly more than 160,000 in Southern Africa (with the optimal ‘steady state’ somewhat higher if the African perspective is adopted). Global surplus is $3.88 billion, while African surplus is $3.32 billion (Table B1).
Conservation payments from rich countries to African range states reduce the optimal stocks of elephants that countries hold compared to the case where only tourism benefits are taken into account.19 Upon comparing the bottom diagram in Figure B2 with the top diagrams in Figures B4 and B5, it is clear that, for a 5% discount rate, conservations payments reduce
19 In the scenarios reported in Figures B4 and B5, conservation payments are made according to the total area under the marginal WTP curve rather than as a fixed payment per elephant.
39
the optimal stock of elephants. However, in the absence of tourism benefits, conservation payments actually increase optimal elephant stocks, significantly so that the elephant’s demise is prevented (see Figure 6 in the main text). From a regional perspective, elephants will go extinct in every region if tourism benefits are ignored and no conservation payments are made (Figure B6), although it takes almost 40 years for this to occur for a low discount rate and less than 10 years for a high discount rate. When conservation payments are made according to a downward sloping schedule, and there are no tourism benefits, a fine dance occurs between the regions (see Figure B7). In this particular model and for a 5% discount rate, elephants disappear in West and (surprisingly) Southern Africa, while they disappear in all regions but Southern Africa for a 20% discount rate. Clearly, a fixed payment is preferred to a variable one, but if the latter is used a game theoretic model might be more appropriate (although this is left for future research).
The Curse of Time Preference
Partly because of people’s poverty but also because of the uncertainty created by the poor governance structures in developing countries, it is necessary to employ a much higher rate of discount than that used in richer countries. It is not unreasonable, therefore, to employ a discount rate of 20% in evaluating investment programs, even public ones. People’s rates of time preference are generally much higher that they are in developed countries. The higher discount rate leads to a greater chance that the elephant will not survive without some form of intervention by rich countries, even if this amounts to helping African states to link elephant populations to tourism benefits. In all cases, elephants will disappear rapidly unless they provide tourist-related benefits or conservation payments from rich nations to poor African states take place. Even then, optimal elephant stocks are substantially lower with the 20% discount rate, with optimal stocks in Central and West Africa prone to collapse while those in East and Southern Africa decline significantly (see Figures B1, B3 through B7). The only thing that prevents their demise in the latter regions is the existence of tourism benefits; without these, populations might collapse if an African decision maker manages continent elephant stocks to take advantage of compensation payments from rick countries to poor African states, and tourism benefits are taken into account (compare the bottom diagram of Figure B2 with the top diagram of Figure B4). As indicated in Figure B6, if there are no non-market benefits whatsoever, the effect of the higher discount rate is to bring about a very rapid collapse of elephant stocks, even more rapid than has been noted for the 1980s.
The Ivory Trade Ban
Figure 8 illustrates the effect of a trade ban. Here the discount rate is that employed by the poaching gangs. In all cases, the elephant disappears, although the rate of its demise is slower for lower discount rates. Of course, these results are based on only one scenario concerning the illegal supply functions and confiscation rate (although it was shown not to have much effect in the range of 0% to 50%) and other assumptions about the costs of marketing illegal ivory could result in increasing populations. However, they do suggest that the trade ban may not be effective without greater monitoring and enforcement.
40
Table B1: Comparison of the Discounted Value of Total Benefits, Tourism Benefits and Conservation Payments, Various Scenarios and Discount Rates (1990 US$ × 109) 5% 20% Scenario Total Tourism Conserve
paymentTotal Tourism Conserve
payment1. No in situ benefits 2.22 0.00 0.00 1.06 0.00 0.002. Tourism benefits, no conservation payments
10.78 8.85 0.00 3.32 2.47 0.00
3. Tourism benefits, ‘Lo’ conservation payments
15.37 8.33 5.00 4.50 2.38 1.25
4. Tourism benefits, ‘Mid’ conservation payments
22.38 8.20 12.14 6.25 2.36 3.04
5. Tourism benefits, ‘Hi’ conservation payments
28.62 8.16 18.42 7.83 2.35 4.63
6. No tourism benefits, ‘Mid’ conservation payments
14.29 0.00 12.23 3.93 0.00 3.05
7. No poaching, tourism benefits, no conservation payments
10.28 8.82 0.00 3.09 2.48 0.00
41
0
75000
150000
225000
300000
375000
0 5 10 15 20 25 30 35 40 45 50
Period
Ele
phan
ts
Central East South West
0
75000
150000
225000
300000
375000
0 5 10 15 20 25 30 35 40 45 50
Period
Ele
phan
ts
Central East South West
Figure B1: Optimal Elephant Populations under Trade with No Conservation Side Payments, No Tourism Benefits and 5% Discount Rate, African Regions: Top Diagram
Shows Global Perspective, Bottom Diagram Shows African Perspective
42
0
75000
150000
225000
300000
375000
0 5 10 15 20 25 30 35 40 45 50
Period
Ele
phan
ts
Central East South West
0
75000
150000
225000
300000
375000
0 5 10 15 20 25 30 35 40 45 50
Period
Ele
phan
ts
Central East South West Figure B2: Optimal Elephant Populations under Trade with Tourism Benefits, No
Conservation Side Payments and 5% Discount Rate, African Regions: Top Diagram Shows Global Perspective, Bottom Diagram Shows African Perspective
43
0
75000
150000
225000
300000
375000
0 5 10 15 20 25 30 35 40 45 50
Period
Ele
phan
ts
Central East South West
0
75000
150000
225000
300000
375000
0 5 10 15 20 25 30 35 40 45 50
Period
Ele
phan
ts
Central East South West
Figure B3: Optimal Elephant Populations under Trade with Tourism Benefits, No Conservation Side Payments and 20% Discount Rate, African Regions: Top Diagram
Shows Global Perspective, Bottom Diagram Shows African Perspective
44
0
75000
150000
225000
300000
375000
0 5 10 15 20 25 30 35 40 45 50
Period
Ele
phan
ts
Central East South West
0
75000
150000
225000
300000
375000
0 5 10 15 20 25 30 35 40 45 50
Period
Ele
phan
ts
Central East South West Figure B4: Optimal Elephant Populations under Trade with Tourism Benefits, Lo
Conservation Side Payments, African Regions: Top Diagram Shows 5% Discount Rate, Bottom Diagram Shows 20% Discount Rate
45
0
75000
150000
225000
300000
375000
0 5 10 15 20 25 30 35 40 45 50
Period
Ele
phan
ts
Central East South West
0
75000
150000
225000
300000
375000
0 5 10 15 20 25 30 35 40 45 50
Period
Ele
phan
ts
Central East South West Figure B5: Optimal Elephant Populations under Trade with Tourism Benefits, Hi
Conservation Side Payments, African Regions: Top Diagram Shows 5% Discount Rate, Bottom Diagram Shows 20% Discount Rate
46
0
100000
200000
300000
0 10 20 30 40 5
Period
Ele
phan
ts
0
Central East South West
0
75000
150000
225000
300000
375000
0 5 10 15 20 25 30 35 40 45 50
Period
Ele
phan
ts
Central East South West
Figure B6: Optimal Elephant Populations under Trade with No Tourism Benefits and No Conservation Side Payments, African Regions: Top Diagram Shows 5% Discount
Rate, Bottom Diagram Shows 20% Discount Rate
47
0
75000
150000
225000
300000
375000
0 5 10 15 20 25 30 35 40 45 50
Period
Ele
phan
ts
Central East South West
0
75000
150000
225000
300000
375000
0 5 10 15 20 25 30 35 40 45 50
Period
Ele
phan
ts
Central East South West Figure B7: Optimal Elephant Populations under Trade with No Tourism Benefits and Mid Conservation Side Payments, African Regions: Top Diagram Shows 5% Discount
Rate, Bottom Diagram Shows 20% Discount Rate
48
0
75000
150000
225000
300000
375000
0 5 10 15 20 25 30 35 40 45 50
Period
Ele
phan
ts
Central East South West
0
75000
150000
225000
300000
375000
0 5 10 15 20 25 30 35 40 45 50
Period
Ele
phan
ts
Central East South West
Figure B8: Race to the Bottom: Optimal Elephant Populations under a Trade Ban with 5% (Top) and 50% (Bottom) Confiscation Rates, 5% Discount Rate
49
QP_ivory_trade$Title Ivory Trade Model*$onsymlist*$onsymxref$Offupper*$offlisting************************************************************************ This is the ivory trade model. It consists of an objective function* which is to maximize net benefits (either consumer plus producer* surplus or simply what producers get -- whether these are countries* or illegal harvesters (depends on how the model is run), elephant* growth and harvest constraints, an excess demand function, four* African regional supply functions, an ivory stock constraint and* sustainability constraints. Supply and demand functions are affected* by stigma attached to the ivory trade ban.************************************************************************ $Offtext
SETS t years in the time horizon /1*200/ r Four African regions /cent, east, south, west/ ;
SETS tinit(t) first time period tfinal(t) final time period ; tinit(t)=yes$(ord(t) eq 1); tfinal(t)=yes$(ord(t) eq card(t));
SCALARS dint intercept of excess demand function with no trade ban dslope slope of excess demand function with no trade ban drate discount rate gamma conversion factor gives kg of ivory per elephant damage annual ecosystem damage caused by one elephant storage Costs to African country of storing ivory each period harvcost Constant elephant harvest benalt Fixed conservation payment per x if WTP function not used benpar0 Parameter on in situ benefit function: benpar1 B(x)=benpar0*x - benpar1*x^2 growth Intrinsic growth rate of the elephant stock confis Rate at which poached ivory is confiscated ;
dint=720; dslope=0.0005; drate=0.05; gamma=7.5; damage=165; storage=0.5; harvcost=60; benalt = 0;* Lo scenario $75, Mid $175, Hi $260 benpar0=00;* Lo scenario 1500, Mid is 3600, Hi is 5400 benpar1=0.00;* Lo scenario 0.0022, Mid is 0.0053, Hi is 0.0079 growth=0.067; confis=0.05;
PARAMETER int(r) intercept on legal supply functions
/cent 30Page 1
QP_ivory_trade east 10 south 50 west 20 /;
PARAMETER slope(r) slopes of legal supply functions
/cent 0.00054 east 0.00079 south 0.00022 west 0.00292 /;
PARAMETER int2(r) intercept on illegal supply functions
/ cent 45 east 35 south 75 west 35 /;
PARAMETER slope2(r) slopes of illegal supply functions
/ cent 0.0007 east 0.00307 south 0.0015 west 0.0092 /;
PARAMETER tour(r) intercepts of linear marginal tourism benefit function
/cent 200 east 2000 south 1680 west 267 /;
PARAMETER stour(r) slopes of linear marginal tourism benefit function
/cent -0.0010 east -0.0133 south -0.0056 west -0.0178 /;
PARAMETER xstart(r) initial elephant stocks
/cent 195753 east 163667 south 303920 west 13183 /;
PARAMETER cc(r) elephant ecosystem carrying capacity by region
/cent 333844 east 228711 south 369629 west 41775 /;
PARAMETER vstart(r) initial ivory stock in region r
/cent 250000 east 200000 south 400000 west 50000 /;
PARAMETERS i(t) counting parameter for discounting beta(t) discount fator
VARIABLES z1 objective value for gloval wellbeing with poaching ($ mil) z2 objective value for African wellbeing with poaching ($ mil) harv(t,r) legal harvest of elephants by region and period x(t,r) elephant numbers by region and period ivory(t,r) ivory stocks by region and period (kg) q(t,r) ivory sold by each region in each period (kg) harv2(t,r) illegal harvest of elephants by region and period q2(t,r) illegal ivory sold by each region in each period (kg) dprice(t) demand price in each year elephant(t) stock of elephants in each period sales(t) total annual sales of ivory ;
EQUATIONS maxrev1 objective function for globla welfare ($US mil) maxrev2 objective function for African welfare ($US mil) ostock(t,r) opening stocks of elephants oivory(t,r) opening stocks of ivory ivoryeq(t,r) ivory stock equation of motion popeq(t,r) elephant population equation of motion ivor(t,r) constraint on quantity of ivory sold by region ivor2(t,r) illegal supply of ivory from each region demandp(t) excess demand price in each period mktclr(t,r) market clearing price condition for legal ivory sales mktclr2(t,r) market clearing price condition for illegal ivory sales cartel(t,r) market clearing condition for cartel harvest(t,r) restrict total harvests to a proportion of all elephants carry(t,r) elephants cannot exceed carrying capacity sumq(t) total ivory sold in each year sumx(t) total elephant stock in each year ;
* Supply and demand functions are in inverse (price dependent) format
* --------------------------------------------------------* Construction of actual constrained optimization model* --------------------------------------------------------
file Poach;*file Poach /D:\My Documents\Biology\Elephants\Programs\Poach_out.txt/;*Page widthPoach.pw=30000;*Number of decimal places in NoPoach_outPoach.nd=0;
Page 4
QP_ivory_tradeput Poach 'Run on ' system.date /'Using source file '/ system.ifile //;*Solve global using qcp maximizing z1;*Solve Africa using qcp maximizing z2;Solve IvoorCartel using qcp maximizing z2;
*---------------------------------------------------------------------------* This is the report writing section. Variables for report are created.*---------------------------------------------------------------------------
Parameters harvtot(t) total annual legal take of elephants harvtot2(t) total annual illegal take of elephants stockv(t) total stock of ivory by year legal(t) total annual legal sales of ivory illegal(t) total annual illegal sales of ivory conserve Discounted conservation payment tourben(t,r) tourism benefits by region and period touristben total tourism benefits ;