38
Working Paper 314 Imposition of MAT on SEZs: Concerns and the Way Forward Arpita Mukherjee Bhavook Bhardwaj February 2016 INDIAN COUNCIL FOR RESEARCH ON INTERNATIONAL ECONOMIC RELATIONS

1
Working Paper 314
Imposition of MAT on SEZs: Concerns and the
Way Forward
Arpita Mukherjee
Bhavook Bhardwaj
February 2016
INDIAN COUNCIL FOR RESEARCH ON INTERNATIONAL ECONOMIC RELATIONS

Table of Contents
Acknowledgements ................................................................................................................... i
Abstract ..................................................................................................................................... ii
List of Abbreviations ............................................................................................................. iii
1. Introduction ........................................................................................................................ 1
2. A Brief Overview of MAT and its Imposition on SEZs .................................................. 3
3. Performance of SEZs before and after Imposition of MAT .......................................... 7
3.1 Exports from SEZs – Before and After the Imposition of MAT................................... 9
3.2 Investment in SEZs before and after the Imposition of MAT .................................... 11
3.3 Employment in SEZs ................................................................................................. 12
4. Impact of Imposition of MAT: The Primary Survey ................................................... 12
4.1 Developer Survey Analysis ....................................................................................... 13
4.2 The Survey of Units in SEZs...................................................................................... 14
4.3 MAT Filed by Units in SEZs ..................................................................................... 17
5. Corporate/Income Tax Exemptions to SEZs in Select Countries ............................... 18
6. Conclusion and Way Forward ........................................................................................ 23
References ............................................................................................................................... 27
Appendix A ............................................................................................................................. 29
Appendix B ............................................................................................................................. 30
Annexure A ............................................................................................................................. 31
List of Tables
Table 1: Increase in the MAT rate from the Assessment Year 2009-10 to 2015-16 ............. 4
Table 2: Exports from SEZs ................................................................................................... 9
Table 3: Investment in SEZs (in Rs. billion)........................................................................ 11
Table 4: Foreign Direct Investment in SEZs (in Rs. billion) ............................................... 12
List of Figures
Figure 1: SEZ Units Registered Since April 1, 2012 .............................................................. 8
Figure 2: Year Wise De-notifications (2010-11 onwards) ...................................................... 8
Figure 3: Exports from SEZs vs. Rest of the Economy (2005-06 to 2013-14)* ................... 10
Figure 4: Motivating Factors for Starting Operations in SEZs ............................................. 15
Figure 5: Perception of Companies across Different Industries on Importance of Income
Tax Holiday ........................................................................................................... 15
Figure 6: Responses by Different Industries ......................................................................... 17
List of Box
Box 1 Direct Tax Incentives in Select Countries ............................................................. 20

i
Acknowledgements
We express our gratitude to Rajat Kathuria, Director and Chief Executive, ICRIER, for
giving us the opportunity to work in this area and for his constant encouragement and
support. We would like to thank officials of the Special Economic Zone (SEZ) Division,
Department of Commerce, Ministry of Commerce and Industry, for their useful insights and
providing access to SEZ related data and information. The Development Commissioners of
SEZs helped us to collect the data while NSDL (National Securities Depository Limited)
Database Management Limited (NDML) provided the compiled data. The Export Promotion
Council for Export Oriented Units (EOUs) and SEZs (EPCES) provided valuable
information. We are grateful to Anwarul Hoda (Professor, ICRIER), Rajiva Ranjan Singh
(Senior Consultant, ICRIER), Harish Kumar (Principal Director of Income Tax), Vivek
Gambhir (Chartered Accountant), Emendra Paul Singh (Director, Financial Services, All
State Financial Services Pvt. Ltd.) and Ashwin Ravindranath (Partner, Direct Tax, Tax &
Regulatory Services, Ernst and Young LLP) for their valuable inputs. We would also like to
thank Tanu M. Goyal (Consultant, ICRIER), Avantika Kapoor (Research Assistant, ICRIER)
and Suvi Agrawal (Research Intern, ICRIER) for their valuable suggestions. We are grateful
to Tara Nair for copyediting the paper. The administrative team in ICRIER deserves a special
mention. In particular, we would like to thank Anu Mohandas for administrative support.

ii
Abstract
A Special Economic Zone (SEZ) is a type of managed industrial cluster which focuses on
exports and encourages the inflow of foreign direct investment (FDI) and technology. These
“special” zones are given a range of fiscal and non-fiscal incentives, which are not available
to firms located in the rest of the country. Fiscal incentives largely include tax concessions.
While there can be arguments for or against giving fiscal incentives to an industrial cluster, in
practice, a number of developing countries, which promote SEZs, provide tax incentives.
Some of these incentives are actionable or even prohibited under the World Trade
Organization’s (WTO) Subsidies and Countervailing Measures Agreement. Given this
background, this paper focuses on one such direct tax incentive, namely, the exemption from
minimum alternate tax (MAT), and the implication of its withdrawal on Indian SEZ
developers and units.
Based on secondary data, the paper tries to examine if the withdrawal of the MAT exemption
from 1 April, 2012, has adversely affected the performance of Indian SEZs. Based on a
primary survey, it tries to understand the importance of direct tax benefits, including MAT
exemption, for SEZ developers and units. The paper also examines the direct tax incentives
given to SEZs across countries such as Bangladesh, Philippines, Republic of Korea, United
Arab Emirates (Dubai) and Vietnam, with whom India competes to get FDI and technology.
The paper concludes that all countries provide direct tax incentives to SEZs, and hence, if
India wants to continue with the SEZ policy, it has to provide the direct tax incentives.
However, such incentives are not unconditional and have to be phased out over time. The
paper identifies the gaps in the design of direct tax incentives, focusing on the income tax and
MAT exemptions. It makes policy recommendations on how to make the SEZ policy
successful and an instrument of the “Make in India” Campaign.
________
Keywords: SEZs, fiscal policy, India, income tax, minimum alternate tax (MAT), trade policy
JEL classification: F13, H20, H32, K34
Authors’ email: [email protected]; [email protected]
_________
Disclaimer: Opinions and recommendations in the report are exclusively of the author(s)
and not of any other individual or institution including ICRIER. This report has been
prepared in good faith on the basis of information available at the date of publication. All
interactions and transactions with industry sponsors and their representatives have been
transparent and conducted in an open, honest and independent manner as enshrined in
ICRIER Memorandum of Association. ICRIER does not accept any corporate funding that
comes with a mandated research area which is not in line with ICRIER’s research agenda.
The corporate funding of an ICRIER activity does not, in any way, imply ICRIER’s
endorsement of the views of the sponsoring organization or its products or policies. ICRIER
does not conduct research that is focused on any specific product or service provided by the
corporate sponsor.

iii
List of Abbreviations
DC Development Commissioner
DDT dividend distribution tax
DGCI&S Directorate General of Commercial Intelligence and Statistics
DTA Domestic Tariff Area
EOU Export Oriented Unit
EPCES Export Promotion Council for EOUs & SEZs
EPZ Export Processing Zone
ETDZ Economic and Technological Development Zone
FDI foreign direct investment
FEZ Free Economic Zone
FIAS Frankfurt Institute for Advanced Studies
FTZ Free Trade Zone
HIDZ High-tech Industrial Development Zone
IT information technology
ITeS information technology enabled services
MAT minimum alternate tax
NDML NSDL Database Management Limited
NFE net foreign exchange
NSDL National Securities Depository Limited
SCM Subsidies and Countervailing Measures
SEZ Special Economic Zone
UAE United Arab Emirates
US United States
VAT value added tax
WTO World Trade Organization

1
Imposition of MAT on SEZs: Concerns and the Way Forward
Arpita Mukherjee & Bhavook Bhardwaj1
1. Introduction
Globally, the term Special Economic Zones (SEZs) covers a broad range of managed
industrial clusters2 including Free Trade Zones (FTZs), Export Processing Zones (EPZs),
Economic and Technological Development Zones (ETDZs) and High-tech Industrial
Development Zones (HIDZs), that can have different definitions. However, they share one
common feature – these zones focus on exports and receive certain fiscal and non-fiscal
incentives from the government, which may not be available to industrial clusters and firms
located outside these zones. Fiscal incentives can be in the form of tax or duty reductions or
exemptions and subsidies. These can include direct tax benefits such as income tax holidays
for a certain period of time and indirect tax benefits such as service tax or value added tax
(VAT) exemptions. Non-fiscal incentives are in the form of single-window clearances for
setting up of units, government support in acquisition of contiguous land, training for
employees and simplified procedures for custom clearances. The incentives can be given to
both developers and units in these zones.
SEZs were initially developed to promote the growth of manufacturing and exports through a
cluster-based approach, which leads to economies of scale. These are a ‘special’ form of
industrial clusters that focus on attracting domestic and foreign investment and global best
management practices and technology. SEZs have also been used as test-bed for reforms in
countries such as China. To attract private and foreign investment, countries offer a range of
fiscal and non-fiscal incentives to the SEZs. Given the fiscal constraints, it is often not
possible for a developing country to offer world-class infrastructure throughout the country.
Such countries can have state-of-the-art infrastructure in SEZs and can attract global
companies to these zones (for details see Palit and Bhattacharjee, 2008) by giving fiscal and
non-fiscal incentives.
Some of the incentives given to the SEZs can be prohibited or actionable under the World
Trade Organization (WTO) Subsidies and Countervailing Measures (SCM) Agreement.
Therefore, developed countries have moved away from the concept of providing fiscal
incentives to “special zones”. However, developing countries continue to promote SEZs and
provide them with various fiscal and non-fiscal incentives.
1 Arpita Mukherjee is a Professor and Bhavook Bhardwaj is a Research Assistant at Indian Council for
Research on International Economic Relations (ICRIER). 2 When a cluster is developed by a developer or authority that provides common infrastructure such as
power, water and internal road connectivity and common user facilities such as a water treatment plant and
an effluent treatment plant, it is known as a managed cluster. Managed clusters can be for a single-product
(with units producing the output of one sector) or multi-product (with units producing output related to
various sectors). Managed clusters have certain norms for entry and exit. Although other forms of managed
industrial clusters/parks can receive incentives, this paper focuses only on SEZs.

2
There are several arguments for and against the incentives given to SEZs in a developing
country that has fiscal constraints and earns most of its revenue from direct and indirect taxes
(see Pandya and Joshi, 2015). It is often argued that fiscal incentives represent revenue
forgone, especially in cases where the developing country subsidises firms from developed
countries in SEZs. Countering this view, FIAS (2008) and Farole and Akinci (2011) have
found that SEZs contribute to the growth in exports, export diversifications, employment
creation, inflow of technology and best management practices. They argued that if the
developing country is able to attract FDI and technology, create employment and enhance
exports, as has been the case with China, the benefits are far greater than the revenue forgone.
Further, some of these benefits can spill-over to industries in the domestic tariff area (DTA)3
through backward linkages. The domestic economy benefits from the direct and indirect
employment created by SEZs due to their enhanced business activities, technology transfer
and skill up-gradation from improved external competitiveness, and through the development
of better supply and value chains.
Tantri (2015) points out that the linkages between fiscal incentives and the performance of
SEZs depend on several factors such as the extent of reforms in the country, the sectors or
industries that receive the incentives (for example, if import intensive industries receive the
incentives, it can lead to a loss of revenue), etc. Studies have also examined the role of fiscal
incentives in a company’s decision to locate in a country or zone. Woodward and Rolfe
(1993) find that government incentives, especially the length of tax holidays, have an impact
on export-oriented FDI as against market-oriented FDI. Ceislik and Ryan (2005) find that tax
incentives do not have a significant influence on the location decisions for Japanese
multinationals. In the case of India, Nidheesh (2014) finds a positive relationship between tax
incentives and exports, investment and employment for the Cochin SEZ. A survey of 102
SEZ firms in Gujarat by Pandya and Joshi (2015) shows that almost 75 per cent of the
respondents consider direct tax incentives to be more important than indirect incentives.
Thus, the existing literature highlights the role of fiscal incentives in a company’s location
decision as well as in the performance of SEZs.
India was one of the first countries to have an export processing zone in Kandla in 1965. The
export processing zones were given a range of fiscal incentives. Inspired by China’s success
in enhancing its global share of exports through SEZs, India drafted its SEZ Act in 2005,
followed by the SEZ Rules in 2006. The SEZ Act, 2005, specifies a list of fiscal incentives
that are given to developers and units located in an SEZ. These include both direct and
indirect tax benefits such as exemptions from taxes, duties and cess on goods and services
exported out of, or imported into an SEZ, or procured from the DTA, exemptions from
income tax for a certain time period, exemptions from minimum alternate tax (MAT) and
dividend distribution tax (DDT), exemptions from central sales tax, and exemptions from
services tax.4
3 DTA means an area within a country (say, India) that is outside the Special Economic Zones. 4 For details, see http://www.sezindia.nic.in/about-fi.asp (accessed on 9 December, 2015)

3
The benefits offered to SEZs on direct taxes under the Income Tax Act, 1961 are given in the
Second Schedule of the SEZ Act, 2005. MAT exemption was one of the important direct tax
benefits that the SEZs enjoyed under the SEZ Act of 2005. However, in the Union Budget
2011-12, it was announced that the MAT and DDT exemptions will be withdrawn from 1
April, 2012 and that neither developers nor units will enjoy MAT exemption any longer.
Subsequently, the Finance Act, 2011, notified the imposition of MAT and DDT on SEZs (see
Appendix A for details).
A number of studies have shown that the withdrawal of MAT incentives has adversely
affected the morale of exporters in SEZs. It is further argued that with the withdrawal of
MAT exemptions, operation in DTA is more beneficial than operation in SEZs (for example,
see Sharma et al., 2014). However, others have argued that the government gives significant
incentives to SEZs without commensurate benefits (Dutta, 2009).5 Even before the
imposition of MAT, a number of SEZs were notified (which implies that they had land and
were enjoying tax benefits) but had not become operational (implying that they were not able
to attract units in spite of the attractive fiscal regime). Some have even questioned the
desirability of continuing with tax incentives for SEZs in view of their limited growth and
not-too-significant contribution to exports (Bagchi et al., 2005). More recently, the
government’s own reports (Department of Revenue, 2014) highlight a huge revenue loss due
to the fiscal benefits given to the SEZs.
Given this background, the objective of this paper is to understand the impact of the
withdrawal of the MAT exemptions on SEZs. The layout of the paper is as follows. Section
1 provides a brief overview of MAT. Section 2 analyses the performance of SEZs before and
after the imposition of MAT based on secondary data. A primary survey of SEZ developers
and units is presented in Section 3. The survey tries to understand the perception of
developers and units about the impact of the imposition of MAT. Section 4 discusses direct
tax exemptions in select countries, which enables a comparison with India. Section 5 presents
the key findings and policy recommendations.
2. A Brief Overview of MAT and its Imposition on SEZs
MAT, a form of income tax levied on companies, was first introduced in India through the
Finance Act of 1983 via Section 80VVA. It was effectively imposed by the Finance Act of
1987 under Section 115JB of the Income Tax Act, 1961. MAT was modelled on the
“alternate minimum tax” or “minimum tax” of countries such as the United States (US). A
number of countries, namely Brazil, Russia, China, South Africa, Austria, Belgium, Republic
of Korea and the US, levy MAT. However, countries differ in their approach as to who
should be covered under MAT (for example, domestic companies, foreign companies, foreign
institutional investors, etc.). Most countries do not levy MAT on foreign companies unless
they are physically present in the country (for details see Ministry of Finance, 2015).
Generally, countries levy MAT based on type of company (domestic companies, foreign
5 See also “Special Economic Zone – Brain or Drain” by Kavitha Rao, Business Standard, 8 September,
2007.

4
companies, foreign institutional investors, etc.) but not on the basis of where the company is
located – SEZs or DTA. Further, a number of countries such as the US and the European
Union member states have moved away from the SEZ model after the implementation of the
WTO’s SCM agreement and hence, the issue of giving MAT exemptions to SEZs does not
arise. Countries such as China and Republic of Korea, which levy MAT, do not specify the
MAT exemption in their SEZ policy (see Section 4).
Globally, the rationale behind the imposition of MAT is to bring ‘zero tax’ companies into
the tax net. A ‘zero tax’ company refers to a company that may have high profits in its books
and distributes dividend to its stakeholders but does not pay any tax due to certain
exemptions under the income tax law, which eliminates its tax liability. To curtail this, MAT
imposes a compulsory tax liability on a company based on the book profits. In a nutshell, the
purpose of MAT is to bring companies that have the ability to pay under the ambit of taxes.6
If a percentage of the book profit is greater than the standard tax liability, then companies
have to pay MAT. In the case of India, the book profit of a company is determined as net
profit as per the profit and loss account with upward and downward adjustments under
Section 115JB7 of the Income Tax Act, 1961, for the purposes of computing MAT.
After the imposition of MAT, the rate of MAT has increased over the years (See Table 1).
The rate of MAT has been 18.5 per cent with effect from 1 April, 2012. In reality, it is even
higher as it includes surcharges and cess, which are applicable on book profit.
Table 1: Increase in the MAT rate from the Assessment Year 2009-10 to 2015-16
Assessment Year MAT rate (in percentage)
2009-10 10
2010-11 15
2011-12 18
2012 onwards 18.5
Source: Extracted from Ministry of Finance (2015), Table 2.1, p10.
Companies in India claim a number of deductions under the provisions of Income Tax Act,
1961, such as those related to depreciation, which enables them to reduce their income tax
liability in spite of earning profits and giving huge dividends to shareholders. One of the
downward adjustments is the amount of profits eligible for deduction under Section 80HHC8
or Section 80HHE9 or Section 80HHF10 in relation to the company’s exports. The deductions
6 http://finmin.nic.in/reports/ReportonApplicabilityofMinimumAlternateTax%20onFIIsFPIs.pdf (accessed on
17 December, 2015) 7 http://www.incometaxindia.gov.in/_layouts/15/dit/pages/viewer.aspx?grp=act&cname=cmsid&cval
=102120000000037244&opt=&isdlg=1( accessed on 22 January, 2016) 8 Section HHC ‘Deduction in respect of profits retained for export business’
http://www.incometaxindia.gov.in/_layouts/15/dit/pages/viewer.aspx?grp=act&cname=cmsid&cval=10212
0000000037043&opt=&isdlg=1 (accessed on 22 January, 2016) 9 Section HHE ‘Deduction in respect of profits from export of computer software, etc.’
‘http://www.incometaxindia.gov.in/_layouts/15/dit/pages/viewer.aspx?grp=act&cname=cmsid&cval=1021
20000000037045&opt=&isdlg=1 (accessed on 22 January, 2016)

5
under these sections have been phased out under the Finance Act of 2011 and no deduction
has now been allowed for the assessment year beginning on or after 1 April, 2005. The
purpose of this policy change was to bring export profits under MAT.
MAT is an advance tax. Therefore, if a company pays liability as per MAT in a given year, it
is entitled to claim the credit of MAT paid over and above the normal tax liability in
subsequent years. This can be carried forward for a period of 10 years. Thus, the additional
tax paid on account of MAT is an advance payment for future tax liability.11
As discussed above, SEZ developers and units in the past enjoyed MAT exemptions under
the SEZ Act, 2005. Under this Act, there was no sunset date for MAT exemption for SEZ
developers and units, which implied that they may enjoy such exemption for an indefinite
period. In the Union Budget 2011-12, it was announced that the MAT exemption will be
withdrawn and subsequently the Finance Act of 2011 imposed MAT from 1 April, 2012
retrospectively on SEZ developers and units from 1 April, 2005.
The sudden imposition of MAT on SEZs and that too retrospectively, without any changes in
the SEZ Act of 2005, has faced significant criticism from various stakeholders including
developers, units and SEZ experts on several grounds. These are described below.
First, MAT exemption is a part of the SEZ Act 2005 and without making any changes in this
Act, the exemption was withdrawn. An Act should provide an investor with a stable
investment regime and the sudden withdrawal of MAT exemption has raised questions
regarding the stability of the regulatory regime related to the SEZs in India.
Second, the imposition of MAT highlighted the lack of co-ordination between the Ministry of
Finance and the Ministry of Commerce and Industry in designing a transparent and stable
fiscal regime. Specifically, it reflected the sporadic nature of the Indian tax regime.
Third, the imposition of MAT has taken away the benefits of income tax exemptions enjoyed
by SEZ developers and units. For example, if an SEZ unit is in the first five years of
operation, where the unit enjoys complete income tax holiday, it still has to pay MAT.
Further, the MAT was imposed without taking into consideration that MAT is a form of
income tax and, hence, MAT exemptions should follow the pattern of income tax exemption.
Fourth, experts argued that while a country has the right to change its direct tax regime, there
should be predictability in the tax policy so that it does not hurt business sentiments. MAT
should not have been imposed retrospectively.
Fifth, MAT did not have a sunset date under the SEZ Act of 2005 and, therefore, SEZ
developers and units assumed that it will continue indefinitely.
10 Section HHF ‘Deduction in respect of profits and gains from export or transfer of film software, etc.’
http://incometaxindia.gov.in/_layouts/15/dit/pages/viewer.aspx?grp=act&cname=cmsid&cval=1021200000
00037046&k=&isdlg=1 (accessed on 22 January, 2016) 11 http://www.incometaxindia.gov.in/Tutorials/10.mat-and-amt.pdf (accessed on 17 December, 2015)

6
Sixth, it has been pointed out that MAT affects the working capital requirements of
companies as it is a form of advance tax. Hence, it is likely to affect the performance of an
SEZ.
Thus, there is an ongoing debate on whether MAT should be imposed on SEZs. The SEZ
Division of the Department of Commerce has continuously made requests to the Ministry of
Finance to continue with the MAT exemptions. Those in favour of MAT exemption have
argued that imposition of MAT has adversely affected investors’ sentiments while those
against MAT exemptions have argued that huge revenue has been foregone due to MAT and
other exemptions given to SEZs. They have also argued that, unlike in China, the Republic of
Korea and Vietnam, SEZs have not been successful in developing manufacturing, especially
high-value manufacturing in India in spite of several exemptions.
Before the withdrawal of the MAT exemption, a large number of SEZs were approved and
notified but they failed to become operational.12 The case of notified but non-operational
SEZs requires a special mention as they have the land and get all the tax benefits – yet they
are not able to attract units. This raises the question on whether there is a need for tax
exemptions to such zones.
A more balanced approach has been taken by a third group, which points towards the
duration of incentives that should be given to SEZs. If these are given for an indefinite
period, then SEZs can be viewed as tax havens. Globally, SEZs are given some incentives in
the initial stages of operations, which are gradually phased out. For example, foreign firms in
China used to have a lower corporate tax than domestic firms and they were also exempted
from local income tax (Wang, 2013; Zeng, 2011). In fact, China in the past had different
incentive structures not only for firms located inside SEZs and outside SEZs but also for
domestic and foreign firms within SEZs (Tantri, 2011). This has now been phased out.
Amidst these arguments, the Department of Revenue’s 2014 report prepared by the
Comptroller and Auditor General had claimed that exemptions to SEZs have led to
significant revenue losses.13 These exemptions include MAT exemption. However, the
argument about revenue loss due to MAT seems to be based on perception rather than the
data on actual amount of MAT foregone or collected from SEZs. Prior to the imposition of
MAT, the SEZ developers and units did not have to compute and declare their MAT liability.
Further, the amount of MAT exemption is not recorded in the annual performance report
submitted to the Development Commissioner’s office or in data collected by the Ministry of
Finance. While the data is available on total revenue collected due to MAT, it is extremely
difficult to isolate the revenue between that collected from SEZs and DTA, given the manner
in which data on MAT is collected. After the imposition of MAT on SEZs, units and
12 The process of approval for an SEZ is four-fold. The first stage involves an in-principle approval. In this
stage, the land has been identified by the developer but it is not in its possession. The second stage is the
formal approval stage, where land is in the possession of the developer. The third stage involves notification
of the SEZ, when relevant documents have been submitted and verified. The last stage is when the SEZ
becomes operational, i.e., when at least one unit starts to function. 13 http://timesofindia.indiatimes.com/business/ india-business/Rs-83000-crore-revenue-lost-on- SEZs -in -6-
years/articleshow/45253460.cms (accessed on 31 December, 2015)

7
developers have to file the Form number 29B (given in Appendix B). This form does not
capture the location of units – whether they are located in an SEZ or DTA. Moreover, in the
past, while the DTA unit of a company was subject to MAT, the SEZ unit enjoyed MAT
exemptions. The companies no longer have this option. In fact, a company with offices in
both DTA and SEZs is more likely to file a single MAT form at the company/corporate level.
In such cases, how can one calculate the MAT collected from SEZ units?
Since the SEZ developers and units have pointed out that they have been adversely affected
by the imposition of MAT, a primary survey was conducted with SEZ developers and units
across India to assess their perceptions about MAT and how they were affected by the MAT
imposition. Further, with the support of the Development Commissioners (DCs) of different
zones, detailed questionnaires were sent to SEZ units to collect information on the amount of
MAT that they filed or were likely to file in the financial year 2014-15.
Before discussing the findings in detail, we focus on the performance of SEZs before and
after the imposition of MAT based on secondary data provided by the SEZ Division of the
Department of Commerce, Ministry of Commerce and Industry, and the Export Promotion
Council for EOUs and SEZ (EPCES) factsheets. The analysis tries to examine the impact of
imposition of MAT on the performance of the SEZs.
3. Performance of SEZs before and after Imposition of MAT
As of 6 May 2015, 437 SEZs were approved under the SEZ Act, 2005. During the same
period, there were 348 notified and 202 operational SEZs. Statistics provided by EPCES
show that as of 31 March, 2015, the SEZs have attracted investments worth Rs. 3,387.94
billion and have generated direct employment for more than 1.44 million people. In the year
2014-15, exports worth Rs.4637.7 billion were made from the SEZs.
After the imposition of MAT, from 2012 to 2015, the number of operational SEZs has
increased from 153 to 202 and around 1650 units14 have registered in SEZs. Figure 1 shows
the year-wise registrations of units in SEZs. The number of units registered saw a sudden
increase in 2013 with around 960 units registering into SEZs. Thus, MAT does not seem to
have adversely affected the registration of units in SEZs.
14 As of 31 March, 2015, a total of 4059 units have been registered in SEZs. Among these, around 3000 are
active units (i.e., engaged in production or in rendering services) and 1650 new units registered in SEZs
after 1 April, 2012.

8
Figure 1: SEZ Units Registered Since 1 April, 2012
Source: Data Provided by SEZ Division, Department of Commerce, Ministry of Commerce and
Industry
Note: For 2015, the information is as of 1 November, 2015
The imposition of MAT may impact the decision of developers and units to move out of the
SEZs. The developers can do so by requesting for partial or full de-notification of the SEZ.
Figure 2 shows the trend in approval of de-notifications since the year 2010-11 given by the
Board of Approval.
Figure 2: Year Wise De-notifications (2010-11 onwards)
Source: Data Provided by SEZ division, Department of Commerce, Ministry of Commerce and
Industry
Note: The data for 2015-16 is till 4 November, 2015
11
22
9
14
0
4
0
5
10
15
20
25
2010-11 2011-12 2012-13 2013-14 2014-15 2015-16
182
968
264 245
0
200
400
600
800
1000
1200
2012 2013 2014 2015

9
Figure 2 shows that in the year 2011-12, there was a peak in the approvals for de-notification
with 22 SEZs being de-notified. The reasons for increased de-notification in this period
included imposition of MAT. However, in the subsequent years, the number of de-
notifications has seen a gradual decline with no de-notifications in the year 2014-15. Thus,
while on the one hand, a number of SEZs have applied for de-notifications, on the other, a
number of SEZs became operational after 1 April, 2012. There has also been an increase in
the number of units locating in the SEZs.
The performance of SEZs depends on a variety of parameters such as exports from SEZs,
employment and investment. Some of these are discussed below.
3.1 Exports from SEZs – Before and After the Imposition of MAT
Ideally, exports, imports and net foreign exchange earnings should be the indicators for the
performance of an SEZ. However, in the absence of data on imports into SEZs, exports from
SEZs have been taken as an indicator to examine the performance.
Exports from SEZs increased from Rs.228.40 billion in 2005–06 to Rs.4,637.70 billion in
2014-15, registering a CAGR of 39.73 per cent. In real terms, exports from SEZs witnessed a
more than eleven-fold increase during this period. However, the export performance has not
been uniform. Exports from SEZs rose steadily during the initial years, registering a growth
rate of around 92 per cent in 2007–08 and 121 per cent in 2009–10, but in subsequent years,
the growth rate slowed substantially to around 15 per cent in 2011–12; the growth rate was
negative in 2014–15 (Table 2).
Table 2: Exports from SEZs
Year
SEZ Exports
(Rs. billion,
current prices)
Export Growth
(based on current
prices) in
percentage
SEZ Exports (Rs.
billion, 2011–12
prices)
Export Growth
(based on 2011–12
prices) in
percentage
2004–05 183.14 287.14
2005–06 228.40 24.7 343.55 19.64
2006–07 346.15 51.6 489.24 42.40
2007–08 666.38 92.5 890.59 82.03
2008–09 996.89 49.6 1,226.07 37.66
2009–10 2,207.11 121.4 2,559.31 108.74
2010–11 3,158.68 43.1 3,360.80 31.31
2011–12 3,644.78 15.4 3,644.78 8.44
2012–13 4,761.59 30.6 4,424.21 21.38
2013–14 4,940.77 3.8 4,320.64 -2.34
2014-15 4,637.70 -6.1 3,936.11 -8.89
Source: Department of Commerce and EPCES fact sheets.
In order to assess whether the slowdown in export growth from SEZs is part of a general
trend (for example, due to global economic factors that would affect the country’s overall

10
export), or from factors specific to SEZs, it is important to analyse export performance of
SEZs vis-à-vis the export performance of the rest of the economy. In calculating total exports,
both merchandise exports data from the Directorate General of Commercial Intelligence and
Statistics (DGCI&S) and miscellaneous services exports data from the RBI have been used.
Since services exports constitute a significant part of SEZ exports, considering only
merchandise exports would deflate the contribution of SEZ exports to total exports.
The share of SEZ exports in the country’s total exports increased from 3.6 per cent in 2005-
06 to around 8 per cent in 2008-09 and jumped to over 22 per cent the very next year.
However, since 2009-10, the share of SEZ exports has remained more or less stable, hovering
between 24 per cent and 27 per cent. In comparison to the export performance of the rest of
the economy, exports from SEZs rose steadily from 2005-06 to 2009-10, registering its
sharpest gain in 2009–10, when exports from the rest of the economy declined substantially
in the aftermath of the global financial crisis. However, after 2009–10, the growth rate of
SEZ exports flattened compared to the rest of the economy and exports from SEZ declined in
2013–14 when exports from the rest of the economy witnessed a healthy growth of around 15
per cent over the previous year (for details see Mukherjee et. al., 2015)
Figure 3: Exports from SEZs vs. Rest of the Economy (2005-06 to 2013-14)*
Source: DGCI&S and RBI
Note: The exports are calculated at 2011–12 prices
It is important to note that exports from SEZs have been declining since 2012-13 whereas the
trend has not been the same for rest of the economy (Figure 3). An analysis of the reasons
behind the slowdown of SEZ exports would require detailed sector-wise and SEZ-wise time
series data on export performance over these years. In the absence of such systematic data, it
is difficult to draw any broad conclusions, except that while exports from rest of the economy
0
2000
4000
6000
8000
10000
12000
14000
16000
18000
20000
2005–06 2006–07 2007–08 2008–09 2009–10 2010–11 2011–12 2012–13 2013–14
In R
s B
illi
on
SEZ exports Exports from Rest of the Economy

11
have picked up after the global slowdown, SEZ exports have not shown a similar trend. A
part of this slowdown can be attributed to the MAT. However, during the same time, there
were several notifications on units in SEZs such as the 80-20 rule for gold imports from the
DTA on gems and jewellery15 units, which may have adversely affected exports.
3.2 Investment in SEZs before and after the Imposition of MAT
Prior to February 2006, the total cumulative investment in SEZs was Rs. 40.36 billion. Under
the new SEZ regime, cumulative investment in SEZs increased almost 19 times to Rs. 772
billion by 2007-08 (Table 3) and almost 90 per cent of these came from investment in new
SEZs notified under the SEZ Act, 2005.
By 2013–14, the total cumulative investment in SEZs increased to Rs. 2,966 billion. Yearly
investment in SEZs in real terms shows an upward trend between 2008-09 and 2010-11
before registering a disinvestment to the tune of Rs. 9 billion in 2011-12. It recovered in the
subsequent years and, by 2013–14, annual investment had gone past its 2009-10 level.
Interestingly, disinvestment in SEZs coincided with the withdrawal of the MAT exemption in
the Union Budget of 2011-12.
Thus, there may have been some negative relationship between the policy reversal and
investments in SEZs. Table 3 also indicates that investments in SEZs remain an insignificant
part of total investments in the country.
Table 3: Investment in SEZs (in Rs. billion)
Year Cumulative
Investment
in SEZs*
Incremental
Investment
in SEZs
Annual
Investment
in SEZs
Annual
Investment in
SEZs (2011–12
prices)
Total
Investme
nt in
India
SEZ
Investment as
per cent of
Total
Investment
2007–08 772 732 14308
2008–09 1089 1049 317 389.88 14809 2.1
2009–10 1485 1445 396 459.19 15809 2.5
2010–11 2028 1988 543 577.75 18176 3.0
2011–12 2019 1978 –9 -9 18973
2012–13 2367 2327 348 323.34
2013–14 2966 2926 599 523.82
2014-15 3387 461 391.26
Source: Department of Commerce, SEZ Division and Central Statistical Office.
Note: * Cumulative investment since February 2006
15 The 80–20 rule for gold imports from the DTA was imposed in August 2013. Under this rule, 20 per cent of
gold imported by DTA units has to be exported, thereby forcing several DTA suppliers with units in SEZs
to divert exports from the SEZ to the DTA to meet the requirements. For details see
https://www.rbi.org.in/scripts/NotificationUser.aspx?Id=8312&Mode=0 (accessed on 31 December, 2015)

12
The FDI received in SEZs in 2008-09 (Rs.36.47 billion) accounted for a meagre 11.5 per cent
of total investment in SEZs, which increased to 15 per cent in 2009-10 before dropping to
11.1 per cent in 2010-11 (Table 4).
Table 4: Foreign Direct Investment in SEZs (in Rs. billion)
Year FDI Inflow
in SEZs
Total FDI
(equity
inflows)
Annual
investment
in SEZs
SEZ FDI as
per cent of
Total FDI
SEZ FDI as per cent
of Annual
Investment in SEZ
2008–09 36.47 1428.29 316.94 2.6 11.5
2009–10 57.95 1231.20 385.86 4.7 15.0
2010–11 60.12 973.20 543.21 6.2 11.1
2011–12 –113.24 1651.46 –9.35
Source: SEZ Division, Department of Commerce and Department of Industrial Policy and Promotion,
Ministry of Commerce and Industry
The share of FDI in SEZs in the country’s total FDI inflows, though relatively small,
increased steadily from 2.6 per cent in 2008–09 to 6.2 per cent in 2010-11. However, during
2011-12 there was a flight of FDI from SEZs despite the fact that total FDI in the country
grew by almost 70 per cent over the previous year. The Rs. 9.35 billion disinvestment in
SEZs during that year was driven by the Rs. 113.24 billion outflow of FDI from SEZs. This
can possibly be due to the imposition of MAT and other taxes on foreign investors such as
the DDT.
3.3 Employment in SEZs
While exports from SEZs increased 22 times between 2005-06 and 2013-14, employment in
SEZs increased only ten-fold during this period – from 135,000 in 2005-06 to 1,283,000 in
2013-14. It further increased to 1,504,597 in 2014-15.
Overall, the analysis of secondary data shows that there may have been an adverse impact of
imposition of MAT. While there has been an increase in the number of operational SEZs and
units in SEZs, the number of de-notifications has increased. The analysis also shows that
MAT may have affected the performance of SEZs by affecting its export performance and
ability to attract investments.
To better understand the impact of MAT on SEZs and to examine the perception of SEZ
developers and units towards the imposition of MAT, a primary survey was conducted. The
next section analyses the survey findings.
4. Impact of Imposition of MAT: The Primary Survey
The primary survey involved in-depth interviews with select SEZ developers, units, policy
makers of central and state governments, DCs or SEZ zonal heads, industry associations,
international experts and academics. Semi-structured questionnaires were sent to SEZ

13
developers (in different categories such as notified but not operational SEZs, operational
SEZs, de-notified SEZs and approved but not notified SEZs), units in SEZs, followed by one-
on-one interactions in some cases. The survey was conducted between March 2014 and July
2014.
4.1 Developer Survey Analysis
In total, filled in questionnaires were received from 46 operational developers, 19 notified but
not operational developers, 8 formally approved but not notified developers, and 9 de-notified
developers located in seven states, namely, Andhra Pradesh, Gujarat, Haryana, Maharashtra,
Tamil Nadu, Uttar Pradesh and West Bengal.
Thirty-seven out of the 46 developers of operational SEZs mentioned that the imposition of
MAT has adversely affected their business. However, when asked what the affect was, the
response was mixed. While some referred to lower profitability, others referred to lower
working capital or reduced cash flow. When asked if they were contemplating withdrawal
from the SEZ business as a result of the imposition of MAT, only four out of 46 operational
developers said that direct tax issues (including MAT imposition) “made them consider” de-
notification of SEZs.
Out of the 19 notified but not operational developers, four said that MAT is not applicable to
them and all the others pointed out that they have been adversely affected by the imposition
of MAT. One developer said that they will reach a breakeven point by the time their income
tax exemptions are over and, therefore, withdrawal of MAT exemption will adversely affect
them in the future. Another respondent pointed out that income tax benefits have become
redundant as almost 20 per cent MAT (including other cess) is now imposed on the book
profits. Developers also argued that MAT was imposed retrospectively at a time when there
was a global slowdown and a slowdown in the Indian economy.
Overall, most developers referred to unclear fiscal policy, delays in getting clearances from
state governments (especially environment clearances), lack of interest of units due to global
slowdown and difficulties in catering to the DTA or domestic market from SEZs as some of
the key problems in making SEZs operational. Thus, the imposition of MAT is one of the
many problems that is hindering the ability of notified SEZs becoming operational.
All eight formally approved but not notified developers pointed out that MAT has adversely
affected their business. However, when asked what has caused the delay in getting their SEZ
notified, the imposition of MAT was not among the top three reasons. The top three reasons
included delay in land acquisition (problems in getting contiguous land, land is not in
company’s name, delay in transfer of land, etc.), delay in environment clearances and lack of
single window clearances. Two of the formally approved but not notified SEZs pointed out
that MAT should not have been imposed retrospectively and should have only been
applicable to new developers and units.

14
The reasons for de-notification given by the nine de-notified SEZs depend on the state that
they are located in. For example, in Haryana, where four out of nine de-notified SEZs were
located, the state government announced a lucrative land conversion policy. This together
with delays in government clearances and the global recession made SEZs unattractive. The
two de-notified SEZs in Kolkata referred to political interference, lack of state government
support for SEZs, global recession and difficulties in land acquisition and environment
clearances as the reasons for de-notification. The two de-notified SEZs in Andhra Pradesh
referred to global recession and the difficulties that SEZ units face in selling to the DTA. One
of the developers pointed out that his co-developer failed to perform. Only one de-notified
SEZ developer from the state of Gujarat pointed out that it has changed its business plan after
the imposition of MAT. Overall, the reasons for de-notification vary across states and MAT
has not emerged as the major reason for de-notification in the survey.
4.2 The Survey of Units in SEZs
In total, responses were received from 145 operational units across 32 SEZs representing 23
per cent of all operational SEZs in these states. These 145 units were across nine industries,
namely, electronics hardware, energy, engineering, food processing, gems and jewellery,
IT/ITeS, leather/footwear, pharmaceuticals/chemicals/biotechnology and
textiles/apparel/wool. The survey covered seven states, namely, Andhra Pradesh, Gujarat,
Haryana, Maharashtra, Tamil Nadu, Uttar Pradesh and West Bengal. The timing of the
survey coincided with the developer survey.
The 145 units were asked to rate the importance of benefits such as income tax holidays,
single window clearance and quality of infrastructure as motivating factors to start operation
in an SEZ. They were required to rate factors on a six-point Likert scale (ranging from 1 to
6), with 1 indicating the “least important” and 6 indicating the “very important”. Figure 4
shows the percentage of respondents that rated the factors as “very important” (rated 6) or
“important” (rated 5). Around 84 per cent of respondents considered income tax holiday as
“very important” or “important” factor. This reflects the fact that direct tax benefits are one of
the foremost factors that motivate units to start operations in SEZs.

15
Figure 4: Motivating Factors for Starting Operations in SEZs
Source: Authors’ Calculation
Figure 5 ranks the views of units across different industries on the importance of an income
tax holiday in starting operation in an SEZ. Around 91 per cent of the units in textile/apparel
and wool manufacturing sector consider an income tax holiday as ‘very important’ or
‘important’. Interestingly, information technology/information technology enabled services
(IT/ITeS) companies, who are mainly present in SEZs, gave income tax holiday a lower
ranking vis-à-vis units in other industries.
Figure 5: Perception of Companies across Different Industries on Importance of Income
Tax Holiday
Source: Authors’ Calculation
79.0
58.7
78.7 75.784.3 81.0 78.7 72.9
62.3
48.256.4
0102030405060708090
In p
erce
nta
gee
Respondents ranking 'important' or 'very important'
73.0 75.080.0
77.085.7 91.3
66.6
0102030405060708090
100
In p
erce
nta
ge
Respondents ranking 'important' or 'very important'

16
SEZs offer both fiscal and non-fiscal incentives. The perception about the importance of non-
fiscal incentives (such as quality of infrastructure inside and outside the SEZs) varies across
industries. For example, the importance of infrastructure inside SEZs is higher for IT/ITeS
units vis-à-vis units in the gems and jewellery sector – around 67 per cent of the units in
IT/ITeS sector consider infrastructure inside SEZs as ‘very important’ or ‘important’ whereas
56 per cent of units in gems and jewellery sector consider the infrastructure inside SEZs as
‘very important’ or ‘important’.
The respondents were asked to rank the fiscal benefits of locating in an SEZ vis-à-vis DTA.
Around 70 per cent of the respondents considered the fiscal benefits as ‘very important’ or
‘important’ and fiscal benefits have played a key role in their decision to locate in an SEZ.
The respondents were then asked how the withdrawal of MAT exemptions has affected or
will affect their business. Around 83 per cent of the respondents reported that the imposition
of MAT will reduce profits and/or working capital, while only 6.82 per cent reported that
MAT will not affect their business. Among those surveyed, 9.85 per cent reported that MAT
will not be applicable to their unit.
Some respondents pointed out that despite being completely or partially exempted from
income tax according to the SEZ Act, 2005, they are required to pay MAT. This reduces the
benefit of income tax exemptions that an SEZ unit enjoys in the initial years of its inception.
One concern raised by the respondents is that MAT exemption in the SEZ policy prior to
2011-12 did not have a sunset date and they assumed that the exemption was for an indefinite
period. Further, the imposition of MAT did not take into consideration the fact that units in
SEZs were at different stages of income tax exemptions. In addition, the sudden retrospective
imposition of MAT has reduced the working capital of the units.
Overall, the analysis of the primary survey shows that the imposition of MAT has adversely
affected the sentiments of SEZs units and developers. Since units in SEZs are required to
have a positive net foreign exchange earnings within five years from the commencement of
production, export profits arising from operations in SEZ can be subject to MAT despite the
unit enjoying income tax exemption as per the SEZ Act, 2005. While units in manufacturing
and IT/ITeS sector have raised concerns about the imposition of MAT, units in the
manufacturing sector seem to be more affected than units in IT/ITeS sector. Survey
respondents pointed out that units in the manufacturing are more likely to have a MAT
liability than units in IT/ITeS. This is because the taxable income computed under the Income
Tax Act, 1961, can be subject to exemptions due to depreciation and other expenses in the
case of manufacturing sector. In other words, it is possible that there are more ‘zero tax’
companies in the manufacturing sector vis-à-vis the IT/ITeS sector.
The survey also found that there is a negative perception among SEZ units about the
transparency and consistency of the fiscal incentives after MAT exemptions were withdrawn
retrospectively.
17
4.3 MAT Filed by Units in SEZs
Since the data on the amount of MAT paid by SEZ units and developers is not collected and
collated by the government, in addition to the above survey through the DC’s office, a small
questionnaire was circulated to all SEZ units in seven zones between 1 September and 30
November, 2015. The questionnaire required units to provide information regarding (a)
parent company (b) whether it had operations in the DTA (c) the year of establishment of the
unit in the SEZ (d) revenue, exports and imports, investment and employment in the year
2014-15, (e) amount of income tax filed, MAT and other taxes and duties paid during the
year 2014-15.
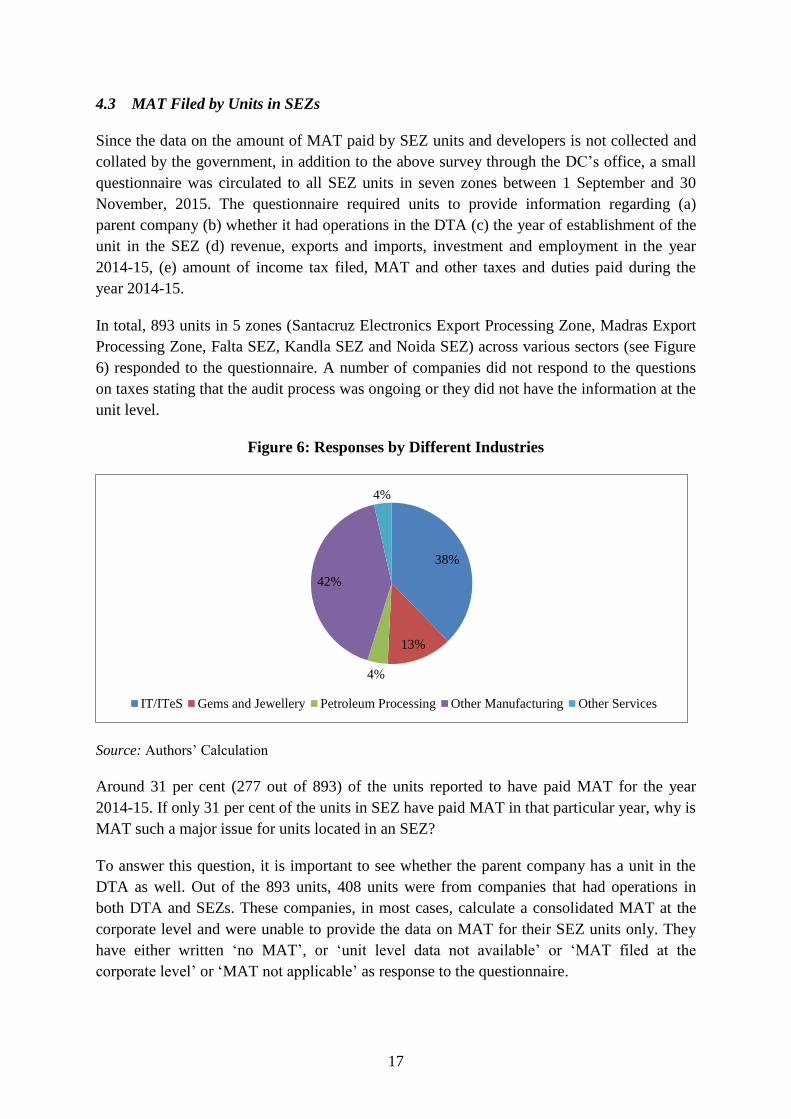
In total, 893 units in 5 zones (Santacruz Electronics Export Processing Zone, Madras Export
Processing Zone, Falta SEZ, Kandla SEZ and Noida SEZ) across various sectors (see Figure
6) responded to the questionnaire. A number of companies did not respond to the questions
on taxes stating that the audit process was ongoing or they did not have the information at the
unit level.
Figure 6: Responses by Different Industries
Source: Authors’ Calculation
Around 31 per cent (277 out of 893) of the units reported to have paid MAT for the year
2014-15. If only 31 per cent of the units in SEZ have paid MAT in that particular year, why is
MAT such a major issue for units located in an SEZ?
To answer this question, it is important to see whether the parent company has a unit in the
DTA as well. Out of the 893 units, 408 units were from companies that had operations in
both DTA and SEZs. These companies, in most cases, calculate a consolidated MAT at the
corporate level and were unable to provide the data on MAT for their SEZ units only. They
have either written ‘no MAT’, or ‘unit level data not available’ or ‘MAT filed at the
corporate level’ or ‘MAT not applicable’ as response to the questionnaire.
38%
13%
4%
42%
4%
IT/ITeS Gems and Jewellery Petroleum Processing Other Manufacturing Other Services

18
In the case of units with operation in both SEZs and DTA, around 27 per cent reported that
they have filed income tax for the year 2014-15 and only 23 per cent said that they have filed
MAT at the unit level. Some of the units mentioned that they were paying income tax as per
the provisions of the Income Tax Act, 1961; so they were not required to file MAT. In the
case of the units which have operations in SEZs only, around 24 per cent respondents
reported that they have filed income tax for the year 2014-15 and around 37 per cent said that
they have filed MAT.
Given that only a small number of companies in SEZs paid MAT in the year 2014-15 and
even among these, companies with an operation in the DTA were not aware of, or did not
want to reveal the data on MAT, it is extremely difficult to provide an estimate of revenue
collected by the imposition of MAT on SEZs. Further, the data on the amount of MAT filed
seems to be an overestimation. For example, when the amount of MAT filed by the 277 units
was compiled by the NSDL (National Securities Depository Limited), it amounted to Rs
45,505 million which is roughly 11 per cent of the tax liability on account of MAT (less the
MAT credit claimed) for the financial year 2014-15 for a sample of 564787 firms (Rs 360090
million).16 Therefore, this paper does not analyse the data pertaining to MAT filed by SEZ
units and developers.
Overall, the primary survey shows that SEZ developers and units perceive tax benefits to be
important and they reported that they had been adversely impacted by the imposition of
MAT.
Globally, a number of countries give fiscal incentives in the form of direct tax incentives such
as income tax exemptions to their SEZs. The next section discusses income tax exemptions
given by select countries. An attempt has been made to understand what kind of income tax
exemptions are given to SEZ developers and units, whether such exemptions are subject to
certain conditions and have been phased out over time. An attempt has also been made to see
if any of the exemptions have been withdrawn retrospectively.
5. Corporate/Income Tax Exemptions to SEZs in Select Countries
Globally, SEZs are treated as foreign territories within a country and countries provide a
range of fiscal incentives to SEZs to attract investment (foreign and domestic), technology,
enhance exports and generate employment. The incentives can be for both SEZ developers
and units but it can be different across units and developers. These incentives can also vary
across industries and some priority industries can be given higher incentives vis-à-vis other
industries. Countries also differ in their approach to how long an SEZ developer or a unit
should get a direct tax incentive. The incentives can be different for different types of SEZs,
depending on whether they are single-product or multi-product SEZs, area covered under the
SEZ, location of the SEZ, and the type of firms that are located in the SEZs. As countries,
especially developing countries, compete among themselves to attract foreign investment and
16 http://indiabudget.nic.in/ub2015-16/statrevfor/annex12.pdf (accessed on 20 January, 2016)
19
technology, they have to carefully design their incentive packages so that it is attractive to
global investors and corporates.
Before one discusses the income tax or corporate tax incentives given by different countries,
it is important to note that the WTO has imposed certain rules and restrictions on subsidies
and export incentives on its member countries. These rules are specified in the WTO’s
Agreement on Subsidies and Countervailing Measures. The SCM agreement is important in
the context of SEZs since certain benefits offered to SEZ units and developers can lead to
imposition of strict disciplines under this agreement. A subsidy is subject to discipline under
the SCM agreement if it is a ‘specific subsidy’. There are four types of ‘specificity’ within
the meaning of the SCM Agreement: enterprise-specificity, industry-specificity, regional
specificity and prohibited subsidies. Although SEZs have not been explicitly mentioned in
the agreement, the fiscal incentives given to SEZs in the form of direct tax benefits such as
income tax exemption can be seen as a form of region specific subsidy. Hence, the incentive
structure for SEZs needs to be well-crafted for it to be non-actionable under the WTO SCM
agreement (for details see Mukherjee et. al., 2015). While a number of developing countries
such as Vietnam have designed the incentives under the SEZ policy to make it WTO non-
actionable, developed countries are moving away from the SEZ policy.
In this context, it is important to note that direct tax incentives given to manufacturing units
in SEZs in India can be prohibited under the WTO’s SCM Agreement. This is mainly
because the units in SEZs have to meet the requirement of becoming a net foreign exchange
earner in five years, which implies that incentives given to these units are linked to export
earnings. Further, it is important to note that some subsidies can be actionable while others
are prohibited under the WTO’s SCM Agreement. The WTO member countries are,
therefore, trying to design WTO-smart subsidy so that the incentives that they offer to SEZ
units are non–actionable under the WTO (for details see Mukherjee et. al. 2015). Since the
WTO is yet to develop a discipline on subsidies in services, countries can continue to
subsidise manufacturing by subsidising the services that are inputs into manufacturing. SEZ
developers provide construction services. A number of units in the SEZs offer services.
Therefore, countries have also designed different incentives for manufacturing and services
and for developers and units.
Given this background, the corporate or income tax benefits given to SEZ developers and
units in Bangladesh, Philippines, Republic of Korea, United Arab Emirates (UAE, Dubai)
and Vietnam are examined in this section (see Box 1 for the details of incentives).17 To begin
with, the corporate tax rate in India is one of the highest among these countries.18 Further,
17 The list of countries is illustrative. The details of tax exemptions have been provided on the government
website of the selected countries. The countries have been selected to provide a comparative picture of
exemptions offered in their SEZs vis-à-vis India. Other countries also provide tax exemptions to SEZs. For
example, China offers direct tax exemptions to its SEZs but these are zone specific and details about these
exemptions are difficult to obtain from official sources. 18 For details see https://www2.deloitte.com/content/dam/Deloitte/global/Documents/Tax/dttl-tax-corporate-
tax-rates-2015.pdf (accessed on 22 January 2016)

20
these countries offer corporate or income tax benefits and India faces stiff competition from
them while attracting investment in SEZs.
Box 1 shows that direct tax incentives are termed differently in different countries. For
example, the Republic of Korea provides ‘corporate tax and income tax exemption’, while
Bangladesh provides ‘tax exemption’ and Vietnam provides ‘preferential tax rates’ or
‘corporate income tax exemption’. Whatever the terminology used to describe direct tax
incentives, all countries provide direct tax incentives and hence, if India has to compete with
these countries to get investment and technology into SEZs, India has to continue to provide
direct tax incentives. Moreover, since in the near future India is likely to graduate from the
list of Annex VII countries under the SCM Agreement that are allowed to provide prohibited
subsidies, there is a need to redesign the incentive structure to make it WTO non-actionable.
All the countries mentioned above recognise the need to provide tax exemption in the initial
years of business operations for SEZs. But these exemptions are not given for an indefinite
period of time and the exemptions are phased out over a time period. Box 1 shows that there
are wide differences across countries with respect to the duration of the tax exemptions.
While Dubai (UAE) provides a tax holiday for 50 years, the Philippines provides it for four to
six years depending on the type of project. The tax exemptions offered to SEZs can change as
seen in the case of Bangladesh. However, Bangladesh has tried to ensure that exemptions are
not withdrawn retrospectively. As discussed in the case of the withdrawal of MAT exemption
in India, retrospective withdrawal of exemptions can create an uncertain business
environment and it signals a lack of policy consistency.
The selected countries have specified various conditions for availing income/corporate tax
exemptions. In most countries, tax exemptions are subject to fulfilling certain conditions or
requirements. These conditions are usually in the form of a minimum investment
requirement. While SEZ units in India have to be positive net foreign exchange (NFE)
earners, calculated cumulatively for a period of five years from the commencement of
production, there are no minimum investment requirements in the case of India.
To the best of our knowledge, no country has specified exemption or imposition of MAT on
the developers or units operating in SEZs. This may be because they either do not have MAT
or MAT is taken as a form of income tax exemption. MAT exemption is also a WTO
actionable subsidy and, therefore, countries are cautious about listing it.
Box 1 Direct Tax Incentives in Select Countries
Bangladesh
Bangladesh Export Processing Zones Authority is responsible for the creation, development,
operation and control of Export Processing Zones (EPZ). EPZs enjoy fiscal and non-fiscal
benefits. Industries established before 1 January, 2012, are given an income tax holiday of
10 years whereas the industries set up after 31 December, 2011 are given an income tax

21
19 For details on pioneer projects, see http://training.itcilo.it/actrav_cdrom1/english/global/frame/epzppi.html
(accessed on 11 January, 2016)
exemption of 100 per cent for the first two years of setting up. Subsequently, the exemption
is reduced to 50 per cent for the third and fourth year. In the fifth year, the exemption is
further reduced to 25 per cent and is phased out thereafter. Apart from the income tax
exemptions, Bangladesh also offers duty free import of construction materials, machinery,
raw materials and finished goods. These benefits are offered to all EPZs.
Philippines
Philippines Economic Zones Authority is the government agency responsible for extending
assistance, promoting investments, facilitating business operations of investors in export
oriented manufacturing and service facilities inside SEZs. The fiscal incentives offered to
SEZs in the Philippines are different for units and developers.
In the case of developers and operators of SEZs, these incentives are in the form of
exemption from national and local taxes, except property tax on land owned by the
economic zone developer. There is also a special 5 per cent tax on gross income.
In the case of units, the incentives differ across industries. For manufacturing and IT
enterprises, income tax holidays are for a period of six years for pioneer projects19 and four
years for non-pioneer projects. The income tax holiday can be extended further to a
maximum of four years subject to certain conditions. These conditions include net foreign
exchange earning requirements, capital equipment to labour ratio requirements and
indigenous raw material requirements. Once the income tax holiday period is over, a five per
cent special tax on gross income is levied and units are exempted from all national and local
taxes.
Republic of Korea
The incentive structure of the Korean SEZs is complex. Tax exemptions are offered to
foreign invested resident firms in Free Economic Zones (FEZs) and developers of FEZs.
The exemptions are different for firms and developers and are also subject to certain
investment requirements. These investment requirements vary across industries.
The developers of FEZs are provided corporate and income tax exemptions. However, the
conditions for availing income and corporate tax exemptions differ from that of units.
Developers get a 100 per cent exemption for the first three years and 50 per cent for the next
two years. The investment condition requires the developers to get a foreign investment of
over $30 million or a foreign investment ratio of over 50 per cent, and a total development
project cost of over $500 million.
In the case of foreign invested domestic firms, 100 per cent corporate and income tax
exemption is given for first three years and 50 per cent exemption is given for the next two

22
Source: http://www.boi.gov.bd/site/page/0d315c51-288c-4ed3-8346-57f70567f8d5/Export-
Processing-Zones (accessed on 11 January, 2016), http://www.peza.gov.ph/index.php/about-peza
(accessed on 11 January, 2016), http://fez.go.kr/global/en/why/incentive.do (accessed on 11 January ,
2016), http://jafza.ae/explore/why-jafza/ (accessed on 13 January, 2016),
http://www.dubaifaqs.com/jebel-ali-free-zone-authority.php (accessed on 11 January, 2016) ,
http://ipinvietnam.vn/investment-incentives/news_preferential-policies-and-support-investors-in-long-
an-vietnam.html (accessed on 14 January, 2016)
Note: $ refers to US Dollar
20 Converted using Oanda currency converter. ($1=3.672AED as on 18 January, 2016).
http://www.oanda.com/currency/converter/
years. These exemptions are subject to a minimum investment requirement of $10 million in
the case of manufacturing, tourism or services industries, $5 million or more for logistics
industries and medical institutions and $1 million or more for R&D industries. Corporate
and income tax exemptions can also be increased to a total of seven years (100 per cent for
first five years, 50 per cent for the next two years), if the investment is $30 million or more
in manufacturing industry, $20 million or more in tourism industry, $10 million or more in
logistics industry and $2 million or more in R&D industry.
UAE (Dubai)
UAE has seen a proliferation of industry specific zones. For example, Dubai has come up
with Dubai Media City, Dubai Biotech Research Park and Dubai Healthcare City, to name a
few. The incentives offered across free zones in UAE include 100 per cent foreign
ownership, zero per cent corporate tax for 50 years and no capital tax among others. The tax
holiday of 50 years offered in these free zones is the longest amongst the countries
examined. UAE also has the world’s largest free zone, the Jebel Ali Free Zone. This zone
has over 7000 units located in it and offers incentives such as 100 per cent foreign
ownership and zero per cent corporate tax for 50 years, which can be further renewed.
However, there is a minimum capital requirement to avail these incentives. This minimum
capital requirement ranges from 500,000-1,000,000 AED ($136,132 - $272,264).20
Vietnam
Incentives in the form of reduced corporate tax rate, tax-free periods or tax reductions
during the start up phase and import duty exemptions are provided based on the investment
location. Selected industrial zones, economic zones and high tech zones are eligible for
availing these incentives. In addition to the location, certain specified sectors such as
scientific research and technology can avail these incentives. Every industrial park and
economic zone provides the incentive preferential policy for investors. The direct tax
incentives include corporate tax exemption for a period ranging from two to four years, 50
per cent corporate tax reduction for next four or nine years and 10 per cent preferential tax
rate for 15 years. Some special zones (such as the Dung Quat Economic Zone) are also
offered reduction in individual income tax for both Vietnamese and foreigners with high
income working in SEZs

23
To summarise, a number of countries offer direct income tax or corporate tax exemption to
SEZs, some of which can be more than that offered by India. Further, India has one of the
highest corporate taxes. The competing countries also offer a set of other incentives such as
cash grants for FDI (Republic of Korea), special non-immigrant visa with multiple entry
privileges for certain workers in free zones (Philippines) and 100 per cent foreign ownership
(Dubai). Thus, in terms of attracting investments into SEZs, India faces stiff competition both
in the sphere of fiscal and non-fiscal incentives.
Although the business environment in India has improved, the country ranked 130th in 2015
in the World Bank’s Ease of Doing Business Rankings, which is much lower vis-à-vis the
ranks of Korea (4th), UAE (31th), Vietnam (90th) and the Philippines (103th).21 Thus, India is
at a disadvantageous position vis-à-vis its competitors in ease of doing business.
In a nutshell, if the SEZs in India have lower fiscal incentives and lower ease of doing
business ranking compared to other countries, how can they attract investments and best
technology and contribute to the government’s ‘Make in India’ campaign?
6. Conclusion and Way Forward
Globally, SEZs are given a range of direct tax exemptions (including income tax exemptions,
corporate tax exemptions etc.) to attract investment, technology and global best management
practices. In India, too, the SEZ developers and units receive a set of direct tax incentives
which are listed in the SEZ Act of 2005. One of these incentives, the MAT exemption, was
withdrawn under the Finance Act of 2011 retrospectively from 1 April, 2005. This paper tries
to examine the impact of the withdrawal of MAT exemptions on Indian SEZs. It also tries to
examine whether fiscal incentives should be given to the SEZs and, if so, in what format.
The paper found that a number of countries (for example, Bangladesh, Philippines, Republic
of Korea, UAE (Dubai) and Vietnam) give income tax or corporate tax benefits to SEZ
developers and units and some of these are much better than the incentives that India offers.
Hence, if India has to continue with the policy of having ‘special’ zones, it has to continue to
give direct tax benefits. Like India, in most countries these direct tax benefits are phased out
over time. Countries may offer different types of direct tax benefits to SEZ developers and
units and the benefits can also vary across industries. In most countries, benefits are subject
to certain conditions such as minimum capital or minimum investment requirements, unlike
India. This helps the countries attract serious investors. It is recommended that the Indian
government should examine the direct tax benefits given to SEZ developers and units in other
countries and draw up an incentive package for SEZs in India which is not only attractive to
investors but will also ensure that SEZs become operational and units locate in SEZs.
None of the countries, which are discussed in this paper, specifically refer to MAT
exemptions for SEZs although they may have imposed MAT in the country. This is because
MAT is a form of income tax and, in most cases companies file a consolidated MAT for units
in SEZs and DTA. As long as there is an income tax exemption, it is assumed that there is 21 http://www.doingbusiness.org/rankings (accessed on 14 January, 2016)

24
MAT exemption. In other words, MAT exemption is expected to be phased out if income tax
exemption is phased out. Further, none of the countries have an income tax exemption for an
indefinite period. However, in the Indian SEZ Act of 2005, there was no sunset date for MAT
exemption. Therefore, SEZ developers and units assumed that MAT exemption will continue
indefinitely. Since the SEZ Act, 2005, provides for a phased exemption of income tax, the
issues related to MAT exemption stem from the lack of clarity in the SEZ Act 2005, on
whether MAT should be phased out in the same way as income tax exemption or continue
indefinitely. Ideally, MAT should be phased out exactly like the income tax exemption.
The experiences of countries such as Bangladesh show that they can change their income tax
regime or reduce the time frame of exemptions. However, care is taken to ensure that such a
policy is not imposed retrospectively and SEZ developers and units have a stable operational
environment. This paper found that the sudden and retrospective imposition of MAT has hurt
business sentiments and their working capital and investment plans. Future fiscal policies in
India should take this into account. It should also be noted that MAT was suddenly imposed
uniformly on SEZ developers and units, although they were at different stages of income tax
exemptions. Hence, the impact of the imposition of MAT on them varied depending on their
stage of income tax exemption. Since MAT is a form of income tax, MAT exemption should
follow the same pattern of income tax exemption and should be phased out over time, as is
done in the case of the income tax exemption.
There is an ongoing argument in India that MAT exemptions to SEZs have led to revenue
losses. However, MAT is often filed at the corporate level and not by the SEZ units. Further,
SEZ units are not required to declare their MAT contribution in their annual performance
report. Therefore, neither the Ministry of Finance nor the SEZ Division of the Department of
Commerce have records of the amount of revenue losses due to MAT exemptions to SEZs or
the revenue earned after the imposition of MAT on 1 April 2012. In the absence of data, it is
not possible to examine the impact of MAT on government revenue.
Secondary data shows that the withdrawal of MAT exemption has had a mixed impact on the
performance of SEZs. While exports from SEZs have declined, there has been an increase in
the number of operational SEZs and around 1650 units have been registered in SEZs since 1
April, 2012, when MAT was imposed. Employment in SEZs has also increased. This increase
can be due to the focus of the government on manufacturing and linking India with the global
value chains.
SEZs are key instruments for developing production networks and, therefore, they are a key
component of the present government’s “Make in India” campaign. Hence, the focus of the
government should be on making SEZs successful through the right policy. Specifically, with
respect to direct taxes, MAT exemptions should be linked to income tax exemptions for all
units and developers in SEZs. In addition, the recently announced fiscal incentives for start-
ups should be applicable to start-ups in SEZs. The government may also consider better
incentives for high-technology or high value-added manufacturing units. However, these
incentives have to be carefully designed so that they are non-actionable under the WTO’s
SCM Agreement.

25
The primary survey of SEZ developers and units shows that they give substantial importance
to direct tax incentives including MAT exemptions. The survey found that income tax
holidays are one of the most important motivating factors to locate and start operations in
SEZs. However, the importance of income tax holidays varies across industries. MAT
exemption has been perceived to be a greater incentive for units in manufacturing, which
have deductions under income tax for reasons such as depreciations, than units in the IT/ITeS
sector, although units across all industries felt that they have been adversely affected by the
imposition of MAT. In the case of developers of SEZs, the sudden imposition of MAT has
been seen as one of the factors to opt for de-notification. The survey also showed that despite
being completely or partially exempt from income tax according to the SEZ Act of 2005,
some of the SEZ units were required to pay MAT. This reduced the benefits of income tax
exemption.
To compensate for the lack of data, SEZ units were asked to provide data on the amount of
MAT filed. This paper showed that only 31 per cent of the units have filed MAT. However,
the retrospective imposition of MAT has adversely impacted certain units that were enjoying
income tax exemption.
To conclude, the paper highlights that there are certain drawbacks in the incentive structure
for SEZs in India. To address these drawbacks, there is a need to restructure the SEZ policy
in terms of the incentives provided to SEZs and the following steps may be considered in this
direction.
First, corporate income tax should be lower in India (around 25 per cent). If India wants to
pursue the SEZ policy, it has to continue to give direct tax exemptions until the corporate tax
is close to 25 per cent and the country improves its ranking in ease of doing business.
However, direct tax exemptions should be such that they are not actionable under the WTO’s
SCM Agreement. Specially, direct tax exemptions should not be linked to export earnings for
manufacturing units. It can be linked to other performance indicators such as investment or
high-technology. Since, the WTO is yet to develop a discipline on subsides in services, India
may continue to subsidise construction services (or developers of SEZs) or units in the
services sector in SEZs. Thus, it is time now for India to design WTO-smart subsidies.
Second, no tax exemptions can be for an indefinite period. Exemptions such as MAT
exemption should have a sunset date. In the absence of a sunset date and the sudden removal
of MAT exemptions, perceptions and business sentiments regarding SEZs tend to get
adversely affected. Since MAT exemption is a WTO actionable subsidy, it should not have
been given under the SEZ Act of 2005. But once it was given, it should not have been
withdrawn retrospectively. Such policy uncertainties have contributed to undermining the
prospects of SEZs as the drivers of India’s exports and growth. Any changes in the tax
regime have to be planned and should be designed in a way that it affects only future
investments.
Third, tax incentives have to be carefully designed so that they do not create an unequal level
playing field between SEZs and DTA. For instance, it is often pointed out that IT/ITeS

26
companies shifted from software technology parks to SEZs as the income tax holiday in the
software technology parks was being phased out. Direct tax benefits or the withdrawal of it
can lead to such shifts of units between SEZs and DTA.
Fourth, direct tax incentives to manufacturing units in SEZs do not enhance the price
competitiveness of the products that are exported, but indirect tax benefits can. Therefore,
the policy emphasis should be that Indian SEZs get indirect tax benefits from the central and
state governments.
Last but not least, the paper shows that apart from fiscal incentives, India faces stiff
competition from other countries in terms of non-fiscal incentives offered to SEZs. Given the
difficulties of doing business in India vis-à-vis other countries as reflected by the World
Bank’s 2015 Ease of Doing Business Rankings, the government should also consider
restructuring non-fiscal incentives to effectively compete with other countries in terms of
attracting investment and technology into SEZs.

27
References
Bagchi, A., Rao, R. Kavitha & Sen, Bulbul (2005). Raising the tax ratio by reining in the
“tax-breaks”: An agenda for action. Tax Research Unit Working Paper No.2, National
Institute of Public Finance and Policy, New Delhi. Available at
http://www.nipfp.org.in/media/medialibrary/2013/04/wp05_nipfp_tr_038.pdf
(accessed on 3 January, 2016)
Cieślik, A. and Ryan, M. (2005). Location determinants of Japanese multinationals in
Poland: do special economic zones really matter for investment decisions? Journal of
Economic Integration, Vol. 20, No. 3 September 2005 pp.475-496.
Department of Revenue (2014). Report of the Comptroller and Auditor General of India for
the Year 2012-13 on Performance of Special Economic Zones (SEZs). Union
Government, Department of Revenue (Indirect Taxes – Customs), Ministry of
Finance, Government of India, No. 21 of 2014. Available at
http://www.saiindia.gov.in/english/home/Our_Products/Audit_Report/Government_
Wise/union_audit/recent_reports/union_performance/2014/INDT/Report_21/21of201
4.pdf (accessed on 3 January, 2016)
Dutta, M. (2009). Nokia SEZ: Public Price of Success. Economic and Political Weekly, Vol.
44, Issue No. 40, 03 Oct, 2009 pp.23-25.
Farole, T. & Akinci, G. (2011). Special Economic Zones: Progress, emerging challenges
and future directions. World Bank, Washington D.C. available at
https://openknowledge.worldbank.org/bitstream/handle/10986/2341/638440PUB0Ext
o00Box0361527B0PUBLIC0.pdf (accessed on 3 January, 2016)
Frankfurt Institute for Advanced Studies (FIAS) (2008). Special Economic Zones:
Performance, lessons learned, and implications for zone development. World Bank,
Washington, D.C.
Ministry of Finance (2015). Report on Applicability of Minimum Alternate Tax (MAT) on
FIIs/FPIs for the period prior to 01.04.2015. Committee on Direct Tax Matters,
Ministry of Finance, Government of India
Mukherjee A., P Pal, S Deb, S Ray, D Mukherjee, D Ghosh, D Mathur and P Singh
(2015). SEZs in India: Perceptions versus Reality. Report Submitted to Department of
Commerce, Ministry of Commerce and Industry, 2015.
Nidheesh, K. B. (2014). Relationship between Tax Incentives Offered to Cochin SEZ and
Economic Contributions of Cochin SEZ. Journal of Economic & Social
Development 10.2 (2014).
Palit, A. & Bhattacharjee, S. (2008). Special economic zones in India: Myths and realities.
New Delhi: Anthem Press.

28
Pandya, F.H. and Joshi, Y.C. (2015). Impact of Fiscal Incentives on SEZs’ Performance in
Gujarat. Foreign Trade Review, 50(3), August 2015; vol. 50, 3: pp. 190-218 .
Sharma SP, Rashmi Taneja, Apurva Munjal (2014). Current State and Performance
Review of SEZs in India: A Survey. PHD Chamber of Commerce and Industry, New
Delhi.
Tantri, Malini L. (2011). Trajectories of China’s integration with the world economy
through SEZs: A study on Shenzhen SEZ. Working Paper 261, The Institute for Social and
Economic Change, Bangalore. Available at http://www.isec.ac.in/WP%20261%20-
%20Malini%20L%20T_4.pdf (accessed on 17 December, 2015)
Tantri, Malini L. (2015). Fiscal Implications of Special Economic Zones (SEZs) Expansion
in India: A Resource Cost Approach. Journal of International Commerce, Economics
and Policy Vol.6 (01) (2015)
Wang, J. (2013). The economic impact of special economic zones: Evidence from Chinese
municipalities. Journal of Development Economics, Volume 101, pp 133–147.
Available at http://ac.els-cdn.com/S0304387812000934/1-s2.0-S0304387812000934-
main.pdf?_tid=4d312c76-3b3f-11e5-9075-
00000aab0f6c&acdnat=1438758056_229bab95546fb83abb3511d73171e199
(accessed on 17 December, 2015)
Woodward, Douglas P., and Robert J. Rolfe (1993). The location of export-oriented
foreign direct investment in the Caribbean Basin. Journal of international business
studies 24, (1 March 1993) pp 121–144
Zeng, D.Z. (2011). How do special economic zones and industrial clusters drive China’s
rapid development? Washington D.C.: World Bank.

29
Appendix A
Extracted from Finance Act, 2011 - Explanatory Notes to the Provisions of the Finance
Act, 2011
CIRCULAR NO. 02/2012 [F. NO.142/01/2012-SO (TPL)], DATED 22-5-2012,
Explanatory notes to the provisions of the Finance Act, 2011
Provisions relating to Minimum Alternate Tax (MAT) in case of Special Economic
Zones
The Background: Under the existing provisions of section 10AA, a deduction of hundred
per cent was allowed in respect of profits and gains derived by a unit located in a Special
Economic Zone (SEZ) from the export of articles or things or from services for the first five
consecutive assessment years; of fifty per cent for further five assessment years; and
thereafter, of fifty per cent of the ploughed back export profit for the next five years. Further,
under section 80-IAB. a deduction of hundred per cent was allowed in respect of profits and
gains derived by an undertaking from the business of development of an SEZ notified on or
after 1st April, 2005, from the total income for any ten consecutive assessment years out of
fifteen years beginning from the year in which the SEZ has been notified by the Central
Government.
Under the provisions of sub-section (6) of section 115JB, an exemption was allowed from
payment of minimum alternate tax (MAT) on book profit in respect of the income accrued or
arising on or after 1st April, 2005 from any business carried on, or services rendered, by an
entrepreneur or a Developer, in a Unit or Special Economic Zone (SEZ), as the case may be.
The above provisions were inserted in the Income-tax Act by the Special Economic Zones
Act, 2005 (SEZ Act) with effect from 10th February, 2006. There was no sunset date provided
for exemption from MAT in the case of a developer or unit.
The Current Situation: The availability of exemption from MAT in the case of SEZ
Developers and units in SEZs has now been sunset in the Income Tax Act as well as the
SEZ Act and the provisions of section 115JB(6) will cease to have effect from 1-4-2012.
These amendments take affect from 1st April, 2012 and will accordingly apply in relation
to the assessment year 2012-13 and subsequent years.
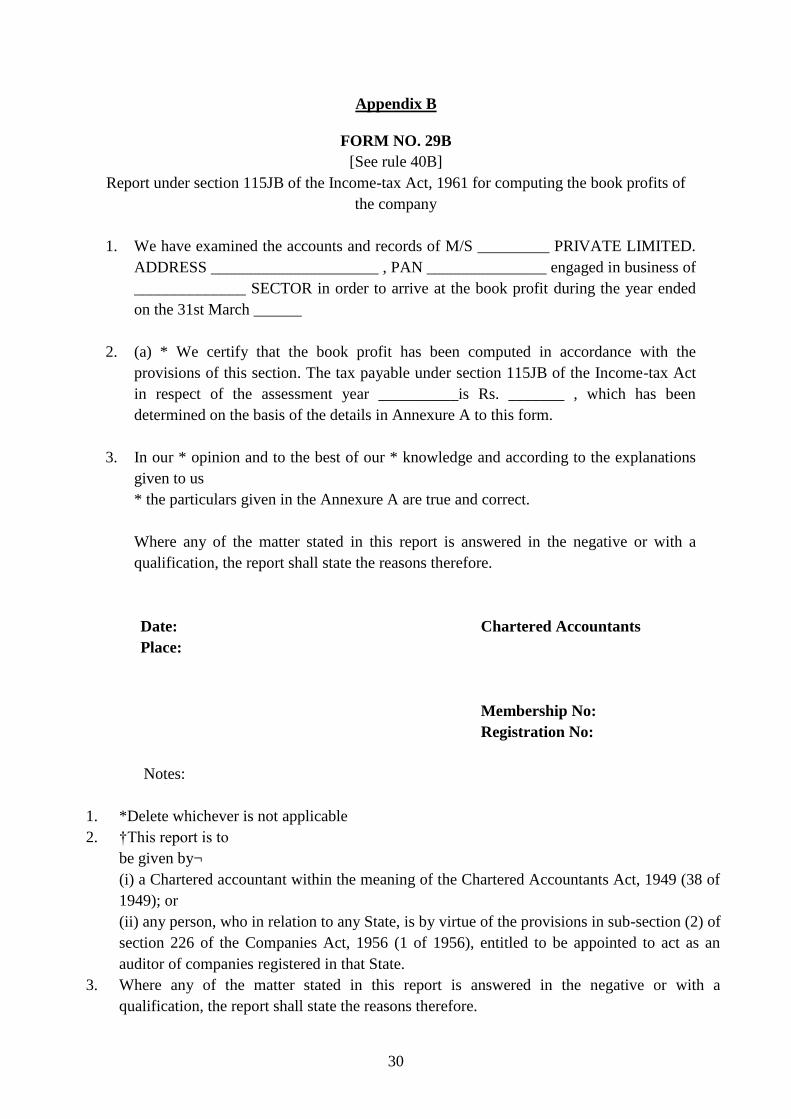
30
Appendix B
FORM NO. 29B
[See rule 40B]
Report under section 115JB of the Income-tax Act, 1961 for computing the book profits of
the company
1. We have examined the accounts and records of M/S _________ PRIVATE LIMITED.
ADDRESS _____________________ , PAN _______________ engaged in business of
______________ SECTOR in order to arrive at the book profit during the year ended
on the 31st March ______
2. (a) * We certify that the book profit has been computed in accordance with the
provisions of this section. The tax payable under section 115JB of the Income-tax Act
in respect of the assessment year __________is Rs. _______ , which has been
determined on the basis of the details in Annexure A to this form.
3. In our * opinion and to the best of our * knowledge and according to the explanations
given to us
* the particulars given in the Annexure A are true and correct.
Where any of the matter stated in this report is answered in the negative or with a
qualification, the report shall state the reasons therefore.
Date: Chartered Accountants
Place:
Membership No:
Registration No:
Notes:
1. *Delete whichever is not applicable
2. †This report is to
be given by¬
(i) a Chartered accountant within the meaning of the Chartered Accountants Act, 1949 (38 of
1949); or
(ii) any person, who in relation to any State, is by virtue of the provisions in sub-section (2) of
section 226 of the Companies Act, 1956 (1 of 1956), entitled to be appointed to act as an
auditor of companies registered in that State.
3. Where any of the matter stated in this report is answered in the negative or with a
qualification, the report shall state the reasons therefore.
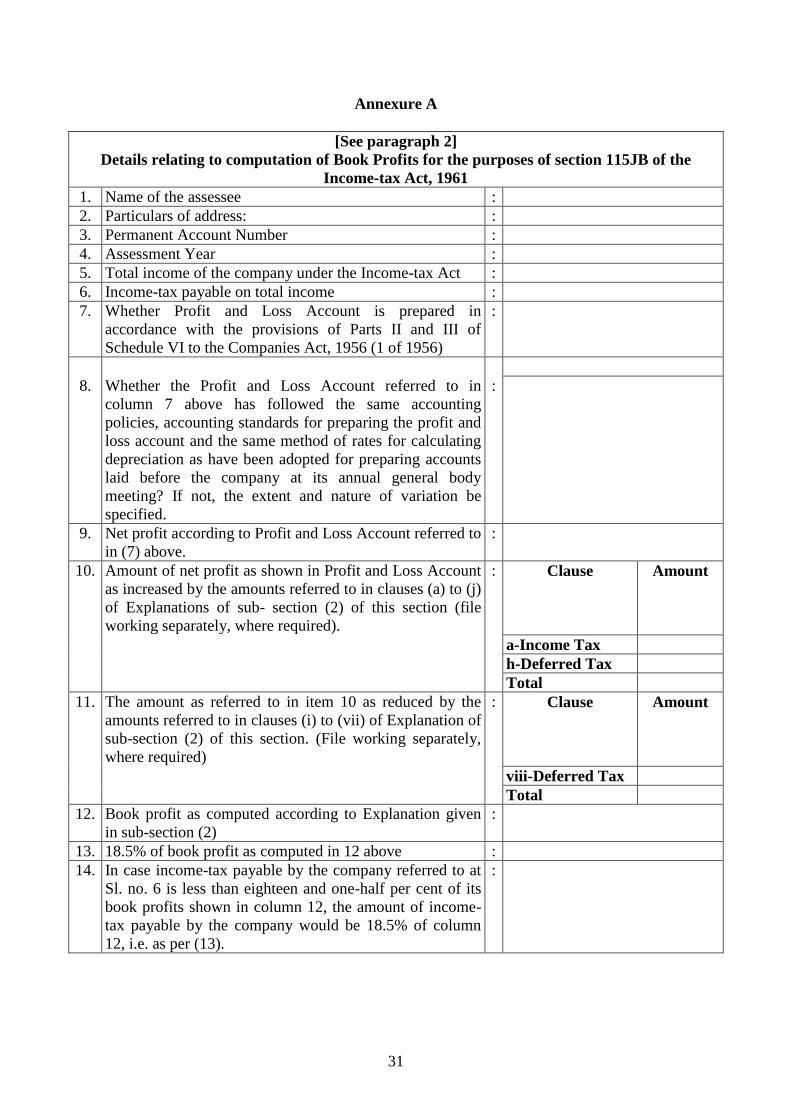
31
Annexure A
[See paragraph 2]
Details relating to computation of Book Profits for the purposes of section 115JB of the
Income-tax Act, 1961
1. Name of the assessee :
2. Particulars of address: :
3. Permanent Account Number :
4. Assessment Year :
5. Total income of the company under the Income-tax Act :
6. Income-tax payable on total income :
7. Whether Profit and Loss Account is prepared in
accordance with the provisions of Parts II and III of
Schedule VI to the Companies Act, 1956 (1 of 1956)
:
8. Whether the Profit and Loss Account referred to in
column 7 above has followed the same accounting
policies, accounting standards for preparing the profit and
loss account and the same method of rates for calculating
depreciation as have been adopted for preparing accounts
laid before the company at its annual general body
meeting? If not, the extent and nature of variation be
specified.
:
9. Net profit according to Profit and Loss Account referred to
in (7) above.
:
10. Amount of net profit as shown in Profit and Loss Account
as increased by the amounts referred to in clauses (a) to (j)
of Explanations of sub- section (2) of this section (file
working separately, where required).
: Clause Amount
a-Income Tax
h-Deferred Tax
Total
11. The amount as referred to in item 10 as reduced by the
amounts referred to in clauses (i) to (vii) of Explanation of
sub-section (2) of this section. (File working separately,
where required)
: Clause Amount
viii-Deferred Tax
Total
12. Book profit as computed according to Explanation given
in sub-section (2)
:
13. 18.5% of book profit as computed in 12 above :
14. In case income-tax payable by the company referred to at
Sl. no. 6 is less than eighteen and one-half per cent of its
book profits shown in column 12, the amount of income-
tax payable by the company would be 18.5% of column
12, i.e. as per (13).
:

1
LATEST ICRIER’S WORKING PAPERS
NO. TITLE AUTHOR YEAR
313 TECHNOLOGY, JOBS AND
INEQUALITY EVIDENCE FROM
INDIA’S MANUFACTURING
SECTOR
RADHICKA KAPOOR FEBRUARY
2016
312 DIVERSIFYING INDIA’S
SERVICES EXPORTS THROUGH
SEZS:
STATUS, ISSUES AND THE WAY
FORWARD
ARPITA MUKHERJEE
SAUBHIK DEB
SHREYA DEORA
TANU M. GOYAL
BHAVOOK BHARDWAJ
DECEMBER
2015
311 TRENDS AND ECONOMIC
DYNAMICS OF GUAR IN INDIA
DURGESH K. RAI OCTOBER
2015
310 DRUG QUALITY AND SAFETY
ISSUES IN INDIA
MAULIK CHOKSHI
RAHUL MONGIA
VASUDHA WATTAL
SEPTEMBER
2015
309 ADMINISTRATIVE STRUCTURE
AND FUNCTIONS OF DRUG
REGULATORY AUTHORITIES
IN INDIA
NUPUR CHOWDHURY
PALLAVI JOSHI
ARPITA PATNAIK
BEENA SARASWATHY
SEPTEMBER
2015
308 HUMAN CAPITAL POTENTIAL
OF INDIA’S FUTURE
WORKFORCE
ALI MEHDI
DIVYA CHAUDHRY SEPTEMBER
2015
307 RATIONALISING FERTILISER
SUBSIDY IN INDIA: KEY ISSUES
AND POLICY OPTIONS
ASHOK GULATI
PRITHA BANERJEE
AUGUST
2015
306 REIMAGINING INDIA’S URBAN
FUTURE
A FRAMEWORK FOR
SECURING HIGH-GROWTH,
LOW-CARBON, CLIMATE-
RESILIENT URBAN
DEVELOPMENT IN INDIA
MEENU TEWARI
ZEBA AZIZ
MITCHELL COOK
AMRITA GOLDAR
INDRO RAY
SAON RAY SAHANA ROYCHOWDHURY
VIDHYA UNNIKRISHNAN
AUGUST
2015
305 LOW CARBON PATHWAYS HIMANSHU GUPTA JUNE 2015
304 IS THE RUPEE OVER-VALUED? JAIMINI BHAGWATI
ABHEEK BARUA
M. SHUHEB KHAN
JUNE 2015
303 CREATING MANUFACTURING
JOBS IN INDIA: HAS OPENNESS
TO TRADE REALLY HELPED?
PANKAJ VASHISHT JUNE 2015
1
About ICRIER
Established in August 1981, ICRIER is an autonomous, policy-oriented, not-for-profit,
economic policy think tank. ICRIER's main focus is to enhance the knowledge content of
policy making by undertaking analytical research that is targeted at informing India's policy
makers and also at improving the interface with the global economy. ICRIER's office is
located in the institutional complex of India Habitat Centre, New Delhi.
ICRIER's Board of Governors includes leading academicians, policymakers, and
representatives from the private sector. Dr. Isher Ahluwalia is ICRIER's chairperson. Dr.
Rajat Kathuria is Director and Chief Executive.
ICRIER conducts thematic research in the following eight thrust areas:
Macro Management Financial Liberalisation and Regulation
Global Competitiveness of Agriculture, Manufacturing and Services
Multilateral Trade Negotiations and FTAs
Urban Transition and Challenges
Climate Change and Sustainable Development
Physical Infrastructure including Telecom, Transport and Energy
Asian Economic Integration with Focus on South Asia
Entrepreneurship and Skill Development
To effectively disseminate research findings, ICRIER organises workshops, seminars and
conferences to bring together academicians, policymakers, representatives from industry and
media to create a more informed understanding on issues of major policy interest. ICRIER
routinely invites distinguished scholars and policymakers from around the world to deliver
public lectures and give seminars on economic themes of interest to contemporary India.


