Working Paper 336 Unleashing Bihar’s Agriculture Potential: Sources and Drivers of Agriculture Growth Anwarul Hoda Pallavi Rajkhowa Ashok Gulati March 2017 INDIAN COUNCIL FOR RESEARCH ON INTERNATIONAL ECONOMIC RELATIONS
Transcript
1
Working Paper 336
Unleashing Bihar’s Agriculture Potential:
Sources and Drivers of Agriculture Growth
Anwarul Hoda
Pallavi Rajkhowa
Ashok Gulati
March 2017
INDIAN COUNCIL FOR RESEARCH ON INTERNATIONAL ECONOMIC RELATIONS
i
Table of Contents
Acknowledgement ..................................................................................................................... i
Abstract ..................................................................................................................................... ii
Executive Summary ............................................................................................................... iii
This trend of rice and wheat yield lagging behind the national average is striking when seen
against the trends in the use of yield enhancing assets and inputs. For example, irrigation
coverage in Bihar is around 68.5 per cent of the gross cropped area as compared to the
national average of 47.6 per cent (2012-13). Consumption of fertiliser has also been
increasing over the past decade. According to the data made available by the Fertiliser
Association of India (FAI), the apparent consumption of fertilisers in the state is around 199.7
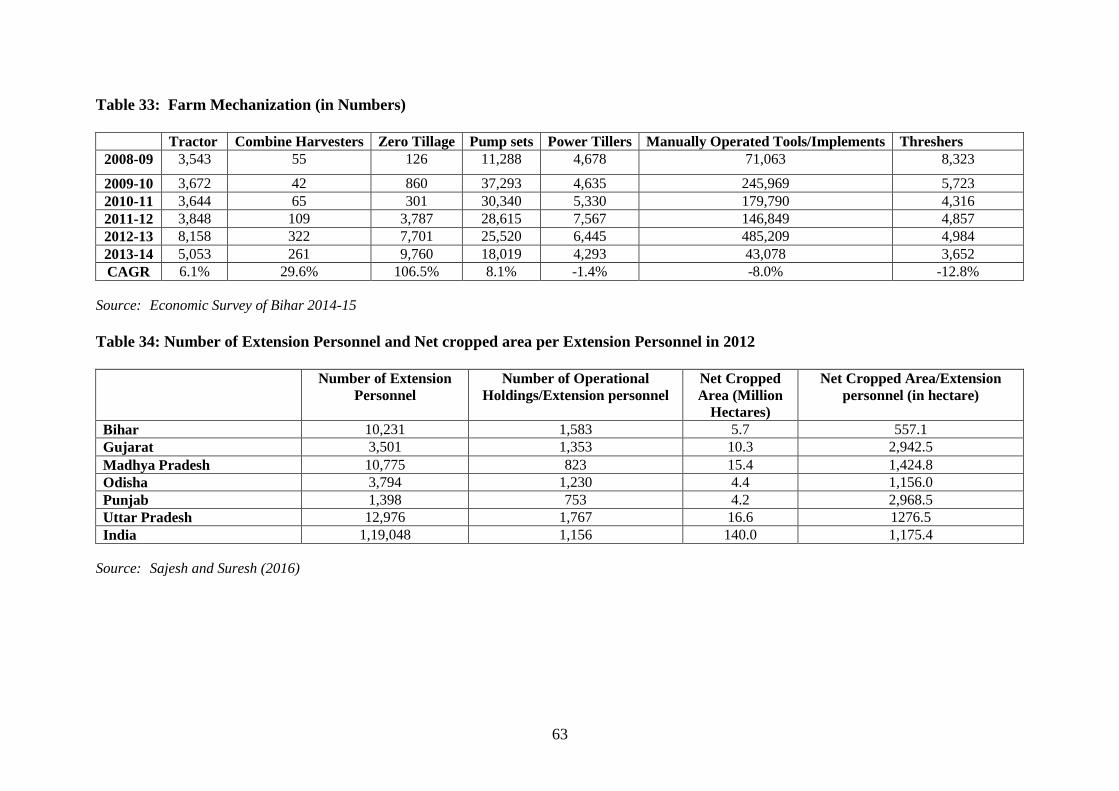
kg per hectare against the all-India figure of around 130.8 kg/ha (2012-13). Mechanisation
has also been making progress in Bihar with a robust expansion in the use of zero tillage
machines from just 126 machines in 2008-09 to 9,760 units in 2013-14, a CAGR of 106.5 per
cent. Similarly, combine harvesters have increased from 55 units in 2008-09 to 261 units in
2013-14, a CAGR of 29.6 per cent. Another significant development has been a rapid
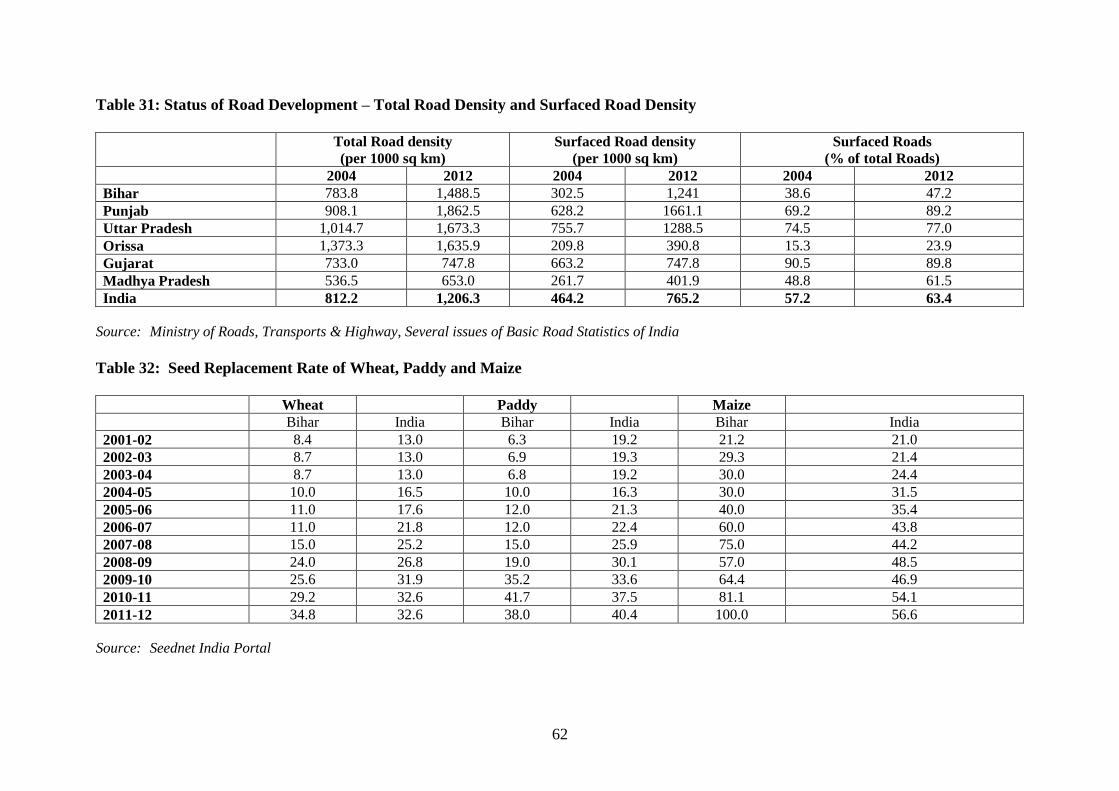
increase in the seed replacement rates of the three major crops. In the early 2000s, Bihar’s
seed replacement rates for paddy, wheat and maize were as low as 6.3 per cent, 8.4 per cent
and 21.2 per cent respectively, but these have increased to 38 per cent, 34.8 per cent and 100
per cent respectively by 2011-12.
Irrigation, fertilisers, quality seeds and mechanisation are the main inputs required to improve
the productivity of crops. Currently, Bihar is on par with or above the national average in the
utilisation of all these inputs, and yet there is a yield gap. The paradox here is that despite
investment by farmers in technology and inputs, their returns are low. Like Kishore, Sharma
and Joshi (2014), we too find that poor public- infrastructure and poor incentive structure has
negated the benefits of private investments in irrigation, fertilizer use, mechanization and
certified seed use and has kept productivity of crops low. For example, Bihar has an ultimate
irrigation potential (UIP) of 11.7 million hectares, out of which major and medium projects
can irrigate 5.3 million hectares which require public investment. As on 2013-14, Bihar has
achieved around 53.7 per cent of UIP from major and medium projects and 59.4 per cent of
its ultimate ground water irrigation potential, Bihar still has 46.3 per cent of its ultimate
irrigation potential through major and medium projects and 40.6 per cent of its ground water
irrigation potential that remain to be exploited. What is more, public investment deficit in the
power sector has resulted in a poor power supply situation and consequently, on high
v
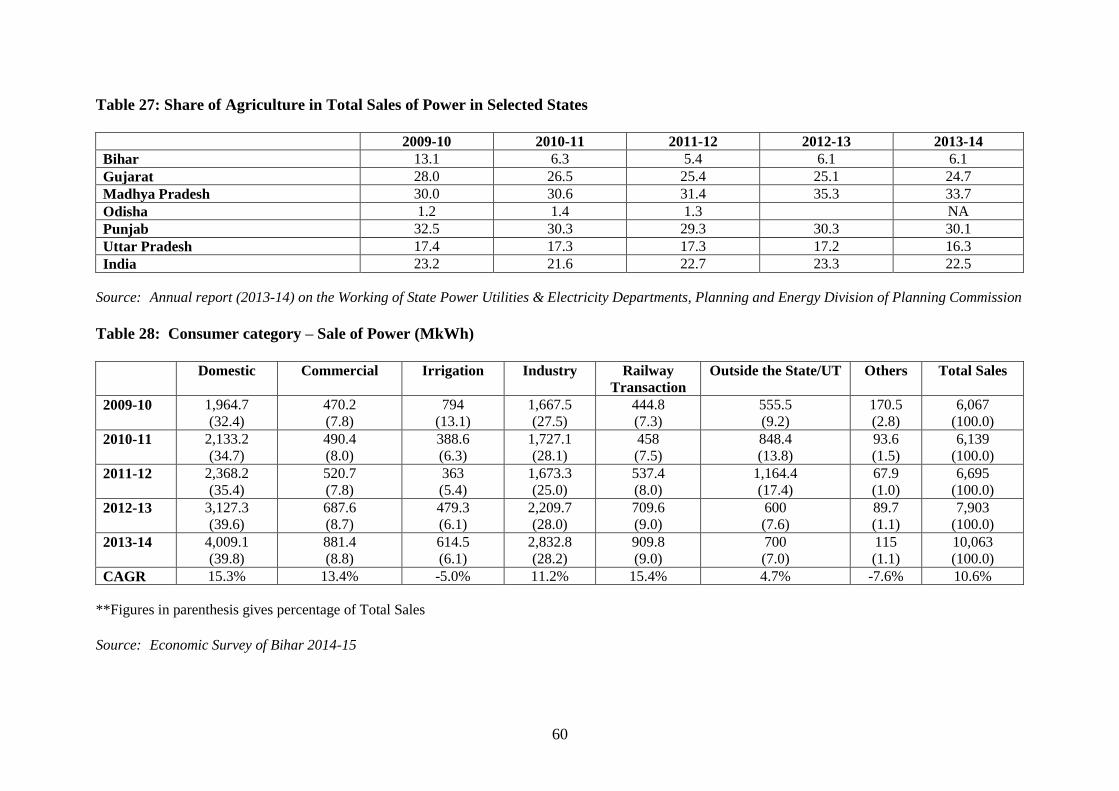
dependence on diesel pump-sets. It is particularly worrying that only a small proportion of
the total sale of power goes to agriculture, with the proportion of sales to the agricultural
sector to total sales having fallen from 13.1 per cent in 2009-10 to 6.1 per cent in 2013-14. In
comparison, states like Madhya Pradesh and Gujarat, which have recorded robust agriculture
growth, provide 33.7 per cent and 24.7 per cent of total sales to agriculture respectively.
Reliance on diesel pump sets for groundwater irrigation along with the rising price of diesel
has increased the cost of irrigation substantially for farmers. The high cost of irrigation
nullifies the natural advantage that Bihar could have enjoyed due to an abundance of ground
water resources. In recent years, groundwater levels in south Bihar have fallen, adding to the
cost of pumping water through diesel sets. Even in certain pockets of North Bihar, there has
been a fall in groundwater levels due to repeated spells of deficient rains, making irrigation
through tube wells costlier.
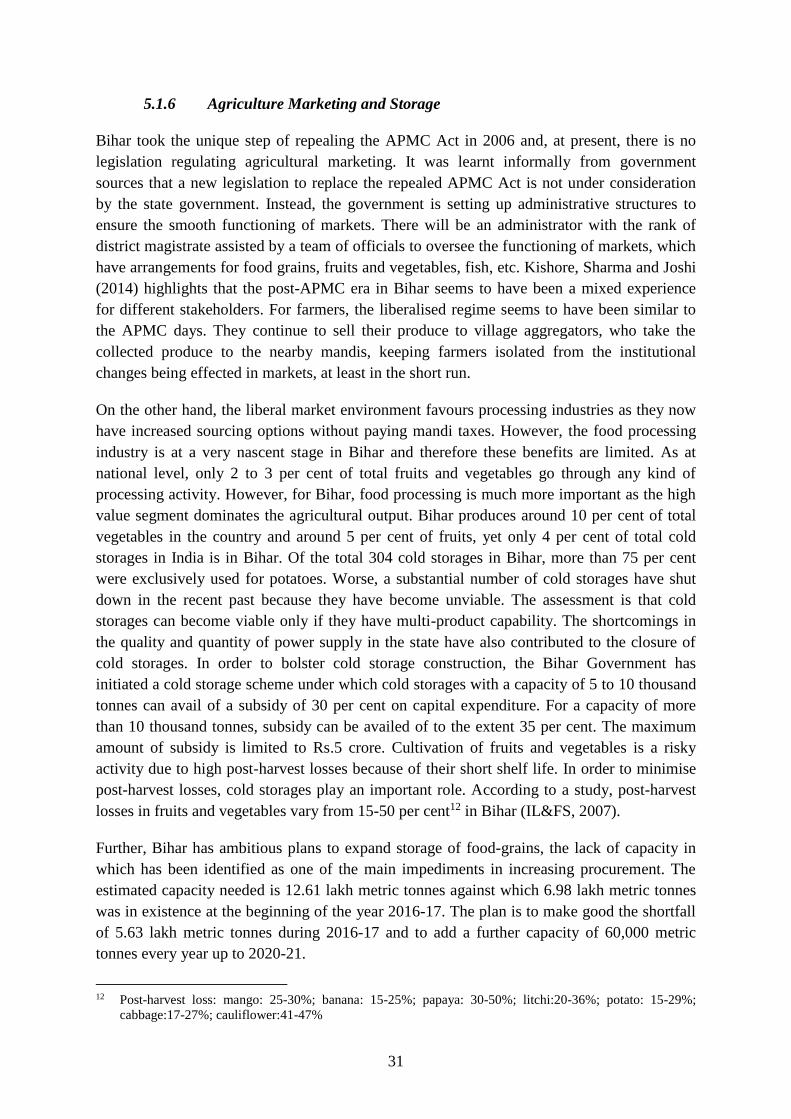
Another disadvantage that farmers in Bihar face is inadequate price incentives. The benefit of
the minimum support price (MSP) scheme of the Government of India has not been filtering
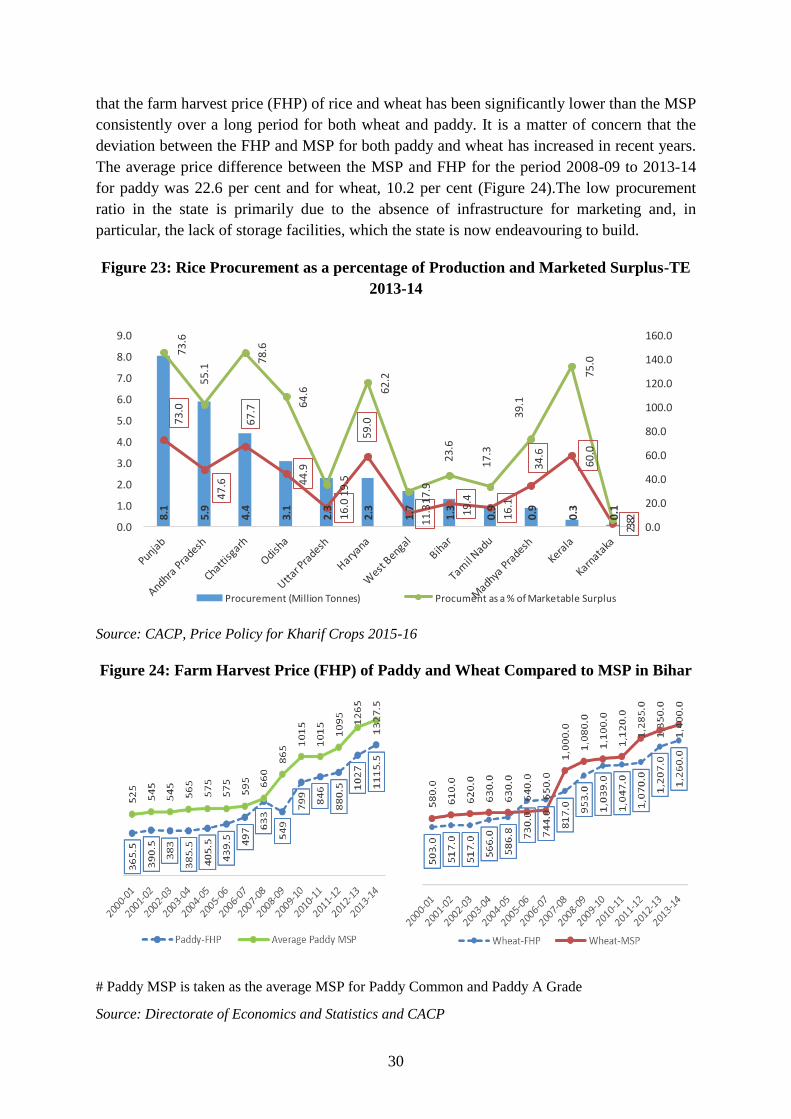
down to the farmers because of inadequate procurement operations in the state. Currently,
procurement of food grains from Bihar is low compared to states like Punjab and Haryana. In
TE 2013-14, the FCI procured around 19.4 per cent of Bihar’s total production of rice, while
the share of procurement to production in Punjab was 73.0 per cent, and 34.6 per cent in
Madhya Pradesh. Even in Odisha, it was 44.9 per cent. The low scale of procurement
operations in Bihar translates into a large gap between the farm harvest price and the MSP. In
2013-14, the average farm harvest price was Rs 1,115.5 per quintal, substantially below the
MSP of Rs 1,397.5 per quintal for that year. In a state like Bihar that is subject to frequent
natural calamities, despite private investment in the form of increased consumption of
fertiliser and certified seeds and private tube well irrigation, inadequate public investment in
irrigation, power, marketing facilities and surfaced roads have kept productivity low for most
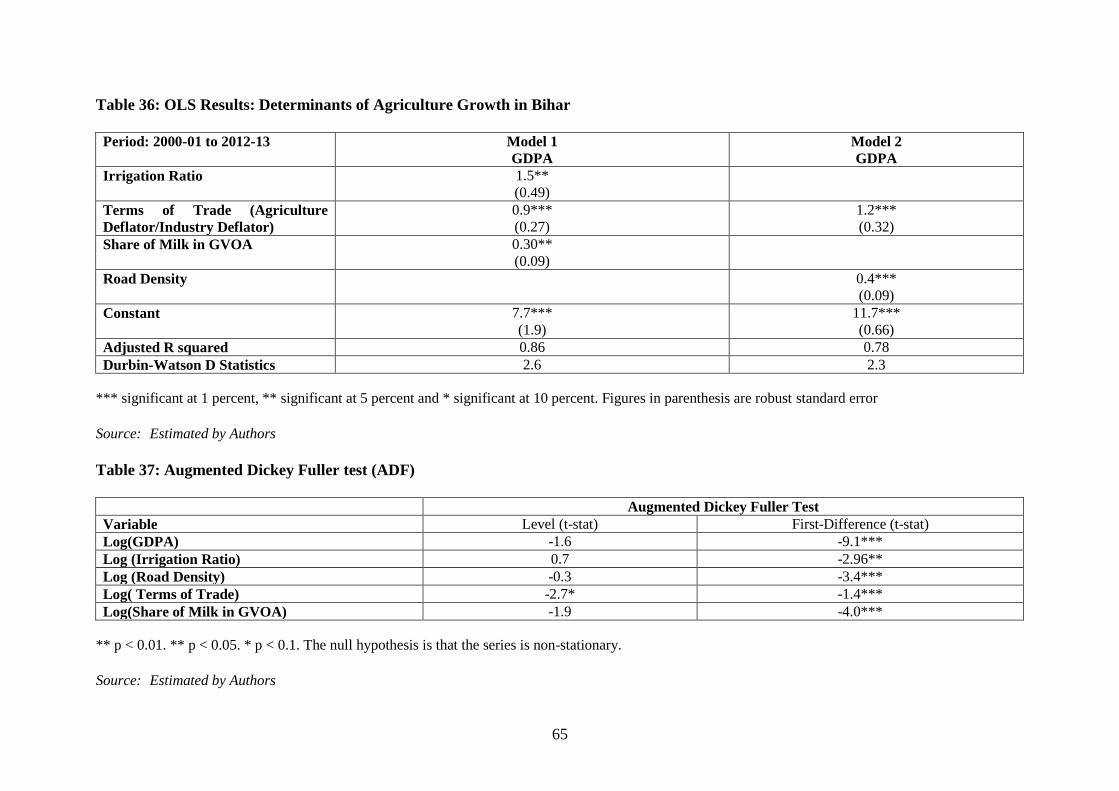
crops. Through our econometric model, we have shown that increasing irrigation, and
surfaced road density, maintaining an effective price policy and supporting the milk segment
can contribute significantly to putting agriculture growth on a higher growth trajectory in
Bihar. We have also identified several other policy changes that the state could introduce to
improve agricultural performance further. Some of these are based on the policies and
practices prevalent in states that have been more successful in agricultural development.
1
Unleashing Bihar’s Agriculture Potential:
Sources and Drivers of Agriculture Growth
Anwarul Hoda, Pallavi Rajkhowa and Ashok Gulati
1. Introduction
In the past 60 years, Indian agriculture has made remarkable improvement in food grain
production. During this period, India has turned from a food deficit to a food surplus country,
despite the increase in population from 361 million to 1.2 billion. The country has also made
strides in the diversification of agriculture from cereals to high value commodities. It is not
only the world’s second largest producer of wheat, rice, fruits and vegetables and cotton but
also the largest producer of milk and pulses. However, the performance in agricultural
development has been uneven across states. Some states like Punjab in the earlier days,
Gujarat and more recently Madhya Pradesh have seized growth opportunities and forged
ahead. Others like Odisha and Uttar Pradesh have lagged behind in several development
indicators. Bihar, on the other hand, has recorded a high agriculture growth rate in recent
years as compared to other states. Between 2005-06 and 2014-15, the agricultural sector in
Bihar grew at 5.6 per cent as compared to the national average of 3.6 per cent. However, this
growth rate has been extremely volatile due to recurring natural disasters and is highly
sensitive to the choice of the initial and final years. Moreover, productivity in agricultural
crops remains low vis-à-vis the national average despite the use of significant productivity
augmenting inputs such as fertilisers, quality certified seeds, farm machines, etc., in the state.
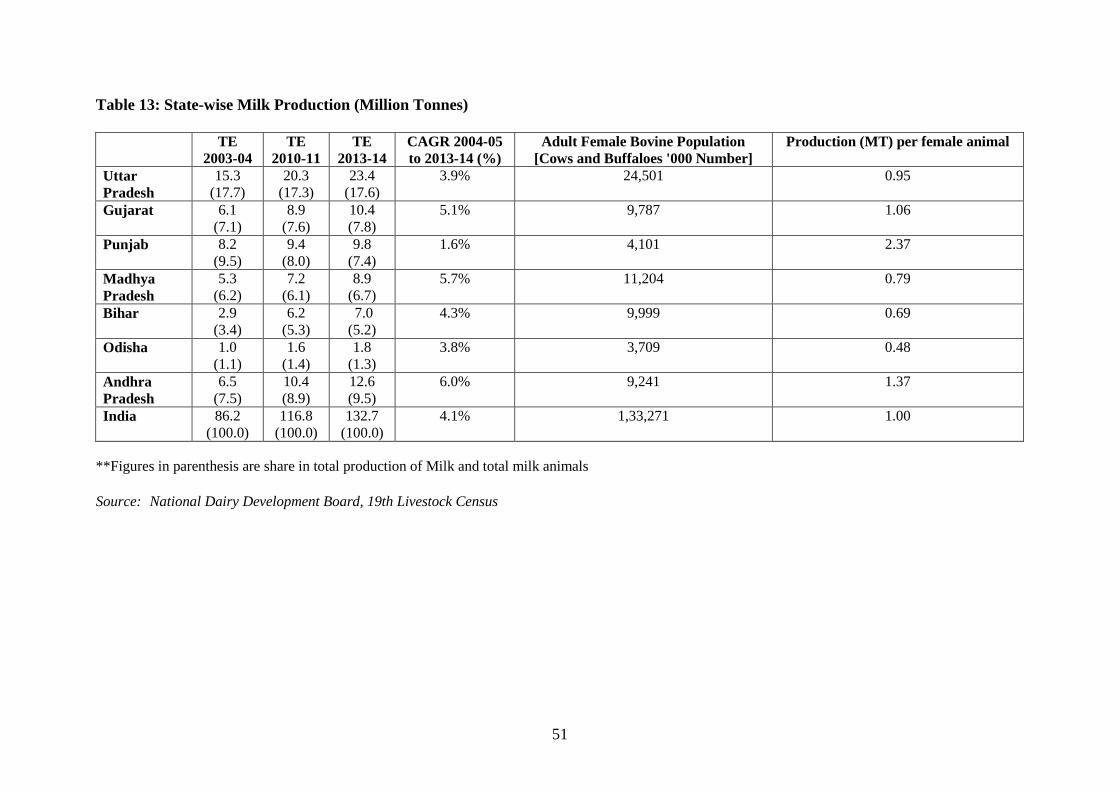
There has also been impressive diversification of agriculture particularly through dairy
development, but again, the productivity in milk production lags behind the milk productivity
of major milk producing states in India. In this paper, we explore the reasons behind this
paradox of low agricultural productivity and high use of inputs in crops, and robust expansion
but low productivity in dairy, while analysing the sources and drivers of agriculture growth in
Bihar.
In Section 2, we first discuss data sources and methodology used in the study. In Section 3,
we give a description of the geographical and demographic features as well as the land and
water resources of the state, briefly reviewing natural calamities that have afflicted
agriculture. Section 4 examines the composition and sources of agricultural growth in the
state. In Section 5, we discuss the status of physical infrastructure in Bihar and the drivers of
agricultural growth using econometric analysis. Section 6 concludes with recommendations
for policy interventions that would stimulate and sustain agricultural growth in the state.
2. Data and Methodology
The study has used secondary data compiled from various published sources, covering the
period 2000-01 to 2014-15.We analyse and compare the performance of Bihar vis-à-vis the
performance of other states. For the purpose of comparison, we have chosen two sub-groups
of three comparator states each: the first comprising Gujarat, Madhya Pradesh and Punjab,
2
and the second Bihar, Odisha and Uttar Pradesh. The basis for selecting these sets of states is
that, Gujarat and Madhya Pradesh have experienced rapid agricultural growth in the past
decade while Punjab had achieved high growth earlier during the green revolution. Bihar,
Odisha and Uttar Pradesh are considered moderately performing states due to their poor
agriculture growth and high poverty rates.
To examine the composition of agriculture, we have calculated the share of value of output
from different segments as a percentage of the total value of output from agriculture and
allied activities. To study the sources of growth, we have deflated the current series of each
segment by the WPI at 2004-05 prices and then decomposed the year-on-year growth in gross
value of output from agriculture and allied activities (GVOA) by taking the absolute year-on
year difference in GVO from each segment as a proportion of the previous year’s GVO from
agriculture and allied activities.
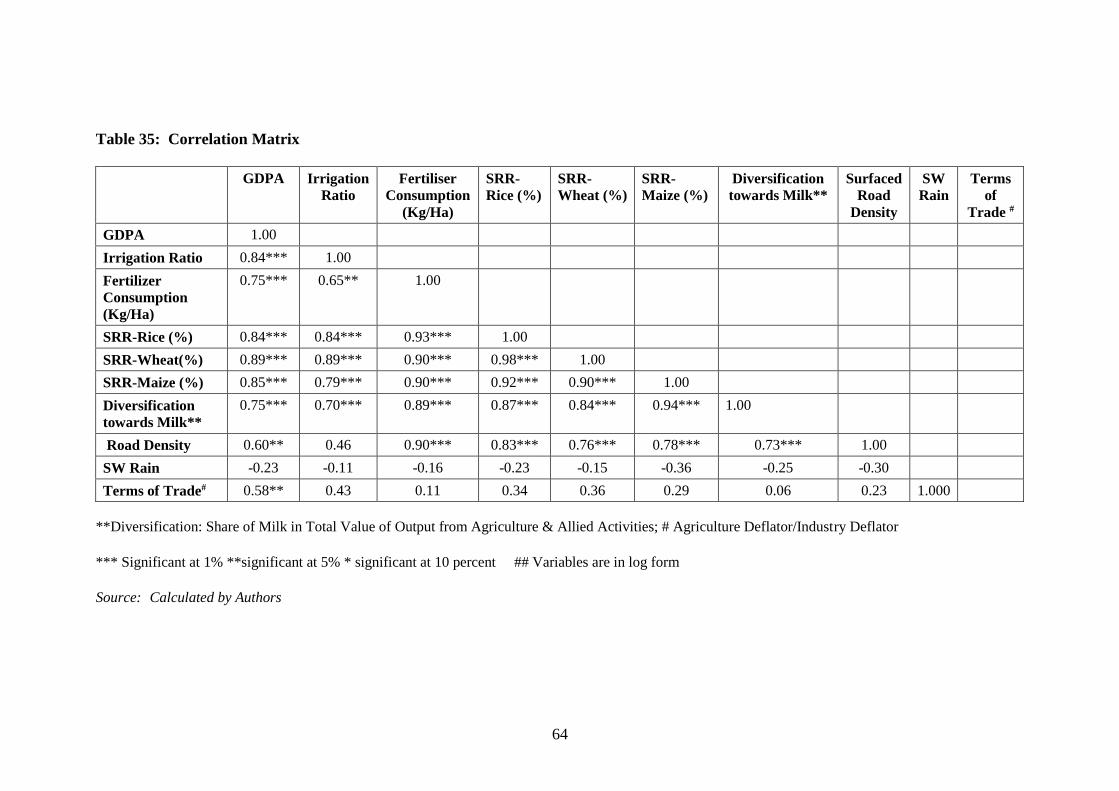
The drivers of growth were analysed by using a three-step procedure to estimate the
association between agriculture growth and selected control variables. First, we test if the
natural logarithm of the selected variables is integrated of the same order using the
Augmented Dickey Fuller (ADF) test. Based on the outcome of the test, in the second stage,
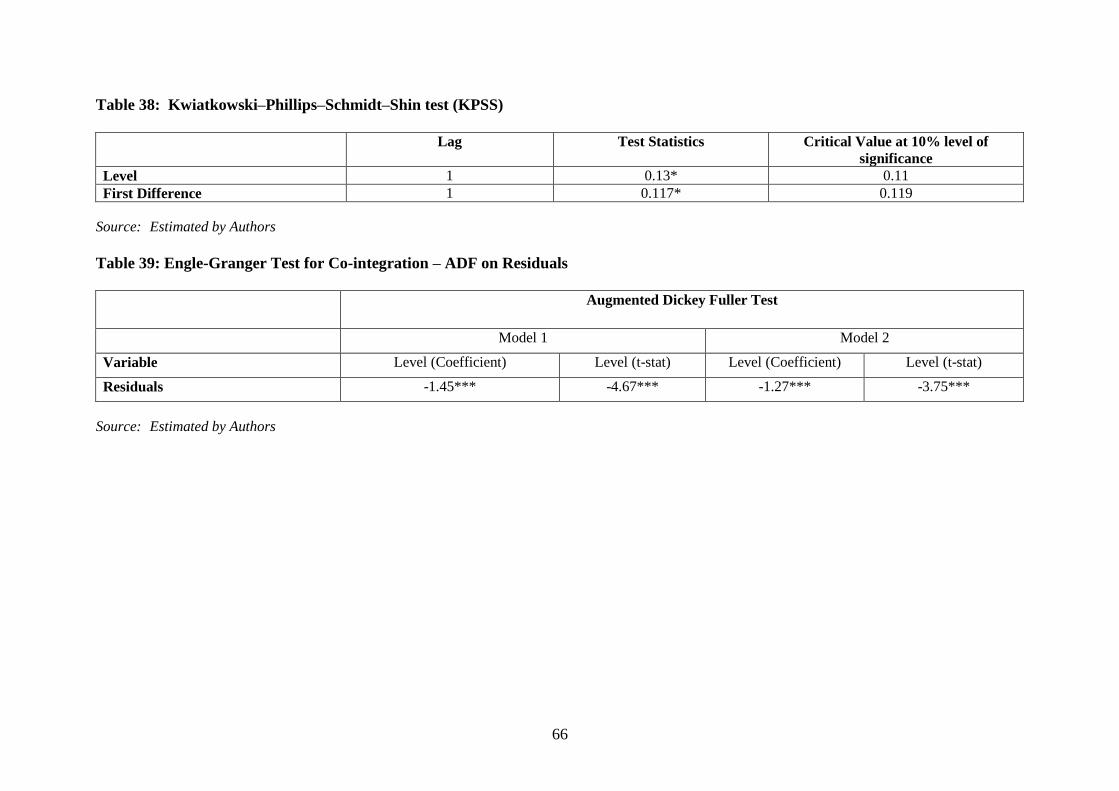
we determine if the series are co-integrated (i.e., testing for a long-term relationship between
the variables) using Engle and Granger’s (1986) two-stage residual based method. This
method was adopted because we are interested in the elasticity of the explanatory variables.
Accordingly, we first run an ordinary least square model to analyse the determinants of
agricultural growth in Bihar and then perform a unit root test on the residuals of the model to
examine if it is stationary. The null hypothesis in the Engle-Granger procedure is no co-
integration and the alternative is co-integration.
3. Agriculture in Bihar
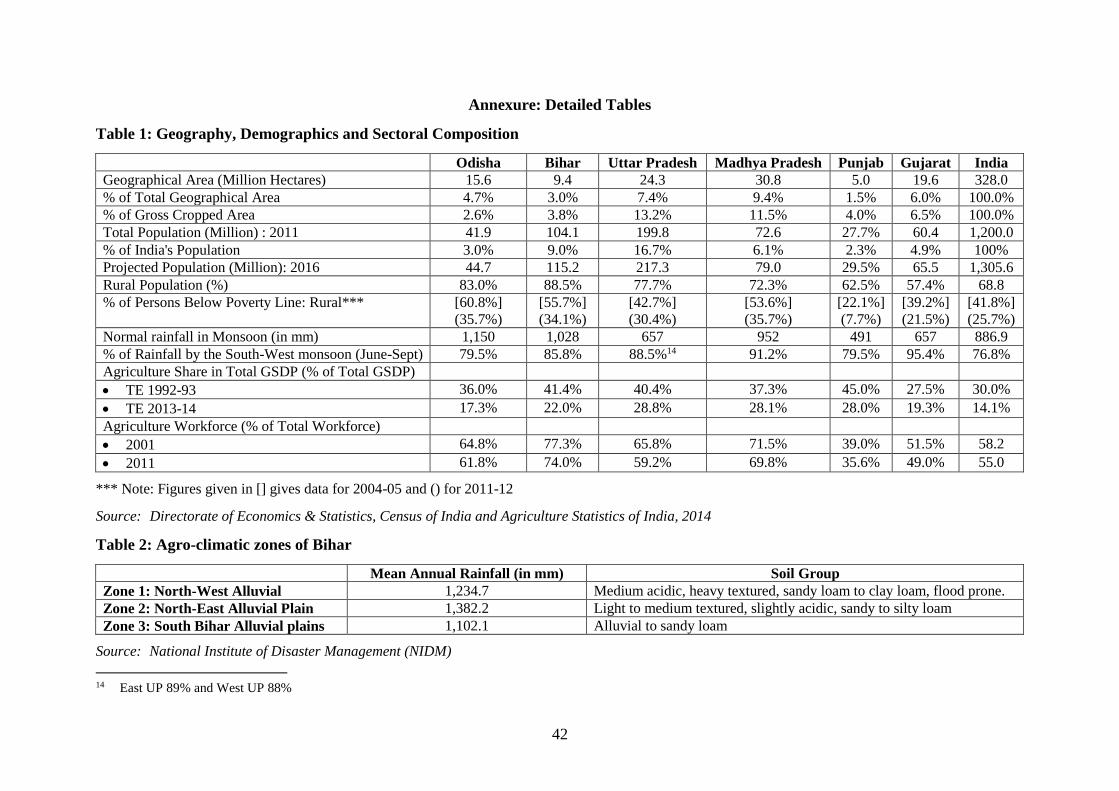
3.1 Geography, Demography and Structural Composition
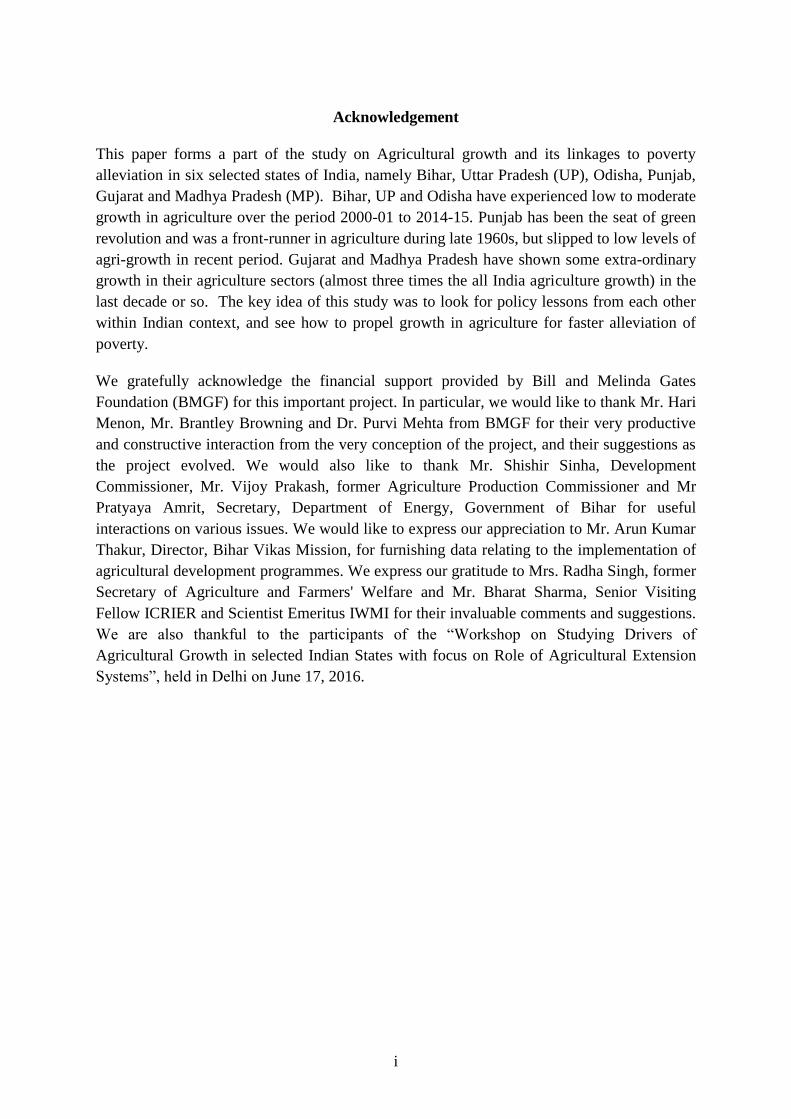
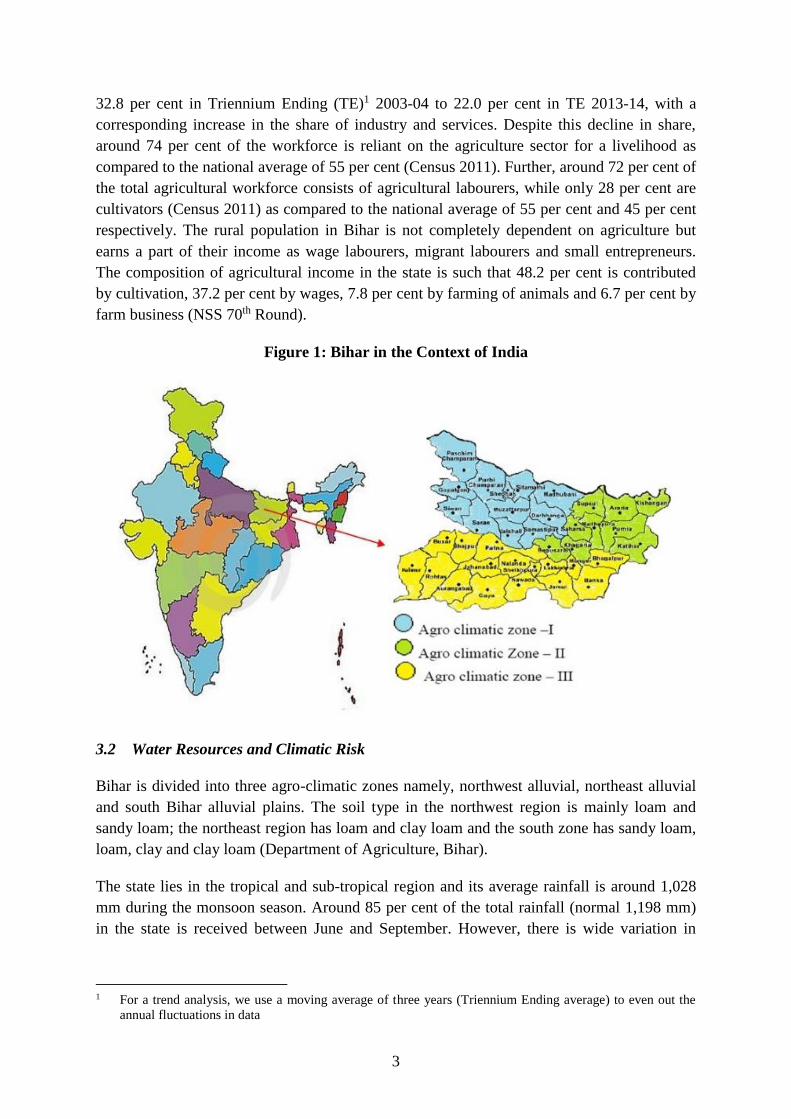
Bihar is a land-locked state situated in the eastern part of the country, with West Bengal in
the east, Uttar Pradesh to its west, Nepal to its north and Jharkhand to its south. Its total
geographical area is 9.4 million hectares and it is divided into three agro-climatic zones
namely, northwest alluvial, northeast alluvial and south Bihar alluvial plains.
Bihar has around at 115.2 million (2016) people in the state, accounting for about 8.8 per cent
of India’s population. It is the third most populous state after Uttar Pradesh and Maharashtra.
The state has a very high population density of 1,218 per sq km as compared to the national
average of 396 per sq km, increasing the pressure on land and compounding the problem of
rural poverty. Around 88.5 per cent of the population lives in rural areas as compared to the
national average of 68.8 per cent, thereby making Bihar largely a rural economy. Like the rest
of the country, Bihar has also undergone a structural change, moving away from agriculture
towards industry and services. The agricultural sector’s share in total GSDP has fallen from
3
32.8 per cent in Triennium Ending (TE)1 2003-04 to 22.0 per cent in TE 2013-14, with a
corresponding increase in the share of industry and services. Despite this decline in share,
around 74 per cent of the workforce is reliant on the agriculture sector for a livelihood as
compared to the national average of 55 per cent (Census 2011). Further, around 72 per cent of
the total agricultural workforce consists of agricultural labourers, while only 28 per cent are
cultivators (Census 2011) as compared to the national average of 55 per cent and 45 per cent
respectively. The rural population in Bihar is not completely dependent on agriculture but
earns a part of their income as wage labourers, migrant labourers and small entrepreneurs.
The composition of agricultural income in the state is such that 48.2 per cent is contributed
by cultivation, 37.2 per cent by wages, 7.8 per cent by farming of animals and 6.7 per cent by
farm business (NSS 70th Round).
Figure 1: Bihar in the Context of India
3.2 Water Resources and Climatic Risk
Bihar is divided into three agro-climatic zones namely, northwest alluvial, northeast alluvial
and south Bihar alluvial plains. The soil type in the northwest region is mainly loam and
sandy loam; the northeast region has loam and clay loam and the south zone has sandy loam,
loam, clay and clay loam (Department of Agriculture, Bihar).
The state lies in the tropical and sub-tropical region and its average rainfall is around 1,028
mm during the monsoon season. Around 85 per cent of the total rainfall (normal 1,198 mm)
in the state is received between June and September. However, there is wide variation in
1 For a trend analysis, we use a moving average of three years (Triennium Ending average) to even out the
annual fluctuations in data
4
rainfall across agro-climatic zones, for example the northwest zone receives a mean rainfall
of 1,234.7 mm, the northeast zone 1,382.2 mm and the south zone 1,102.1 mm.
The topography of Bihar is described as fertile alluvial plain lying wholly in the Gangetic
Valley. The state is richly endowed with water resources, both ground and surface water.
Besides rainfall, rivers that flow within the state are an important source of water. The main
defining feature of the state is that the River Ganges flows through it and divides it broadly
into water abundant north and south Bihar. The whole of North Bihar benefits from the
Himalayan Rivers while South Bihar has rivers flowing from central India. Most of the rivers
in North Bihar, Saryu (Ghaghra), Gandak, Burhi Gandak, Bagmati, Kamla-Balan, Koshi and
Mahananda (Adhwara group of rivers) are of Himalayan origin and have a considerable
portion of their catchment in the glacial region falling in Nepal and Tibet. They are
positioned to receive copious amount of rainfall during the monsoons. The southern part of
Bihar, on the other hand, is drained by rivers that are largely rain fed having their origin
either in the Vindhyachal Hills or in the hills of Chhotanagpur and Rajmahal. These rivers are
either dry or have scanty discharge in non-monsoon months. Karmanasa, Sone, Punpun, Kiul,
Badua, Chandan are important rivers of this region.
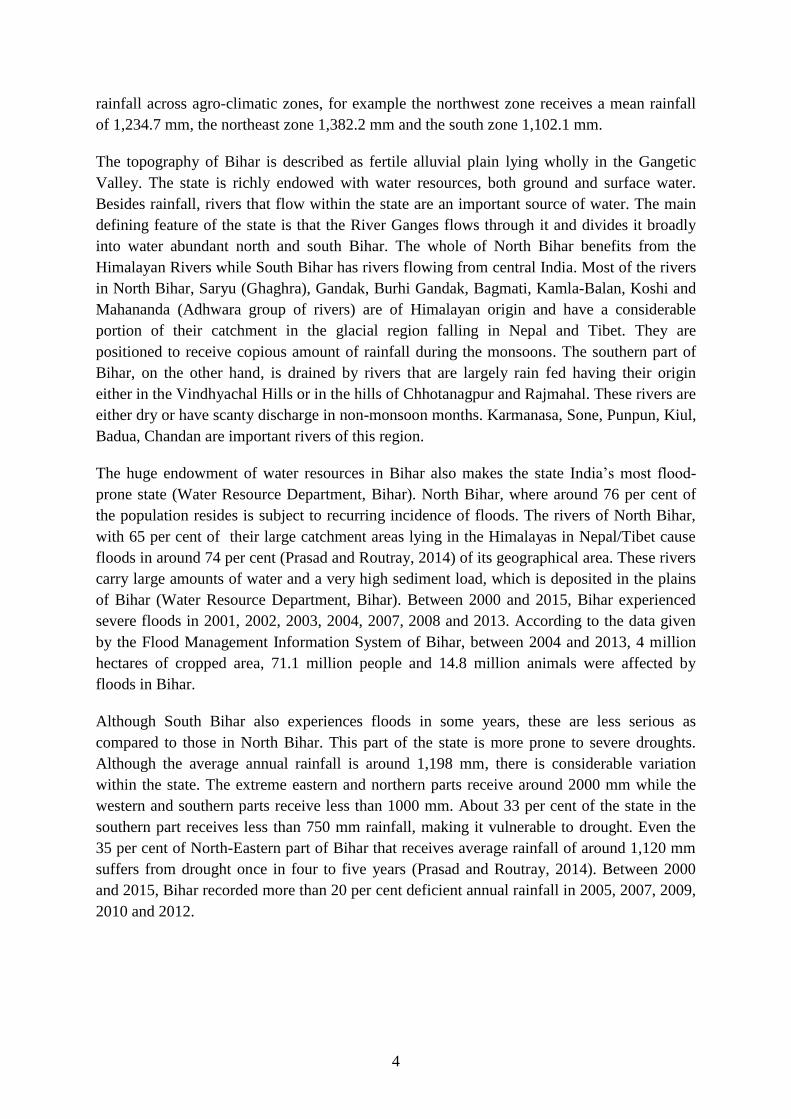
The huge endowment of water resources in Bihar also makes the state India’s most flood-
prone state (Water Resource Department, Bihar). North Bihar, where around 76 per cent of
the population resides is subject to recurring incidence of floods. The rivers of North Bihar,
with 65 per cent of their large catchment areas lying in the Himalayas in Nepal/Tibet cause
floods in around 74 per cent (Prasad and Routray, 2014) of its geographical area. These rivers
carry large amounts of water and a very high sediment load, which is deposited in the plains
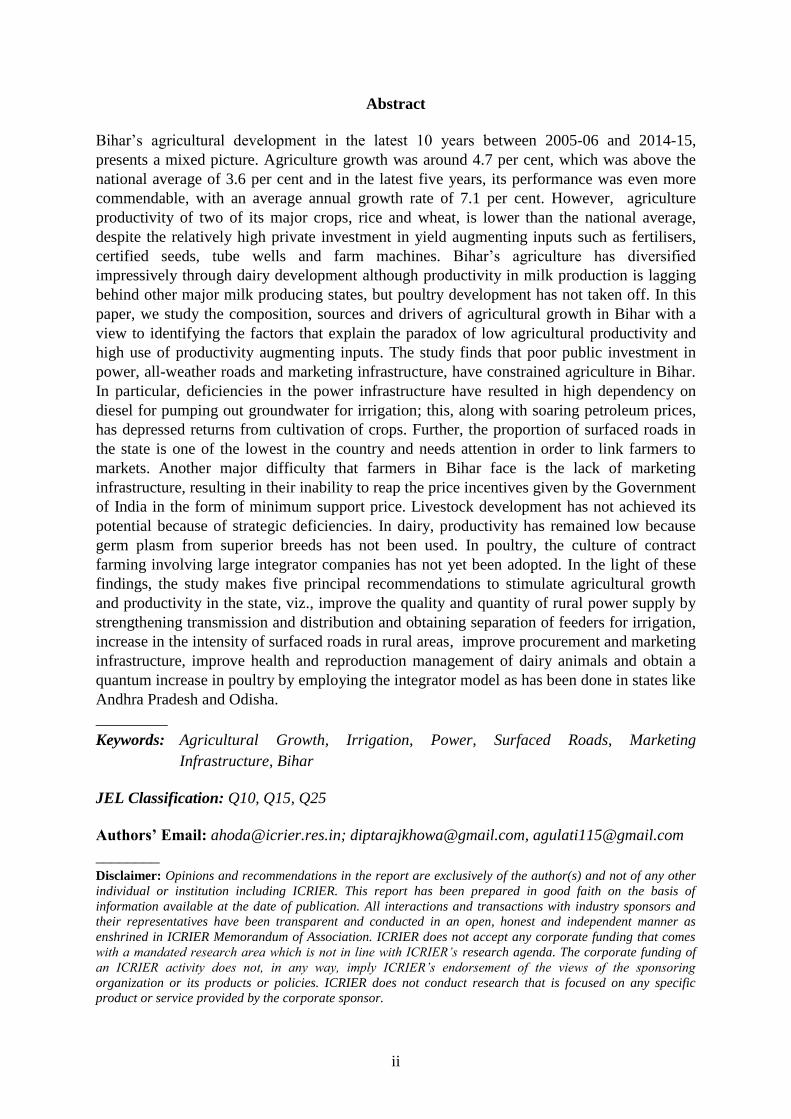
of Bihar (Water Resource Department, Bihar). Between 2000 and 2015, Bihar experienced
severe floods in 2001, 2002, 2003, 2004, 2007, 2008 and 2013. According to the data given
by the Flood Management Information System of Bihar, between 2004 and 2013, 4 million
hectares of cropped area, 71.1 million people and 14.8 million animals were affected by
floods in Bihar.
Although South Bihar also experiences floods in some years, these are less serious as
compared to those in North Bihar. This part of the state is more prone to severe droughts.
Although the average annual rainfall is around 1,198 mm, there is considerable variation
within the state. The extreme eastern and northern parts receive around 2000 mm while the
western and southern parts receive less than 1000 mm. About 33 per cent of the state in the
southern part receives less than 750 mm rainfall, making it vulnerable to drought. Even the
35 per cent of North-Eastern part of Bihar that receives average rainfall of around 1,120 mm
suffers from drought once in four to five years (Prasad and Routray, 2014). Between 2000
and 2015, Bihar recorded more than 20 per cent deficient annual rainfall in 2005, 2007, 2009,
2010 and 2012.
5
Figure 2: Floods and Droughts in Bihar
Source: UNDP and NIDM
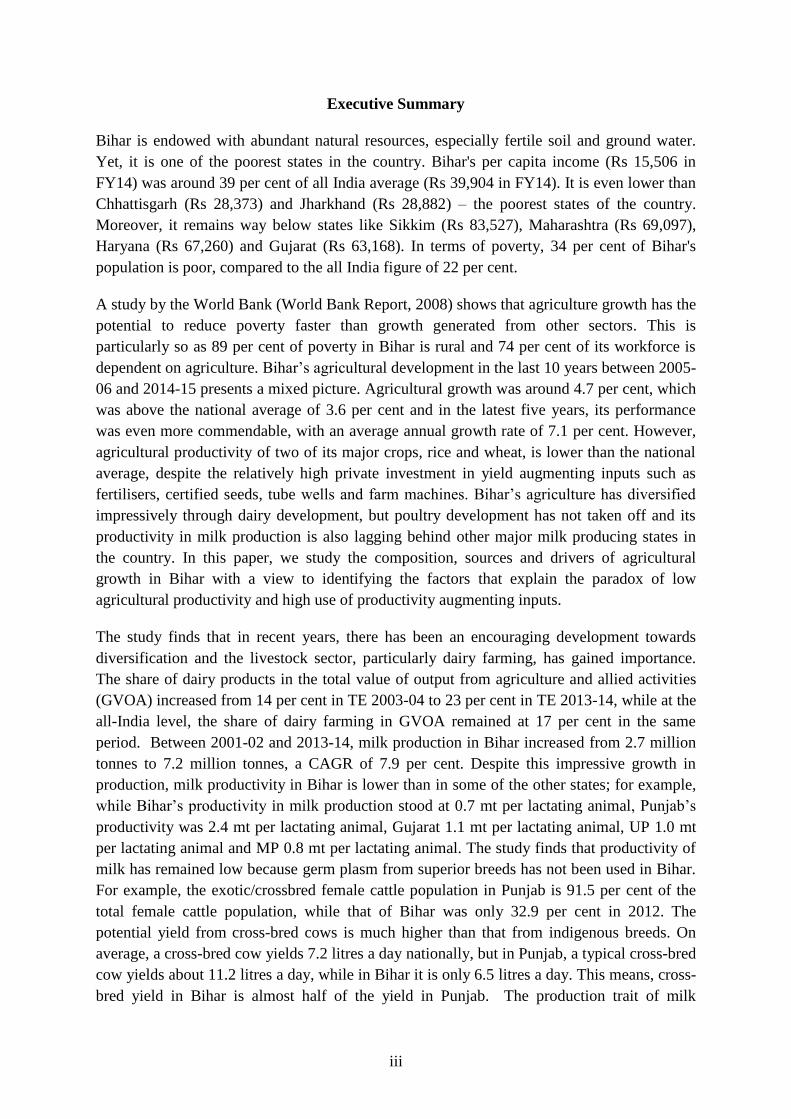
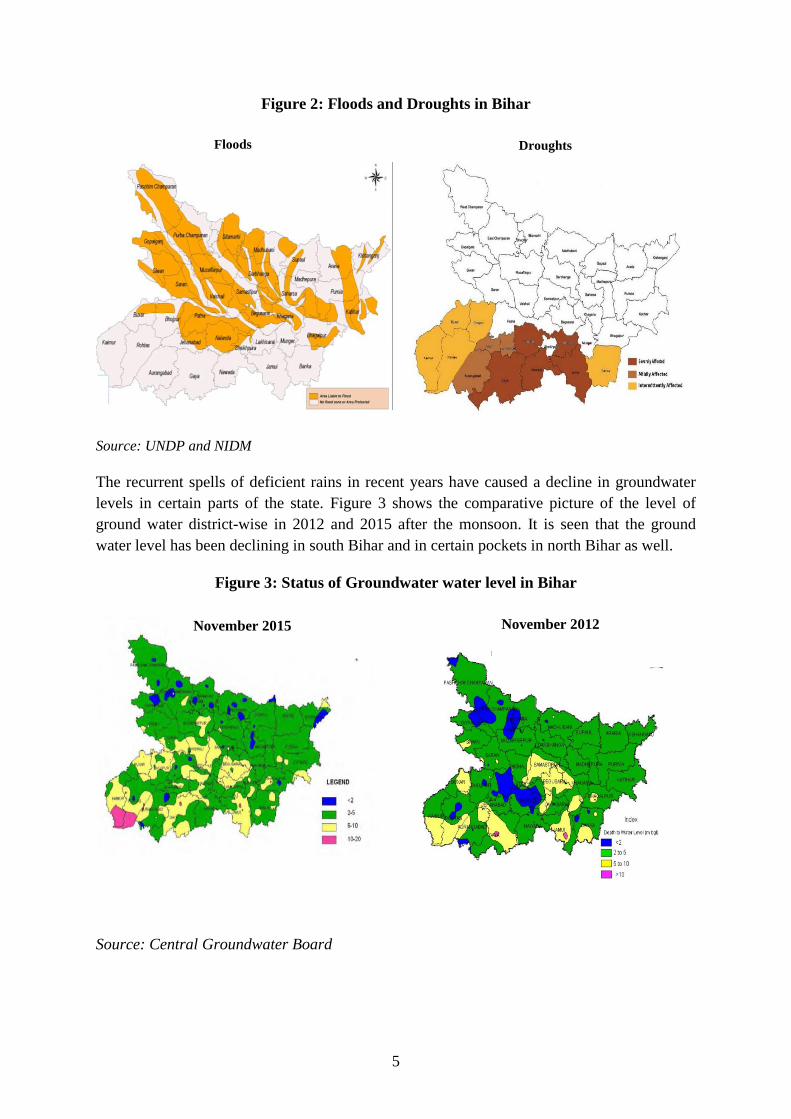
The recurrent spells of deficient rains in recent years have caused a decline in groundwater
levels in certain parts of the state. Figure 3 shows the comparative picture of the level of
ground water district-wise in 2012 and 2015 after the monsoon. It is seen that the ground
water level has been declining in south Bihar and in certain pockets in north Bihar as well.
Figure 3: Status of Groundwater water level in Bihar
Source: Central Groundwater Board
November 2015 November 2012
Floods Droughts
6
Percentage share in Total
Geographical Area Fallow Land
(Million ha)
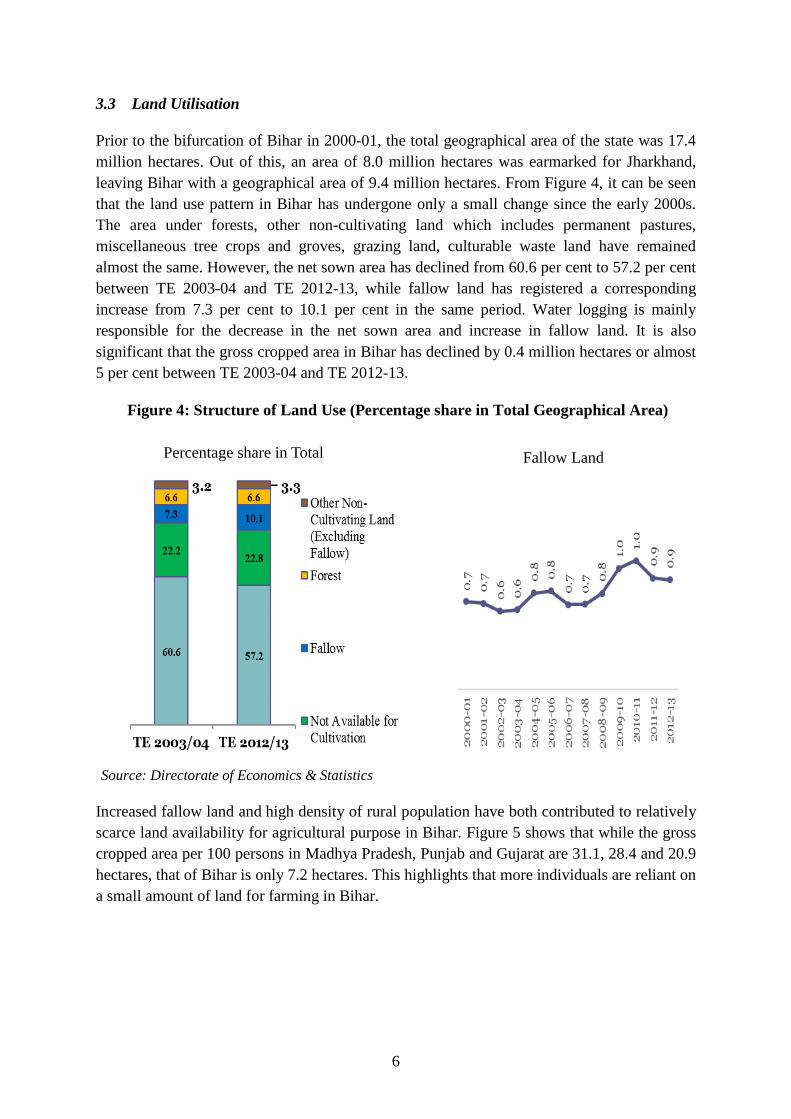
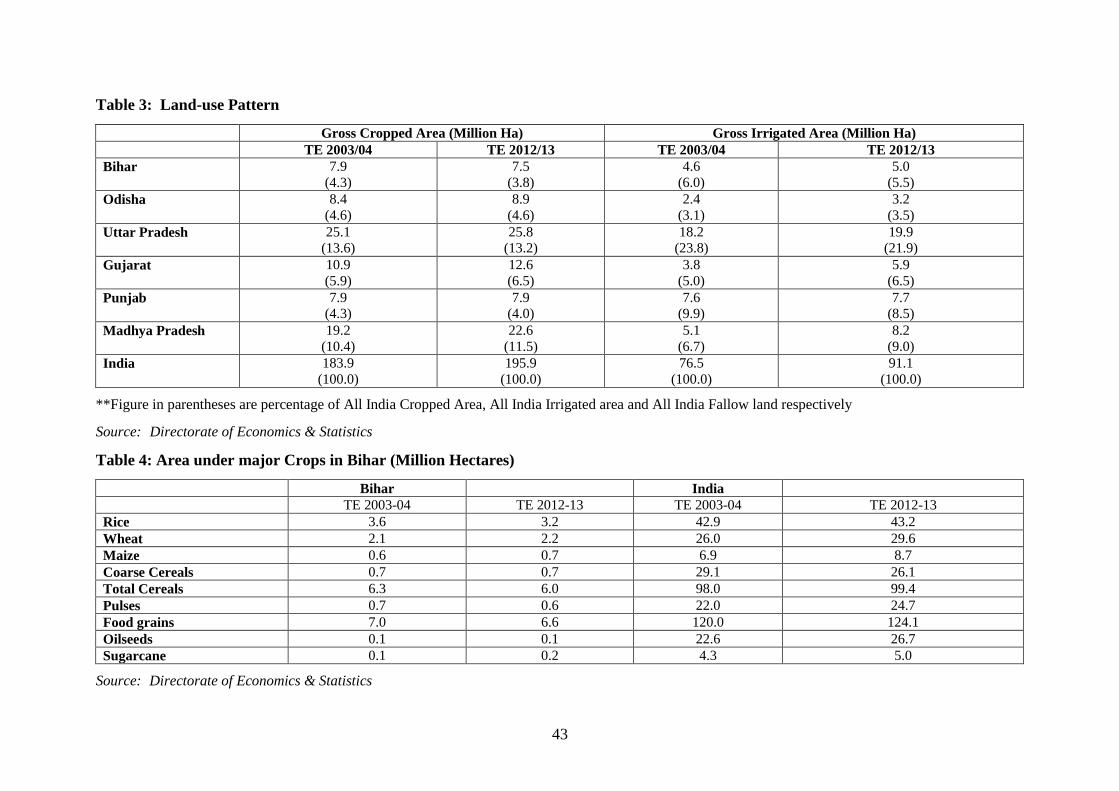
3.3 Land Utilisation
Prior to the bifurcation of Bihar in 2000-01, the total geographical area of the state was 17.4
million hectares. Out of this, an area of 8.0 million hectares was earmarked for Jharkhand,
leaving Bihar with a geographical area of 9.4 million hectares. From Figure 4, it can be seen
that the land use pattern in Bihar has undergone only a small change since the early 2000s.
The area under forests, other non-cultivating land which includes permanent pastures,
miscellaneous tree crops and groves, grazing land, culturable waste land have remained
almost the same. However, the net sown area has declined from 60.6 per cent to 57.2 per cent
between TE 2003-04 and TE 2012-13, while fallow land has registered a corresponding
increase from 7.3 per cent to 10.1 per cent in the same period. Water logging is mainly
responsible for the decrease in the net sown area and increase in fallow land. It is also
significant that the gross cropped area in Bihar has declined by 0.4 million hectares or almost
5 per cent between TE 2003-04 and TE 2012-13.
Figure 4: Structure of Land Use (Percentage share in Total Geographical Area)
Source: Directorate of Economics & Statistics
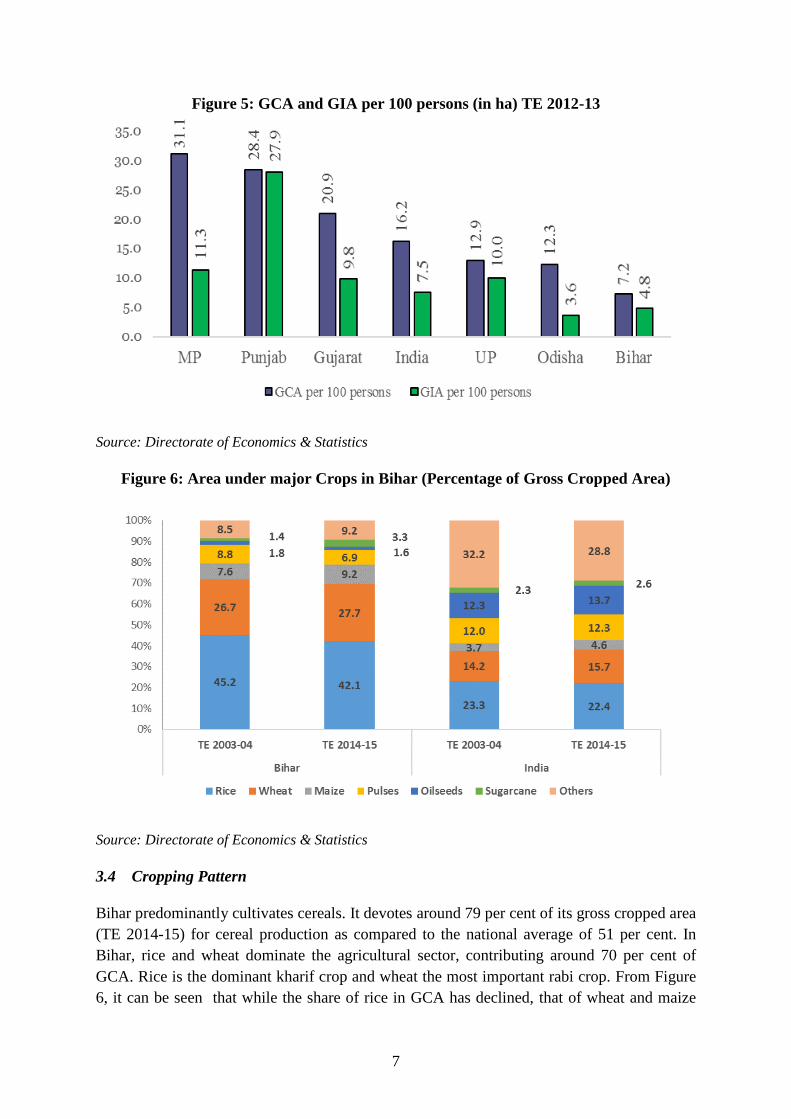
Increased fallow land and high density of rural population have both contributed to relatively
scarce land availability for agricultural purpose in Bihar. Figure 5 shows that while the gross
cropped area per 100 persons in Madhya Pradesh, Punjab and Gujarat are 31.1, 28.4 and 20.9
hectares, that of Bihar is only 7.2 hectares. This highlights that more individuals are reliant on
a small amount of land for farming in Bihar.
7
Figure 5: GCA and GIA per 100 persons (in ha) TE 2012-13
Source: Directorate of Economics & Statistics
Figure 6: Area under major Crops in Bihar (Percentage of Gross Cropped Area)
Source: Directorate of Economics & Statistics
3.4 Cropping Pattern
Bihar predominantly cultivates cereals. It devotes around 79 per cent of its gross cropped area
(TE 2014-15) for cereal production as compared to the national average of 51 per cent. In
Bihar, rice and wheat dominate the agricultural sector, contributing around 70 per cent of
GCA. Rice is the dominant kharif crop and wheat the most important rabi crop. From Figure
6, it can be seen that while the share of rice in GCA has declined, that of wheat and maize
8
has increased in Bihar Both the decline in the acreage of rice and the increase in acreage
under wheat and maize are more pronounced in the state than at the national level. Food
grains (cereals and pulses) account for around 86 per cent of GCA in the state – the highest
percentage among all states – and their share in GCA has declined only marginally over the
years.
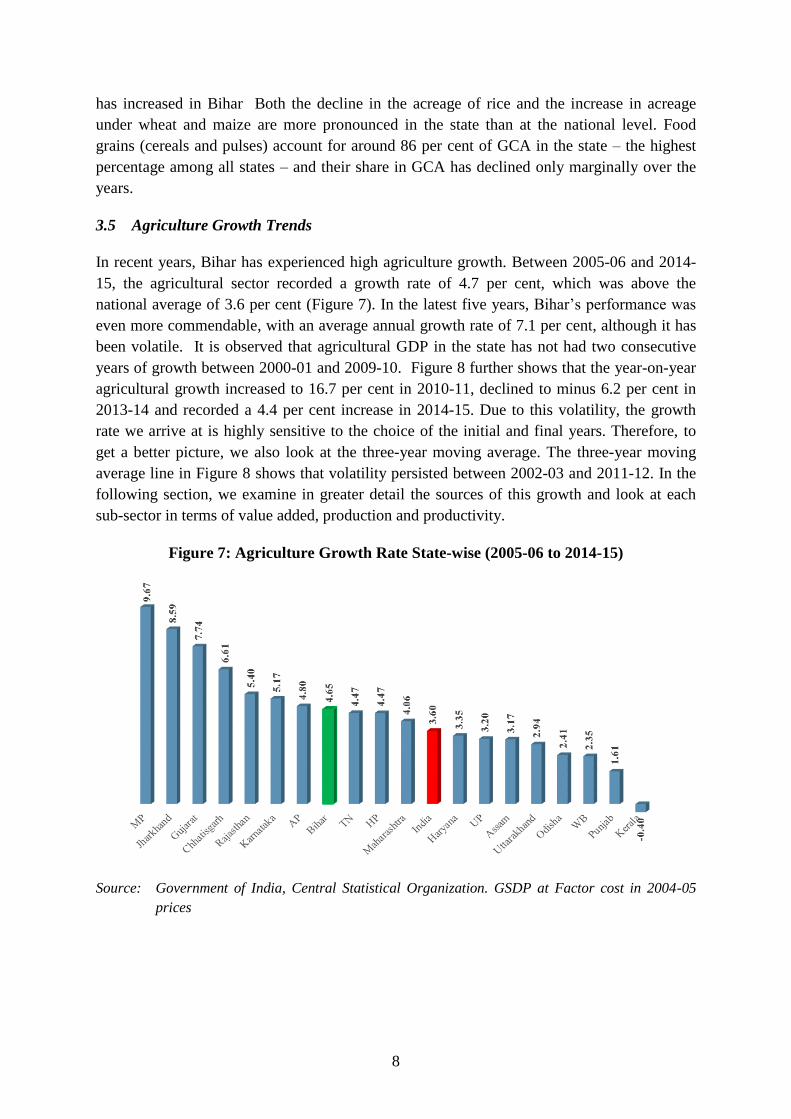
3.5 Agriculture Growth Trends
In recent years, Bihar has experienced high agriculture growth. Between 2005-06 and 2014-
15, the agricultural sector recorded a growth rate of 4.7 per cent, which was above the
national average of 3.6 per cent (Figure 7). In the latest five years, Bihar’s performance was
even more commendable, with an average annual growth rate of 7.1 per cent, although it has
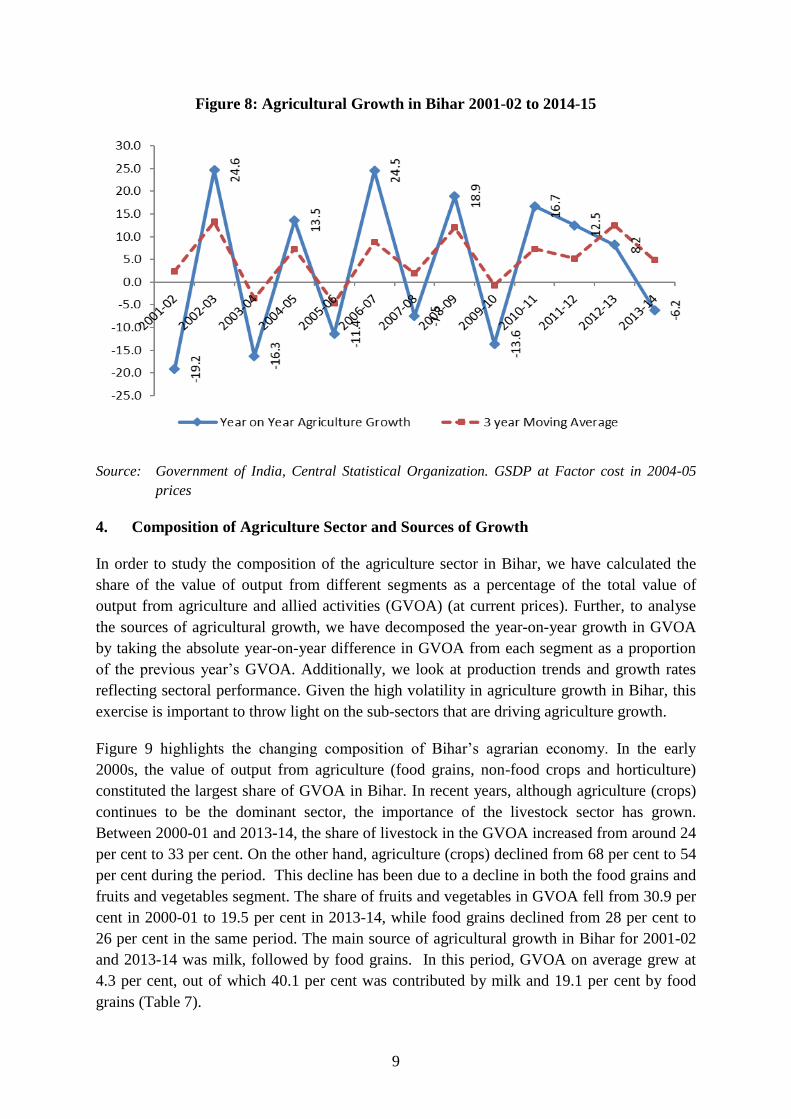
been volatile. It is observed that agricultural GDP in the state has not had two consecutive
years of growth between 2000-01 and 2009-10. Figure 8 further shows that the year-on-year
agricultural growth increased to 16.7 per cent in 2010-11, declined to minus 6.2 per cent in
2013-14 and recorded a 4.4 per cent increase in 2014-15. Due to this volatility, the growth
rate we arrive at is highly sensitive to the choice of the initial and final years. Therefore, to
get a better picture, we also look at the three-year moving average. The three-year moving
average line in Figure 8 shows that volatility persisted between 2002-03 and 2011-12. In the
following section, we examine in greater detail the sources of this growth and look at each
sub-sector in terms of value added, production and productivity.
Figure 7: Agriculture Growth Rate State-wise (2005-06 to 2014-15)
Source: Government of India, Central Statistical Organization. GSDP at Factor cost in 2004-05
prices
9
Figure 8: Agricultural Growth in Bihar 2001-02 to 2014-15
Source: Government of India, Central Statistical Organization. GSDP at Factor cost in 2004-05
prices
4. Composition of Agriculture Sector and Sources of Growth
In order to study the composition of the agriculture sector in Bihar, we have calculated the
share of the value of output from different segments as a percentage of the total value of
output from agriculture and allied activities (GVOA) (at current prices). Further, to analyse
the sources of agricultural growth, we have decomposed the year-on-year growth in GVOA
by taking the absolute year-on-year difference in GVOA from each segment as a proportion
of the previous year’s GVOA. Additionally, we look at production trends and growth rates
reflecting sectoral performance. Given the high volatility in agriculture growth in Bihar, this
exercise is important to throw light on the sub-sectors that are driving agriculture growth.
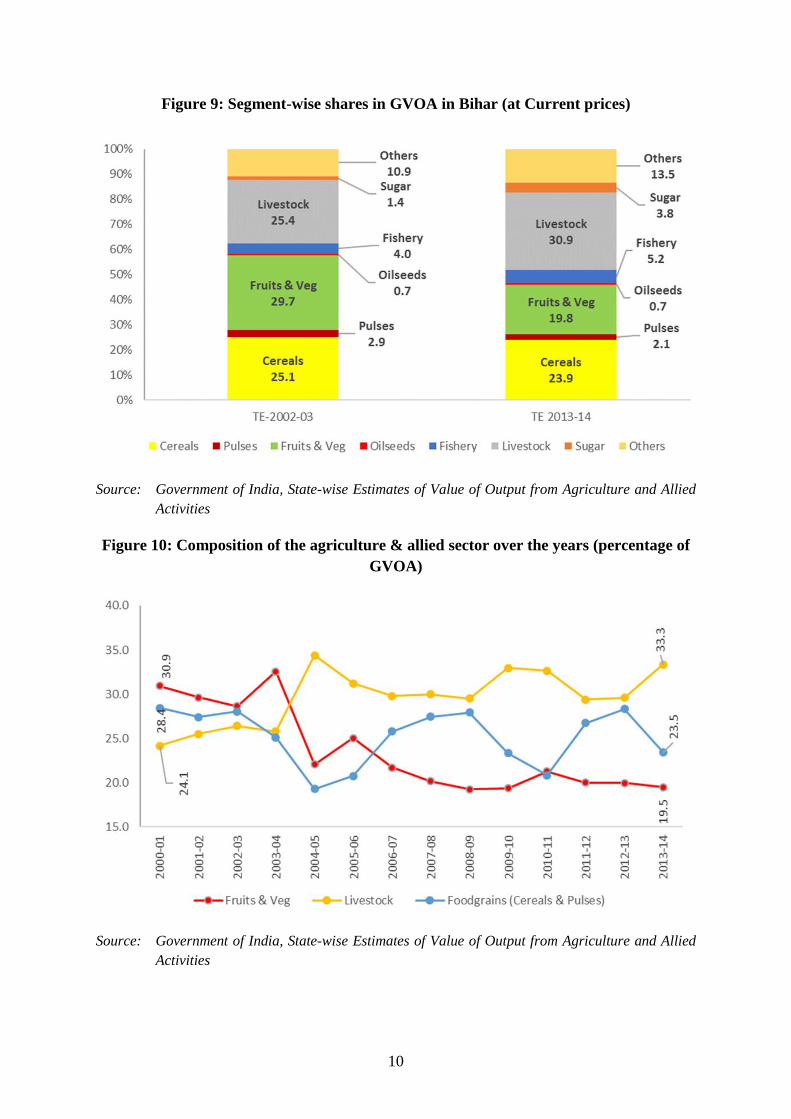
Figure 9 highlights the changing composition of Bihar’s agrarian economy. In the early
2000s, the value of output from agriculture (food grains, non-food crops and horticulture)
constituted the largest share of GVOA in Bihar. In recent years, although agriculture (crops)
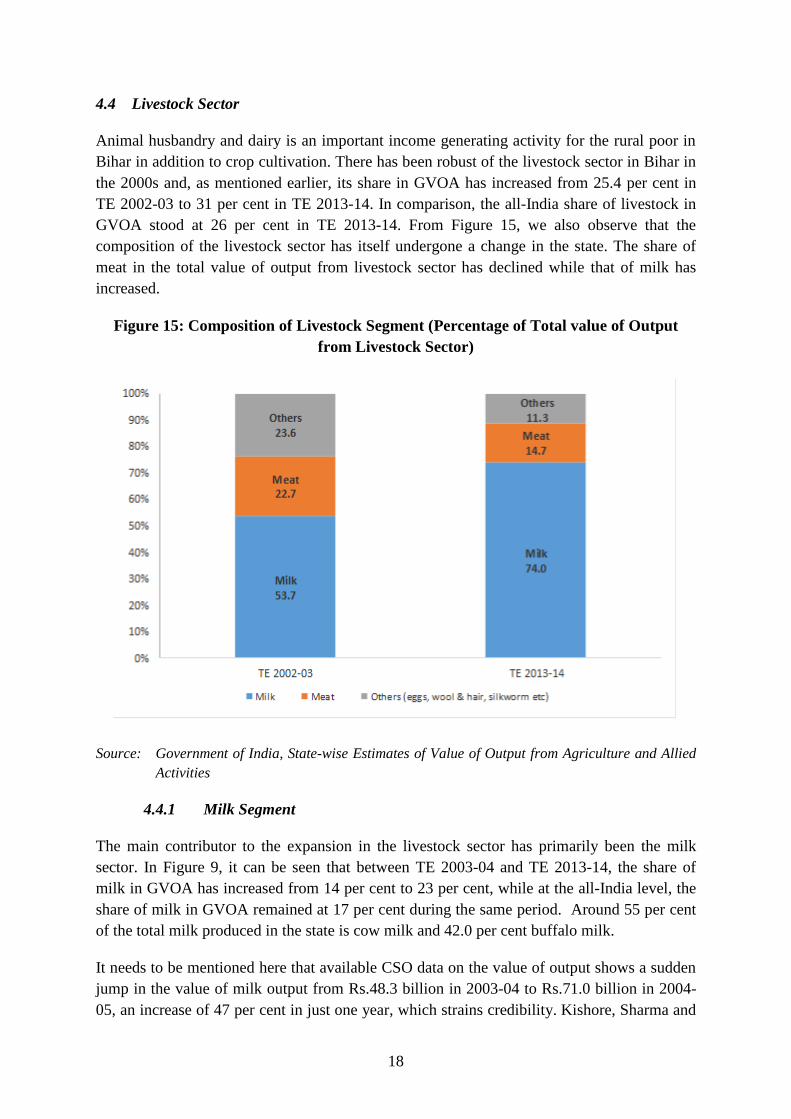
continues to be the dominant sector, the importance of the livestock sector has grown.
Between 2000-01 and 2013-14, the share of livestock in the GVOA increased from around 24
per cent to 33 per cent. On the other hand, agriculture (crops) declined from 68 per cent to 54
per cent during the period. This decline has been due to a decline in both the food grains and
fruits and vegetables segment. The share of fruits and vegetables in GVOA fell from 30.9 per
cent in 2000-01 to 19.5 per cent in 2013-14, while food grains declined from 28 per cent to
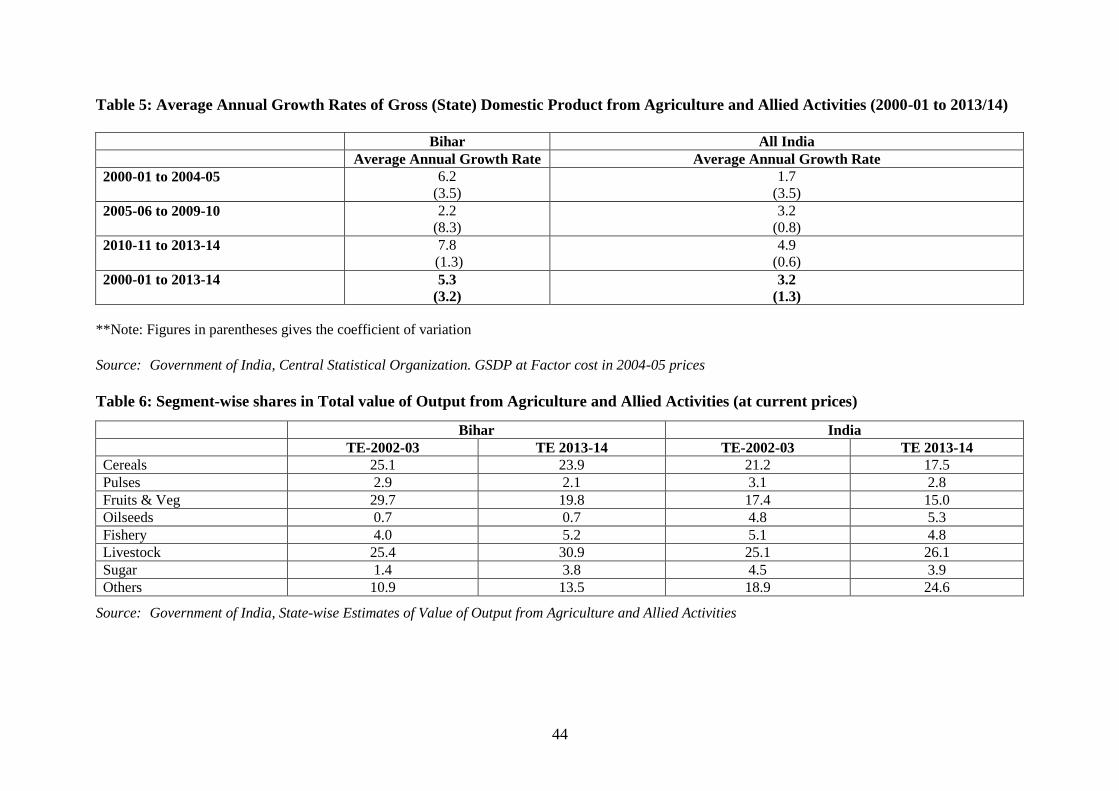
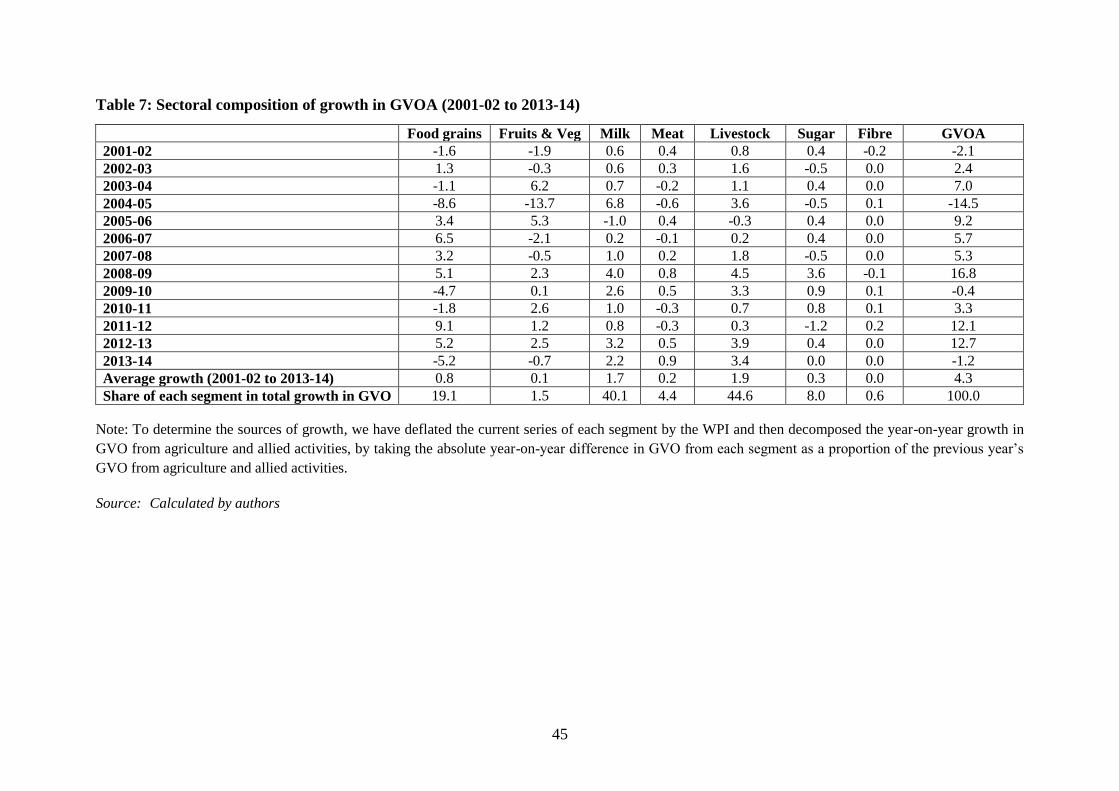
26 per cent in the same period. The main source of agricultural growth in Bihar for 2001-02
and 2013-14 was milk, followed by food grains. In this period, GVOA on average grew at
4.3 per cent, out of which 40.1 per cent was contributed by milk and 19.1 per cent by food
grains (Table 7).
10
Figure 9: Segment-wise shares in GVOA in Bihar (at Current prices)
Source: Government of India, State-wise Estimates of Value of Output from Agriculture and Allied
Activities
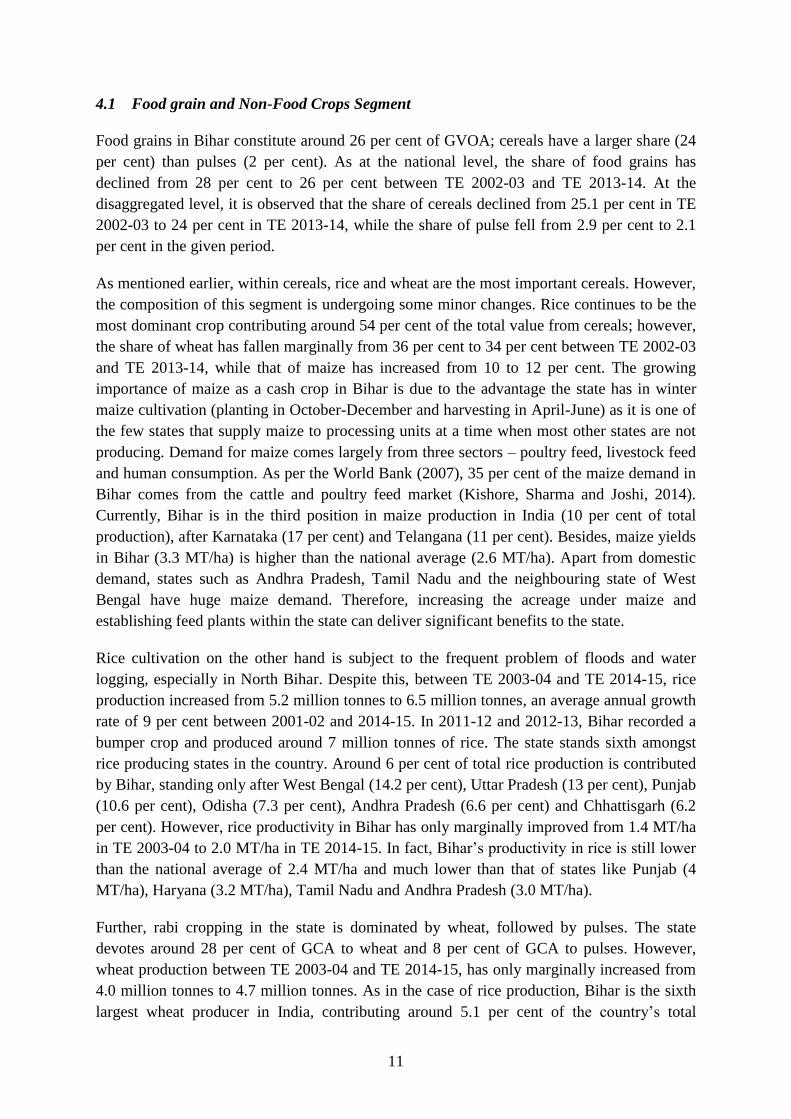
Figure 10: Composition of the agriculture & allied sector over the years (percentage of
GVOA)
Source: Government of India, State-wise Estimates of Value of Output from Agriculture and Allied
Activities
11
4.1 Food grain and Non-Food Crops Segment
Food grains in Bihar constitute around 26 per cent of GVOA; cereals have a larger share (24
per cent) than pulses (2 per cent). As at the national level, the share of food grains has
declined from 28 per cent to 26 per cent between TE 2002-03 and TE 2013-14. At the
disaggregated level, it is observed that the share of cereals declined from 25.1 per cent in TE
2002-03 to 24 per cent in TE 2013-14, while the share of pulse fell from 2.9 per cent to 2.1
per cent in the given period.
As mentioned earlier, within cereals, rice and wheat are the most important cereals. However,
the composition of this segment is undergoing some minor changes. Rice continues to be the
most dominant crop contributing around 54 per cent of the total value from cereals; however,
the share of wheat has fallen marginally from 36 per cent to 34 per cent between TE 2002-03
and TE 2013-14, while that of maize has increased from 10 to 12 per cent. The growing
importance of maize as a cash crop in Bihar is due to the advantage the state has in winter
maize cultivation (planting in October-December and harvesting in April-June) as it is one of
the few states that supply maize to processing units at a time when most other states are not
producing. Demand for maize comes largely from three sectors – poultry feed, livestock feed
and human consumption. As per the World Bank (2007), 35 per cent of the maize demand in
Bihar comes from the cattle and poultry feed market (Kishore, Sharma and Joshi, 2014).
Currently, Bihar is in the third position in maize production in India (10 per cent of total
production), after Karnataka (17 per cent) and Telangana (11 per cent). Besides, maize yields
in Bihar (3.3 MT/ha) is higher than the national average (2.6 MT/ha). Apart from domestic
demand, states such as Andhra Pradesh, Tamil Nadu and the neighbouring state of West
Bengal have huge maize demand. Therefore, increasing the acreage under maize and
establishing feed plants within the state can deliver significant benefits to the state.
Rice cultivation on the other hand is subject to the frequent problem of floods and water
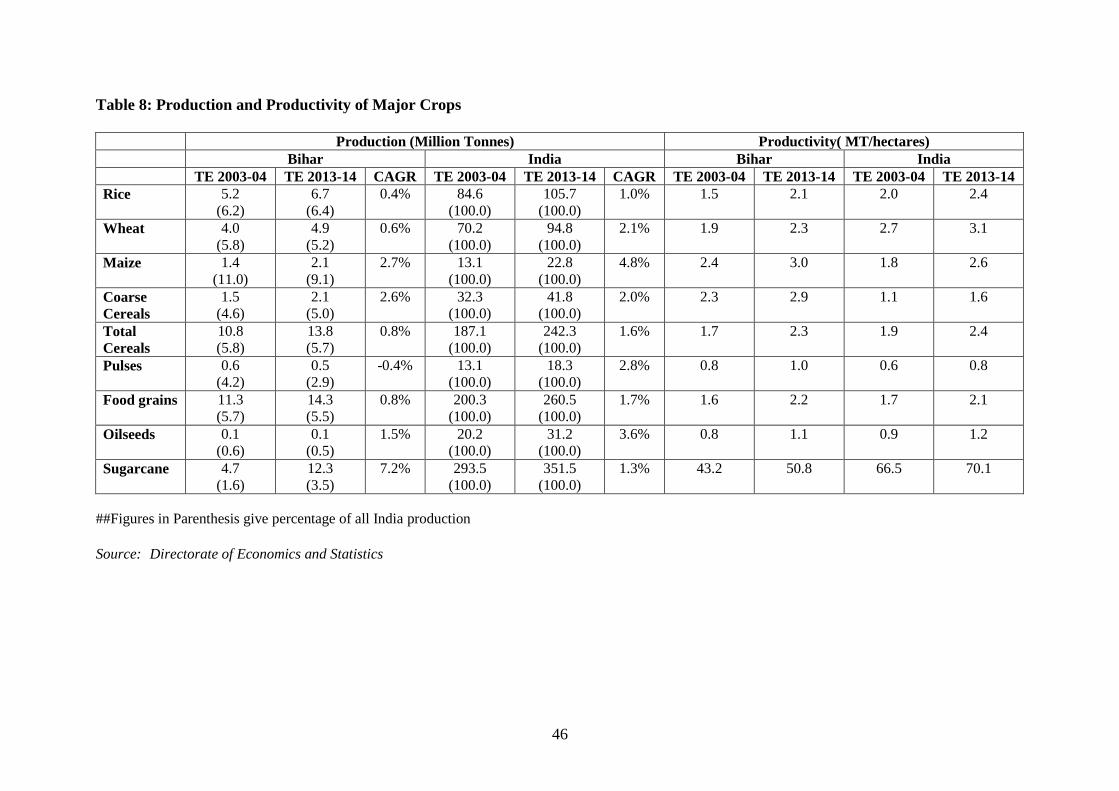
logging, especially in North Bihar. Despite this, between TE 2003-04 and TE 2014-15, rice
production increased from 5.2 million tonnes to 6.5 million tonnes, an average annual growth
rate of 9 per cent between 2001-02 and 2014-15. In 2011-12 and 2012-13, Bihar recorded a
bumper crop and produced around 7 million tonnes of rice. The state stands sixth amongst
rice producing states in the country. Around 6 per cent of total rice production is contributed
by Bihar, standing only after West Bengal (14.2 per cent), Uttar Pradesh (13 per cent), Punjab
(10.6 per cent), Odisha (7.3 per cent), Andhra Pradesh (6.6 per cent) and Chhattisgarh (6.2
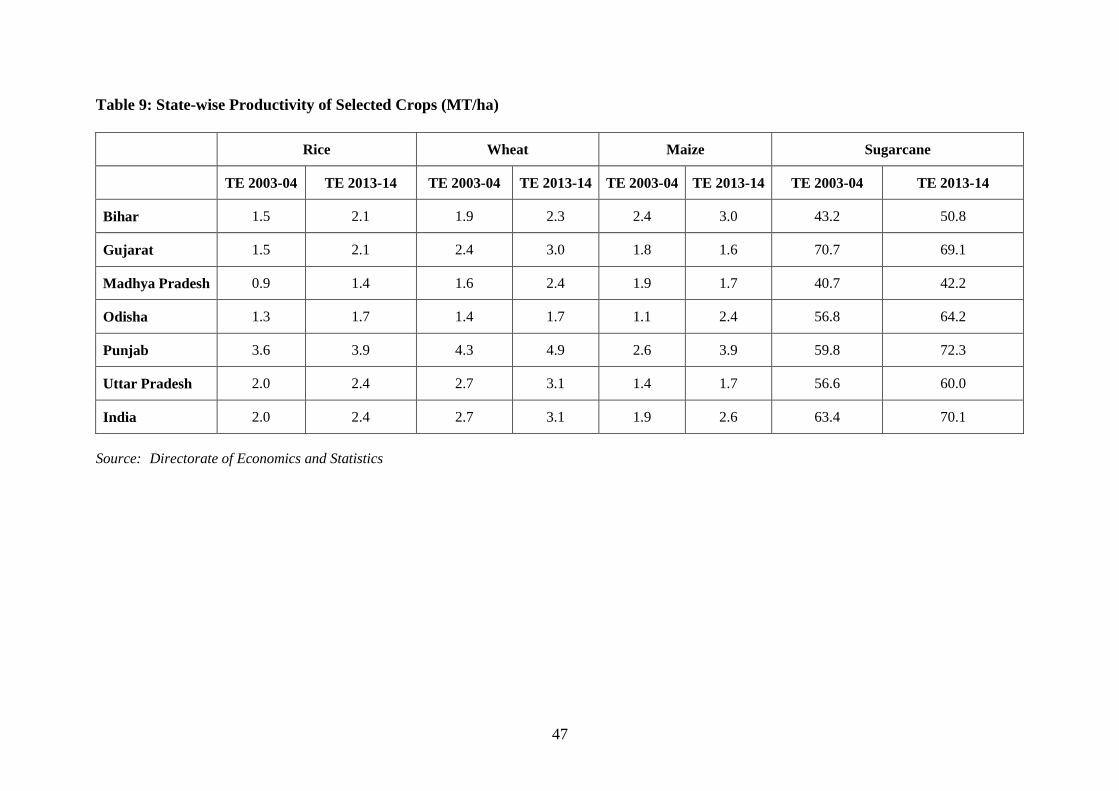
per cent). However, rice productivity in Bihar has only marginally improved from 1.4 MT/ha
in TE 2003-04 to 2.0 MT/ha in TE 2014-15. In fact, Bihar’s productivity in rice is still lower
than the national average of 2.4 MT/ha and much lower than that of states like Punjab (4
MT/ha), Haryana (3.2 MT/ha), Tamil Nadu and Andhra Pradesh (3.0 MT/ha).
Further, rabi cropping in the state is dominated by wheat, followed by pulses. The state
devotes around 28 per cent of GCA to wheat and 8 per cent of GCA to pulses. However,
wheat production between TE 2003-04 and TE 2014-15, has only marginally increased from
4.0 million tonnes to 4.7 million tonnes. As in the case of rice production, Bihar is the sixth
largest wheat producer in India, contributing around 5.1 per cent of the country’s total
12
production, after Uttar Pradesh (30 per cent), Punjab (18 per cent), Madhya Pradesh (16 per
cent), Haryana (12 per cent) and Rajasthan (10 per cent). Wheat yields in Bihar (2.2 MT/ha)
are lower than the national average (3 MT/ha) and much lower than in states like Punjab (4.7
MT/ha), Haryana (4.3 MT/ha) and Rajasthan, Gujarat, Uttar Pradesh (3 MT/ha). One of the
factors that have kept wheat productivity low is inappropriate sowing time. The
recommended sowing time for wheat in Bihar is November 19-25, when kharif paddy is still
in the field in much of the state (due to delayed sowing in July and August). A one-month
delay in sowing of wheat reduces its productivity by more than 50 per cent (Singh et al,
2001).
A study by Fujita (2012) emphasises that low productivity of rice and wheat cultivation in
Bihar is mainly because of limited availability of improved varieties of cereals (especially
rice). Based on a field survey in Madhepura District, it was observed that rice farmers mainly
used local rice varieties, although several hybrid rice varieties developed by private
companies were also being used on a smaller scale. The study argues that high yielding
varieties (HYVs) of rice such as Sorna, MTU1001 (released by the state government in 1997)
and Rajendra Mansuri (released in 2004), were not disseminated in the study area because of
the high water requirement of these varieties and high cost of irrigation, which made these
varieties unprofitable for farmers. On the other hand, hybrid rice varieties required less water
than HYVs, and this was the major reason for the diffusion of hybrid rice in certain regions of
Bihar. However, despite the potential of hybrid rice to give a yield 2 to 3 times higher than
traditional local varieties, the adoption was not as fast as one would expect. The reason for
this is the higher price of hybrid seed, which has to be purchased every year as compared to
traditional varieties and because they require more intensive use of inputs such as chemical
fertilisers and insecticides. Additionally, the market price of hybrid rice was around 30 to 40
per cent lower than local varieties, mainly because of the inferior taste. Moreover, frequent
droughts and floods have made farmers reluctant to adopt new technologies. Although there
has been rapid expansion of tube wells in the state in the recent past (details discussed later),
tube wells continue to run on diesel oil due to poor access to electricity for agriculture
purposes. This makes the water rate in Bihar very expensive (Fujita, 2012). The high water
rate along with low crop yields, arising from the non-availability of improved seeds, has
discouraged farmers from using more water for intensive cultivation. Both these reasons of
low adoption of improved varieties of cereals as well as backwardness in tube well irrigation
technology have kept yields of cereals low.
Pulses, on the other hand, contribute only around 7 per cent of GCA and 2 per cent of
GVOA. Further, pulses contribution in GCA and GVOA has been falling. Interestingly, in
recent years, Bihar has seen an increase in the acreage under and production of sugarcane.
Acreage under sugarcane increased from 1.4 per cent of gross cropped area in TE 2003-04 to
3.3 per cent in TE 2014-15. The production of sugarcane increased from 4.7 to 14 million
tonnes in the period 2001-02 to 2014-15. This is a positive trend as Bihar has potential in
sugarcane production, especially in north Bihar, which is climatically conducive for the crop.
Bihar has a long history of producing sugar, going back to 1840, when the Dutch set up the
first white sugar-manufacturing unit in north Bihar. Earlier, Uttar Pradesh and Bihar were the
13
leading states in sugar production, but over the last 50 or 60 years, they ceded leadership to
states like Maharashtra, and Tamil Nadu. A large number of sugar mills shut down due to
declining sugarcane production and competition with khandsari units. Currently, there are 28
sugar mills in the state, out of which 19 are closed and only nine are working, all in the
private sector. In 2011, two sugar mills, which were earlier under the Bihar Sugar
Corporation, were handed over to Hindustan Petroleum Corporation Ltd (HPCL). In order to
give a thrust to the sugar industry in the state, the Government of Bihar has introduced
several concessions and rebates, which include reduction in VAT on ethanol and denatured
spirit from 12.5 per cent to 4.0 per cent and abolition of literage fees on ethanol and liquor
(Economic Survey 2014-15). The government supports sugarcane farmers by giving them a
subsidy of Rs.135 per quintal on the purchase of certified sugarcane seeds of improved
variety, based on a declaration by sugar mills.2 Incentives are also given for inter-cropping
with sugarcane and for the use of diesel for irrigating the crop. Despite these efforts and good
soil quality, Bihar’s sugarcane yield is much lower (50.8 Mt/ha) than the national average
(70.1 MT/ha) (Table 8). This is because only 25-30 per cent of the area under sugarcane has
irrigation facility, and even irrigated areas receive only one or two waterings on average and
water is not available in canals during the months of April-June. Moreover, Bihar faces a
shortage of planting material of high-yielding varieties of sugarcane (Economic Survey of
Bihar 2014-15).
4.2 Fruits and Vegetables Segment
Figure 9 shows that the share of fruits and vegetables in GVOA has declined from 30 per cent
in TE 2002-03 to 20 per cent in TE 2013-14. However, in absolute terms, the value of output
from fruits and vegetables has increased from Rs.81.6 billion to Rs.172.4 billion in the same
period.
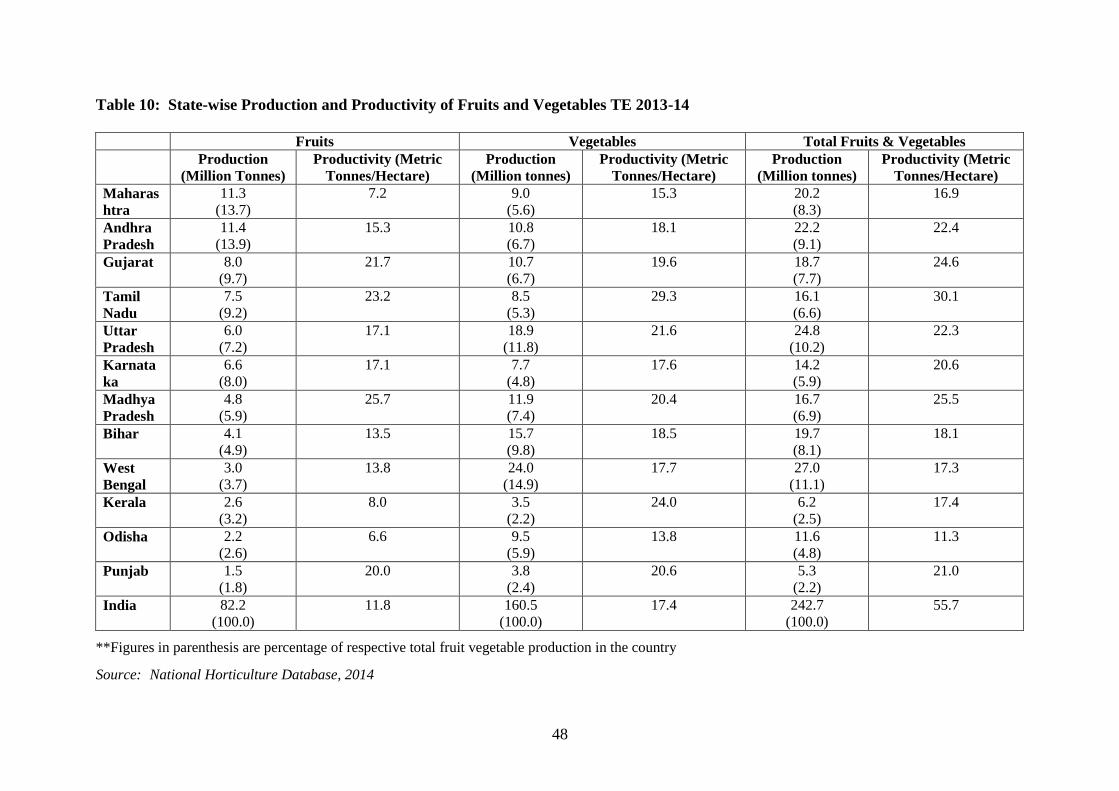
Within the fruits and vegetables segment, vegetables constitute the larger share. In terms of
acreage, the state devotes around 11 per cent of its gross cropped area to vegetable
production, which is way above the national average of 5.0 per cent. In TE 2013-14, Bihar
was the third largest vegetable producer (8.9 per cent), after West Bengal (14.9 per cent) and
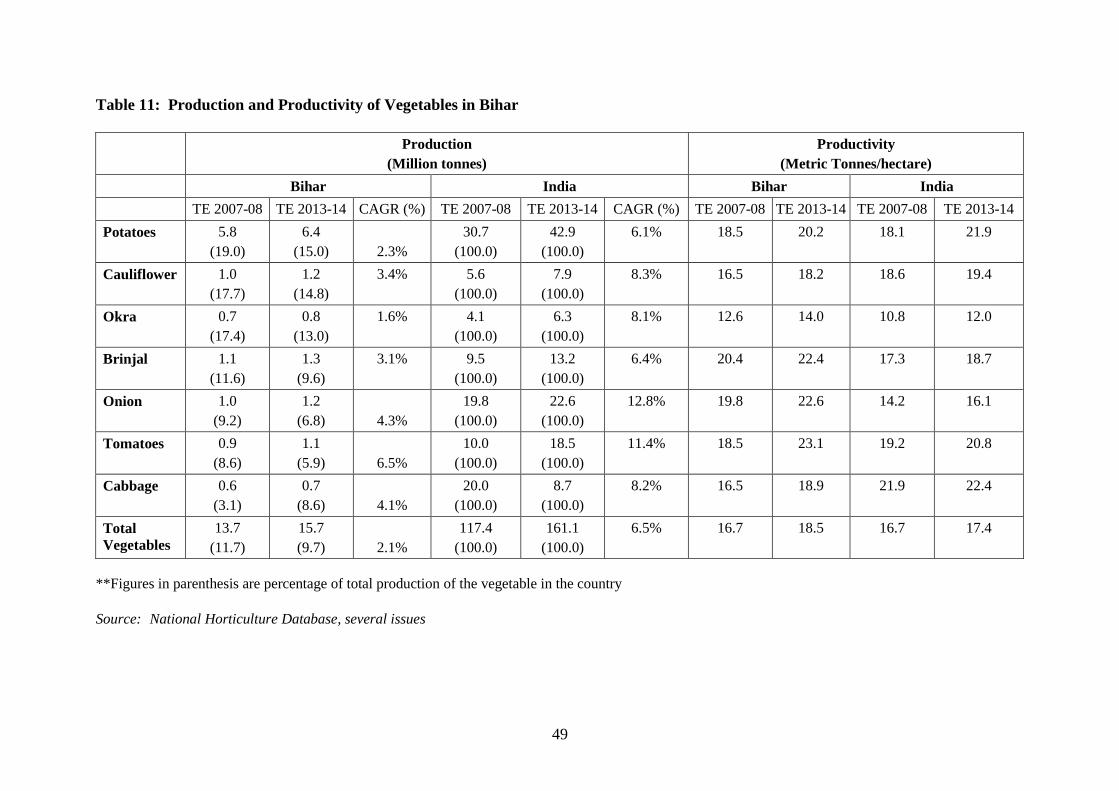
Uttar Pradesh (11.8 per cent). Potato is the most important vegetable grown in the state with
around 38 per cent of vegetable area dedicated to the crop. Apart from potato, the other main
vegetables grown in Bihar are cauliflower, okra, brinjal, onion, tomato and cabbage.
Bihar is the third largest producer of potatoes in the country after Uttar Pradesh3 and West
Bengal.4 In TE 2013-14, potato yield in Bihar was around 20.2 MT per hectare as compared
to the all-India l average of 21.9 MT per hectare. In comparison, Uttar Pradesh’s productivity
was 24.4 MT per hectares, West Bengal’s 25.9 MT per hectare and Gujarat’s 28.2 MT per
hectares, the highest productivity in potato cultivation in the country.
2 A farmer gets the benefit of this scheme for a maximum of 5 acres and once the farmer has availed of the
subsidy, he is not entitled to avail of the subsidy for the next 3 years 3 33 per cent of total potato production in the country 4 23.6 per cent of total potato production in the country
14
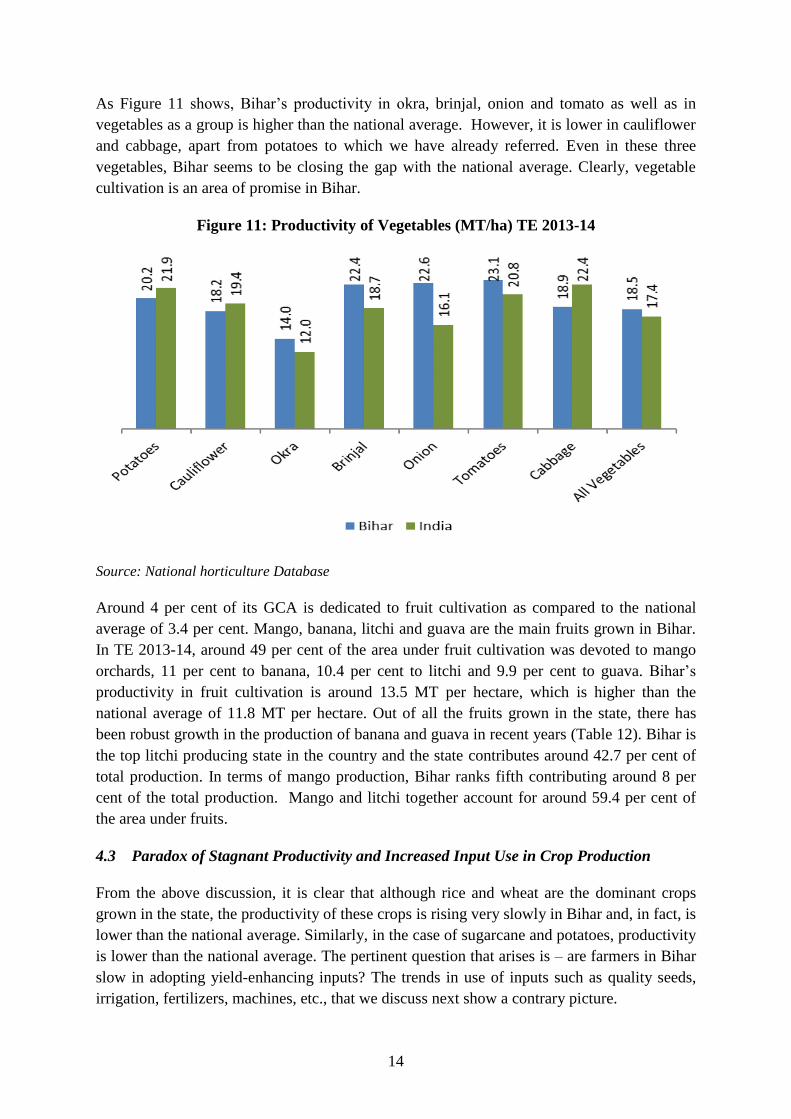
As Figure 11 shows, Bihar’s productivity in okra, brinjal, onion and tomato as well as in
vegetables as a group is higher than the national average. However, it is lower in cauliflower
and cabbage, apart from potatoes to which we have already referred. Even in these three
vegetables, Bihar seems to be closing the gap with the national average. Clearly, vegetable
cultivation is an area of promise in Bihar.
Figure 11: Productivity of Vegetables (MT/ha) TE 2013-14
Source: National horticulture Database
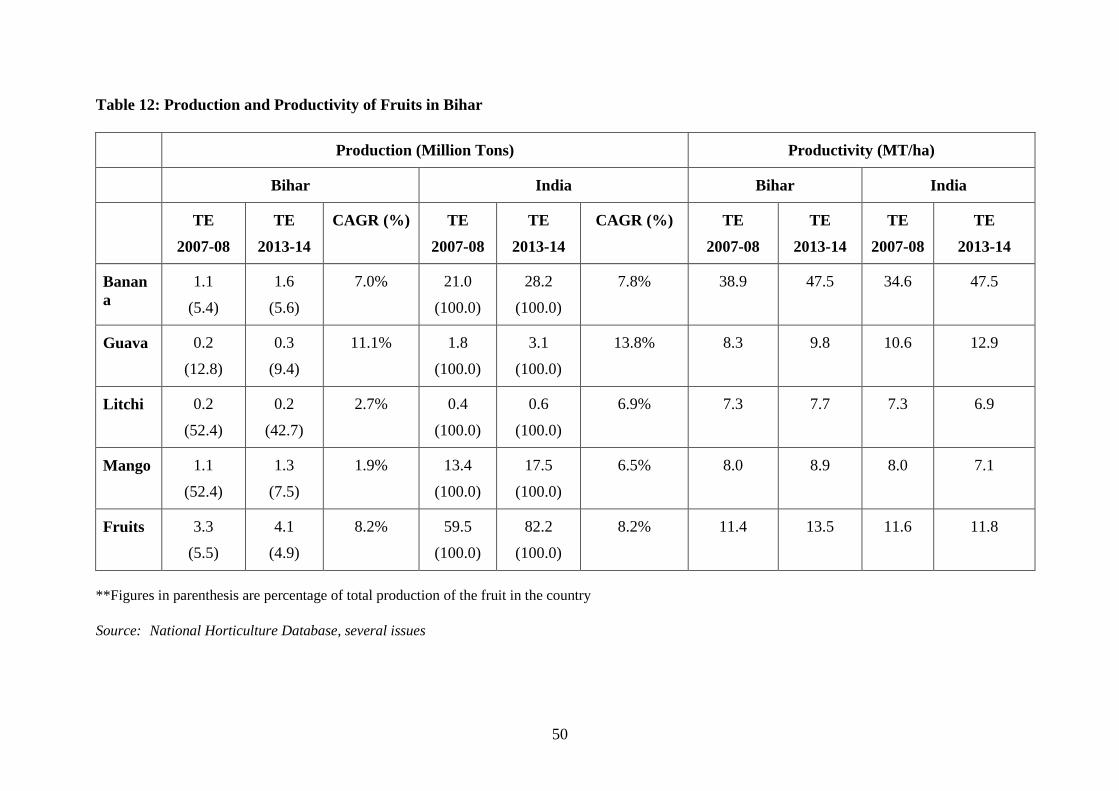
Around 4 per cent of its GCA is dedicated to fruit cultivation as compared to the national
average of 3.4 per cent. Mango, banana, litchi and guava are the main fruits grown in Bihar.
In TE 2013-14, around 49 per cent of the area under fruit cultivation was devoted to mango
orchards, 11 per cent to banana, 10.4 per cent to litchi and 9.9 per cent to guava. Bihar’s
productivity in fruit cultivation is around 13.5 MT per hectare, which is higher than the
national average of 11.8 MT per hectare. Out of all the fruits grown in the state, there has
been robust growth in the production of banana and guava in recent years (Table 12). Bihar is
the top litchi producing state in the country and the state contributes around 42.7 per cent of
total production. In terms of mango production, Bihar ranks fifth contributing around 8 per
cent of the total production. Mango and litchi together account for around 59.4 per cent of
the area under fruits.
4.3 Paradox of Stagnant Productivity and Increased Input Use in Crop Production
From the above discussion, it is clear that although rice and wheat are the dominant crops
grown in the state, the productivity of these crops is rising very slowly in Bihar and, in fact, is
lower than the national average. Similarly, in the case of sugarcane and potatoes, productivity
is lower than the national average. The pertinent question that arises is – are farmers in Bihar
slow in adopting yield-enhancing inputs? The trends in use of inputs such as quality seeds,
irrigation, fertilizers, machines, etc., that we discuss next show a contrary picture.
15
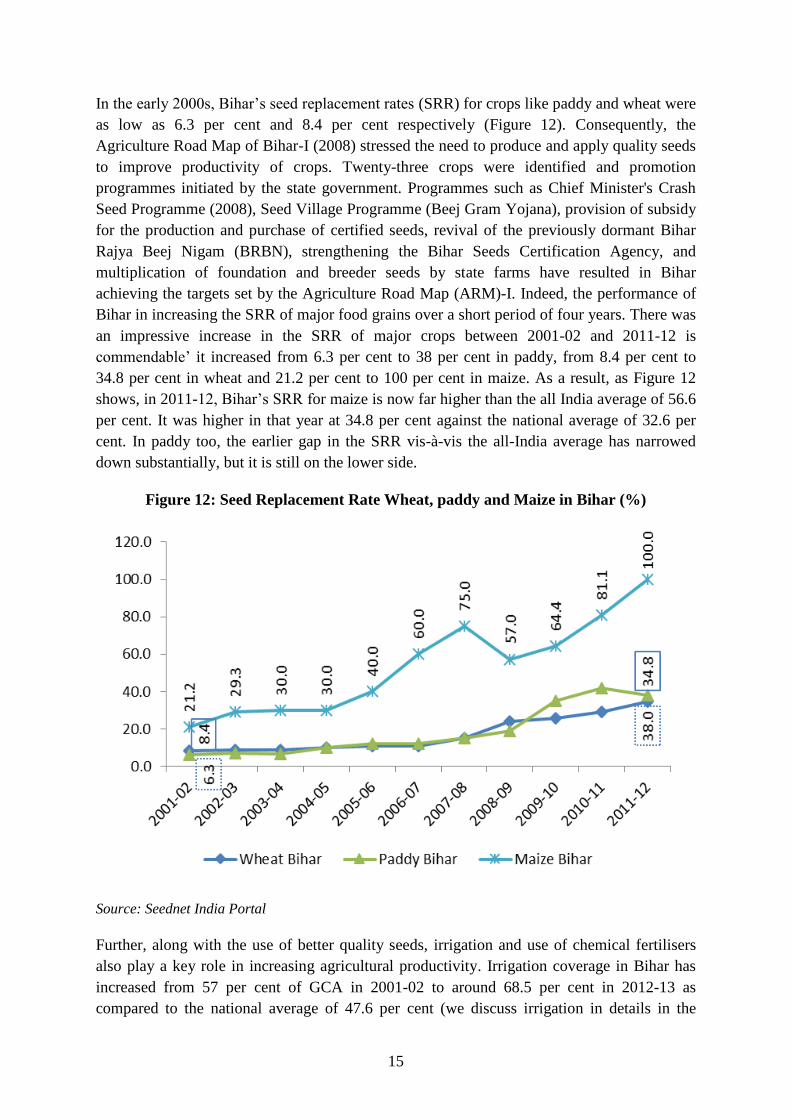
In the early 2000s, Bihar’s seed replacement rates (SRR) for crops like paddy and wheat were
as low as 6.3 per cent and 8.4 per cent respectively (Figure 12). Consequently, the
Agriculture Road Map of Bihar-I (2008) stressed the need to produce and apply quality seeds
to improve productivity of crops. Twenty-three crops were identified and promotion
programmes initiated by the state government. Programmes such as Chief Minister's Crash
Seed Programme (2008), Seed Village Programme (Beej Gram Yojana), provision of subsidy
for the production and purchase of certified seeds, revival of the previously dormant Bihar
Rajya Beej Nigam (BRBN), strengthening the Bihar Seeds Certification Agency, and
multiplication of foundation and breeder seeds by state farms have resulted in Bihar
achieving the targets set by the Agriculture Road Map (ARM)-I. Indeed, the performance of
Bihar in increasing the SRR of major food grains over a short period of four years. There was
an impressive increase in the SRR of major crops between 2001-02 and 2011-12 is
commendable’ it increased from 6.3 per cent to 38 per cent in paddy, from 8.4 per cent to
34.8 per cent in wheat and 21.2 per cent to 100 per cent in maize. As a result, as Figure 12
shows, in 2011-12, Bihar’s SRR for maize is now far higher than the all India average of 56.6
per cent. It was higher in that year at 34.8 per cent against the national average of 32.6 per
cent. In paddy too, the earlier gap in the SRR vis-à-vis the all-India average has narrowed
down substantially, but it is still on the lower side.
Figure 12: Seed Replacement Rate Wheat, paddy and Maize in Bihar (%)
Source: Seednet India Portal
Further, along with the use of better quality seeds, irrigation and use of chemical fertilisers
also play a key role in increasing agricultural productivity. Irrigation coverage in Bihar has
increased from 57 per cent of GCA in 2001-02 to around 68.5 per cent in 2012-13 as
compared to the national average of 47.6 per cent (we discuss irrigation in details in the
16
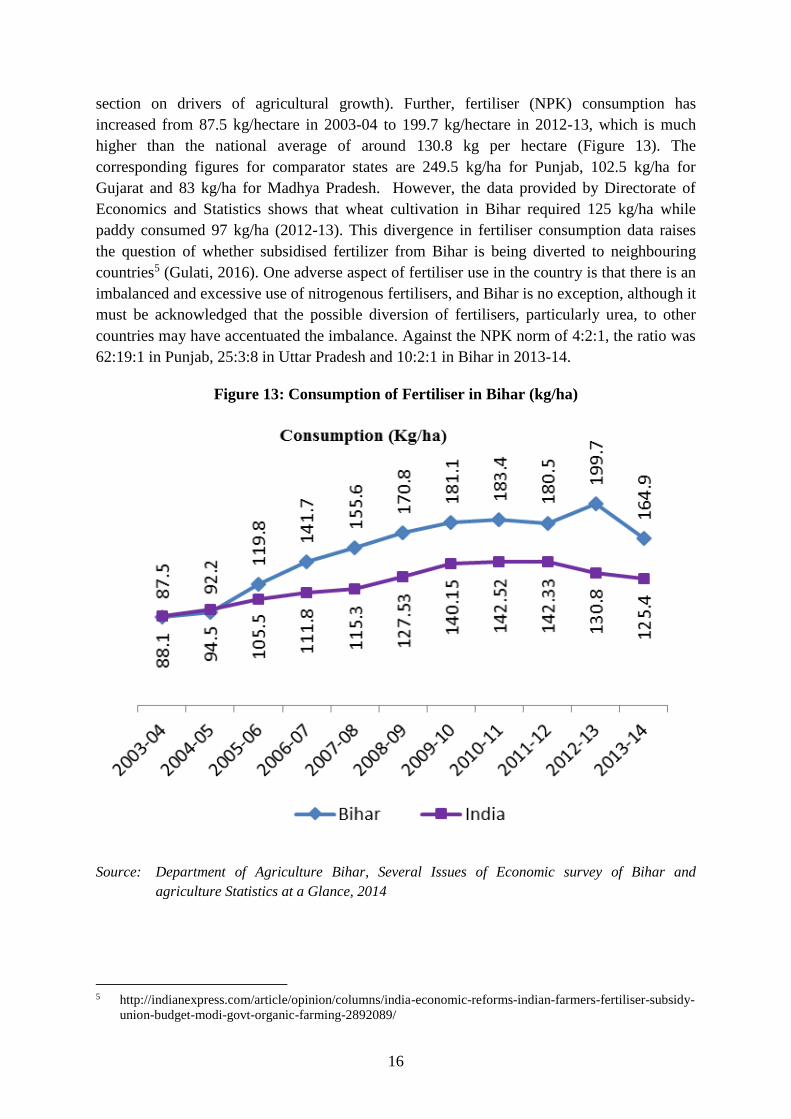
section on drivers of agricultural growth). Further, fertiliser (NPK) consumption has
increased from 87.5 kg/hectare in 2003-04 to 199.7 kg/hectare in 2012-13, which is much
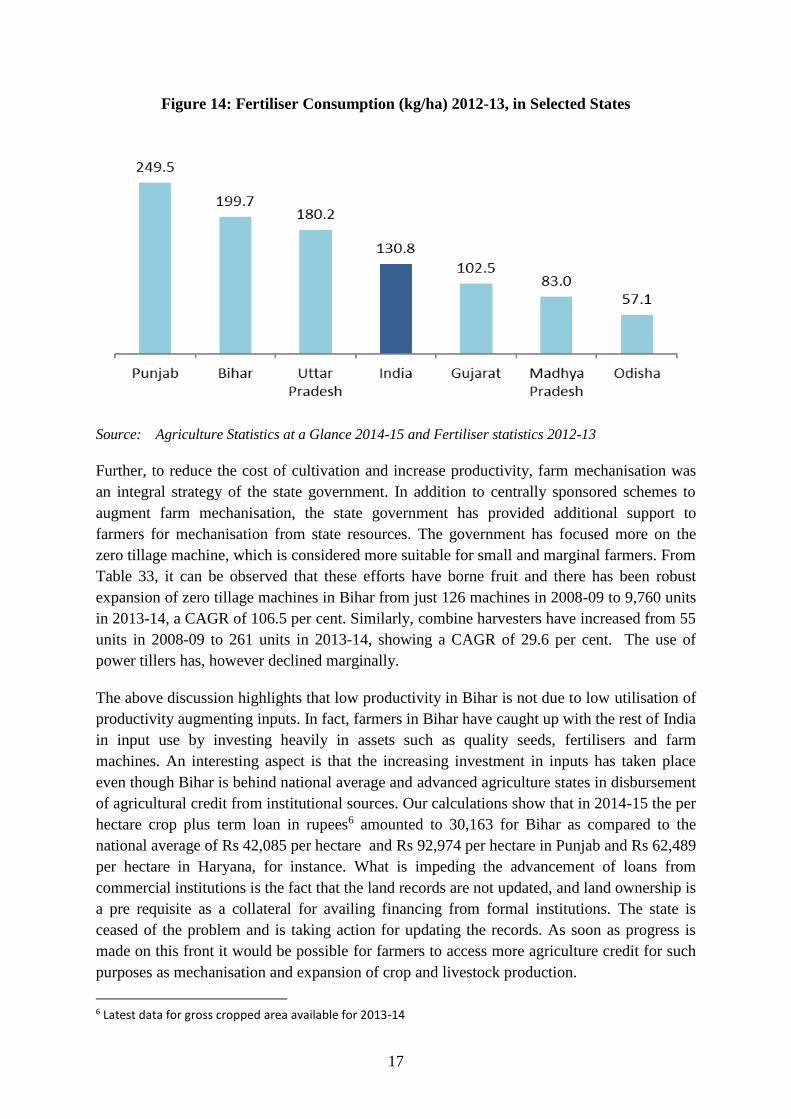
higher than the national average of around 130.8 kg per hectare (Figure 13). The
corresponding figures for comparator states are 249.5 kg/ha for Punjab, 102.5 kg/ha for
Gujarat and 83 kg/ha for Madhya Pradesh. However, the data provided by Directorate of
Economics and Statistics shows that wheat cultivation in Bihar required 125 kg/ha while
paddy consumed 97 kg/ha (2012-13). This divergence in fertiliser consumption data raises
the question of whether subsidised fertilizer from Bihar is being diverted to neighbouring
countries5 (Gulati, 2016). One adverse aspect of fertiliser use in the country is that there is an
imbalanced and excessive use of nitrogenous fertilisers, and Bihar is no exception, although it
must be acknowledged that the possible diversion of fertilisers, particularly urea, to other
countries may have accentuated the imbalance. Against the NPK norm of 4:2:1, the ratio was
62:19:1 in Punjab, 25:3:8 in Uttar Pradesh and 10:2:1 in Bihar in 2013-14.
Figure 13: Consumption of Fertiliser in Bihar (kg/ha)
Source: Department of Agriculture Bihar, Several Issues of Economic survey of Bihar and
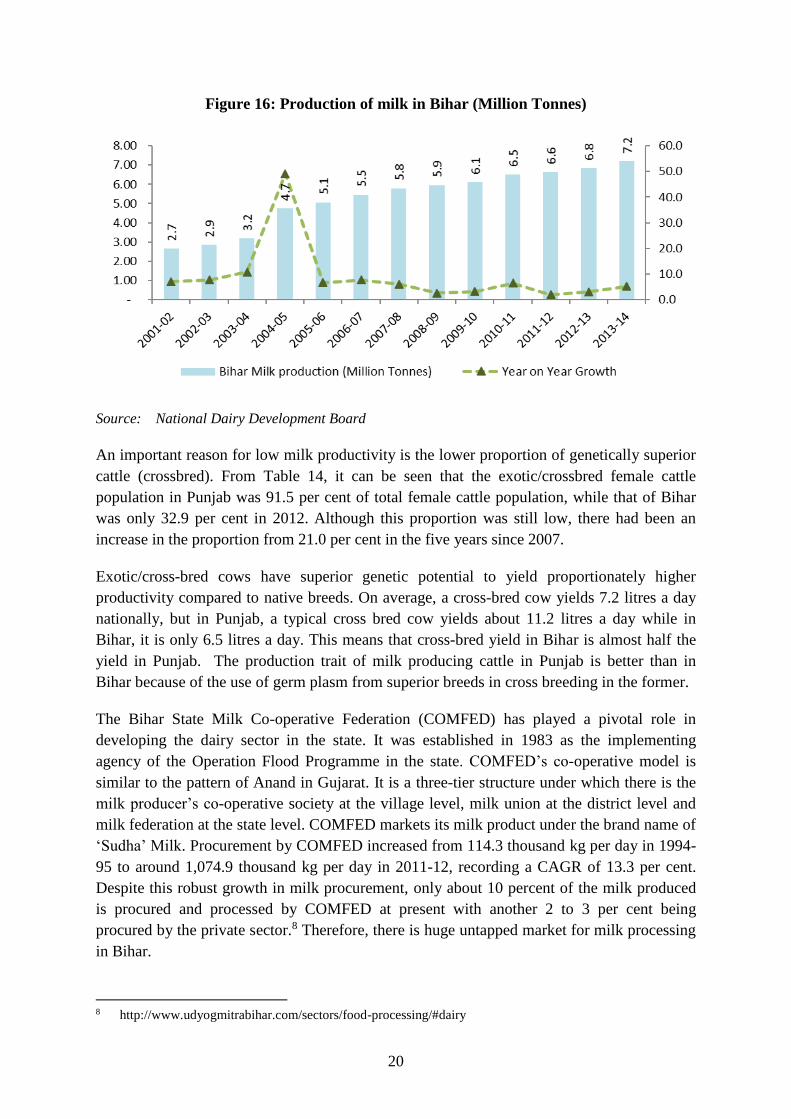
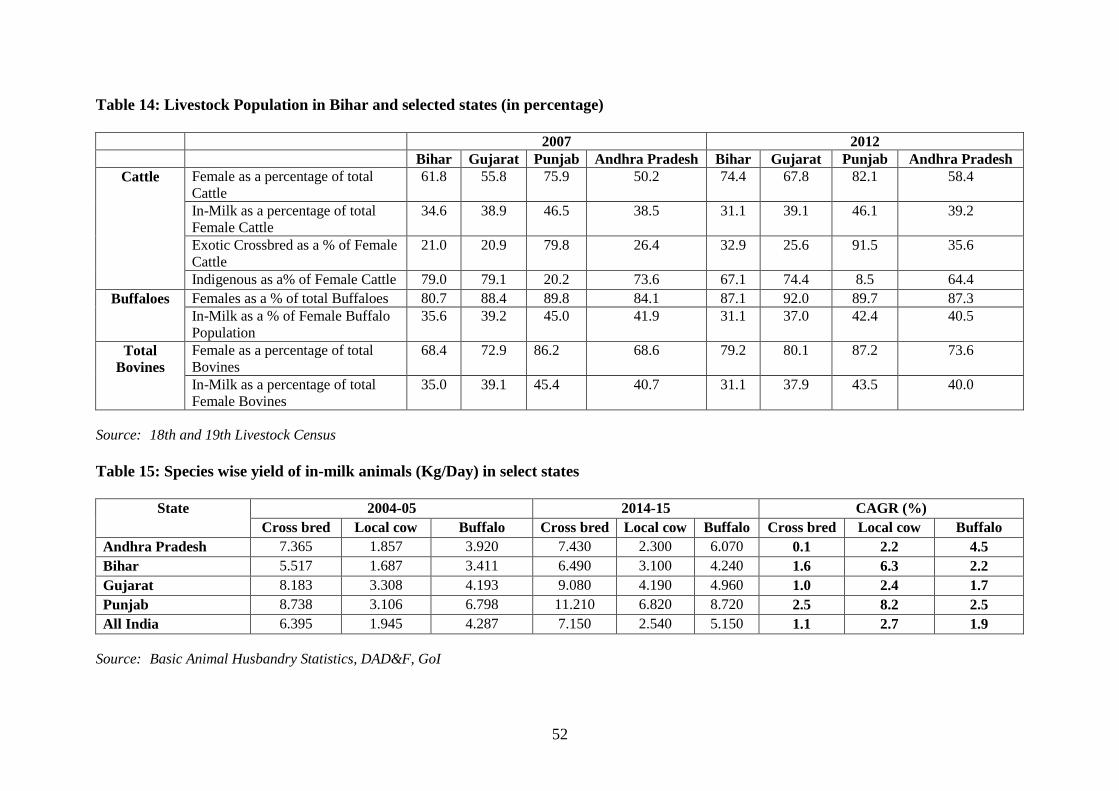
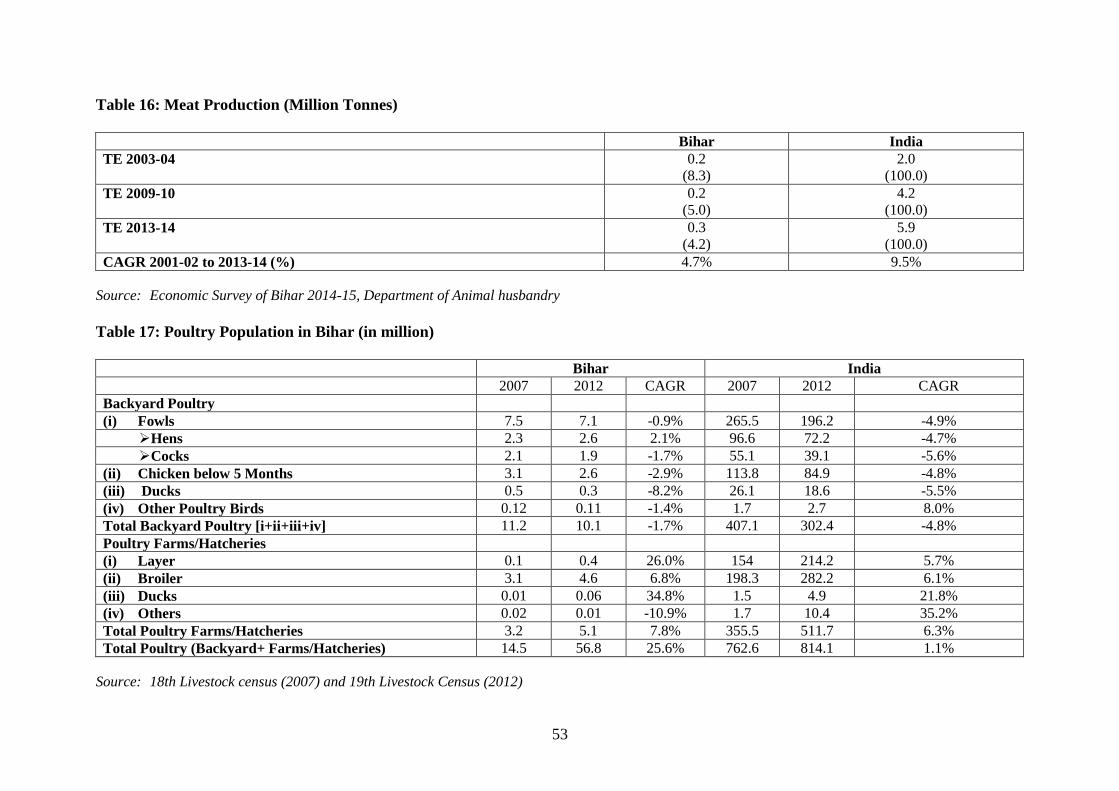
The meat sector constitutes around 5 per cent of GVOA in Bihar and its share has marginally
declined from 6 per cent in TE 2002-03. Meat production in the state recorded an increase of
4.7 per cent (CAGR) in the period 2001-02 to 2013-14, much lower than the national average
of 9.5 per cent growth (CAGR). As a result, Bihar’s share in all-India meat production has
fallen from 8.3 per cent in TE 2003-04 to 4.2 per cent in TE 2013-14 (Table 16). Currently,
Bihar is the eighth largest meat producing state after Uttar Pradesh, Andhra Pradesh, West
Bengal, Maharashtra, Tamil Nadu, Haryana and Kerala.
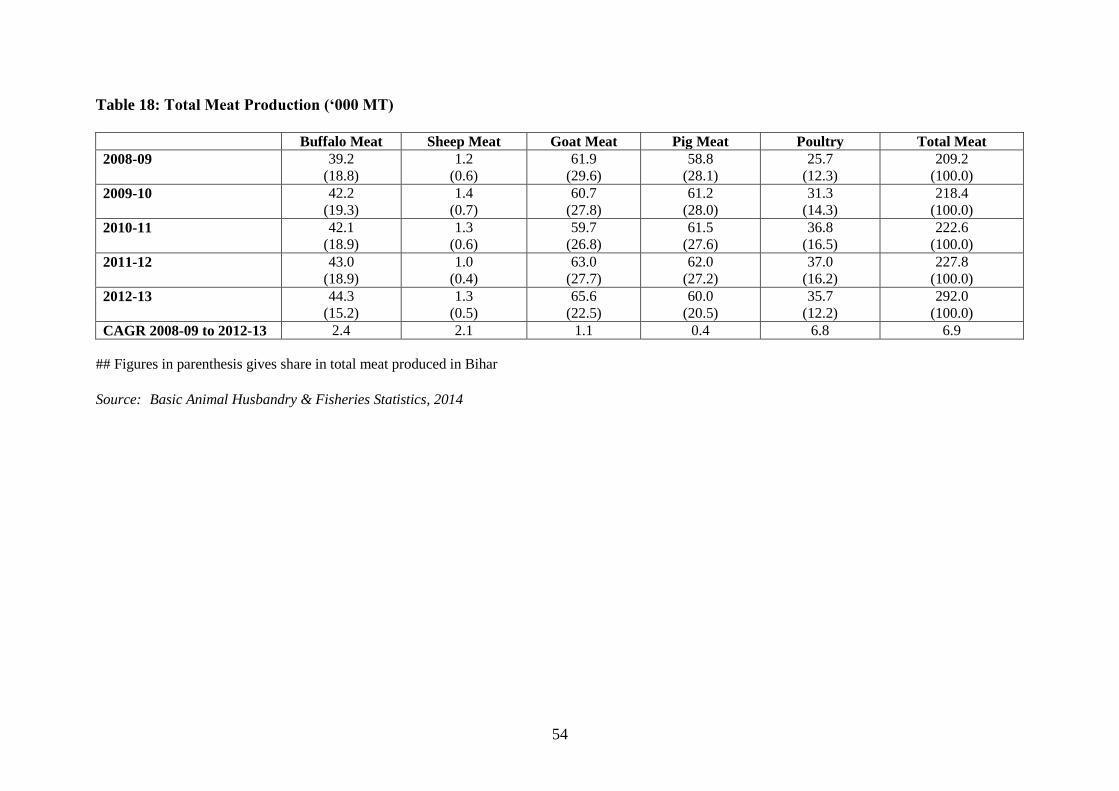
At a disaggregated level, mutton (22.5 per cent) constitutes the largest share in the total meat
production, followed by pork (20.5 per cent) and buffalo meat (15.2 per cent). Poultry’s
share in the total meat production is only 12.2 per cent (2012-13). However, between 2008-
09 and 2012-13, poultry has grown at the fastest rate as compared to other animal meats in
Bihar, due to the robust expansion of poultry farms and hatcheries as compared to backyard
poultry. As per the 19th Livestock Census (2012), Bihar’s backyard poultry shrank at the rate
of 1.7 per cent CAGR in the period 2007 and 2012. This is analogous to the national trend,
which shows a fall in backyard poultry, and an increase in farms and hatcheries. In Bihar, the
number of poultry birds in broiler farms increased from 3.1 million to 5.1 million in this
period, a CAGR of 7.8 per cent, as compared to the national average of 6.3 per cent. Bihar
has also recorded a robust expansion in duck population in duck farms (Table 17).
As mentioned above, in Bihar goat meat, pork and buffalo meat are the main types of meat
produced. In 2012-13, Bihar contributed 7.0 per cent of total mutton production in the
country, making it the fifth largest producer, while the top producers were West Bengal (25.7
per cent), Uttar Pradesh (19.5 per cent), Andhra Pradesh (9.3 per cent) and Maharashtra (7.5
per cent). In the same year, Bihar was the second largest producer of pork, contributing
around 13.2 per cent of total pig meat production in the country, after Uttar Pradesh (38.0 per
cent). In terms of buffalo meat production, Bihar ranks sixth (4.0 per cent) in the country
after Uttar Pradesh (46.8 per cent), Punjab (11.1 per cent), Andhra Pradesh (10.7 per cent),
Kerala (9.1 per cent) and Maharashtra (4.7 per cent).
An ambitious programme was envisaged in ARM-II to increase meat production through a
goat distribution programme, establishment of feed factories, establishment of modern
slaughter houses and distribution of chicks to poor families in the villages. However, none of
these schemes, except the distribution of chicks through the Jeevika programme, took off
because of shortage of funds.
4.5 Fishery
Bihar has rich aquatic resources, which includes about 3,200 km of rivers, 100,000 hectares
of chaurs and floodplains and wetlands, 9,000 hectares of oxbow lakes and mauns, 7,200
hectares of reservoirs and 6,900 hectares of ponds and tanks.9 However, the fishery segment
contributes only around 5.2 per cent of the total value of output from agriculture and allied 9 http://ahd.bih.nic.in/Docs/ICAR-Report-Fisheries-Dev-Bihar.pdf
22
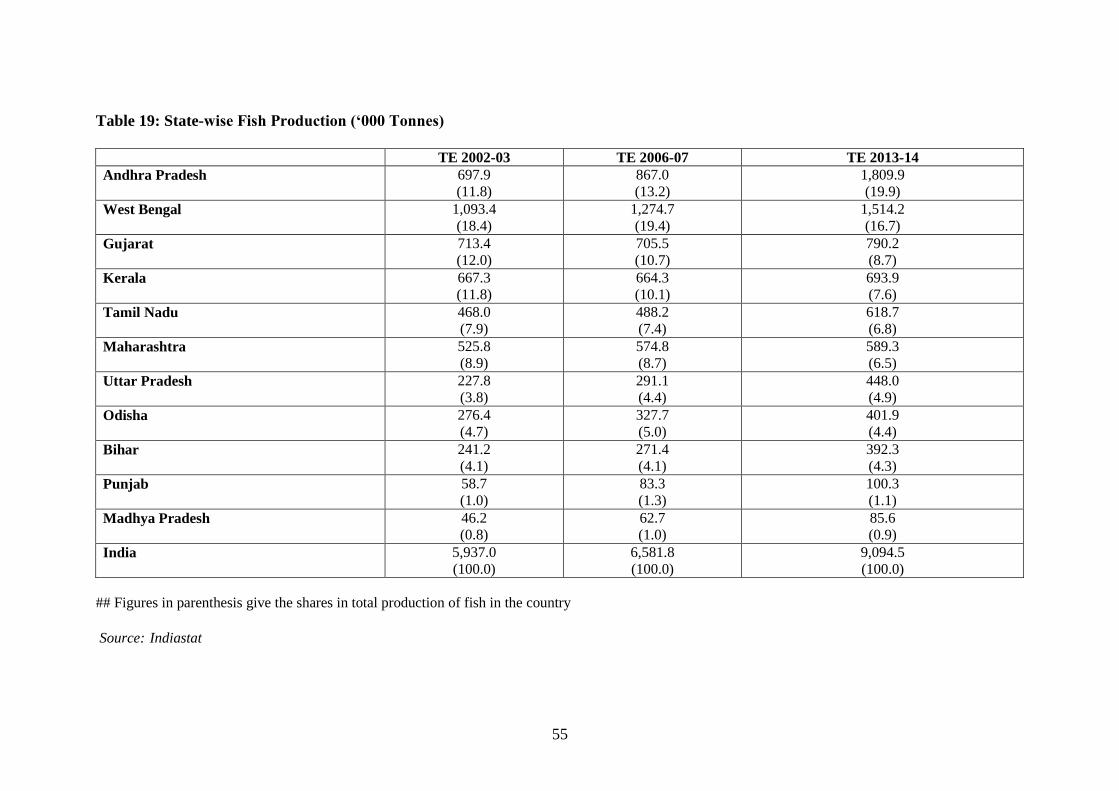
activities (TE 2013-14) and the supply of fish falls short of demand in the state. Currently,
Bihar is the ninth largest fish producing state. In evaluating Bihar’s rank among fish
producing states, we have to take into account the fact that Bihar is a non-maritime state and
fishery is dependent on inland resources. In TE 2013-14, Bihar produced around 0.43 million
tonnes of fish, contributing only around 4.3 per cent of total fish production in the country
(Table 19). In 2014-15, the production had increased to 0.48 million tonnes, showing a year-
on-year increase of around 11 per cent.
An ICAR report10 (2008) has confirmed the substantial potential for expansion of inland
fishery in the state, particularly in two water resources, ponds and oxbow lakes (mauns). It
assessed that fish production could be doubled in 4 to 5 years from the level of 2.6 lakh MT
existing at that time. The main interventions identified for realising the potential were
clearance of weed infestation, renovation and desilting of ponds, establishment of brood
banks and hatcheries to enhance seed production, leasing of seed rearing space with buy back
arrangements, long-term leasing of water bodies to enable their development, stocking of
ponds with adequate fingerlings and development of post-harvest fish handling and
marketing facilities (ICAR, 2008).
Some of the suggestions made in ICAR Report were picked up in ARM-2, which envisaged
fingerling rearing by farmers in pens and rearing ponds constructed near ox-bow lakes,
construction of large rearing ponds and reservoirs, and long-term leasing of ponds so that the
lessees invested their own funds. ARM -2 also included provisions for the establishment of
feed mills and wholesale and retail outlets and purchase of refrigerated vans for transport of
fish to the market. There was a plan for the establishment of cold storage-cum-ice plants at
the district level as well. Training for farmers and extension workers has also been envisaged.
5. Drivers of Agriculture Growth
We noted the major paradox of high investment in productivity augmenting inputs and low
agricultural productivity in Bihar’s agriculture situation. Deficiencies in public infrastructure
are mainly responsible for this paradox. In this section, we examine these deficiencies by first
discussing the status of public infrastructure and later, examining the potential drivers of
agriculture growth using an OLS regression model. We also undertake the Engle-Granger
Test for co-integration to test the for long-term relationship between the selected variables.
5.1 Status of Physical Infrastructure in Bihar
Irrigation, power and roadways play a vital role in augmenting agriculture investment and
growth (FAO, 1996). Several earlier studies (Antle, 1984; Binswanger et al, 1993; Fan,
Gulati and Thorat, 2007; Fan and Zhang 2004) have highlighted that investment in rural
infrastructure has the ability to increase farmer’s access to markets, encourage development
of the rural non-farm economy, invigorate rural towns, and bolster rural consumer demand. In
this section, we discuss the development of infrastructure in Bihar to understand the reasons
for low productivity in the agricultural sector. 10 http://ahd.bih.nic.in/Docs/ICAR-Report-Fisheries-Dev-Bihar.pdf
23
5.1.1 Irrigation
We have alluded earlier to the fact that while normal rainfall received by Bihar is sufficient to
sustain agriculture, there are spatial and temporal uncertainties surrounding it. As a result,
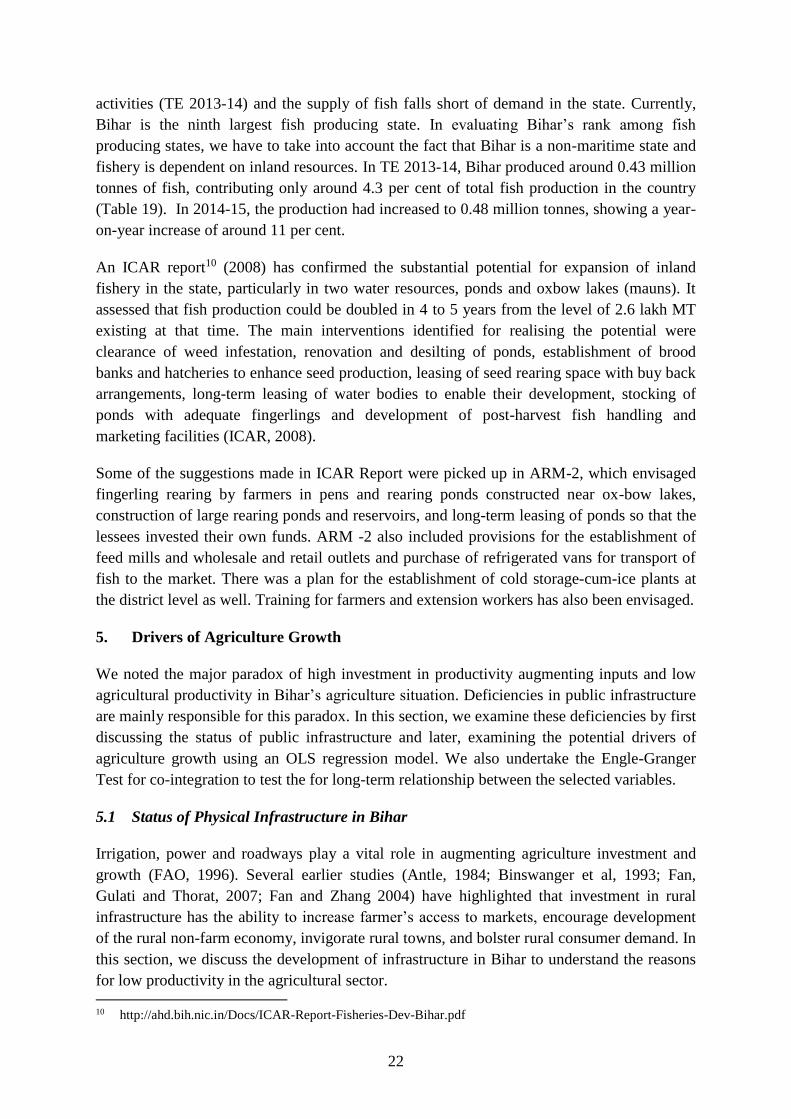
farming in Bihar remains substantially dependent on irrigation. The irrigation ratio (the gross
irrigated area as a proportion of the gross cropped area) in Bihar is more favourable (68.5 per
cent) as compared to the country as a whole (47.6 per cent), and, in fact, the comparative
position of the state has improved during the period 2001-02 to 2012-13 (Figure 17).
Currently, Bihar has the fourth highest irrigation ratio in the country after Punjab (98.2 per
cent), Haryana (87.2 per cent) and Uttar Pradesh (77.2 per cent). In these three states, GCA
and GIA have been increasing, except in Punjab where GCA has remained constant (Table
3).
Figure 17: Gross irrigated Area as a percentage of Gross Cropped Area
Source: Directorate of Economics & Statistics
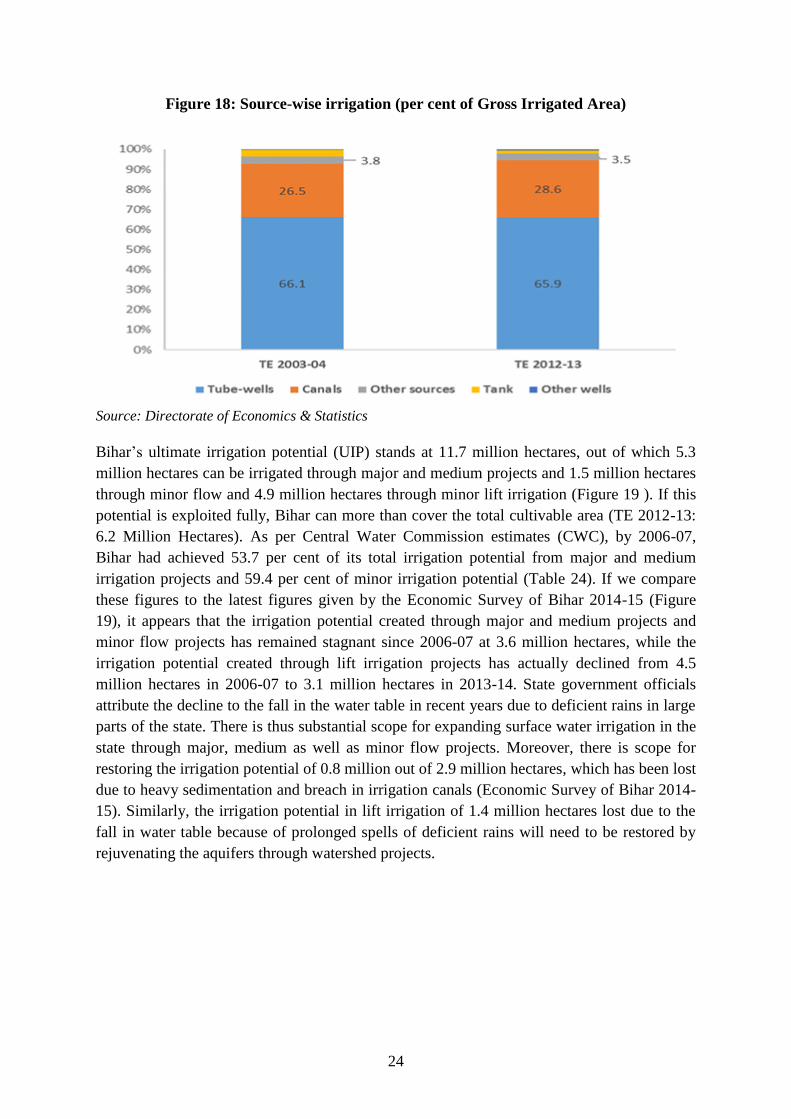
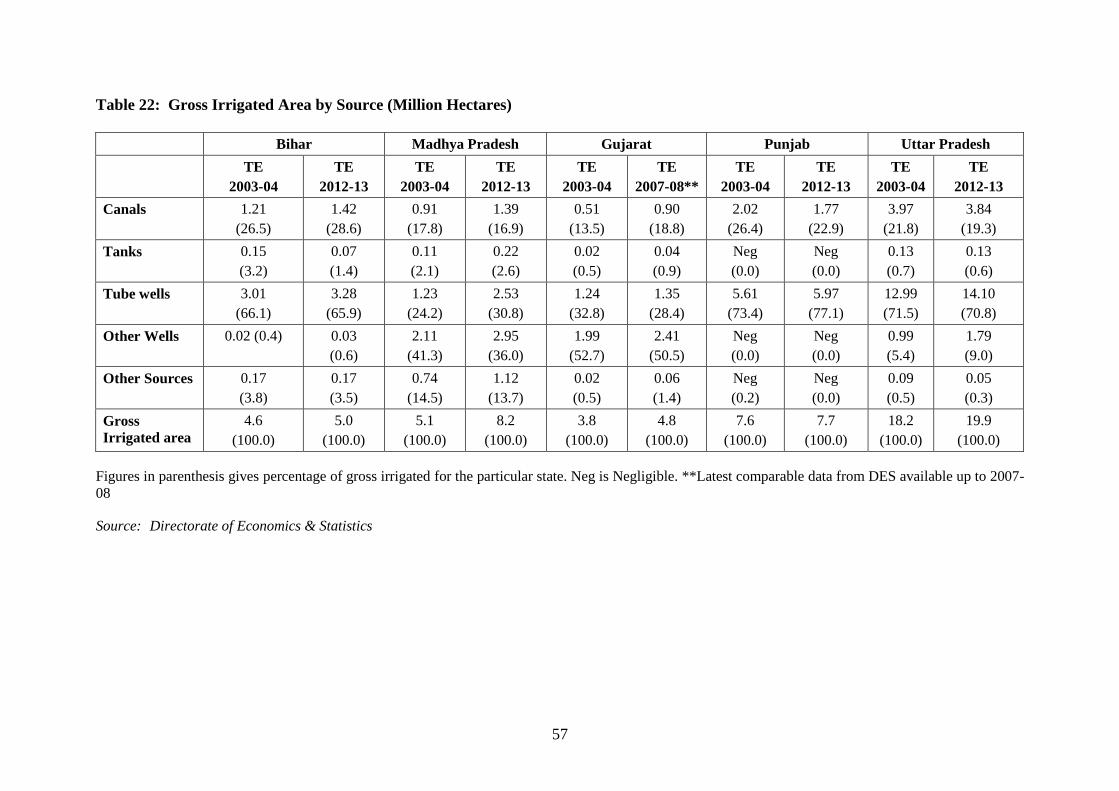
The source wise picture of the evolution of irrigation during the period under consideration in
comparator states is given in Figure 18. Tube wells and canals are the main sources of
irrigation in Bihar, contributing around 65.9 per cent and 28.6 per cent of the GIA
respectively and there was modest expansion in the number of tube wells and canals during
the period between TE 2003-04 and TE 2012-13. However, irrigation from tanks has been
shrinking in Bihar, and there is substantial under-exploitation of dug wells as compared to
Madhya Pradesh and Gujarat.
24
Figure 18: Source-wise irrigation (per cent of Gross Irrigated Area)
Source: Directorate of Economics & Statistics
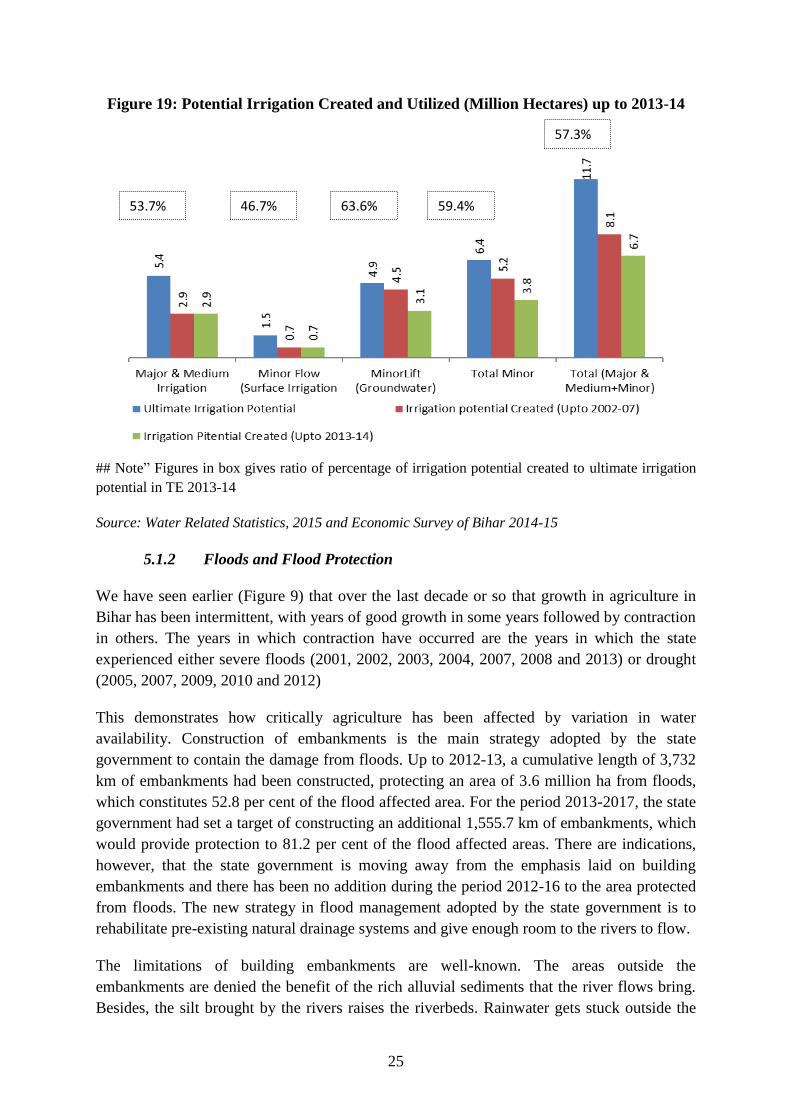
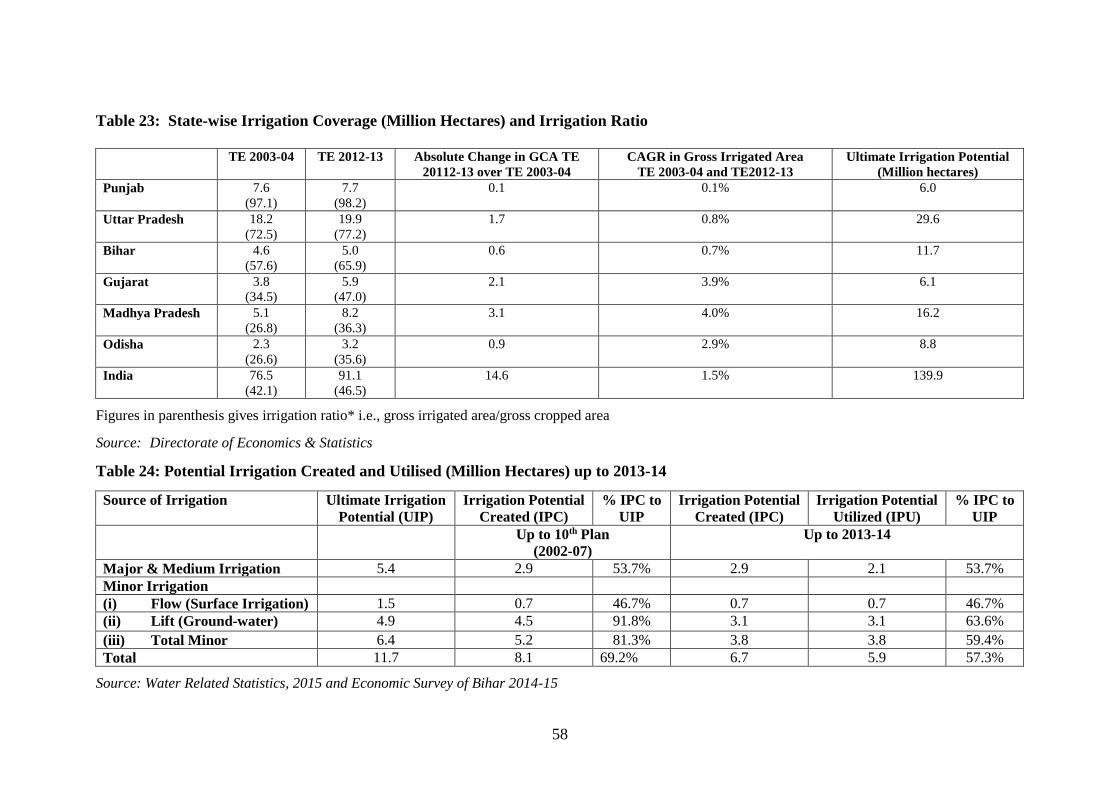
Bihar’s ultimate irrigation potential (UIP) stands at 11.7 million hectares, out of which 5.3
million hectares can be irrigated through major and medium projects and 1.5 million hectares
through minor flow and 4.9 million hectares through minor lift irrigation (Figure 19 ). If this
potential is exploited fully, Bihar can more than cover the total cultivable area (TE 2012-13:
6.2 Million Hectares). As per Central Water Commission estimates (CWC), by 2006-07,
Bihar had achieved 53.7 per cent of its total irrigation potential from major and medium
irrigation projects and 59.4 per cent of minor irrigation potential (Table 24). If we compare
these figures to the latest figures given by the Economic Survey of Bihar 2014-15 (Figure
19), it appears that the irrigation potential created through major and medium projects and
minor flow projects has remained stagnant since 2006-07 at 3.6 million hectares, while the
irrigation potential created through lift irrigation projects has actually declined from 4.5
million hectares in 2006-07 to 3.1 million hectares in 2013-14. State government officials
attribute the decline to the fall in the water table in recent years due to deficient rains in large
parts of the state. There is thus substantial scope for expanding surface water irrigation in the
state through major, medium as well as minor flow projects. Moreover, there is scope for
restoring the irrigation potential of 0.8 million out of 2.9 million hectares, which has been lost
due to heavy sedimentation and breach in irrigation canals (Economic Survey of Bihar 2014-
15). Similarly, the irrigation potential in lift irrigation of 1.4 million hectares lost due to the
fall in water table because of prolonged spells of deficient rains will need to be restored by
rejuvenating the aquifers through watershed projects.
25
Figure 19: Potential Irrigation Created and Utilized (Million Hectares) up to 2013-14
## Note” Figures in box gives ratio of percentage of irrigation potential created to ultimate irrigation
potential in TE 2013-14
Source: Water Related Statistics, 2015 and Economic Survey of Bihar 2014-15
5.1.2 Floods and Flood Protection
We have seen earlier (Figure 9) that over the last decade or so that growth in agriculture in
Bihar has been intermittent, with years of good growth in some years followed by contraction
in others. The years in which contraction have occurred are the years in which the state
experienced either severe floods (2001, 2002, 2003, 2004, 2007, 2008 and 2013) or drought
(2005, 2007, 2009, 2010 and 2012)
This demonstrates how critically agriculture has been affected by variation in water
availability. Construction of embankments is the main strategy adopted by the state
government to contain the damage from floods. Up to 2012-13, a cumulative length of 3,732
km of embankments had been constructed, protecting an area of 3.6 million ha from floods,
which constitutes 52.8 per cent of the flood affected area. For the period 2013-2017, the state
government had set a target of constructing an additional 1,555.7 km of embankments, which
would provide protection to 81.2 per cent of the flood affected areas. There are indications,
however, that the state government is moving away from the emphasis laid on building
embankments and there has been no addition during the period 2012-16 to the area protected
from floods. The new strategy in flood management adopted by the state government is to
rehabilitate pre-existing natural drainage systems and give enough room to the rivers to flow.
The limitations of building embankments are well-known. The areas outside the
embankments are denied the benefit of the rich alluvial sediments that the river flows bring.
Besides, the silt brought by the rivers raises the riverbeds. Rainwater gets stuck outside the
53.7% 46.7% 63.6% 59.4%
57.3%
26
embankments and river water seeps through the embankments into the countryside.
Additionally, waters from the tributaries are restricted from entering the main river because
of the embankments. Although sluice gates facilitate the process of directing water from
tributaries to the main river during the off season, during the peak flood season, the sluice
gates cannot be opened because of the risk of the main river flowing back into the tributaries.
Further, there is also the risk of breach of embankments, which can create havoc for
populations residing close to embankments (Mishra, 1999). For these reasons, experts and
planners have been looking beyond embankments for a permanent solution. In the past, the
thinking has been that there is substantial potential for upstream reservoir storage in the
Himalayan headwaters, which could be harnessed through large multipurpose dams to
provide three benefits, viz., regulate river flows to contain floods, deliver irrigation water and
produce hydropower. Recent evaluation made by the Ganges Strategic Basin Assessment
(SBA) undertaken by the World Bank (Sadoff et. al 2013) in cooperation with several leading
research institutions has come to some sobering conclusions. The potential to control floods
by providing for upstream storage is limited. There could be benefits from irrigation in the
dry season but in Bihar where the water table is high even in the dry season, such irrigation
could cause harm by increasing water logging. The SBA confirms the existence of a
considerable hydropower potential: as much as 40,000 megawatts of economically feasible
hydropower potential is believed to exist. But the development of power would be capital
intensive and would take several years to implement.
The SBA report does not touch upon the environmental aspects, which, according to some
authors, make the proposal for construction of multipurpose dams in the Himalayas a non-
starter for the reason that “in the Himalayas, we confront one of the most fragile ecosystems
in the world” (Shah, 2016).
5.1.3 Energy for Agriculture
An important determinant of development is the availability of adequate, reliable and quality
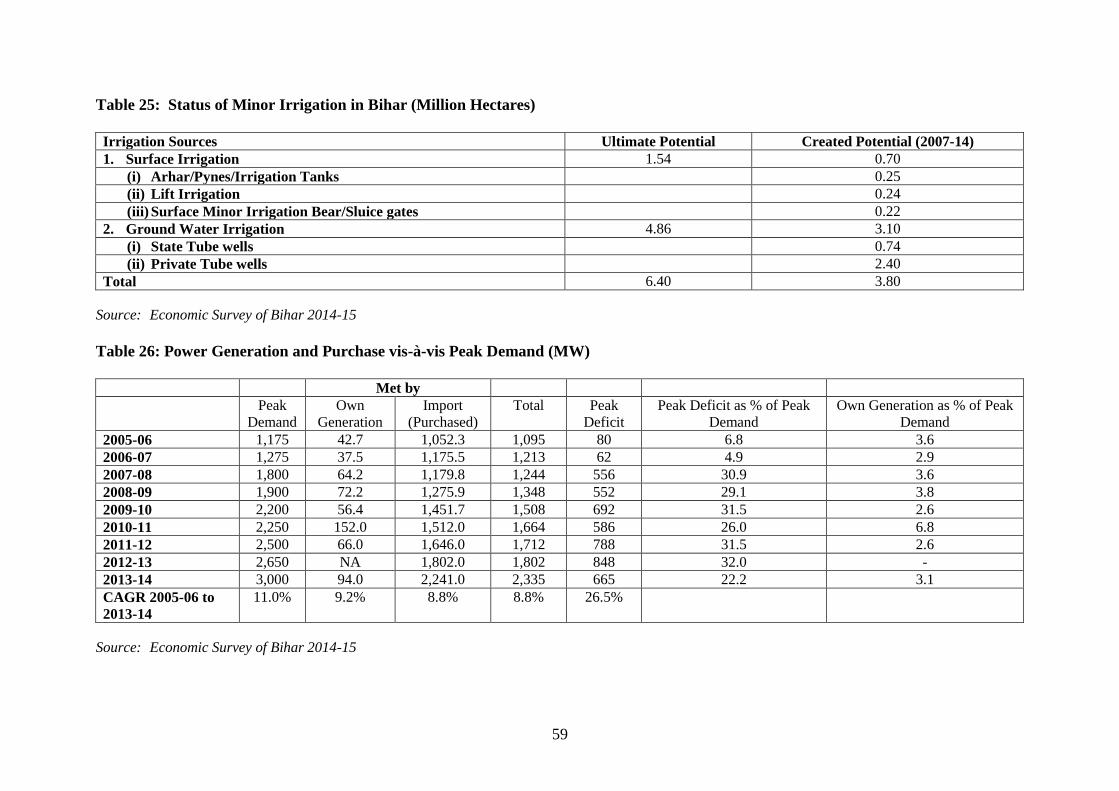
power at a competitive rate but the state is chronically deficient in this regard. In 2013-14, the
state generated only 94 MW from its own sources and imported around 2,241 MW from other
sources. Per capita power consumption in the state is only 144 kwh, much lower than the all-
India average of 927 kwh. Bihar is almost entirely dependent on central sector allocations to
meet its energy demand. The availability of ample power supplies from the central grid in
recent months has reduced the pressure for increasing domestic generation and enabled the
government to focus on improving transmission and distribution. However, Bihar has
recently made good progress in the renovation of existing units and the construction of new
ones and it is expected that, in about a year or two, it will be able to meet from its own
generation close to 50 per cent of the power needs of about 3500 MW.
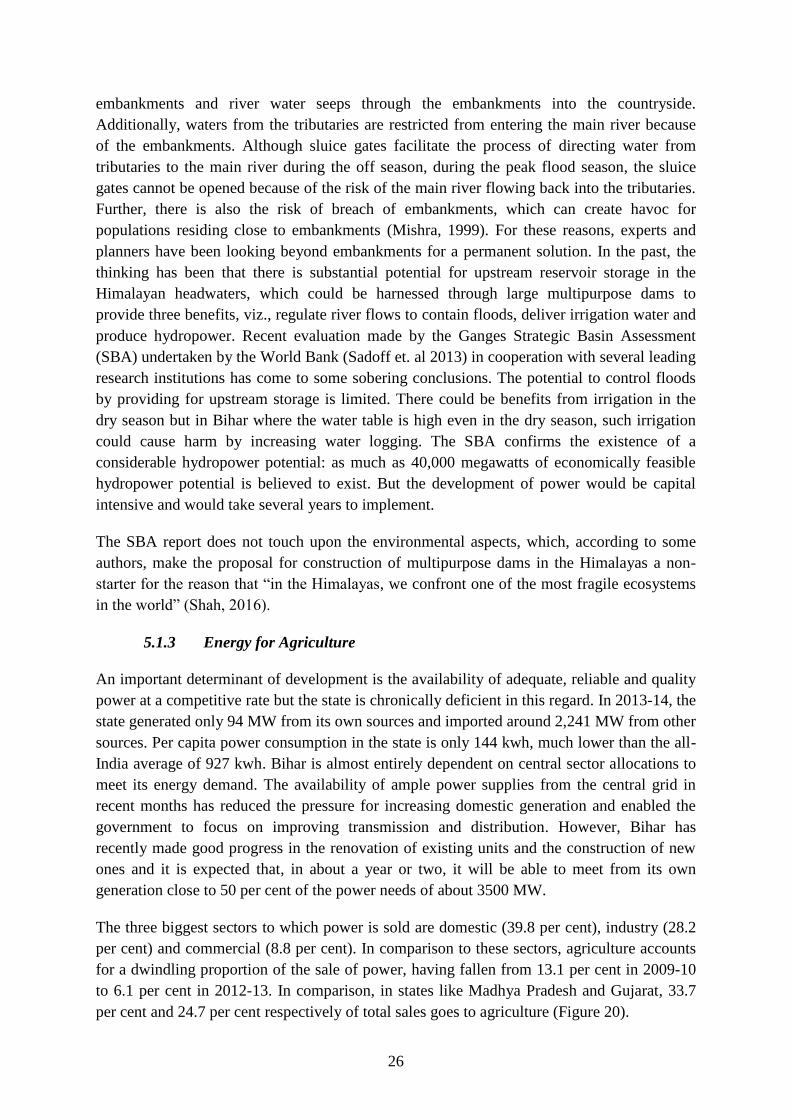
The three biggest sectors to which power is sold are domestic (39.8 per cent), industry (28.2
per cent) and commercial (8.8 per cent). In comparison to these sectors, agriculture accounts
for a dwindling proportion of the sale of power, having fallen from 13.1 per cent in 2009-10
to 6.1 per cent in 2012-13. In comparison, in states like Madhya Pradesh and Gujarat, 33.7
per cent and 24.7 per cent respectively of total sales goes to agriculture (Figure 20).
27
Figure 20: Share of agriculture in total power sales (2012-13)
## Note: Odisha data for power available until 2011-12
Source: Annual report (2013-14) on the Working of State Power Utilities & Electricity Departments,
Planning and Energy Division of Planning Commission
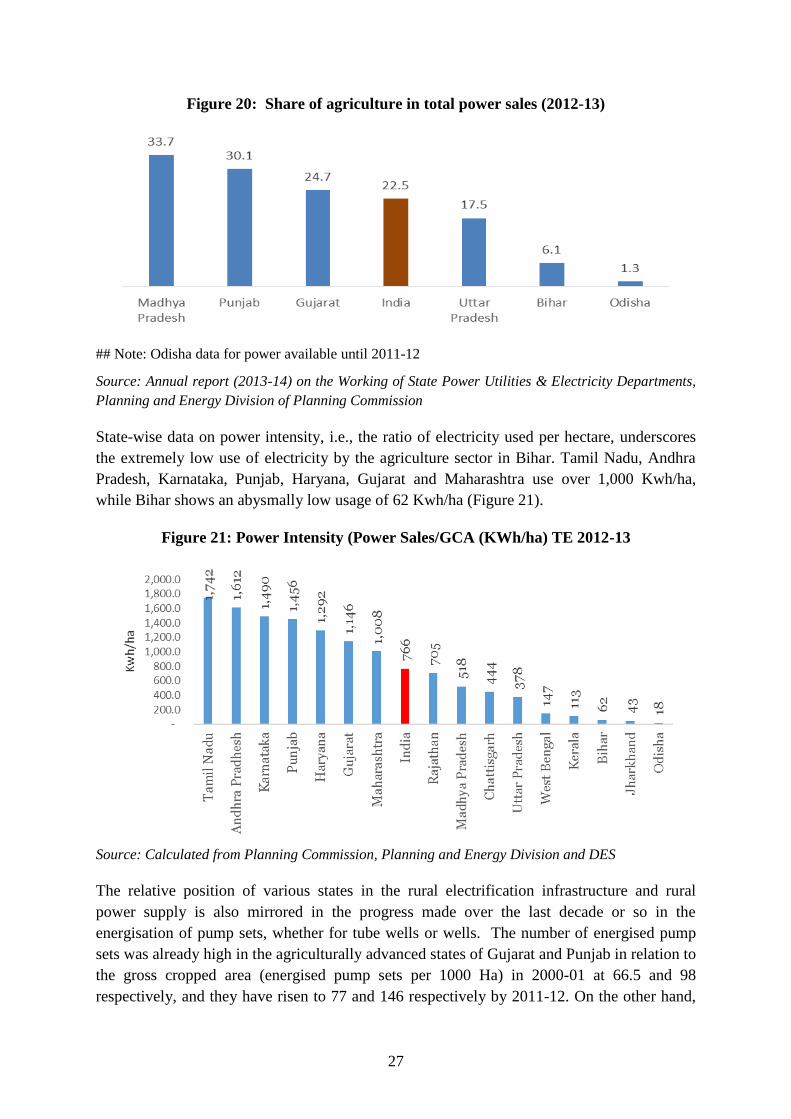
State-wise data on power intensity, i.e., the ratio of electricity used per hectare, underscores
the extremely low use of electricity by the agriculture sector in Bihar. Tamil Nadu, Andhra
Pradesh, Karnataka, Punjab, Haryana, Gujarat and Maharashtra use over 1,000 Kwh/ha,
while Bihar shows an abysmally low usage of 62 Kwh/ha (Figure 21).
Figure 21: Power Intensity (Power Sales/GCA (KWh/ha) TE 2012-13
Source: Calculated from Planning Commission, Planning and Energy Division and DES
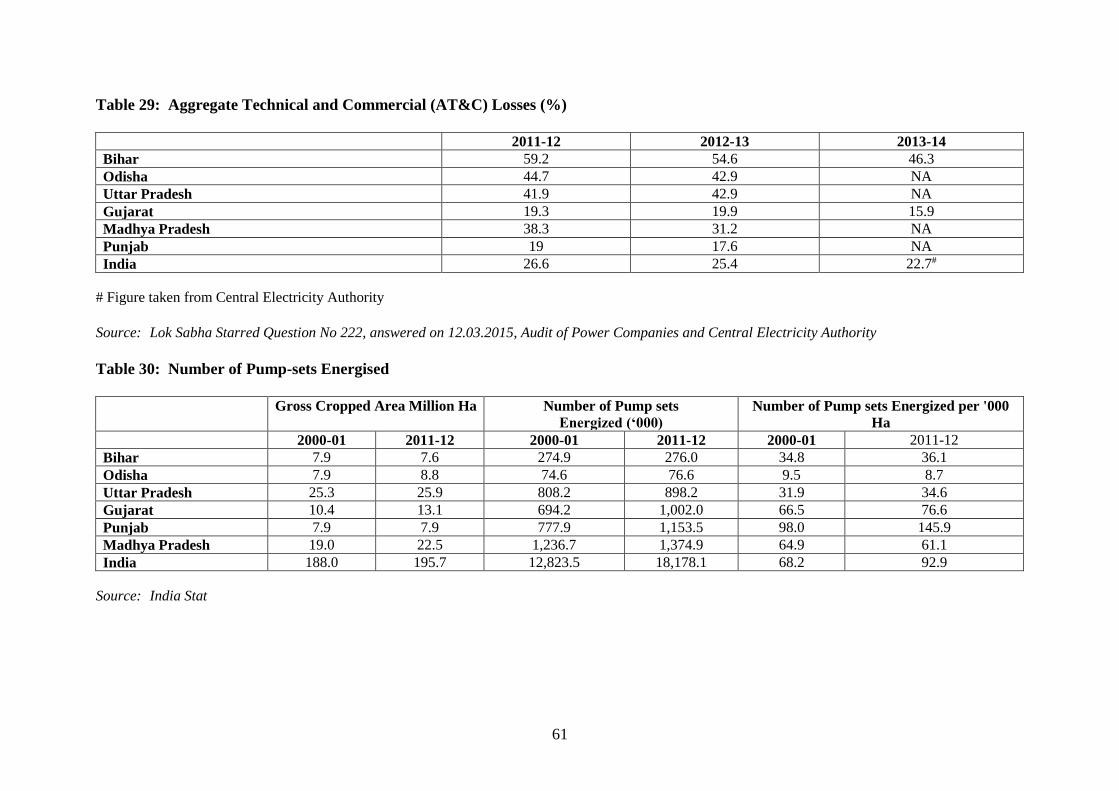
The relative position of various states in the rural electrification infrastructure and rural
power supply is also mirrored in the progress made over the last decade or so in the
energisation of pump sets, whether for tube wells or wells. The number of energised pump
sets was already high in the agriculturally advanced states of Gujarat and Punjab in relation to
the gross cropped area (energised pump sets per 1000 Ha) in 2000-01 at 66.5 and 98
respectively, and they have risen to 77 and 146 respectively by 2011-12. On the other hand,
28
in Bihar, the number of energised pump sets was 34.8 per 1000 Ha of gross cropped area in
2000-01 and has only marginally increased to 36.1 per 1000 hectares in 2011-12, as can be
seen in Table 30.
The progressive decline in the quantity and quality of power supplied by power utilities has
increased the dependency of farmers in Bihar on diesel tube wells. Further, the increase in
diesel prices have increased the cost of irrigation and reduced the profitability of farming in
Bihar. The poor state of power supplies for irrigation is one of the main reasons for the
plentiful supplies of ground water in the state’s aquifers not being fully exploited. Against the
ultimate lift irrigation potential of 4.9 million hectares, an irrigation potential of only 3.1
million hectares has been created. In order to expand coverage and bring down the cost of
cultivation, the government has to provide an assured supply of power for agriculture by
increasing expenditure on transmission and distribution to rural areas.
The low and dwindling use of power by agriculture can be attributed to the weak distribution
and transmission infrastructure, which results in interruptions as well poor quality of supply.
However, with the recent initiatives of the central and state government, the situation is
expected to change dramatically in the next two years. Under the Deen Dayal Upadhaya
Gram Jyoti Yojana the Government of India has sanctioned 38 projects valued at Rs.5856.35
crore. Seventy per cent of the allocation or Rs.4439.69 crore has been earmarked for feeder
segregation for power supplies for irrigation and the remaining for system strengthening. The
entire work on feeder segregation has been bid out and implementation has already begun. In
addition, the state government has taken a loan of Rs.800 crore from the ADB for
undertaking the work of strengthening the transmission system.
After the launch of the solar pumping programme for irrigation and drinking water by the
Ministry of New and Renewable Energy (MNRE) the state has made a good start in solar
pumping. Bihar supplemented the Government of India subsidy of 30 per cent with 45 per
cent of its own. As a result, 1000 solar pumps were installed in 2015-16 and 3300 more are
planned to be taken up in 2016-17, against which about 2000 applications have been received
already and are being processed. It, however, has not been possible to make arrangement to
enable farmers to sell back surplus power to the grid.
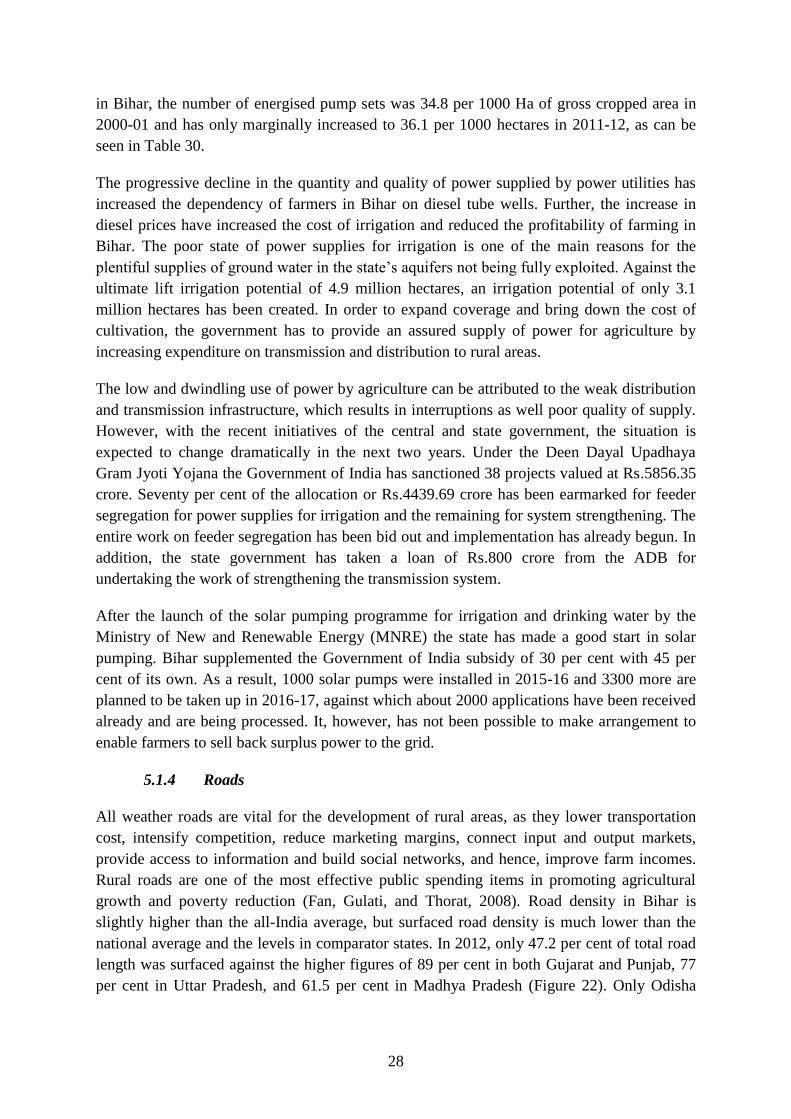
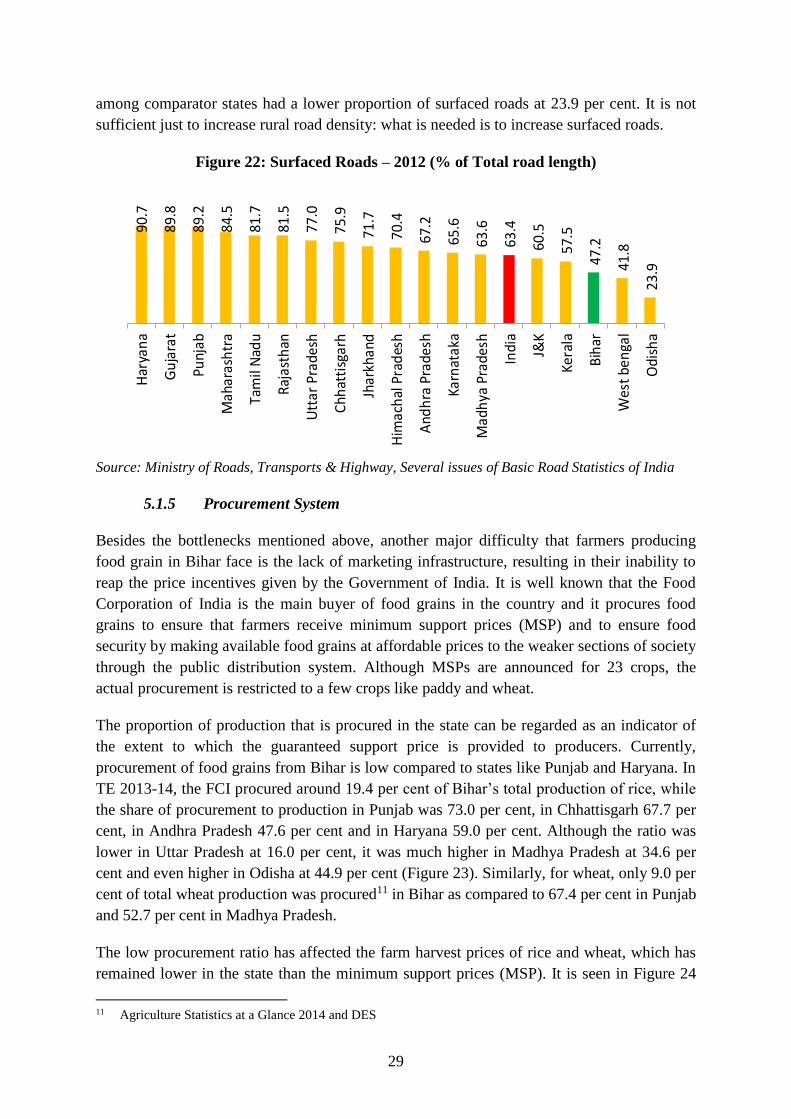
5.1.4 Roads
All weather roads are vital for the development of rural areas, as they lower transportation
Average growth (2001-02 to 2013-14) 0.8 0.1 1.7 0.2 1.9 0.3 0.0 4.3
Share of each segment in total growth in GVO 19.1 1.5 40.1 4.4 44.6 8.0 0.6 100.0
Note: To determine the sources of growth, we have deflated the current series of each segment by the WPI and then decomposed the year-on-year growth in
GVO from agriculture and allied activities, by taking the absolute year-on-year difference in GVO from each segment as a proportion of the previous year’s
GVO from agriculture and allied activities.
Source: Calculated by authors
46
Table 8: Production and Productivity of Major Crops
Production (Million Tonnes) Productivity( MT/hectares)
Bihar India Bihar India
TE 2003-04 TE 2013-14 CAGR TE 2003-04 TE 2013-14 CAGR TE 2003-04 TE 2013-14 TE 2003-04 TE 2013-14
Rice 5.2
(6.2)
6.7
(6.4)
0.4% 84.6
(100.0)
105.7
(100.0)
1.0% 1.5 2.1 2.0 2.4
Wheat 4.0
(5.8)
4.9
(5.2)
0.6% 70.2
(100.0)
94.8
(100.0)
2.1% 1.9 2.3 2.7 3.1
Maize 1.4
(11.0)
2.1
(9.1)
2.7% 13.1
(100.0)
22.8
(100.0)
4.8% 2.4 3.0 1.8 2.6
Coarse
Cereals
1.5
(4.6)
2.1
(5.0)
2.6% 32.3
(100.0)
41.8
(100.0)
2.0% 2.3 2.9 1.1 1.6
Total
Cereals
10.8
(5.8)
13.8
(5.7)
0.8% 187.1
(100.0)
242.3
(100.0)
1.6% 1.7 2.3 1.9 2.4
Pulses 0.6
(4.2)
0.5
(2.9)
-0.4% 13.1
(100.0)
18.3
(100.0)
2.8% 0.8 1.0 0.6 0.8
Food grains 11.3
(5.7)
14.3
(5.5)
0.8% 200.3
(100.0)
260.5
(100.0)
1.7% 1.6 2.2 1.7 2.1
Oilseeds 0.1
(0.6)
0.1
(0.5)
1.5% 20.2
(100.0)
31.2
(100.0)
3.6% 0.8 1.1 0.9 1.2
Sugarcane 4.7
(1.6)
12.3
(3.5)
7.2% 293.5
(100.0)
351.5
(100.0)
1.3% 43.2 50.8 66.5 70.1
##Figures in Parenthesis give percentage of all India production
Source: Directorate of Economics and Statistics
47
Table 9: State-wise Productivity of Selected Crops (MT/ha)
Rice Wheat Maize Sugarcane
TE 2003-04 TE 2013-14 TE 2003-04 TE 2013-14 TE 2003-04 TE 2013-14 TE 2003-04 TE 2013-14
Bihar 1.5 2.1 1.9 2.3 2.4 3.0 43.2 50.8
Gujarat 1.5 2.1 2.4 3.0 1.8 1.6 70.7 69.1
Madhya Pradesh 0.9 1.4 1.6 2.4 1.9 1.7 40.7 42.2
Odisha 1.3 1.7 1.4 1.7 1.1 2.4 56.8 64.2
Punjab 3.6 3.9 4.3 4.9 2.6 3.9 59.8 72.3
Uttar Pradesh 2.0 2.4 2.7 3.1 1.4 1.7 56.6 60.0
India 2.0 2.4 2.7 3.1 1.9 2.6 63.4 70.1
Source: Directorate of Economics and Statistics
48
Table 10: State-wise Production and Productivity of Fruits and Vegetables TE 2013-14
Fruits Vegetables Total Fruits & Vegetables
Production
(Million Tonnes)
Productivity (Metric
Tonnes/Hectare)
Production
(Million tonnes)
Productivity (Metric
Tonnes/Hectare)
Production
(Million tonnes)
Productivity (Metric
Tonnes/Hectare)
Maharas
htra
11.3
(13.7)
7.2 9.0
(5.6)
15.3 20.2
(8.3)
16.9
Andhra
Pradesh
11.4
(13.9)
15.3 10.8
(6.7)
18.1 22.2
(9.1)
22.4
Gujarat 8.0
(9.7)
21.7 10.7
(6.7)
19.6 18.7
(7.7)
24.6
Tamil
Nadu
7.5
(9.2)
23.2 8.5
(5.3)
29.3 16.1
(6.6)
30.1
Uttar
Pradesh
6.0
(7.2)
17.1 18.9
(11.8)
21.6 24.8
(10.2)
22.3
Karnata
ka
6.6
(8.0)
17.1 7.7
(4.8)
17.6 14.2
(5.9)
20.6
Madhya
Pradesh
4.8
(5.9)
25.7 11.9
(7.4)
20.4 16.7
(6.9)
25.5
Bihar 4.1
(4.9)
13.5 15.7
(9.8)
18.5 19.7
(8.1)
18.1
West
Bengal
3.0
(3.7)
13.8 24.0
(14.9)
17.7 27.0
(11.1)
17.3
Kerala 2.6
(3.2)
8.0 3.5
(2.2)
24.0 6.2
(2.5)
17.4
Odisha 2.2
(2.6)
6.6 9.5
(5.9)
13.8 11.6
(4.8)
11.3
Punjab 1.5
(1.8)
20.0 3.8
(2.4)
20.6 5.3
(2.2)
21.0
India 82.2
(100.0)
11.8 160.5
(100.0)
17.4 242.7
(100.0)
55.7
**Figures in parenthesis are percentage of respective total fruit vegetable production in the country
Source: National Horticulture Database, 2014
49
Table 11: Production and Productivity of Vegetables in Bihar
Production
(Million tonnes)
Productivity
(Metric Tonnes/hectare)
Bihar India Bihar India
TE 2007-08 TE 2013-14 CAGR (%) TE 2007-08 TE 2013-14 CAGR (%) TE 2007-08 TE 2013-14 TE 2007-08 TE 2013-14
Potatoes 5.8
(19.0)
6.4
(15.0)
2.3%
30.7
(100.0)
42.9
(100.0)
6.1% 18.5 20.2 18.1 21.9
Cauliflower 1.0
(17.7)
1.2
(14.8)
3.4% 5.6
(100.0)
7.9
(100.0)
8.3% 16.5 18.2 18.6 19.4
Okra 0.7
(17.4)
0.8
(13.0)
1.6% 4.1
(100.0)
6.3
(100.0)
8.1%
12.6 14.0 10.8 12.0
Brinjal 1.1
(11.6)
1.3
(9.6)
3.1%
9.5
(100.0)
13.2
(100.0)
6.4% 20.4 22.4 17.3 18.7
Onion 1.0
(9.2)
1.2
(6.8)
4.3%
19.8
(100.0)
22.6
(100.0)
12.8% 19.8 22.6 14.2 16.1
Tomatoes 0.9
(8.6)
1.1
(5.9)
6.5%
10.0
(100.0)
18.5
(100.0)
11.4% 18.5 23.1 19.2 20.8
Cabbage 0.6
(3.1)
0.7
(8.6)
4.1%
20.0
(100.0)
8.7
(100.0)
8.2% 16.5 18.9 21.9 22.4
Total
Vegetables
13.7
(11.7)
15.7
(9.7)
2.1%
117.4
(100.0)
161.1
(100.0)
6.5% 16.7 18.5 16.7 17.4
**Figures in parenthesis are percentage of total production of the vegetable in the country
Source: National Horticulture Database, several issues
50
Table 12: Production and Productivity of Fruits in Bihar
Production (Million Tons) Productivity (MT/ha)
Bihar India Bihar India
TE
2007-08
TE
2013-14
CAGR (%) TE
2007-08
TE
2013-14
CAGR (%) TE
2007-08
TE
2013-14
TE
2007-08
TE
2013-14
Banan
a
1.1
(5.4)
1.6
(5.6)
7.0% 21.0
(100.0)
28.2
(100.0)
7.8% 38.9 47.5 34.6 47.5
Guava 0.2
(12.8)
0.3
(9.4)
11.1% 1.8
(100.0)
3.1
(100.0)
13.8% 8.3 9.8 10.6 12.9
Litchi 0.2
(52.4)
0.2
(42.7)
2.7% 0.4
(100.0)
0.6
(100.0)
6.9% 7.3 7.7 7.3 6.9
Mango 1.1
(52.4)
1.3
(7.5)
1.9% 13.4
(100.0)
17.5
(100.0)
6.5% 8.0 8.9 8.0 7.1
Fruits 3.3
(5.5)
4.1
(4.9)
8.2% 59.5
(100.0)
82.2
(100.0)
8.2% 11.4 13.5 11.6 11.8
**Figures in parenthesis are percentage of total production of the fruit in the country
Source: National Horticulture Database, several issues
51
Table 13: State-wise Milk Production (Million Tonnes)
TE
2003-04
TE
2010-11
TE
2013-14
CAGR 2004-05
to 2013-14 (%)
Adult Female Bovine Population
[Cows and Buffaloes '000 Number]
Production (MT) per female animal
Uttar
Pradesh
15.3
(17.7)
20.3
(17.3)
23.4
(17.6)
3.9% 24,501 0.95
Gujarat 6.1
(7.1)
8.9
(7.6)
10.4
(7.8)
5.1% 9,787 1.06
Punjab 8.2
(9.5)
9.4
(8.0)
9.8
(7.4)
1.6% 4,101 2.37
Madhya
Pradesh
5.3
(6.2)
7.2
(6.1)
8.9
(6.7)
5.7% 11,204 0.79
Bihar 2.9
(3.4)
6.2
(5.3)
7.0
(5.2)
4.3% 9,999 0.69
Odisha 1.0
(1.1)
1.6
(1.4)
1.8
(1.3)
3.8% 3,709 0.48
Andhra
Pradesh
6.5
(7.5)
10.4
(8.9)
12.6
(9.5)
6.0% 9,241 1.37
India 86.2
(100.0)
116.8
(100.0)
132.7
(100.0)
4.1% 1,33,271 1.00
**Figures in parenthesis are share in total production of Milk and total milk animals
Source: National Dairy Development Board, 19th Livestock Census
52
Table 14: Livestock Population in Bihar and selected states (in percentage)
Table 19: State-wise Fish Production (‘000 Tonnes)
TE 2002-03 TE 2006-07 TE 2013-14
Andhra Pradesh 697.9
(11.8)
867.0
(13.2)
1,809.9
(19.9)
West Bengal 1,093.4
(18.4)
1,274.7
(19.4)
1,514.2
(16.7)
Gujarat 713.4
(12.0)
705.5
(10.7)
790.2
(8.7)
Kerala 667.3
(11.8)
664.3
(10.1)
693.9
(7.6)
Tamil Nadu 468.0
(7.9)
488.2
(7.4)
618.7
(6.8)
Maharashtra 525.8
(8.9)
574.8
(8.7)
589.3
(6.5)
Uttar Pradesh 227.8
(3.8)
291.1
(4.4)
448.0
(4.9)
Odisha 276.4
(4.7)
327.7
(5.0)
401.9
(4.4)
Bihar 241.2
(4.1)
271.4
(4.1)
392.3
(4.3)
Punjab 58.7
(1.0)
83.3
(1.3)
100.3
(1.1)
Madhya Pradesh 46.2
(0.8)
62.7
(1.0)
85.6
(0.9)
India 5,937.0
(100.0)
6,581.8
(100.0)
9,094.5
(100.0)
## Figures in parenthesis give the shares in total production of fish in the country
Source: Indiastat
56
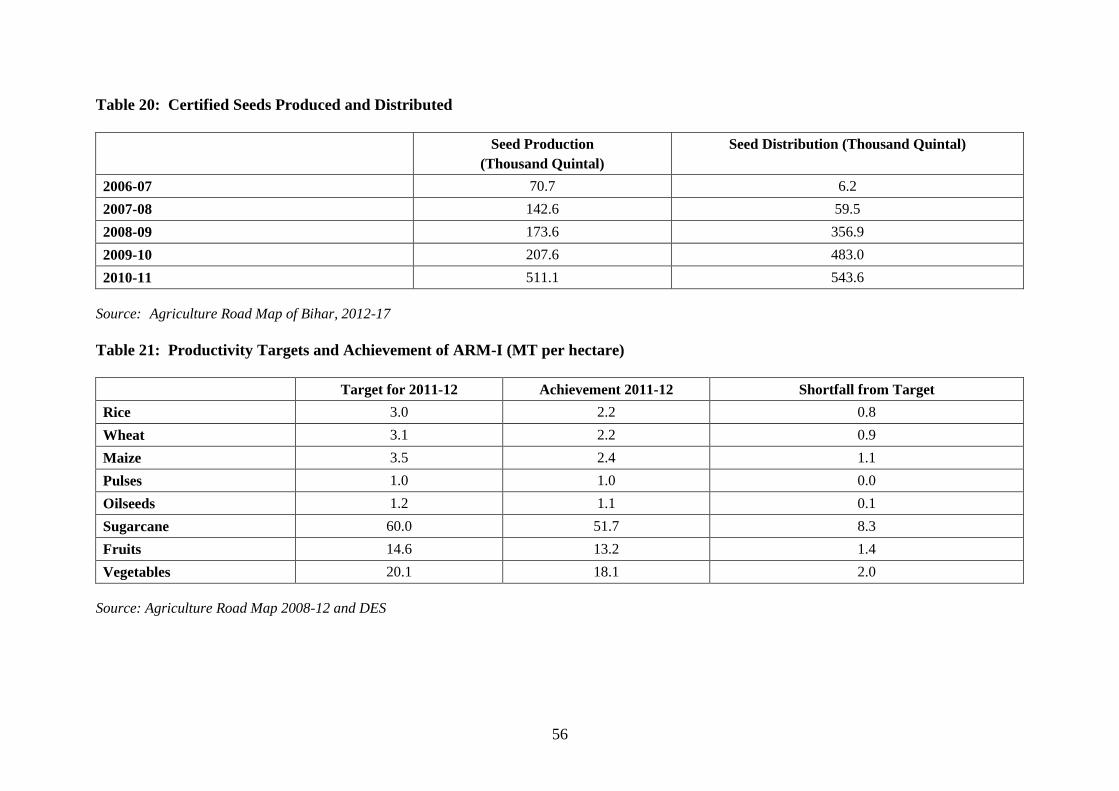
Table 20: Certified Seeds Produced and Distributed
Seed Production
(Thousand Quintal)
Seed Distribution (Thousand Quintal)
2006-07 70.7 6.2
2007-08 142.6 59.5
2008-09 173.6 356.9
2009-10 207.6 483.0
2010-11 511.1 543.6
Source: Agriculture Road Map of Bihar, 2012-17
Table 21: Productivity Targets and Achievement of ARM-I (MT per hectare)
Target for 2011-12 Achievement 2011-12 Shortfall from Target
Rice 3.0 2.2 0.8
Wheat 3.1 2.2 0.9
Maize 3.5 2.4 1.1
Pulses 1.0 1.0 0.0
Oilseeds 1.2 1.1 0.1
Sugarcane 60.0 51.7 8.3
Fruits 14.6 13.2 1.4
Vegetables 20.1 18.1 2.0
Source: Agriculture Road Map 2008-12 and DES
57
Table 22: Gross Irrigated Area by Source (Million Hectares)
Bihar Madhya Pradesh Gujarat Punjab Uttar Pradesh
TE
2003-04
TE
2012-13
TE
2003-04
TE
2012-13
TE
2003-04
TE
2007-08**
TE
2003-04
TE
2012-13
TE
2003-04
TE
2012-13
Canals 1.21
(26.5)
1.42
(28.6)
0.91
(17.8)
1.39
(16.9)
0.51
(13.5)
0.90
(18.8)
2.02
(26.4)
1.77
(22.9)
3.97
(21.8)
3.84
(19.3)
Tanks 0.15
(3.2)
0.07
(1.4)
0.11
(2.1)
0.22
(2.6)
0.02
(0.5)
0.04
(0.9)
Neg
(0.0)
Neg
(0.0)
0.13
(0.7)
0.13
(0.6)
Tube wells 3.01
(66.1)
3.28
(65.9)
1.23
(24.2)
2.53
(30.8)
1.24
(32.8)
1.35
(28.4)
5.61
(73.4)
5.97
(77.1)
12.99
(71.5)
14.10
(70.8)
Other Wells 0.02 (0.4) 0.03
(0.6)
2.11
(41.3)
2.95
(36.0)
1.99
(52.7)
2.41
(50.5)
Neg
(0.0)
Neg
(0.0)
0.99
(5.4)
1.79
(9.0)
Other Sources 0.17
(3.8)
0.17
(3.5)
0.74
(14.5)
1.12
(13.7)
0.02
(0.5)
0.06
(1.4)
Neg
(0.2)
Neg
(0.0)
0.09
(0.5)
0.05
(0.3)
Gross
Irrigated area
4.6
(100.0)
5.0
(100.0)
5.1
(100.0)
8.2
(100.0)
3.8
(100.0)
4.8
(100.0)
7.6
(100.0)
7.7
(100.0)
18.2
(100.0)
19.9
(100.0)
Figures in parenthesis gives percentage of gross irrigated for the particular state. Neg is Negligible. **Latest comparable data from DES available up to 2007-
08
Source: Directorate of Economics & Statistics
58
Table 23: State-wise Irrigation Coverage (Million Hectares) and Irrigation Ratio
TE 2003-04 TE 2012-13 Absolute Change in GCA TE
20112-13 over TE 2003-04
CAGR in Gross Irrigated Area
TE 2003-04 and TE2012-13
Ultimate Irrigation Potential
(Million hectares)
Punjab 7.6
(97.1)
7.7
(98.2)
0.1 0.1% 6.0
Uttar Pradesh 18.2
(72.5)
19.9
(77.2)
1.7 0.8% 29.6
Bihar 4.6
(57.6)
5.0
(65.9)
0.6 0.7% 11.7
Gujarat 3.8
(34.5)
5.9
(47.0)
2.1 3.9% 6.1
Madhya Pradesh 5.1
(26.8)
8.2
(36.3)
3.1 4.0% 16.2
Odisha 2.3
(26.6)
3.2
(35.6)
0.9 2.9% 8.8
India 76.5
(42.1)
91.1
(46.5)
14.6 1.5% 139.9
Figures in parenthesis gives irrigation ratio* i.e., gross irrigated area/gross cropped area
Source: Directorate of Economics & Statistics
Table 24: Potential Irrigation Created and Utilised (Million Hectares) up to 2013-14
Source of Irrigation Ultimate Irrigation
Potential (UIP)
Irrigation Potential
Created (IPC)
% IPC to
UIP
Irrigation Potential
Created (IPC)
Irrigation Potential
Utilized (IPU)
% IPC to
UIP
Up to 10th Plan
(2002-07)
Up to 2013-14
Major & Medium Irrigation 5.4 2.9 53.7% 2.9 2.1 53.7%