Page 1
FREEMAN SPOGLI INSTITUTE FOR INTERNATIONAL STUDIES
AUSTRALIA’S BLACK COAL INDUSTRY: PAST ACHIEVEMENTS
AND FUTURE CHALLENGES
BART LUCARELLI
Working Paper #101
March 2011
PROGRAM ON ENERGY AND
SUSTAINABLE DEVELOPMENT
Page 2
28 March 2011 2 PESD WP #101
About the Program on Energy and Sustainable Development
The Program on Energy and Sustainable Development (PESD) is an international,
interdisciplinary program that studies how institutions shape patterns of energy production
and use, in turn affecting human welfare and environmental quality. PESD research
examines issues including effective policies for addressing climate change, the role of
national oil companies in the world oil market, the emerging global coal market, business
models for carbon capture and storage, adaptation of wholesale electricity markets to support
a low-carbon future, and how modern energy services can be supplied sustainably to the
world‘s poorest regions.
The Program, established in September 2001, includes a global network of scholars—based
at centers of excellence on six continents—in law, political science, economics and
engineering. It is part of the Freeman Spogli Institute for International Studies at Stanford
University.
PESD gratefully acknowledges substantial core funding from BP and EPRI.
Program on Energy and Sustainable Development
Encina Hall East, Room E415
Stanford University
Stanford, CA 94305-6055
http://pesd.stanford.edu
Page 3
28 March 2011 3 PESD WP #101
About the Author
Bart Lucarelli is a consulting research associate at the Program on Energy and Sustainable
Development at Stanford and an independent energy consultant with 28 years of energy
industry experience. He has spent 20 of those years working in Asia with an emphasis on the
development of independent power projects and the procurement of secure and cost-
competitive supplies of fossil fuels for new power plants. He currently operates an energy
consulting business in the region with clients ranging from private power developers to
government energy planning agencies. A considerable amount of his work over the past four
years has involved helping private power companies and lending institutions assess Asia‘s
coal export markets and assisting private power companies with the procurement of reliable
and competitively priced supplies of coal for new coal-fired power plants. He is a frequent
speaker at energy conferences throughout Asia and conducts a very popular region-wide
seminar on coal pricing and coal supply contracting.
Over the past two years, with PESD support, Bart has been researching the development
histories of the Indonesian and Australian coal industries. He has focused his research on the
impacts that political and regulatory factors have had on the growth, structure, and
performance of those two industries. He is also using his PESD research to speculate on
alternative futures that those two industries will face in a carbon-constrained world. Bart has
a PhD from the Department of City and Regional Planning at UC Berkeley with a specialty in
energy planning. He and his wife, Pornthip, live in Bangkok, Thailand with their three sons,
Romeo, Leonardo, and Valentino.
Page 4
28 March 2011 4 PESD WP #101
Copyright © 2011 by Bart Lucarelli PhD
All rights reserved.
No part of this paper may be reproduced in any manner whatsoever without written
permission except in the case of brief quotations embodied in critical articles and reviews.
For permission to quote or use materials contained in this paper, contact Bart Lucarelli at
[email protected] and Richard Morse at [email protected] .
Page 5
28 March 2011 5 PESD WP #101
Table of Contents 1. Introduction 10
1.1 Background 10
1.2 Organization of Paper 13
1.2.1 Post-WWII History of Australia‘s Black Coal Industry (1948-2009) 13
1.2.2 Future Challenges and Issues 13
1.2.3 New Technology to the Rescue? 13
1.2.4 Into the Future 14
1.3 Coal Definitions and Terminology 14
2. Post-WWII History of Australia’s Black Coal Industry
(1948-2009)
15
2.1 The Recovery Phase (1948-1959) 15
2.1.1 Increased Regulatory Control 16
2.1.2 Production and Market Trends 20
2.1.3 Role of New Technology during the Recovery Phase 21
2.1.4 Evolution of the Domestic Market 29
2.2 Rapid Growth Phase (1960-1986) 30
2.2.1 Further Advances in Underground Mining Methods 31
2.2.2
2.2.3
Shift to Open-Cut Mining
The Labor Situation Revisited
34
35
2.2.4 Exports 37
2.2.5 Queensland Becomes Australia‘s Largest Black Coal Producer 39
2.2.6 Product Diversification 41
2.2.7 Port System Expansion 42
2.2.8 Rail Transport Systems 44
2.2.9 Domestic Consumption 45
2.2.10 Evolution of Mining Regulatory Frameworks 47
2.2.11 Export Contract Arrangements 50
2.2.12 Export Prices for Australian Black Coal 51
2.2.13 Establishment of the Australasian Joint Ore Reserves Committee (JORC) 53
2.3 The Competitive Phase (1987-2003) 54
2.3.1 Declining FOB Prices and International Competitiveness 54
2.3.2 Supply-Side Factors 56
2.3.3 Exchange Rate Effects 56
2.3.4 Continued Application of New Mining Technology 57
2.3.5 Changes to the Coal Industry Regulatory Framework 58
2.3.6 Industry Concentration 59
2.4 Volatile Price Phase (2004-present) 60
2.4.1 Start of Asian Coal Price Volatility 60
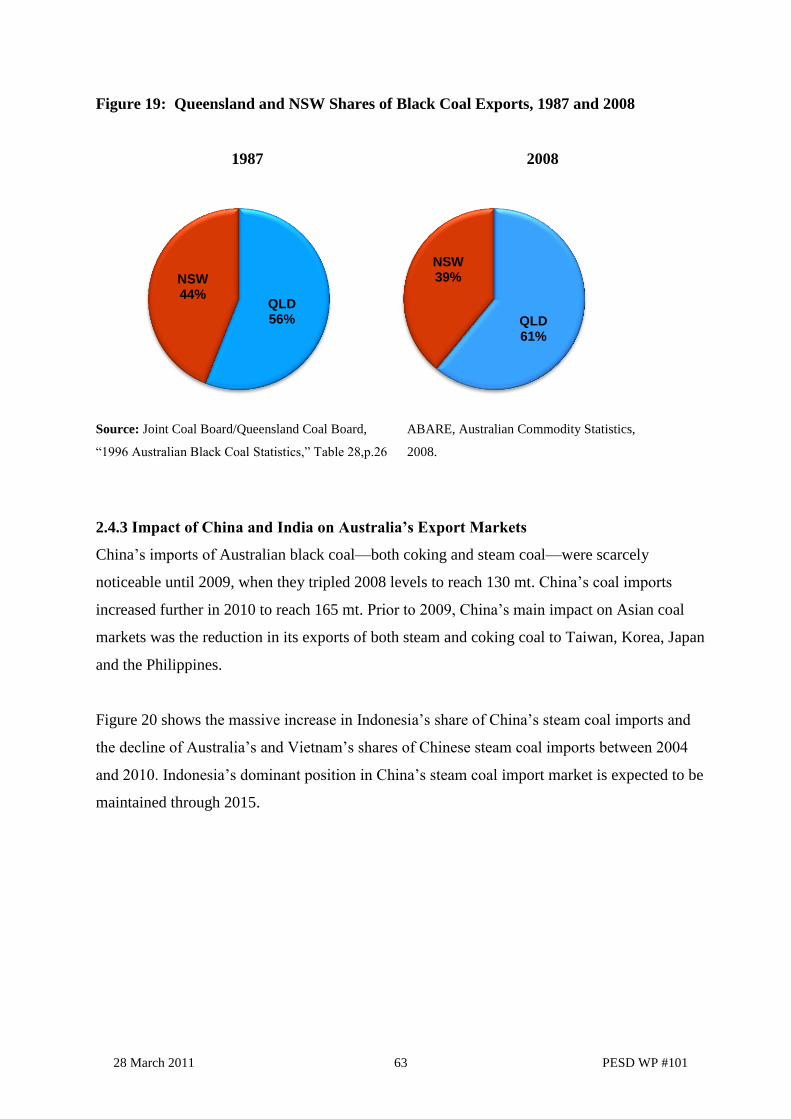
2.4.2 Exports 61
2.4.3 Impact of China and India on Export Markets 63
2.4.4 Impact of Volatile Prices on Investment Decisions 69
2.4.5 Latest Data on Industry Concentration 70
Page 6
28 March 2011 6 PESD WP #101
2.4.6 Rail Network Expansion and Privatization 72
2.4.7 Chronic Port Constraints 75
2.4.8 Domestic Consumption 76
2.4.9 Regulatory Frameworks as of January 2011 77
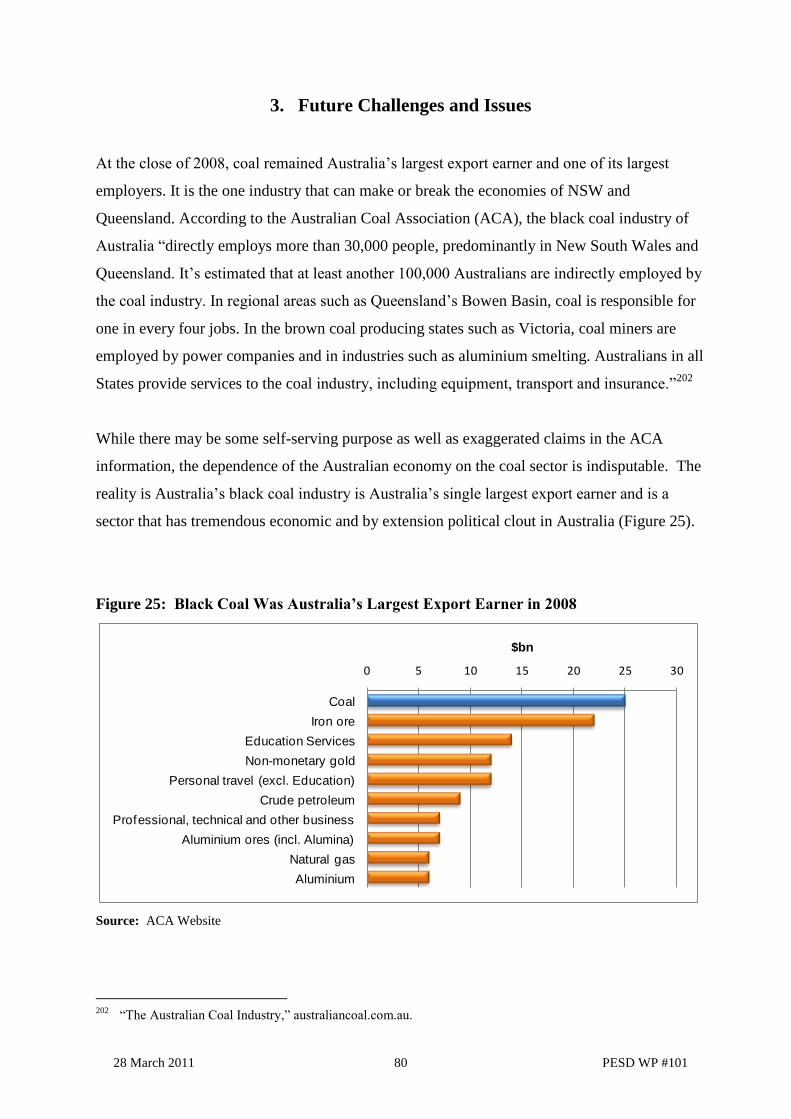
3. Future Challenges and Issues 80
3.1 Resources and Reserves Depletion 81
3.1.1 NSW Coal Resources 82
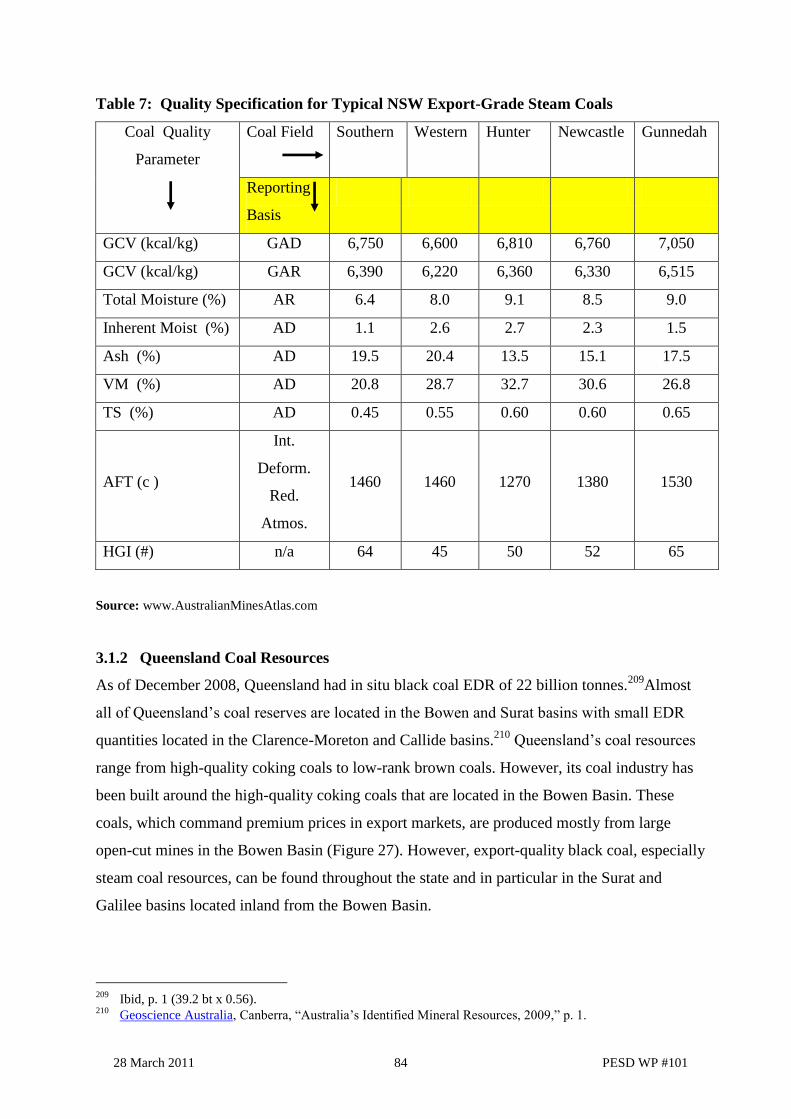
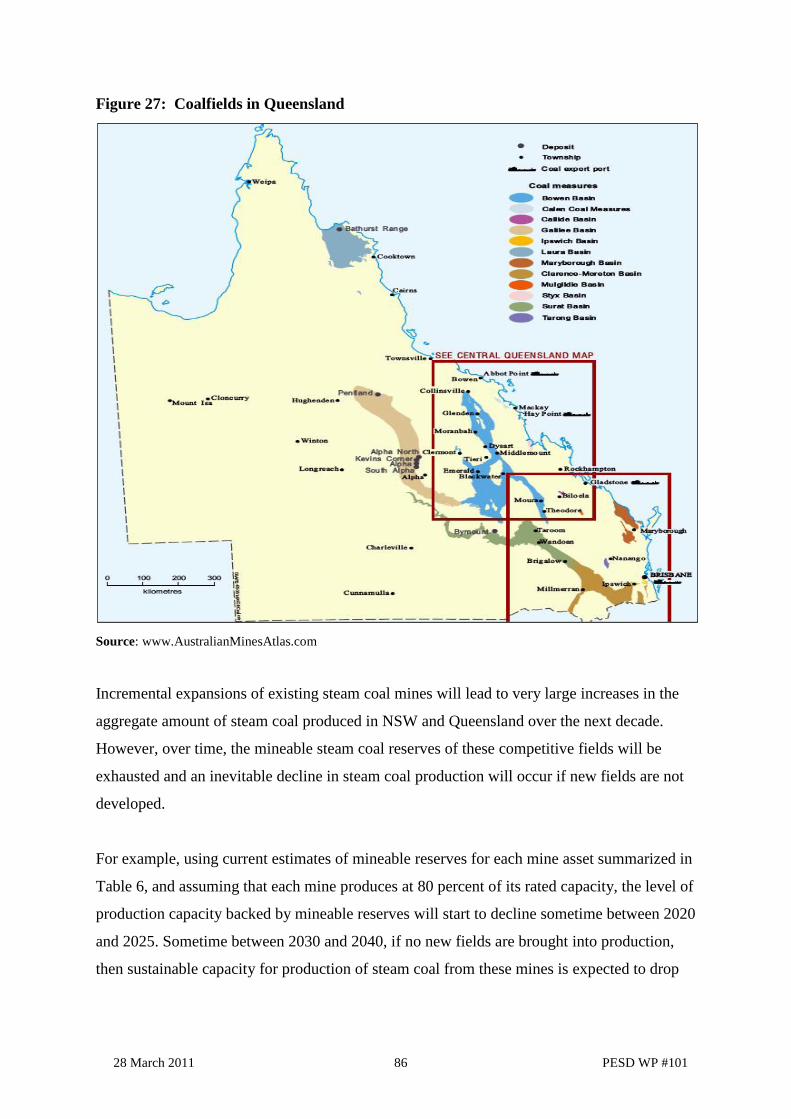
3.1.2 Queensland Coal Resources 84
3.2 Expansion of Existing Steam Coal Mines 85
3.3 Major New Coalfields Being Developed in Queensland 88
3.3.1 Surat Basin 88
3.3.2 Galilee Basin 88
3.4 Rail and Port Infrastructure Constraints 93
3.4.1 Queensland Ports and Rail Networks 94
3.4.2 NSW Ports and Rail Networks 98
3.4.3 Continuation of Chronic Port and Rail Shortages 99
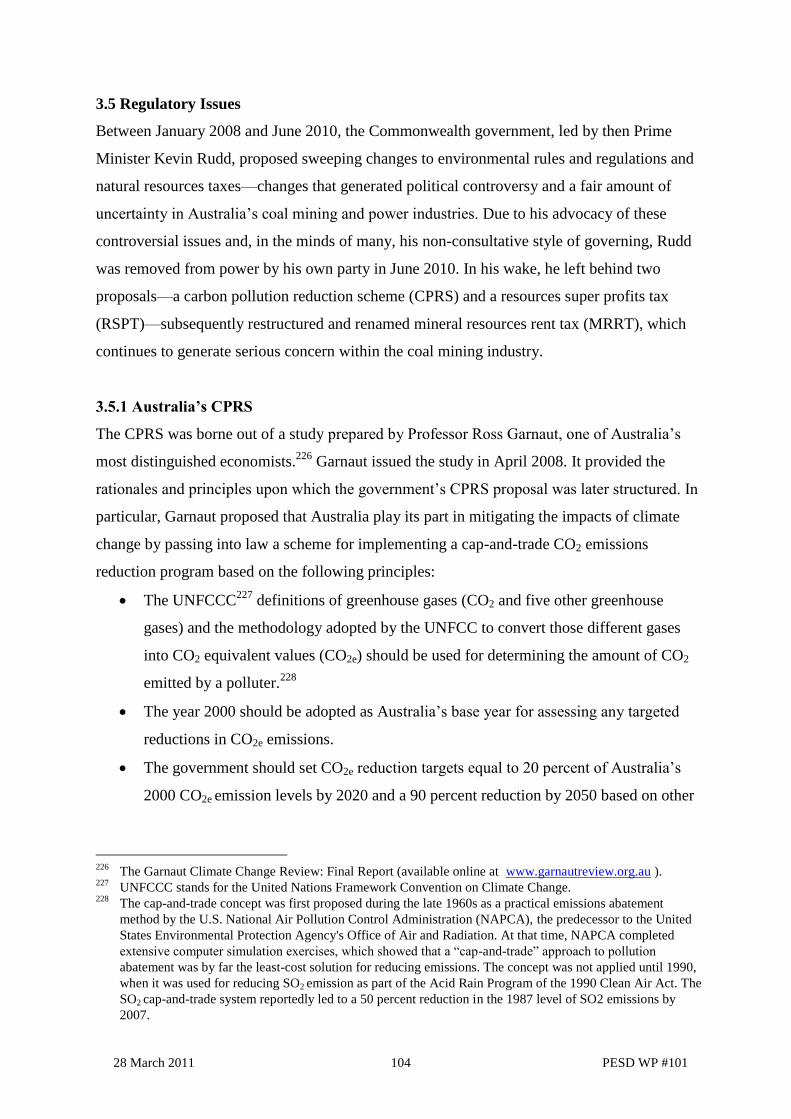
3.5 Regulatory Issues 104
3.5.1 Australia‘s CPRS 104
3.5.2 Resources Super Profits Tax/Mineral Resources Rent Tax 110
4. New Technology to the Rescue? 112
4.1 Carbon Capture and Sequestration 112
4.2 CBM as an Alternative to CCS 123
4.2.1 CBM Resources of Queensland and NSW 123
4.2.2 Role of Improved Drilling and Seismic Technology 124
4.2.3 Case Study for Arrow/Dart Energy 125
4.2.4 Environment Impacts of CBM Development 128
4.3 Underground Coal Gasification 129
4.3.1 Linc Energy 131
4.3.2 Carbon Energy 132
4.3.3 Cougar Energy 135
5. Into the Future 137
5.1 Sufficient Reserves and Resources Exist 139
5.2 But Infrastructure Constraints and Regulatory Uncertainty Are Delaying
Expansion Efforts
139
5.3 Limits to New Technology as a Tool for Reducing GHG Emissions 142
5.4 Alternative Futures 145
Bibliography 149
Page 7
28 March 2011 7 PESD WP #101
List of Figures
Figure 1 Saleable Black Coal Production 1950-2008 by State (million tonnes) 17
Figure 2 Diagram of a Bord and Pillar Mine 24
Figure 3 Joy Continuous Miners in Action 26
Figure 4
Lost Output Due to Industrial Work Stoppages at NSW Coal Mines, 1948-
1960 (in million tonnes and percent of possible production)
29
Figure 5 Share of Black Coal Consumption by Industry, 1950 and 1959 30
Figure 6 Diagram of a Longwall Mining Operation 32
Figure 7
Raw Coal Output per Manshift (in tonnes) for all Australian Black Coal Mines,
1960-1986
35
Figure 8 Lost Production (in million tonnes and percent of possible production) due to
Industrial Strife, 1960-1986
36
Figure 9 Nominal and Real Wages per Tonne of Saleable Coal Produced in A$, 1960-
1986
37
Figure 10 Exports and Domestic Coal Sales, 1960 and 1986 38
Figure 11 Queensland and NSW Shares of Black Coal Exports, 1960 and 1986 40
Figure 12 Steam Coal and Coking Coal Shares of Total Exports, 1960 and 1986 42
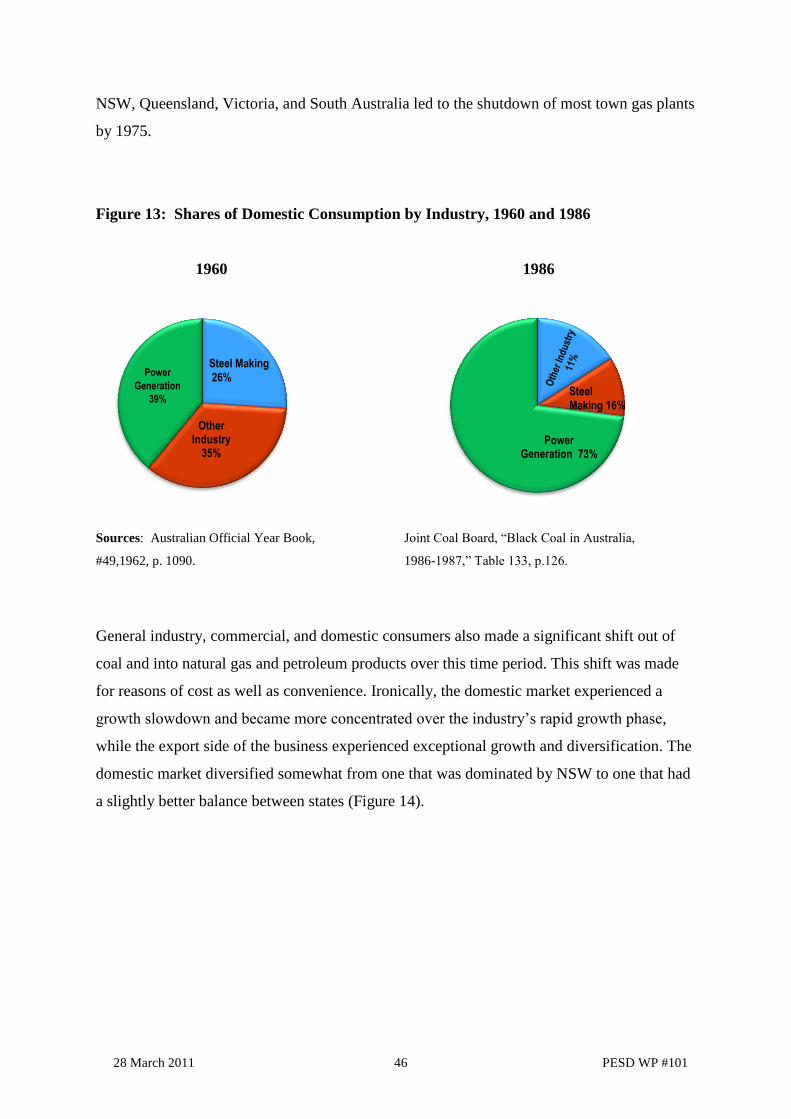
Figure 13 Shares of Domestic Consumption by Industry, 1960 and 1986 46
Figure 14 Queensland Doubled Its Share of Black Coal Consumption between 1960
and 1986
47
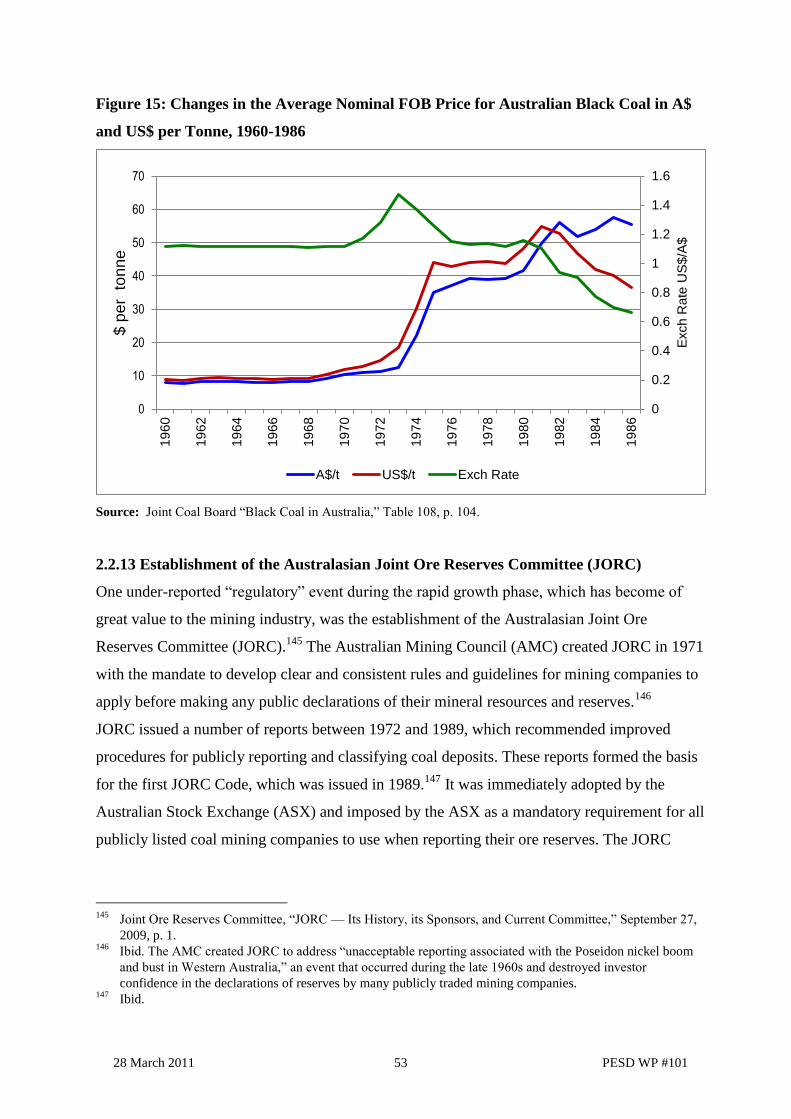
Figure 15 Changes in Average Nominal FOB Price of Australian Black Coal in A$ and
US$ per Tonne, 1960-1986
53
Figure 16 Changes in Average Nominal and Real Prices of Australian Black Coal in A$
per Tonne, 1987-2007
55
Figure 17 FOB Price Performance of Australian Black Coal Exports in A$ and US$ per
Tonne, 1987 – 2006 (average price for all exports)
57
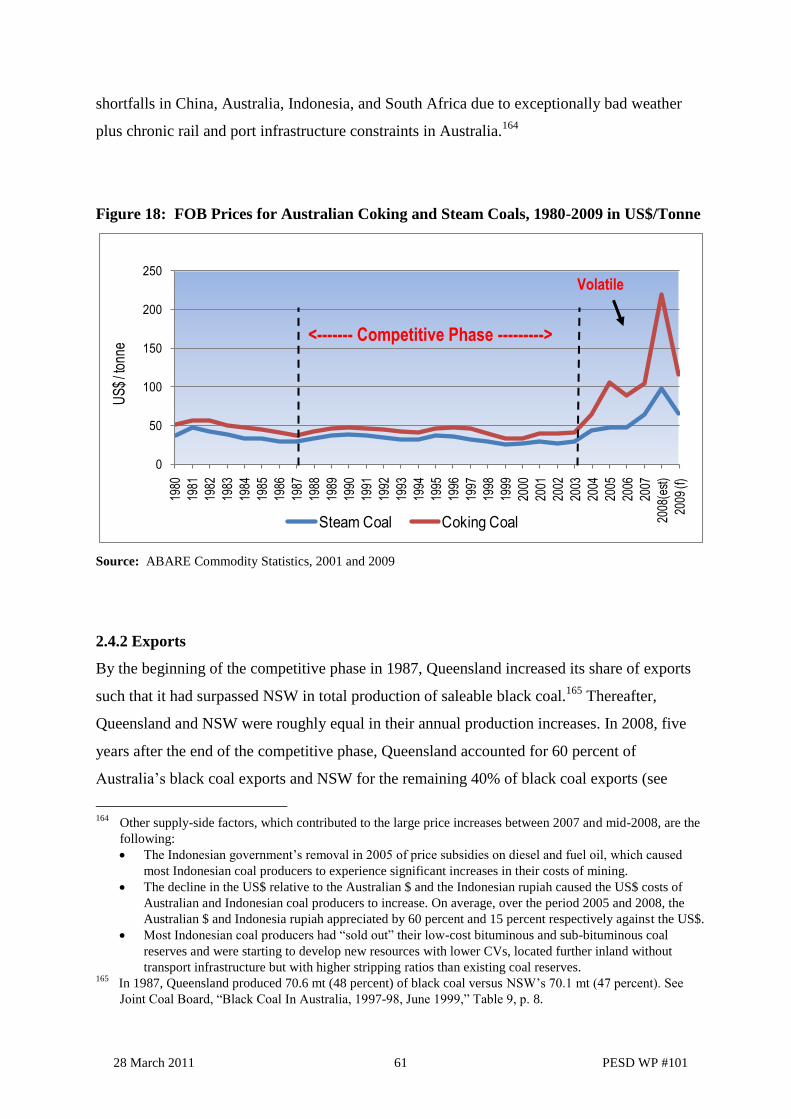
Figure 18 FOB Prices for Australian Coking and Steam Coals, 1980-2009 in US$/Tonne 61
Figure 19 Queensland and NSW Shares of Black Coal Exports, 1987 and 2008 63
Figure 20 Coal Exporter Country Shares of China‘s Steam Coal Imports 64
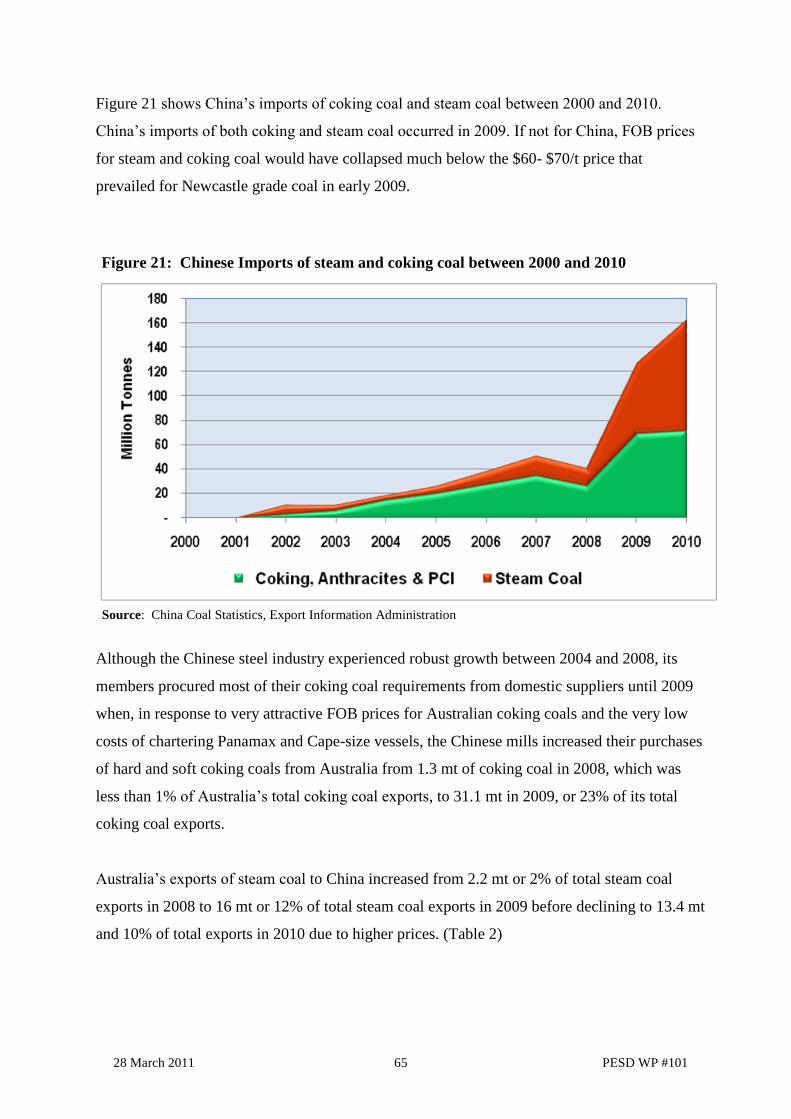
Figure 21 Chinese Imports of Steam and Coking Coal between 2000 and 2010 65
Figure 22 China‘s Steam Coal Imports and Exports, 2000-2010 (in million tones) 67
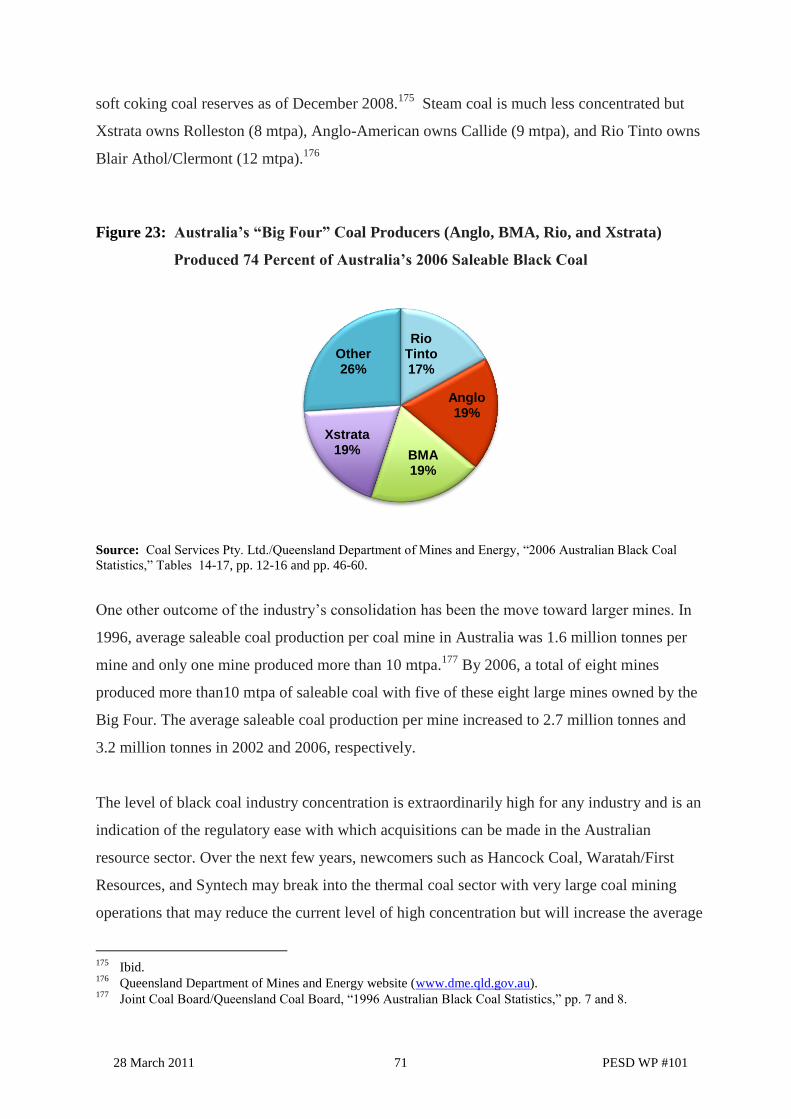
Figure 23 Australia‘s ―Big Four‖ Coal Producers (Anglo, BMA, Rio, and Xstrata)
Produced 74 Percent of Australia‘s 2006 Saleable Black Coal
71
Figure 24 Domestic Consumption of Black Coal by Industry, 1987 and 2008 77
Figure 25 Black Coal Was Australia‘s Largest Export Earner in 2008 80
Figure 26 Coal Basins, Fields and Export Ports in NSW 83
Figure 27 Coalfields in Queensland 86
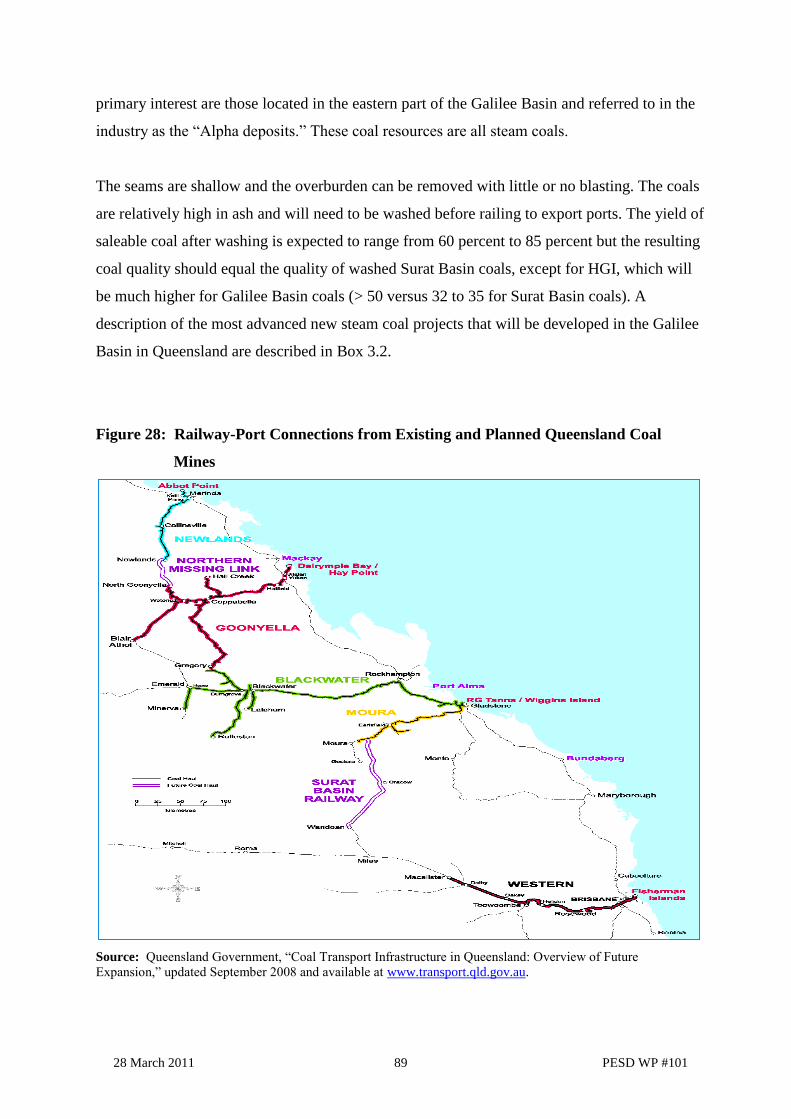
Figure 28 Railway-Port Connections from Existing and Planned Queensland Coal Mines 89
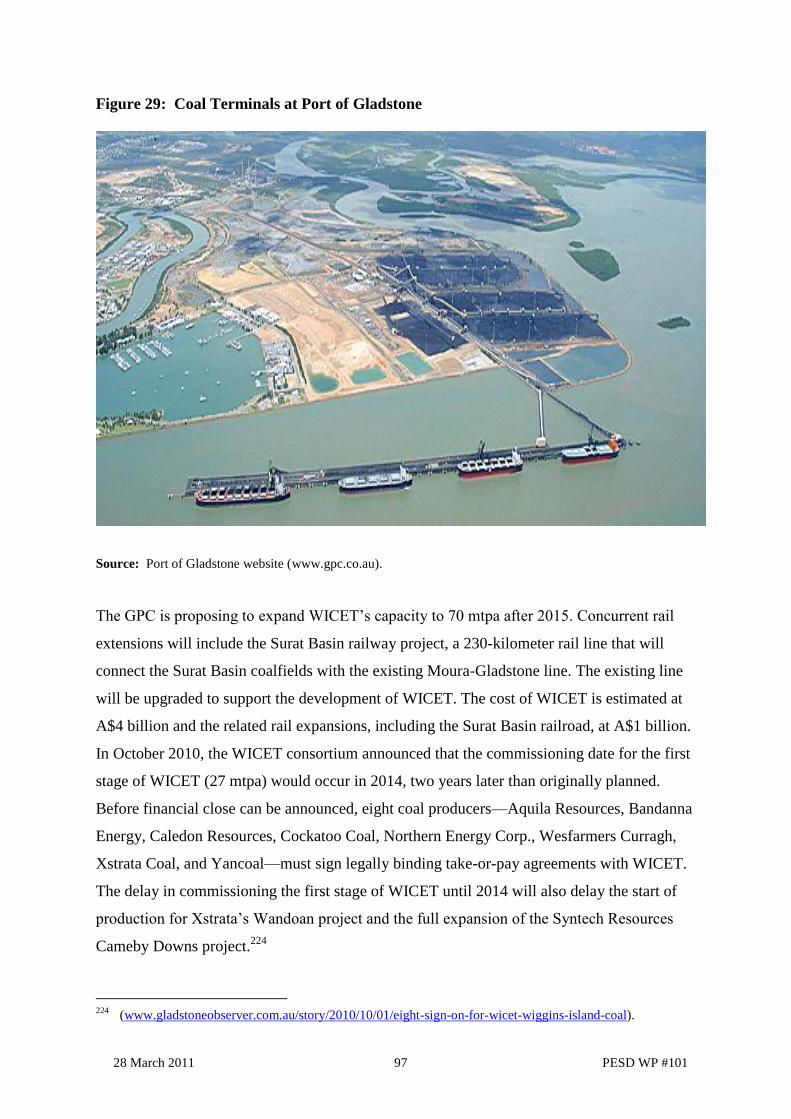
Figure 29 Coal Terminals at Port of Gladstone 97
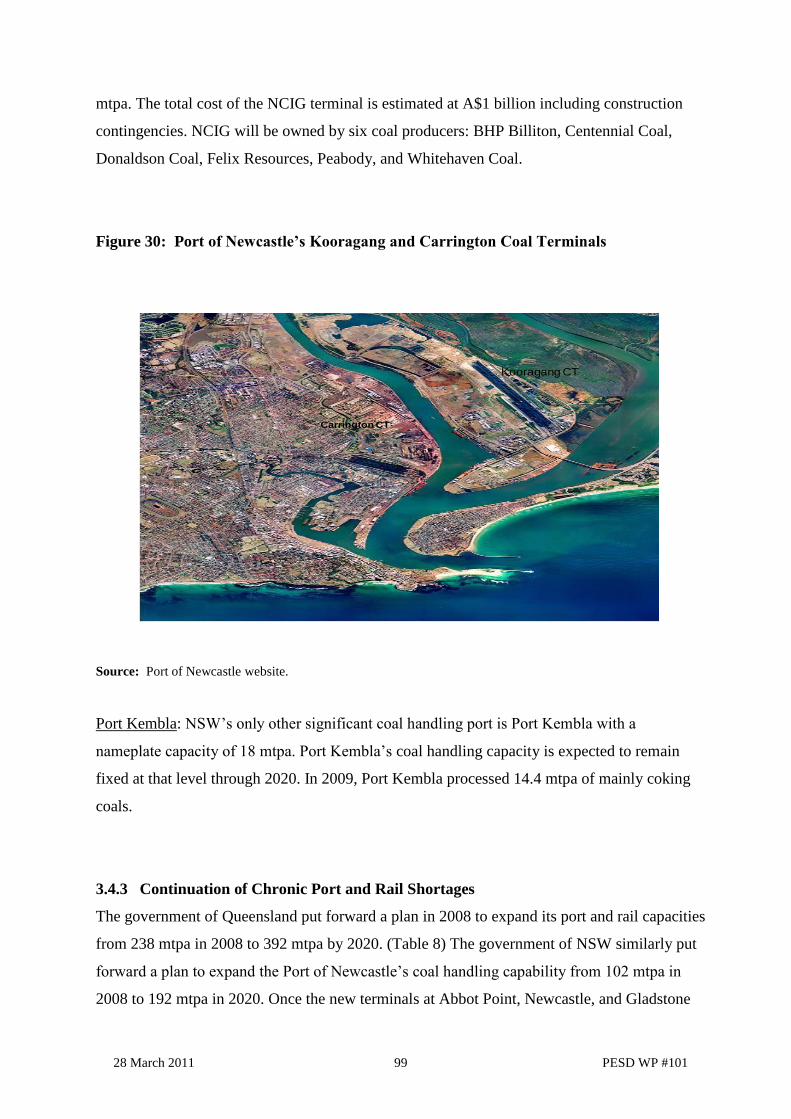
Figure 30 Port of Newcastle‘s Kooragang and Carrington Coal Terminals 99
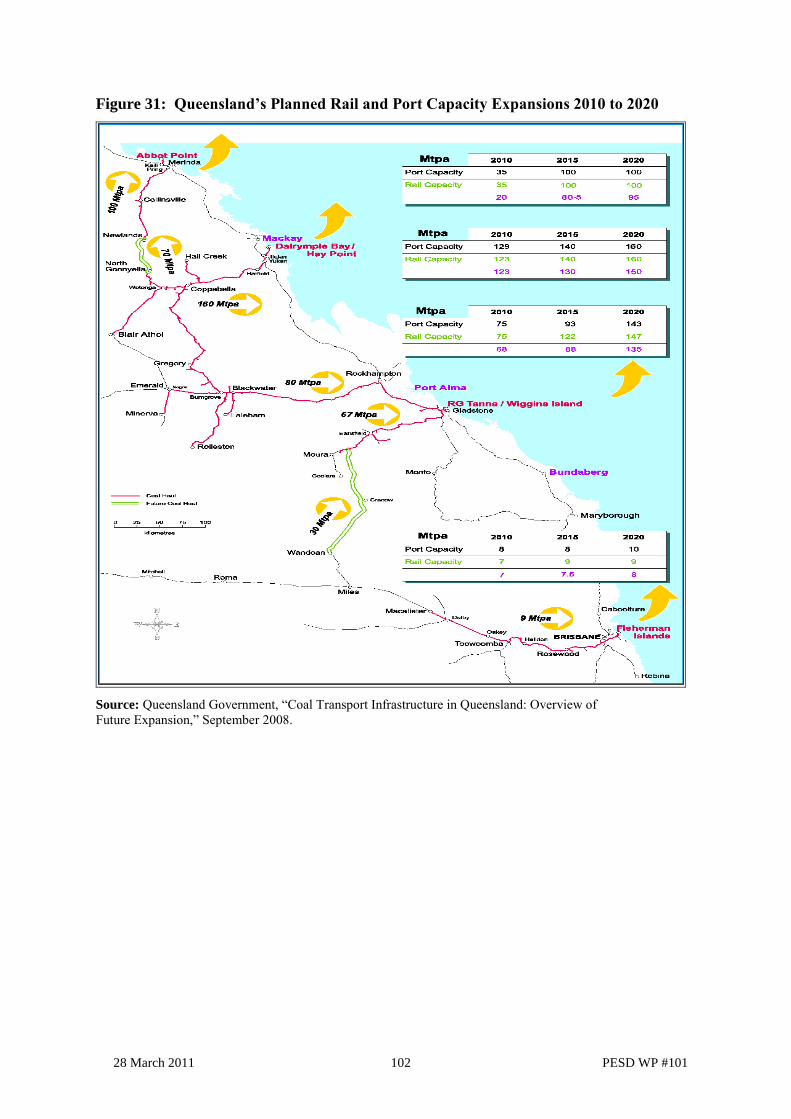
Figure 31 Queensland‘s Planned Rail and Port Capacity Expansions 2010 to 2020 102
Figure 32 Linc Energy GTL Plant in Chinchilla 132
Page 8
28 March 2011 8 PESD WP #101
List of Tables
Table 1 Handling Capacities of Major Pieces of Equipment Used in Australian
Open-Cut Mines for Overburden Removal and Coal Extraction
34
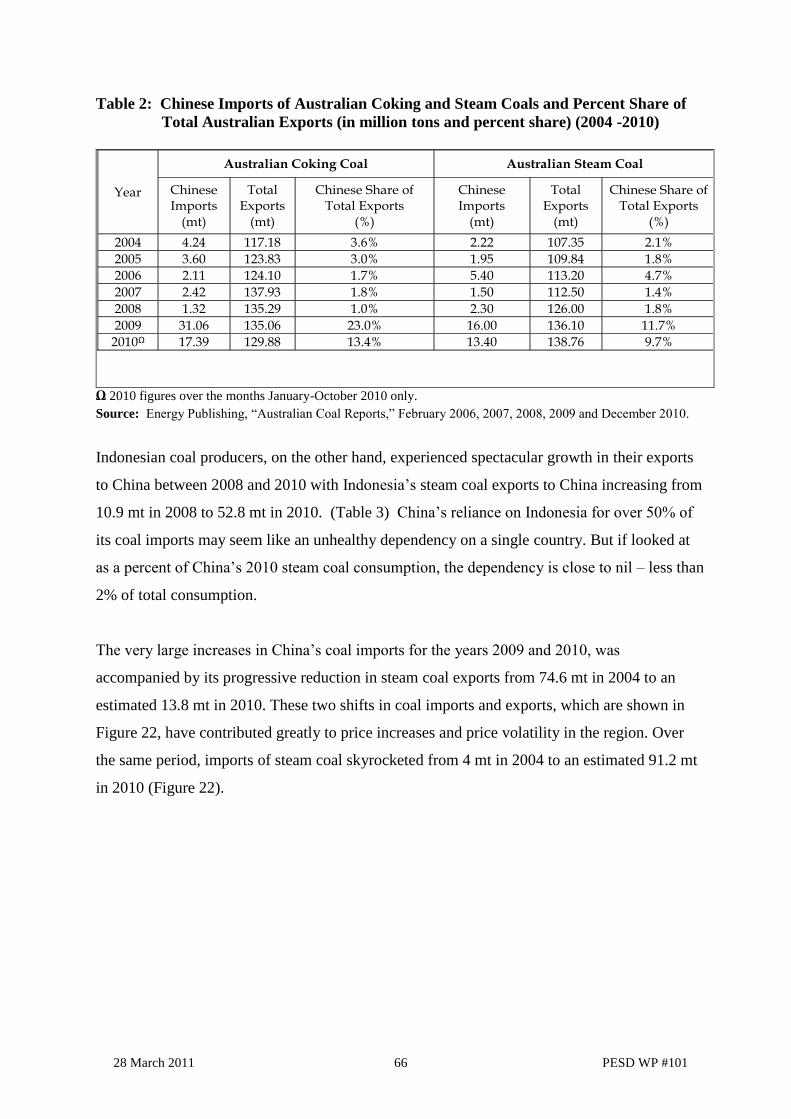
Table 2 Chinese Imports of Australian Coking and Steam Coals and Percent Share
of Total Australian Exports (in million tonnes and percent share) (2004-
2010)
66
Table 3 Chinese Imports of Indonesian Steam Coal, 2004-2010 67
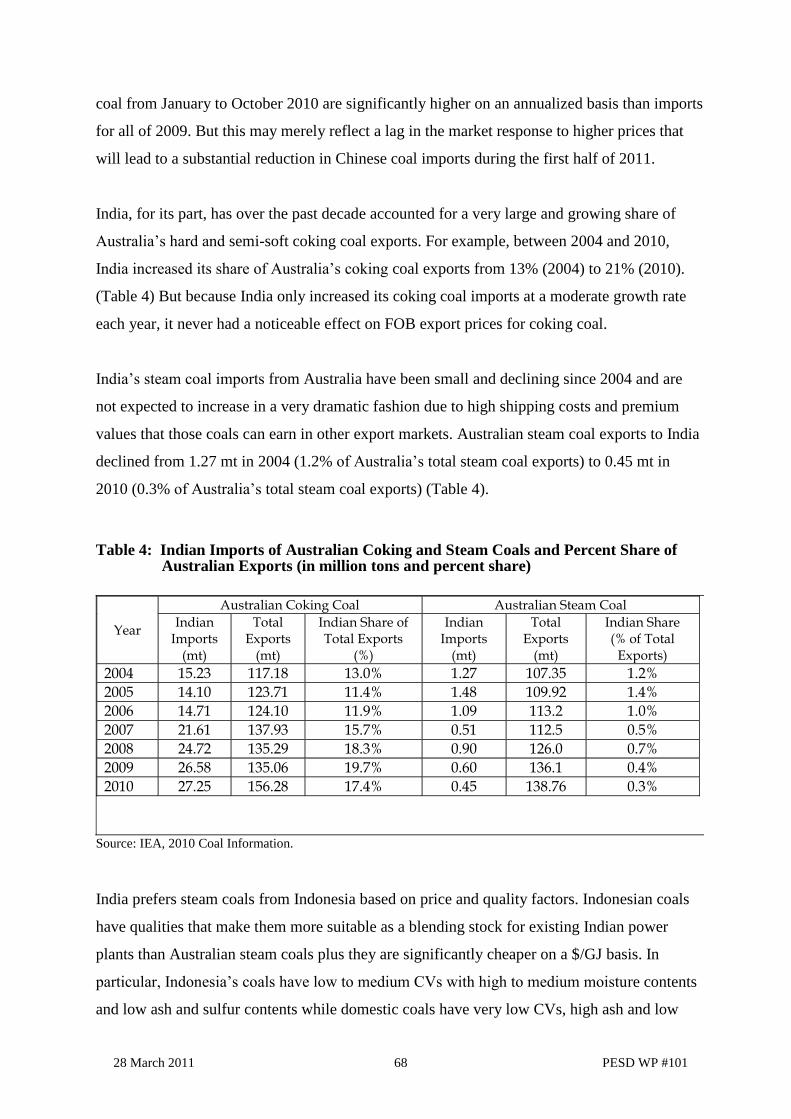
Table 4 Indian Imports of Australian Coking and Steam Coals and Percent Share of
Australian Exports (in million tones and percent share) 68
Table 5 Indian Imports of Indonesian Steam Coal, 2004-2010 69
Table 6 Australia‘s Demonstrated Coal Resources and JORC Reserves at December
2008
82
Table 7 Quality Specification for Typical NSW Export-Grade Steam Coals 84
Table 8
Forecast of Increases in Steam Coal Mining Capacity Due to Expansion of
Existing Mines in NSW and Queensland, 2010-2040 87
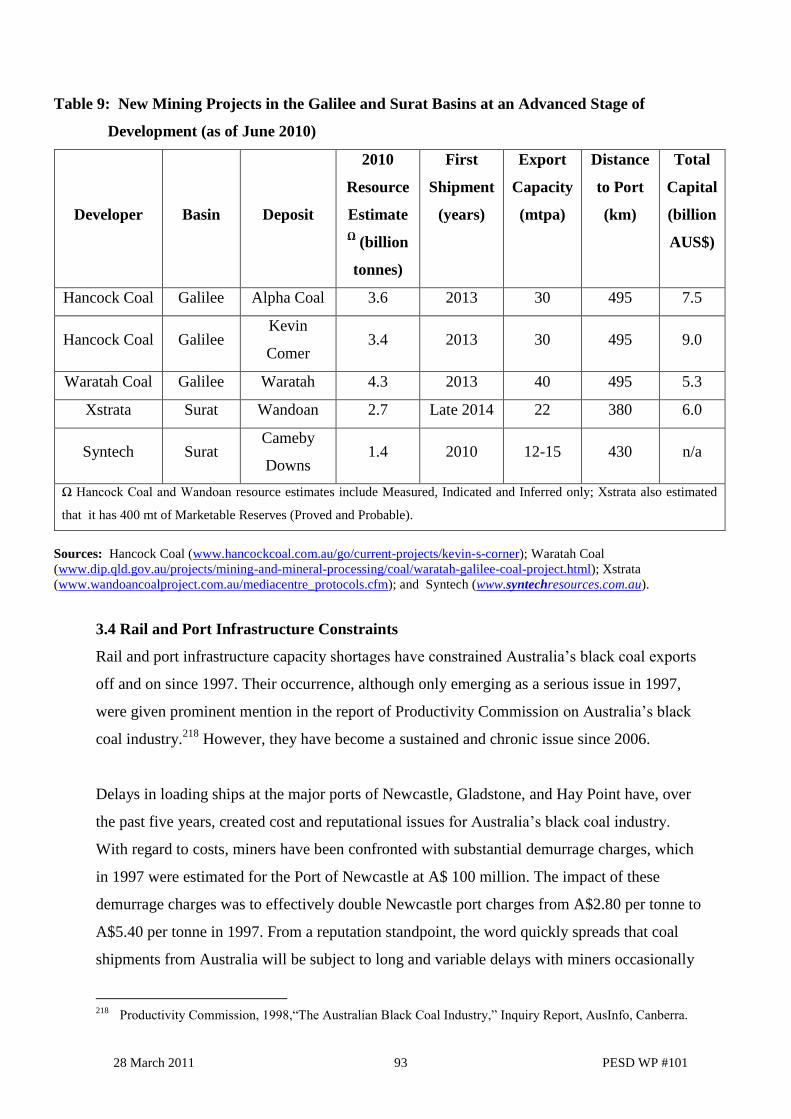
Table 9 New Mining Projects in the Galilee and Surat Basins at an Advanced Stage
of Development (as of June 2010)
93
Table 10 Nameplate Capacity Forecasts for Major Coal Handling
Terminals at Ports Located in NSW and Queensland
103
Table 11 CCS Technology: Potential versus Risks 120
Table 12 Impact of MEA Carbon Capture System w/90 Percent CO2 Capture on Cost
and Technical Performance of an Existing Coal–Fired Power Plant
121
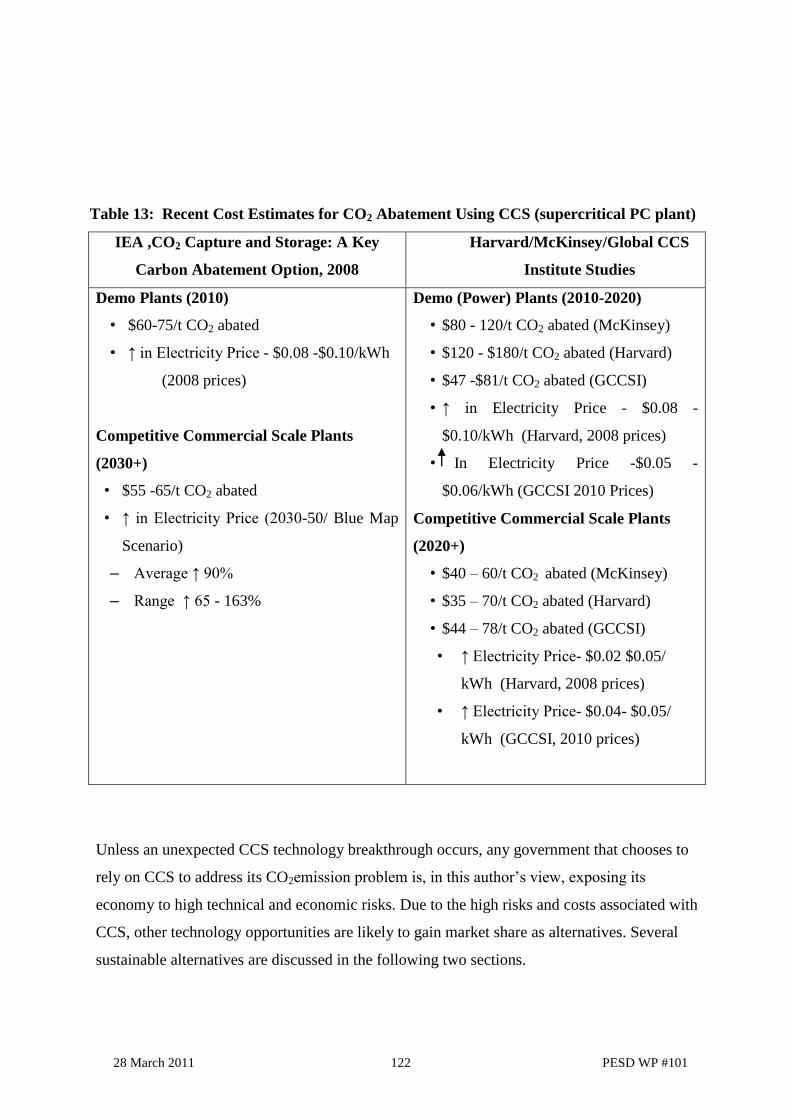
Table 13 Recent Cost Estimates for CO2 Abatement Using CCS (supercritical PC
plant)
122
Table 14 Growth in Dart‘s CBM Resources, Reserves, and Production, FYs 2006-
2009
127
List of Boxes
Box 1.1
Box 3.1 Coal Definitions and Terminology
Surat Basin Projects
12
90
Box 3.2 Galilee Basin Projects
91
Page 9
28 March 2011 9 PESD WP #101
Australia’s Black Coal Industry:
Past Achievements and Future Challenges
Bart Lucarelli
Abstract: This paper reviews the technical, economic, political, and regulatory factors that
have shaped the black coal industries of Queensland and New South Wales (NSW) over the
post-WWII period. It also assesses the factors which are expected to shape the black coal
industries of Queensland and NSW over the next 20 years. Its purpose is to document the
critical challenges facing the black coal industries of Queensland and NSW and describe the
likely futures that might emerge from the resolution of those challenges over time.1
1 The author would like to thank the following individuals for their assistance in preparing this paper: Richard
Morse of PESD for conducting multiple reviews of earlier drafts of this paper and offering very insightful
comments and suggestions that greatly improved the quality of this paper; Mark Thurber also of PESD for the
very detailed comments that he provided to an early draft of this paper; Mike Friederich, a consulting coal
geologist from Brisbane, Australia, who provided many insights into the coal mining industries of both
Queensland and NSW; Pat Markey, chief operating officer for globalCOAL for his very helpful review of
earlier drafts of the paper; Cliff Mallett of Carbon Energy for arranging a visit to Carbon Energy‘s
Bloodworth UCG demonstration site in Queensland; and Rhonda Dublewicz, Carol Mische, Peter Thurgood
and James Belov at Coal Services Pty. Ltd. for providing information on coal production, exports and
domestic consumption, labor productivity and other measures of performance for Australia‘s black coal
industry for the period 1947 through 2008.
Page 10
28 March 2011 10 PESD WP #101
1. Introduction
1.1 Background
Any discussion of Australia‘s black coal industries must focus on the coal industries of
Queensland and New South Wales. There are good reasons for focusing on only those two
states.2 Ninety-six percent of Australia‘s economically recoverable black coal resources of 39.2
billion tonnes (bt)—commonly referred to in Australia as economic demonstrated resources or
EDR—are located in Queensland (56 percent) and New South Wales (40 percent). Almost all
of Australia‘s production and 100 percent of its black coal exports came from those two states
in 2008.3
Moreover, Australia‘s state governments are given wide control over the planning,
development, extraction, and sale of coal and other mineral resources. They also have
regulatory control over the rail and port industries that provide the inland transport services for
moving coal to both domestic and export customers.4 In short, Australia‘s state governments
are the nexus where public-private interfaces occur and the states of New South Wales (NSW)
and Queensland are where all the black coal is. This paper, therefore, focuses on the black coal
industries of Queensland and New South Wales (NSW), which we refer to collectively as the
―Australia‘s black coal industry.‖5
Although the paper‘s focus is on the steam coal industry, in the case of Australia, the current
structure and the past development history of Australia‘s black coal industry do not allow one
to separate the steam coal segment of the industry from its coking coal sibling. The
interrelationships between these two industry segments are simply too strong to be ignored.
2 Black coal is defined as all coals with a rank of bituminous and anthracite, whether used for generating steam
for generating electricity and process heat for industry or for making iron and steel. 3 Source: Geoscience Australia Canberra, ―Australia‘s Identified Mineral Resources, 2009,‖ Table 1, p. 5 and
pp. 14-15. Geoscience Australia also claims that Australia has 6 percent of the world‘s recoverable black coal
EDR in 2008 and ranks sixth behind the United States (31 percent), Russia (21 percent), China (13 percent),
India (8 percent), and South Africa (7 percent). Geoscience Australia also ranks Australia as the fourth largest
producer of black coal in 2008 behind China (45 percent), United States (18 percent), and India (8 percent). 4 The one notable exception to this statement is the regulation of greenhouse gas emissions, which may
eventually be regulated under a scheme known as the carbon pollution reduction scheme (CPRS) that the
current Labor-controlled Commonwealth (national) government hopes to eventually pass into law and
mining sector taxes. These two topics are covered in a later section of this paper. 5 Australia also has a sizable brown coal industry, which is located in the state of Victoria. Geoscience
Australia estimates brown coal EDR at 37.2 billion tonnes, representing a resource life of 490 years at 2008
production levels. (Source: Geoscience Australia, Canberra, ―Australia‘s Identified Mineral Resources,‖
2009, p. 21.) Australia‘s brown coal industry and its CO2 emissions problem are not discussed in this article
but clearly worthy of a separate paper on the issue of brown coal utilization and its future in a carbon
constrained world.
Page 11
28 March 2011 11 PESD WP #101
In particular, development of the large coking coal deposits of the Bowen Basin in Queensland
and the Hunter Valley in NSW were found to be the driving force behind the industry‘s export-
led expansion during the period 1950-1985. The development of the massive Bowen Basin and
Hunter Valley coking coal deposits was accompanied by large investments in related rail and
port infrastructure that, between 1980 and 2000, supported the rapid development of steam
coal deposits in both states. In short, Australia would not at this time have a steam coal
industry of such scale and capability without the initial development of the coking coal
industries of NSW and Queensland (see Box 1 for definitions of coal types covered in this
paper).
Most industry analysts are forecast that over the next 20 years, steam coal will drive the future
growth of Australia‘s black coal industry due to its abundant supply and the fast-growing
demand for steam coal as the least cost fuel for power plants throughout Asia. However, new
technologies, such as improved methods for identifying, developing, and collecting coal bed
methane (CBM) and processes for converting solid coal in situ into a gaseous fuel through a
process known as underground coal gasification (UCG), have the potential to radically alter
these forecasts. Large-scale application of these advanced coal-to-energy technologies may
have other far reaching benefits for Australia‘s black coal industry such as a reduction in the
aboveground, visual and land use impacts in comparison with traditional open-cut and
underground mining processes.
In time, these advanced coal-energy extraction methods may provide Australia‘s black coal
industry with a much needed diversification of both sources of supply as well as the types of
energy products produced from Australia‘s black coal resources.6 Indeed, both regulatory and
technical factors—both within and outside of Australia—may reshape Australia‘s black coal
industry over the next two decades in much the same way that the Industrial Revolution of the
18th and 19th centuries led to the widespread use of coal in the UK, Europe, and the United
States.7
6 For example, CBM and UCG may shift the mix of energy products derived from Australia‘s black coal
resources from solid fuel products to gaseous and liquid fuels. This move away from solid fuel emphasis to a
mix of gases, liquids, and solid fuels may be encouraged by both domestic and international policies for
reducing greenhouse gas (GHG) emissions and increased sensitivity of local communities to the
environmental (visual, water, and air) impacts of open-cut mining.
7 The author intends to publish a longer monograph of this paper, which will include historical details for the
period 1797 to 1947.
Page 12
28 March 2011 12 PESD WP #101
Box 1.1: Coal Definitions and Terminology
Black coal resources and reserves are classified in this paper largely according to definitions
adopted by the Australia‘s coal industry and its Commonwealth and state governments, which
classify bituminous, anthracite, and sub-bituminous coals as black coals with lignite grade
coals classified as brown coals.8 Black coals are used for a larger variety of applications.
Power generation is by far the largest of those end uses, accounting for more than 85 percent of
total domestic consumption of black coal in 2008.9
In a departure from nomenclature adopted by ABARE (Australian Bureau of Agricultural and
Resource Economics) and other Australian government entities, black coals used in the steel
making industry and for making coke are referred to as coking coals (sometimes also called
metallurgical coals) of which there can be three primary types: hard coking coals, soft coking
coals, and semi-soft coking coals.
A fourth type of coal used in the steel making industry is known as PCI (pulverized coal
injection) coal. PCI coals are low volatile matter steam coals without coking properties. As
such they have qualities that make them very similar to steam coals. However, PCI coals are
used primarily for steel making (for which they earn a premium), and due to their low volatile
contents, they are not preferred coals for generating power. The production and sales of PCI
coal tend to be classified under the coking coal category. Coals used in the power and other
industries for raising steam are referred to as steam coals as opposed to either thermal or
steaming coal, which are the names used by ABARE and Coal Services Pty., Ltd.,
respectively. The terms adopted in this paper are consistent with International Energy Agency
(IEA) terminology for such coals.
8 Brown coals, which are not discussed in this paper, have very low energy contents — less than 4200 kcal/kg
(gar) and either very high ash contents (>30 percent) or very high moisture contents (>35% and <60 percent),
which have in the past made them unacceptable coals in most if not all export markets. Brown coals are used
mostly for generating electricity in Australia with a small amount used for making briquettes. In addition to
following the above-mentioned coal rank terminology, coal producers in Australia report their resources and
reserves according to JORC 2004, which is short for ‖The Australasian Code for Reporting of Exploration
Results, Mineral Resources and Ore Reserves: The JORC Code, (2004 edition).‖ The organization that issues
the JORC Code also provides updated guidelines on applying the JORC Code to specific cases. These
updates as well as the original 2004 JORC Code are available online from www.jorc.org. 9 Data supplied to the author by Carol Mische of Coal Services Pty., Ltd. by e-mail in 2010 prior to publication
of ―2008 Australian Black Coal Statistics.‖
Page 13
28 March 2011 13 PESD WP #101
Black coal statistics for Australia are expressed in a number of distinct ways. The first figure
usually cited is raw coal or run-of-the-mine production. Raw coal refers to coal as it is
produced at the mine site before washing and other methods of beneficiation. After washing
and beneficiation, coal is then classified as ―saleable black coal,‖ which in any particular year
can be exported, sold into the domestic market, or added to end of the year stocks at the mine
site, export ports, or the sites of domestic customers. In this paper, all references to coal
production are to saleable coal production unless otherwise noted as raw coal production.
1.2 Organization of Paper
This paper has four sections.
1.2.1 Post-WWII History of Australia’s Black Coal Industry
(1948-2009) discusses the technical, economic, price, and regulatory factors that have
influenced the development of Australia‘s black coal industry from 1948 to 2008.
1.2.2 Future Challenges and Issues reviews four critical issues that the paper argues will
largely determine the future size and structure of Australia‘s black coal industry:
1) The availability of economic demonstrated reserves, or EDR, in Queensland and NSW
to support continued growth of Australia‘s black coal exports, with specific
consideration of new coal resources proposed for development in the Surat and Galilee
coal basins in Queensland and the Gunnedah Basin in NSW.
2) The likelihood that Queensland and NSW will overcome transportation infrastructure
constraints and succeed in increasing future steam coal exports through the timely and
cost-effective expansions of their rail and port systems.
3) The impact on Australia‘s black coal industry of the evolving legal and regulatory
frameworks of NSW and Queensland, most significantly the Commonwealth
government‘s proposed carbon pollution reduction scheme (CPRS) and its proposed
mineral resources rent tax (MRRT).
1.2.3 New Technology to the Rescue? analyzes how key new technologies might respond to
the major challenges facing Australia‘s coal industry:
Page 14
28 March 2011 14 PESD WP #101
1) The impacts that new technologies such as carbon capture and sequestration (CCS),
coal bed methane (CBM) extraction and underground coal gasification (UCG) might
play in altering the future development of Australia‘s black coal industry and the mix of
energy products produced from Australia‘s black coal resources.10
1.2.4 Into the Future synthesizes the above analyses and offers two alternative black coal
futures for Australia with some commentary about likely changes to the structure of the coal
industry and new energy products that may be available from Australia‘s black coal industry
over the next two decades.
10
Recent technological advances for finding and extracting coal bed methane (CBM) deposits allow for the
economic extraction of gaseous fuels from steam coal deposits, which are either ―at depth,‖ i.e., depths that
are not economically feasible to mine either by open-cut or underground mining methods, or are located very
far from existing rail and port infrastructure. Underground coal gasification (UCG) is experiencing a similar
degree of technological advance, which may lead to a restructured black coal industry in which the mix of
energy products will shift from multiple solid fuel products to a mix of solid, gaseous, and liquid fuels and
where the extractable energy resource base can be increased by a factor of three or more.
Page 15
28 March 2011 15 PESD WP #101
2. Post-WWII History of Australia’s Black Coal Industry (1948-2009)
The history of Australia‘s black coal industry can be conveniently broken into (a) the early
years period, which starts in 1797 and ends in 1947, and (b) the post-WWII period, which
starts in 1948 and ends in 2009. This paper focuses on the post-WWII period and analyses the
history of Australia‘s black coal industry as four discrete development phases:
The Recovery Phase (1948-1959)
The Rapid Growth Phase (1960-1986)
The Competitive Phase (1987-2003)
The Volatile Price Phase (2004-present)
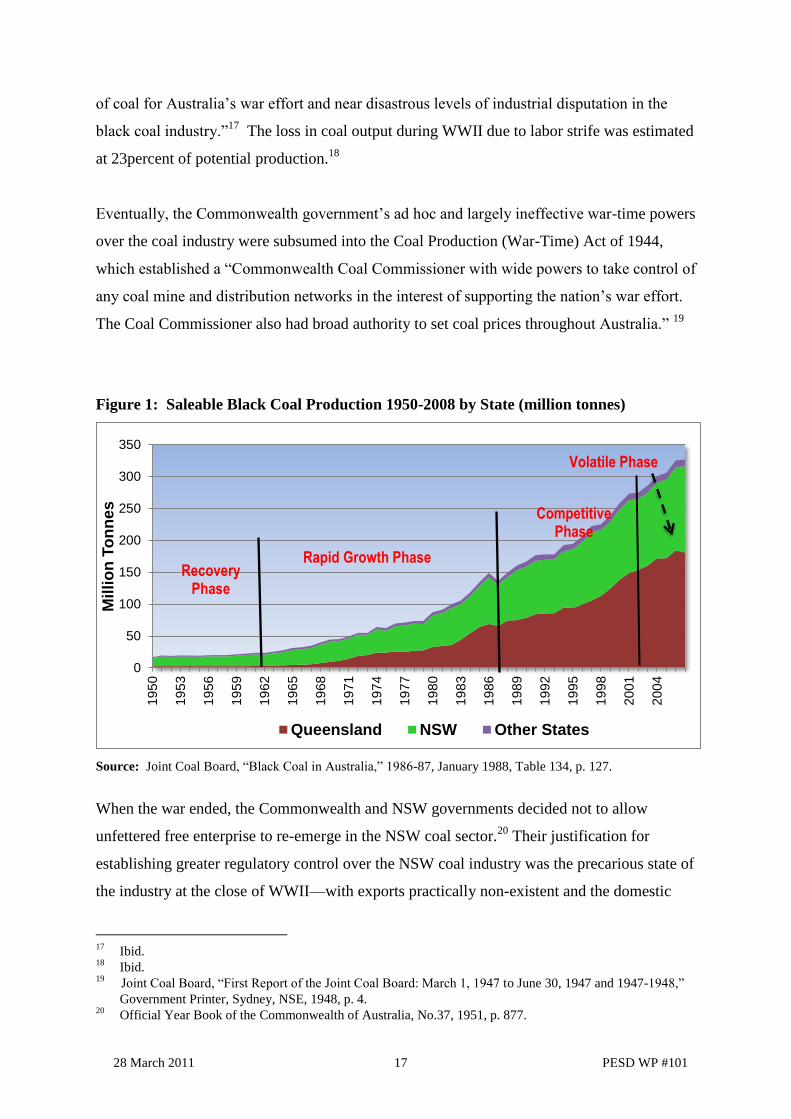
Figure 1 presents the annual saleable black coal production levels for Queensland, NSW, and
other states over the post-WWII period for each of the four development phases.11
Between
2004 and the present, black coal prices have entered a new phase, which for lack of a better
term, is referred to as the volatile price phase, because it has been categorized thus far by
chronic transportation infrastructure shortages, higher costs of extraction and transport, strong
demand for steam coal from China and India, and severe price volatility. This phase is
expected to continue until at least 2015.
2.1 The Recovery Phase (1948-1959)
The recovery phase of the post-WWII period was a time when the Australian black coal
industry transformed itself from an inefficient and unreliable supplier of coal into an industry
that would eventually become the world‘s largest and most efficient exporter of high-quality
coking and steam coal. Prior to WWII, Australia‘s black coal industry was thoroughly
dominated by the coal industry of NSW. In those days, regulations were few and those that did
exist were either weakly enforced or ignored by industry and labor unions. The result was cut-
throat competition and frequent strikes and other acts of industrial strife that led to frequent
11
Most of the production and export data referred to in this paper have been obtained from official reports
published by Coal Services Pty. Ltd. and its predecessor, the Joint Coal Board. The data provided are fiscal
year data. For the sake of brevity, each FY is expressed as the starting year of that fiscal year. As an example,
FY 1960/1961 is referred to as 1960. The latest Coal Services Pty. Ltd. coal statistics report covers FY
2008/2009.
Page 16
28 March 2011 16 PESD WP #101
disruptions in NSW‘s black coal supplies and eventually the destruction of its budding coal
export business.12
2.1.1 Increased Regulatory Control
During WWII, the Commonwealth government passed a number of laws with the objective of
ensuring a reliable supply of coal in support of the war effort.13
As part of these legislative
initiatives, the Commonwealth government created the Commonwealth Control Board (Feb
1941) to resolve labor-management disputes at an early stage. This commission was apparently
a failure as it was soon replaced by the Conciliation Commission in November 1941.14
In May 1942, the Commonwealth government convened a special conference in Canberra with
mine owners and labor unions representing coal miners as participants. The attendees agreed to
protocols for resolving labor-management differences. The resulting agreement, known as the
Canberra Code, included commitments from all parties to settle disputes amicably without
engaging in strikes. It did not hold up. Shortly after signing the Canberra Code, new labor
disputes occurred at frequent intervals, leading to significant disruptions of coal supply to
industry. The growing number of management-labor disputes was partly due to the
fragmentation of the Miner‘s Federation, which controlled the labor force in the black coal
industry. During the war years, this union was divided into communist and non-communist
factions, which attempted to outdo each other with respect to their salary and other demands.15
The Commonwealth and state governments did not help matters by largely conceding to the
demands of the unions in the interest of ending strikes and keeping the coal supply flowing.
Reasonable government concessions, such as the establishment of a miner‘s pension fund and
rescinding prior penalties imposed on striking miners, were viewed by the unions as a sign of
weakness and only served to encourage the unions to engage in more work stoppages.16
Despite the Commonwealth government‘s many good faith efforts to resolve labor disputes in
the coal industry amicably, the WWII period was one ―characterised by near critical shortages
12
See Shaw, A.G.L., and G.R. Bruns, ―The Australian Coal Industry,‖ Melbourne University Press, 1948, pp.
1-3 and Joint Coal Board, ―First Report of the Joint Coal Board: March 1, 1947 to June 30, 1947 and 1947-
1948,‖ Government Printer, Sydney, NSE, 1948, pp. 6-7. 13
Productivity Commission, 1998, ―The Australian Black Coal Industry‖ Inquiry Report, AusInfo, Canberra,
vol. 2, Appendix E, p. E2 and Box E-1, p. E-3. 14
Ibid. 15
Ibid. 16
Ibid.
Page 17
28 March 2011 17 PESD WP #101
of coal for Australia‘s war effort and near disastrous levels of industrial disputation in the
black coal industry.‖17
The loss in coal output during WWII due to labor strife was estimated
at 23percent of potential production.18
Eventually, the Commonwealth government‘s ad hoc and largely ineffective war-time powers
over the coal industry were subsumed into the Coal Production (War-Time) Act of 1944,
which established a ―Commonwealth Coal Commissioner with wide powers to take control of
any coal mine and distribution networks in the interest of supporting the nation‘s war effort.
The Coal Commissioner also had broad authority to set coal prices throughout Australia.‖ 19
Figure 1: Saleable Black Coal Production 1950-2008 by State (million tonnes)
Source: Joint Coal Board, ―Black Coal in Australia,‖ 1986-87, January 1988, Table 134, p. 127.
When the war ended, the Commonwealth and NSW governments decided not to allow
unfettered free enterprise to re-emerge in the NSW coal sector.20
Their justification for
establishing greater regulatory control over the NSW coal industry was the precarious state of
the industry at the close of WWII—with exports practically non-existent and the domestic
17
Ibid. 18
Ibid. 19
Joint Coal Board, ―First Report of the Joint Coal Board: March 1, 1947 to June 30, 1947 and 1947-1948,‖
Government Printer, Sydney, NSE, 1948, p. 4. 20
Official Year Book of the Commonwealth of Australia, No.37, 1951, p. 877.
0
50
100
150
200
250
300
350
19
50
19
53
19
56
19
59
19
62
19
65
19
68
19
71
19
74
19
77
19
80
19
83
19
86
19
89
19
92
19
95
19
98
20
01
20
04
Mil
lio
n T
on
nes
Queensland NSW Other States
Rapid Growth Phase
Competitive Phase
Recovery Phase
Volatile Phase
Page 18
28 March 2011 18 PESD WP #101
power, town gas, rail transport, steel making, and cement industries clamoring for a more
reliable and lower cost supply of coal. Coal shortages after WWII were expected to have
serious adverse effects on Australia's post-war reconstruction, which depended heavily on
adequate supplies of iron and steel products, building materials, and transport.21
To address these concerns, the Commonwealth government passed the Coal Industry Act
(No.40 of 1946) and the NSW government passed the Coal Industry Act (No. 44 of 1946).
Both laws took effect in 1946 and are commonly referred to as the joint acts. Under the joint
acts, the Commonwealth and NSW governments established the Joint Coal Board (JCB) and
the Coal Industry Tribunal (CIT), which was given broad powers to determine wage levels and
working conditions ―for the majority of employees in the NSW black coal industry, as well as
Queensland and Tasmania by virtue of the Commonwealth Act.‖22
The CIT also subsumed
authority over all coal industry worker issues that was previously held by the Commonwealth
government‘s Industrial Relations Commission and the NSW government‘s Industrial
Commission of New South Wales. The joint acts had almost identical provisions, except for
powers allowing the JCB to control coal collieries and take over their assets and operations on
a compulsory basis. These provisions were contained in the NSW Coal Industry Act only.
The passage of the joint acts transformed the pre-war regulatory setting for the NSW coal
industry from one based almost totally on laissez-faire principles to one in which the
Commonwealth and NSW governments would play a strong role in regulating and
rehabilitating its black coal industry.23
Before the JCB and the CIT could exercise their powers
and make a difference, however, the Communist Party of Australia and its supporters within
the more radical labor unions launched the 1949 coal strike, which shut down the NSW‘s coal
industry for seven weeks. Eventually, the Labour governments of NSW and the
21
Joint Coal Board, ―First Report of the Joint Coal Board, March 1, 1947 to June 30, 1947 and 1947- 1948,‖ pp.
6-7. 22
Productivity Commission, 1998, ―The Australian Black Coal Industry‖ Inquiry Report, AusInfo, Canberra,
vol. 2, Appendix E, p. E4. 23
In 1948, the State of Queensland established the Queensland Coal Board with powers roughly similar to those
of the Joint Coal Board. However, Queensland did not seek Commonwealth involvement in the form of joint
coal industry acts. Victoria and South Australia also determined that they did not need to involve the
Commonwealth government. Instead they asked that they be exempted from the still active Coal Production
(War-Time) Act of 1944, which the Commonwealth government did. Surprisingly, the Coal Production Act
of 1944 appears to have remained in force until the 1960s, albeit without the coal commissioner, which
discontinued its operations in 1947.
Page 19
28 March 2011 19 PESD WP #101
Commonwealth crushed this strike and the radical unions by passing and implementing
emergency legislation that led to the jailing of many of the strike‘s leaders.24
The JCB and the CIT eventually played pivotal roles in neutralizing the more radical unions
and removing labor unrest as a development issue for the black coal industry during the 1950s.
A key component of their success was taking an active role in improving the working
conditions in underground mines and the infrastructure of mining communities.
The actions of the JCB and the CIT effectively neutralized the industrial dispute and work
stoppage situation in NSW, which had been a major impediment to the growth of Australia‘s
black coal industry. This is not to say that work stoppages and labor-management disputes did
not flare up during the post-war period. On the contrary, during the 1970s and 1980s, disputes
were once again the primary reasons for lost output from Australia‘s black coal mines.25
However, the losses, while significant, never threatened the overall reliability of coal supply as
had events prior to 1950.
Although the joint acts paid lip service to the notion of ―private ownership and operation of
coal mines,‖ the early emphasis of the JCB was on increased state control and intervention. In
particular, the joint acts authorized the JCB to take over the operations of inefficient coal
mines, as well as supporting enterprises, to ensure that ―coal produced in NSW was available
in such quantities and with such regularity as will meet requirements throughout Australia and
in trade with other countries.‖26
In response to this mandate, the JCB owned and operated collieries (coal mines) in NSW from
1947 (its first year of operations) until March 1957. Its share of total raw coal production
ranged from 5 percent in 1947 to a peak of 16 percent during 1951.27
Between 1950 and 1954,
24
See Kim Bullimore, ―1949 Coal Strike: Labour‘s ‗boots and all‘ sell-out‖ (www.greenleft.org.au) for a less
than flattering analysis of Australian government‘s response to 1949 coal miner strike and the events that
eventually led to the decline of union power over the coal industry after WWII. Also see Phillip Deery (ed.),
―Labour in Conflict: The 1949 Coal Strike,‖ Hale and Iremonger, Sydney, 1978. 25
Productivity Commission, 1998 ―The Australian Black Coal Industry‖ Inquiry Report, AusInfo, Canberra,
vol. 2, Appendix E, p. E5. 26
Ibid, page 5. The JCB, which had the power to take over the operations of inefficient coal mining companies,
took control of a number of underperforming collieries during its first 20 years of existence, some of which
were transferred to it by the Commonwealth Coal Commissioner‘s Office in 1947. 27
Joint Coal Board, various issues of its annual report for 1947 through 1957.
Page 20
28 March 2011 20 PESD WP #101
JCB-owned mines supplied more than 10 percent of NSW raw coal production.28
Eventually,
after much prodding from the Commonwealth government, the JCB, in March 1957, sold off
its ownership in three NSW coal mining companies and, with those divestments, the JCB
ended its joint role as black coal regulator and coal producer in NSW.29
The divestment decision was certainly helped along by a major financial scandal that affected
the JCB‘s accounting department in 1949.30
The JCB board of directors uncovered matters of
gross negligence and managerial incompetence within its accounting department related to the
operations of the JCB-owned collieries. The JCB board described the situation as ―a complete
breakdown in the accounting section which was no longer able to present an authentic
statement of the Division‘s activities.‖31
The JCB also noted that the accounting department‘s
―reports and cost statements were not being presented on the due dates and information in
reports that had been received was subsequently found to be unreliable and, in some cases,
completely misleading.‖32
As a result of these financial irregularities, the JCB suffered a
significant loss for that time of £350,441.33
Unsurprisingly given the history of labor disputes, during the late 1940s and the early 1950s
and this financial scandal within the JCB, many industry analysts held a very pessimistic view
about the future of Australia‘s black coal industry with a number of analysts predicting its
demise due to labor unrest.34
Others called for its nationalization to protect the public interest.35
In retrospect, the 1950s turned out to be a time when miners and mine owners, with JCB
prodding, reached a point of peaceful co-existence, which supported the industry‘s recovery
and subsequent expansion.
2.1.2 Production and Market Trends
During the recovery phase, growth in saleable production was modest. Figure 1 (above)
illustrates the slow growth in production during the recovery phase relative to growth in
production experienced during the later rapid growth and competitive phases. In 1950, saleable
28
Ibid. 29
Joint Coal Board, ―Eleventh Annual Report for the Financial Year 1957–1958,‖ pp. 32-33 30
Joint Coal Board, ―Third Annual Report for the Financial Year 1949-50,― pp. 17-18. 31
Ibid. 32
Ibid 33
Ibid. 34
Shaw and Bruns, pp. 170-181 35
Ibid.
Page 21
28 March 2011 21 PESD WP #101
production of black coal for all of Australia stood at only 16.8 million tonnes (mt). By 1959,
saleable production increased to 19.8 mt, representing a compound annual growth rate (CAGR)
of only 3.2 percent. Most of the production was from NSW, which accounted for 77 percent of
Australia‘s saleable black coal production over the period 1950-1959, with Queensland
accounting for 14 percent of saleable production and other states for the remaining 9 percent.36
The coal production mix began to shift during this time period. The primary coal product in
1950 was steam coal, which accounted for 82 percent of total coal sales. By 1959, steam coal
sales dropped to 72 percent of total black coal sales as coking coal emerged as the Australian
black coal industry‘s fastest growing market. The decade of the 1950s was also a time when
the domestic market was the dominant source of demand for Australia‘s black coal with
domestic uses of coal accounting for 99 percent of 1950 coal sales.37
By 1959, domestic
consumption still accounted for 94 percent of total sales, although exports were finally starting
to show signs of recovery. Starting from an extremely low base of 68,000 tonnes in 1950,
exports grew by 38 percent per annum over the 1950s, reaching 1.2 mt by 1959.
2.1.3 Role of New Technology during the Recovery Phase
Until 1935, coal mining in Australia was largely a manual operation, based on two-man teams
equipped with picks, shovels, and hand-push trolleys and, in some cases, wheelbarrows, to
remove coal from coal seams and transport it to the surface. In deeper mines, the coal was
dumped from the trolleys and wheelbarrows at the bottom of a vertical shaft and then hoisted
to the surface in buckets by winch.38
At the start of the recovery phase, the Australian black coal industry was woefully under
mechanized when compared with the coal industries of other coal-producing nations.39
Moreover, most coal mining companies in those early days did not have strong enough balance
sheets and technical capabilities to mechanize their mines. The JCB recognized this industry
deficiency from the outset and implemented programs to encourage companies to mechanize
36
Joint Coal Board, ―Black Coal in Australia, 1980-81,‖ March 1982, Table 4, p. 11. 37
Domestic consumption in 1950/1951 was greater than 100 percent of total saleable production for that same
year, indicating that coal stockpiles were drawn down to meet the strong domestic demand in that fiscal year. 38
Australian Academy of Technological Sciences and Engineering, ―Technology in Australia 1788-1988: A
condensed history of Australian technological innovation and adaptation during the first two hundred years,‖
p. 758 (Chapter 11, Coal Transition at the Coal Face) 2000 (online edition), (available online:
www.austehc.unimelb.edu.au/tia/758.html). 39
Joint Coal Board, ―Fourth Annual Report, 1950-51,‖ p. 15.
Page 22
28 March 2011 22 PESD WP #101
their operations and regulations to punish those that did not.40
These incentives and supports
included free technical assistance to mine operators in need of advice on how to plan the future
development of their mine sites and financial assistance in the form of loans and even grants to
those mine operators who chose to purchase equipment for mechanizing their mines.41
The JCB also established ―an equipment pool from which colliery companies could either
purchase or hire the most modern types of mining machinery‖ and provided financial and
technical assistance to domestic manufacturers of mining equipment who wanted to diversify
into types of mining equipment only available offshore.42
The purchase-hire program had an
important demonstration effect, which encouraged many other companies to adopt the same
equipment as the early pioneers in order to remain competitive in the industry.
As a result of these early JCB programs, the coal mining industry began an aggressive drive to
mechanize during the 1950s. This was also a time when the adoption of improved exploration
methods and equipment led to significant improvements in the amount of new coal discovered
on unexplored tenements.43
Specific improvements in exploration techniques and equipment
included the following:
Development of improved seismic techniques, data logging equipment, drilling rigs,
and core lifters
Improved electro-mechanical instruments and tools
Advanced instrumentation for monitoring the performance of drills
These technological advances in the field of minerals exploration contributed to the discovery
within NSW‘s Hunter Valley and Queensland‘s Bowen Basin of high-quality, coking coal
deposits with low stripping ratios that were amenable to open-cut mining methods. However,
it was the application of new mining technologies that drew the most attention as these
technologies led to machines displacing labor, which resulted in strong union opposition.
Mechanization of the mines had an immediate and visible impact on coal production.
40
Ibid, p. 14. 41
Ibid. 42
Ibid. 43
Tenements are those areas subject to mining licenses that are ―leased‖ to some individual or entity for a fixed
period of time on commercial terms. A person holding a mining license for a particular area is said to have
―tenure‖ over the land. In Indonesia, tenements are referred to as concession areas.
Page 23
28 March 2011 23 PESD WP #101
Prior to the 1950s, mechanization was limited to the use of hand-held machine cutters and
picks for cutting the coal from the rock face and for drilling bore holes to place explosives.44
In
certain instances, winches powered by electricity and steam engines were used to transport the
coal out of the mines.45
The few new technologies that were adopted were used to partially
mechanize underground coal mines, which, during most of the 1950s, accounted for more than
80 percent of Australia‘s black coal production. Coal produced from Australia‘s underground
mines peaked at 91 percent of total production in 1958 and 1959.46
During the recovery phase and for most of the rapid growth phase, mining companies
developed their underground mines according to the bord and pillar mining system, which
consisted of a series of parallel main tunnels running that intersected secondary tunnels known
as cut-throughs, which were driven at right angles to the main tunnels.47
The roof of the mine
was supported by the pillars of coal as shown in Figure 2.48
The bord and pillar system involved removal of the in situ coal in two ―workings.‖ The first
working involved the extraction of coal from the tunnels followed by the removal of coal in the
pillars, which was known as a second working. The percentage of coal left in pillars after
completion of the second working was always quite high, at least 50 percent of the total
recoverable coal and oftentimes much higher.49
Once most of the pillar coal had been extracted
from a specific section of the mine, the mine operator allowed the roof to collapse under
―controlled conditions,‖ which involved removing the temporary roof supports.50
The coal extraction process in both workings needed to happen in four distinct phases: (i) coal
cutting; (ii) boring (drilling holes in the coal seam for placing explosives); (iii) shooting or
placing and detonating the explosives; and (iv) loading the coal onto wagons for transport out
44
Australian Academy of Technological Sciences and Engineering, ―Technology in Australia 1788-1988, p.
758 (Chapter 11, Coal Transition at the Coal Face) 2000 (online edition), (available online:
www.austehc.unimelb.edu.au/tia/758.html). 45
Ibid. 46
Joint Coal Board, ―Fifteenth Annual Report for the Financial Year, 1961 - 1962, ―Appendix 13, Table 3, p.
151. 47
Joint Coal Board, ―Fifth Annual Report for the Financial Year, 1951 – 1952,‖ Appendix II, p. 48. 48
Another way to visualize a bord and pillar mine is to think of it as a modern city with that city‘s main roads
represented by the main tunnels of the mine and the side roads as the secondary tunnels of the mine. The
pillars represent the city blocks. Australian Academy of Technological Sciences and Engineering,
―Technology in Australia 1788-1988,‖ p. 758. 49
Joint Coal Board, ―Fourth Annual Report of the Joint Coal Board for the Financial Year 1950-51,‖ p. 21. 50
Ibid.
Page 24
28 March 2011 24 PESD WP #101
of the mine.51
Manual cutting, boring, and shooting of coal seams during the first working was
very time-consuming, dangerous, and an unproductive use of labor. The manual removal of the
pillar coal during the second working was also very dangerous and inefficient.52
Although a
maximum of 60 percent of the in situ coal could be extracted using bord and pillar methods,
the extracted amount was typically much lower when manual methods for removing pillar coal
were used.53
Figure 2: Diagram of a Bord and Pillar Mine
Source: www.wikimedia.org.
In 1950, the JCB successfully demonstrated the use of a Joy Continuous Miner at the Huntley
Colliery in the Illawara District of NSW.54
This advanced mining machine allowed the cutting,
boring, and loading phases of bord and pillar mining to be completed as one fully automated
51
Ibid. 52
Ibid, p. 49 53
Longwall mining systems, which were not widely applied in NSW mines until the late 1980s, allow for 60
percent to 80 percent of the in situ coal to be extracted. 54
http://www.illawarracoal.com/technology.htm
Page 25
28 March 2011 25 PESD WP #101
operation.55
It also allowed mechanical extraction of coal from the pillars without the use of
explosives and with a substantial reduction in the number of miners required per tonne of coal
extracted.56
The successful demonstration of the continuous miner at the Huntley Colliery eventually led to
the lifting of a government-union ban on the mechanical extraction of coal from pillars and the
start of multiple shift operations in underground mines, which previously operated on a single
shift.57
The continuous miners would first cut the coal from the work face of the mined area
using a revolving drum head containing concentrically positioned teeth (Figure 3).58
The coal
would then be moved toward the center of the mine and transported out of the mine.
The use of continuous miners encouraged further mechanization of coal transport from the coal
face to the surface of the mine. Initially, the extracted coal was loaded from the continuous
miner onto a rubber-tired shuttle car, which would then transport and discharge the coal onto a
belt conveyor that would carry the coal to the surface of the mine.59
Eventually, shuttle cars
were replaced by electric conveyors equipped with steel-cored, non-flammable belts. These
conveyors, which were connected to the back of the continuous miners, allowed the extracted
coal to be conveyed from the mine face to either the surface of the mine or a central collection
area within the underground mine. This transport arrangement allowed continuous miners to be
more fully utilized and to achieve the lowest cost of coal extraction and loading.
55
Australian Academy of Technological Sciences and Engineering, ―Technology in Australia 1788-1988,‖
p. 759. 56
Ibid. Continuous miners also allowed the labor reductions by reducing the number of coal faces that needed
to be operated, maintained, and ventilated and by allowing a more continuous completion of the cutting,
boring, and loading steps of coal extraction. 57
Ibid. 58
Productivity Commission, 1998, ―The Australian Black Coal Industry‖ Inquiry Report, AusInfo, Canberra,
vol. 2, Appendix B, p. B7. 59
Ibid, p. 762.
Page 26
28 March 2011 26 PESD WP #101
Figure 3: Joy Continuous Miners in Action
Source: www.joy.com/Joy/Products/Continuous-Miners).
By the end of recovery period in 1959, 71 continuous miners were in operation in NSW,
accounting for 39 percent of NSW‘s coal production.60
The use of continuous miners and other
improvements to the methods of underground bord and pillar mining led to very large
productivity gains for Australia‘s underground coal mines during the recovery period.61
For
example, output per man-shift worked (OMS for all employees), a standard measure of coal
mine worker productivity in Australia, increased from 2.93 tonnes/OMS in 1950 to 5.13
tonnes/OMS in 1959, or by 75 percent for all NSW underground mines.62
Worker productivity gains of even greater magnitude were achieved for open-cut mines
operating in NSW. In 1950, NSW open-cut mines had a worker productivity of 8.55
tonnes/OMS. By 1959, NSW underground mines produced 19.12 tonnes/OMS, a 124 percent
60
Joint Coal Board, ―Thirteenth Annual Report of the Joint Coal Board for the Financial Year 1959 – 1960‖,
pp. 29-30. 61
Longwall mining methods, which were not widely adopted in Australia until the 1980s, relied on the use of a
specialized mining machine known as a longwall miner, which sheared the coal from a 100 m to 200 m wide
work face and deposited it onto a conveyor for transport to the surface. This method of mining allowed for (a)
coal recovery rates of up to 80 percent; (b) very high output levels per worker; and (c) improved worker
safety relative to bord-and-pillar-mining methods. Sensors used in this process of mining helped detect the
amount of coal remaining in the seam while robotic controls enhanced the efficiency of the process. Source:
E.M. Warner, ―A History of American Continuous Miners‖ (paper presented at 1979 International
Conference on Mining Machines, Brisbane, July 2-6, 1979). 62
Joint Coal Board, ―Fourteenth Annual Report for the Financial Year, 1960-1961,‖ Appendix 12, Table 22, p.
146
Page 27
28 March 2011 27 PESD WP #101
increase over a 10-year period.63
These open-cut productivity gains were achieved with the
application of massive electric-powered draglines, large diesel-fuelled trucks, and other pieces
of large earth-moving equipment, which provided a more economical process of overburden
removal and coal extraction.
Open-cut mining technologies were first applied in Australia in 1937 at the Blair Athol mine in
Queensland. In 1940, they were introduced into NSW. The first open-cut mines to operate in
NSW were prolific producers of coal, but due to poor advance planning the open pits that were
developed during the early 1950s in NSW were rapidly depleted leading to disruptive swings
in production. The JCB, in 1954, attempted to limit production from open-cut mines by
requiring coal producers to first try to meet their coal orders from existing underground mines.
Only after the underground capacity was exhausted were coal producers allowed to rely on
open-cut mines for any unmet demand.64
As a result of the JCB‘s ill-advised policy of using
open-cut mines as producers of last resort, NSW production from open-cut mines dropped
from 1.8 million tonnes (mt) and 14 percent of total NSW production in 1950 to 0.6 mt and 3
percent of total NSW production in 1959.65
The folly of this type of technology-limiting policy was soon realized by the JCB and its
output restricting policy regarding NSW‘s open-cut mines was dropped by the late 1950s.
Open-cut mining during the subsequent rapid growth phase (1960-1986) became the primary
vehicle for growing the black coal industries of NSW and Queensland.66
Despite its ill-advised
restrictions on open-cut mining, the JCB did arrange for the adoption of advanced open-cut
machinery during the 1950s, which resulted in the very large gains in worker productivity cited
above for the period 1950-1959.
These technological advances in the methods of both open-cut and underground mining had
two important impacts on the Australian coal industry over the period 1950-1959. First, they
63
Ibid. 64
Ibid. 65
Ibid, Appendix 12, Table 2, p. 127. 66
In Queensland, where such restrictions did not apply, open-cut mining methods were fully applied by Utah
International and Theiss Brothers, which in the mid-1960s discovered large coal deposits of high-quality
coking coal in the Bowen Basin areas of Queensland that were amenable to open-cut mining. By the mid-
1970s, Queensland produced 88 percent of its coal using open-cut methods versus 12 percent for NSW. The
role played by these advanced open-cut technologies as well as longwall underground mining methods is
discussed in more detail under the heading ―rapid growth phase.‖ Galligan, Brian, Utah and Queensland
Coal: A Study in the Micro Political Economy of Modern Capitalism and the State, University of Queensland
Press, 1989, pp. 126-127.
Page 28
28 March 2011 28 PESD WP #101
contributed to the decline of labor union power at the coalmines of NSW and Queensland by
reducing the need for unskilled and semi-skilled labor in both underground and open-cut
mines. The advanced machines and methods also required improved technical skills of the
remaining labor force. The skilled workers were paid higher salaries and provided with
improved working conditions and benefits.
The improved pay and working conditions led to reduced labor-management tensions and a
huge reduction in lost output due to industrial work stoppages in NSW (Figure 4). Production
losses due to industrial work stoppages, which stood at 1.7 mt and 11 percent of possible
production had, by 1959, been reduced to a relatively small amount—less than 600,000 tonnes
and 3 percent of possible production.67
By the close of the recovery phase, industrial work
disputes were no longer seen as a threat to the survival of NSW‘s black coal industry.68
The application of advanced mining technologies also resulted in substantial reductions in
costs of production that, in turn, allowed Australian black coals to compete in international
markets, which in turn justified the expansion of rail and port infrastructure in both NSW and
Queensland. Because export markets were growing simultaneously with the expansion in mine
capacity, the industry was able to expand its output without causing a price collapse.
With respect to transportation infrastructure, the 1950s was a time when diesel- and electric-
powered locomotives started to displace coal-fired locomotives. During the 1950s, the Port of
Gladstone was transformed from a port that catered to declining primary industries, such as
cattle and other agricultural products, into a coal export center. Today, Gladstone is the second
largest coal export port in Australia (Newcastle remains the largest). But it was not until the
1970s that Gladstone and Newcastle were expanded into world-class coal shipping ports.
These developments are discussed below under the heading ―Rapid Growth Phase.‖
67
Joint Coal Board, ―Fourteenth Annual Report for the Financial Year, 1960-1961,‖ Appendix 12, Table 26, p.
150. 68
Ibid, p. 33.
Page 29
28 March 2011 29 PESD WP #101
Figure 4: Lost Output Due to Industrial Work Stoppages at NSW Coal Mines, 1948-1960
(in million tonnes and percent of possible production)
Source: Joint Coal Board, ―Fifteenth Annual Report of the Joint Coal Board for Financial Year 1961-62,‖ Tables
27 and 28, pp. 174 and 175.
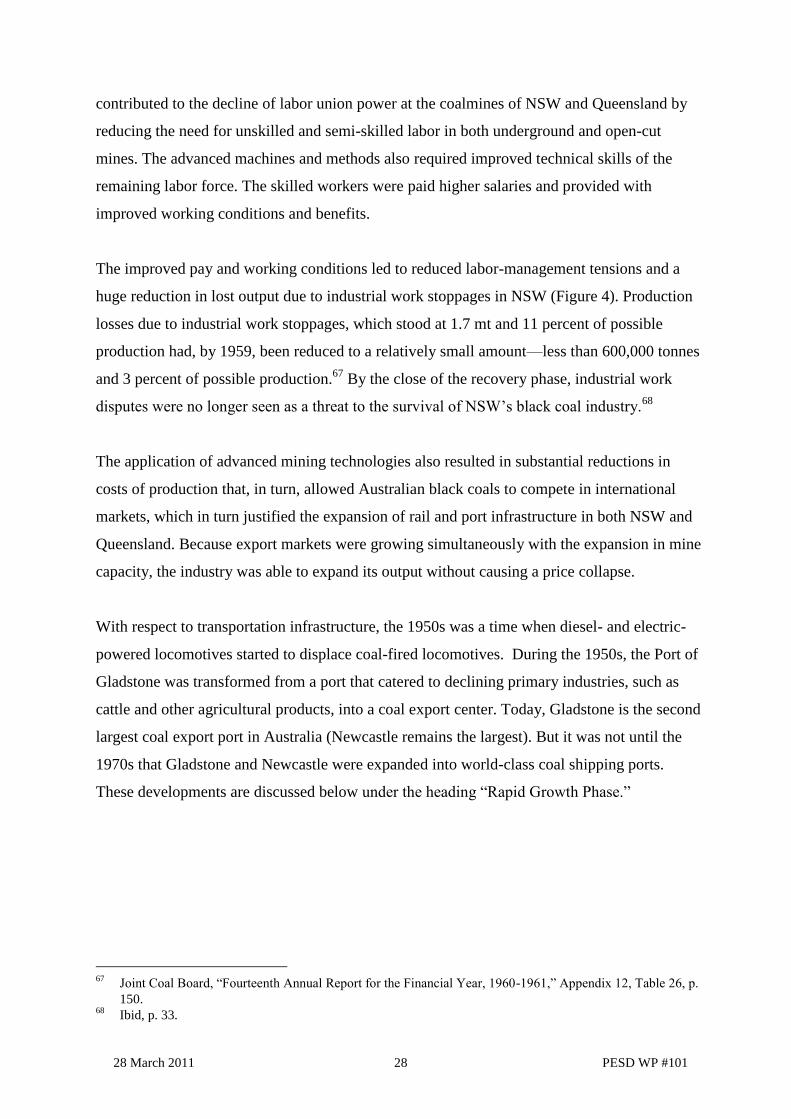
2.1.4 Evolution of the Domestic Market
During the recovery phase, the domestic markets for coal started to transition away from the
shipping, railway, and town gas industries to the electric power and steel making industries
(Figure 5).69
The demise of the coal bunker fuel market was already a fait accompli by 1950,
with the small remaining amount of bunker fuel used to fuel ships limited to those plying
interstate trade in Australia. The beginning of the end for the rail and town gas industries was
also noticeable by 1959 (Figure 5). Given that coal producers of NSW and Queensland were
just beginning to re-establish themselves in the export markets by the end of the 1950s, the
growth in the domestic power and steel making markets for black coal offset the declines in
coal usage in the rail and town gas industries.
69
The Official Year Book of the Commonwealth of Australia: No.42, 1956, p. 1012. Between 1941 and 1946,
railway locomotives were the biggest domestic consumers of black coal. Over this period, railways accounted
for 23 percent of domestic black coal consumption versus 20 percent for the power sector, 13 percent for the
town gas industry, 2 percent as bunkers used by the shipping industry. From 1947 onward, the power industry
was the largest single consumer of black coal in Australia.
0%
5%
10%
15%
20%
25%
0.0
0.5
1.0
1.5
2.0
2.5
3.01
94
8
19
49
19
50
19
51
19
52
19
53
19
54
19
55
19
56
19
57
19
58
19
59
19
60
% o
f p
ossib
le p
rodu
ction
Mill
ion T
onn
es
million tonnes % of possible production
Page 30
28 March 2011 30 PESD WP #101
Figure 5: Share of Black Coal Consumption by Industry, 1950 and 1959
1950 1959
Source: Australian Official Yearbook, #42, 1956, p.1012. Joint Coal Board, 16th
Annual Report, 1962-63, p. 68.
2.2 Rapid Growth Phase (1960-1986)
Between 1960 and 1986, the Australian black coal industry achieved an astonishing 26 years of
uninterrupted rapid growth (Figure 1). It also diversified its sources of supply, its export
customers, and its coal products during this phase of development. The CAGR of saleable
production for this phase was 8 percent per year with production increasing from 22.2 mt in
1960 to 148.7 mt in 1986.70
Another important development was the emergence of
Queensland as the Australia‘s largest exporter of black coal in 1972 and its largest producer of
―raw‖ black coal in 1985.71
The strong growth of Australia‘s black coal industry can be attributed to continued
improvements in mining technology and the rapid growth of the Japanese export market for
coking coal. During the rapid growth phase, the continued mechanization of mines and the
growth of open-cut mining relative to underground mining drastically improved efficiency and
boosted production while manual mining was phased out. At the start of the rapid growth
phase in 1960, the JCB had successfully mechanized the bord-and-pillar-type mines in NSW
with 90 percent of all coal production coming from fully mechanized mines (both winning and
70
Joint Coal Board, ―Black Coal In Australia, 1986-87,‖ Table 8, p. 14. 71
Ibid, Tables 7 and 100, pp. 13 and 97.
Steel Making
17%
Railway 20%
Gas Town 12%
Power Generation 30%
Other Industry 21%
Steel Making
22% Railway 11%
Gas Town 9%
Other Industry
18% Power Generation 40%
Page 31
28 March 2011 31 PESD WP #101
loading of coal was by mechanized means of some sort). A more important measure of
mechanization was the increased use of continuous miners. In 1960, continuous miners were
used to ―cut‖ 37 percent of NSW‘s underground coal production.72
By June 1966, NSW had
increased the number of operating continuous miners to 146, which the JCB estimated, based
on a one-month production study, accounted for 87 percent of NSW‘s underground coal
production.73
The speed at which the NSW coal industry had mechanized its operations was
even more impressive if one considers that the U.S. coal mining industry relied on continuous
miners to produce only 25 percent of its 1960 coal production.74
2.2.1 Further Advances in Underground Mining Methods
However, there was still more to come. Over time, the JCB and coal mine owners discovered
that continuous miners were not as continuous as their name implies. A continuous miner must
stop operating frequently to allow an empty shuttle car to ―berth‖ next to it after the loaded
shuttle car departed.75
It also needed to stop operating during times when roof supports had to
be put in place and when moving from tunnel to tunnel. It was found that even under optimal
conditions with conveyors used for moving the coal to the surface, a continuous miner
operated only 50 percent of the available time at the coal face.76
In addition, a continuous
miner could work only around 50 meters along the coal face before it needed to be moved to a
new location.77
Finally, removing the pillars with a continuous miner, although safer than
doing the job manually, still posed risks to the eight-man crew working the continuous miner,
which became a growing safety concern over time.78
In response to the factors affecting the efficient utilization of a continuous miner and its
inherent safety risks, mine equipment manufacturers in the UK turned their attention to the
design of a new underground mining system that could achieve almost 100 percent continuous
operation with an improved level of worker safety. The final design concept, which was later
branded as the longwall mining system, consisted of hydraulic roof support assemblies to
72
Joint Coal Board, ―Fourteenth Annual Report, 1960-1961,‖ Appendix 12, Table 34, p. 160. 73
Joint Coal Board, ―Nineteenth Annual Report for the Financial Year 1965-66,‖ p. 30. 74
Ibid. 75
Australian Academy of Technological Sciences and Engineering, ―Technology in Australia 1788-1988,‖ p.
760. 76
Ibid. 77
Ibid. 78
Joint Coal Board, ―Fifth Annual Report for the Financial Year, 1951 – 1952,‖ Appendix II, pp. 48-49.
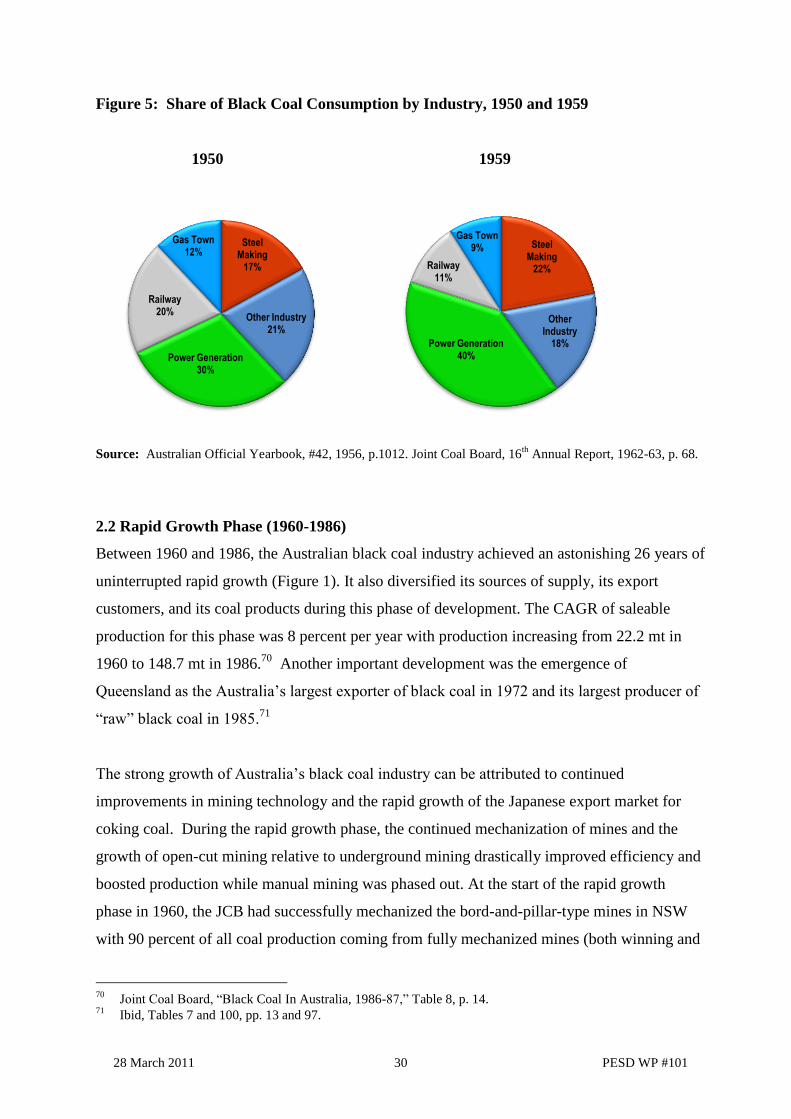
Page 32
28 March 2011 32 PESD WP #101
which a conveyor and coal cutter, known as a shearer, were attached (Figure 6).79
Prior to
installing the hydraulic roof supports and putting the longwall mining machine in place,
continuous miners were used to cut two parallel tunnels into the coal panel.80
These tunnels,
which were typically placed 200 meters apart, were used to place pillars to support the mine
walls and roof while allowing the mining area to be properly ventilated. At the front of the coal
panel, the continuous miner was used to cut another tunnel, known as the longwall,
perpendicular to the two parallel roads. Finally, the continuous miner was used to cut
ventilation shafts and escape tunnels as needed throughout the longwall coal mine.81
Figure 6: Diagram of a Longwall Mining Operation
Source: United Mine Workers of America website (www.umwa.org/?q=content/longwall-mining).
At that point in the development of any longwall mine, the hydraulic roof supports were put in
place and the longwall mining machine, consisting of a shearer and conveyor system, was
moved against the longwall. The shearer was used to extract the coal and place it on the
79
Australian Academy of Technological Sciences and Engineering, ―Technology in Australia 1788-1988,‖ p.
760. 80
Productivity Commission, 1998, ―The Australian Black Coal Industry‖ Inquiry Report, AusInfo, Canberra,
vol. 2, Appendix B, p. B8. 81
Ibid.
Longwall
Parallel Tunnel #1
Page 33
28 March 2011 33 PESD WP #101
conveyor belt in one continuous operation.82
After the coal was removed from a particular area
of the mine, the hydraulic assemblies, which are self-advancing, were moved forward into the
coal panel, allowing the process of coal cutting and removal to occur on an almost continuous
basis.83
The roof area directly behind the mined-out area was then allowed to collapse as the
longwall miner proceeds into the coal panel.84
Once the coal was cut from the panel, it was loaded onto a conveyor, which either carried the
coal directly to the surface or to a central storage area for later transfer to the surface by
rubber-tired loader or second conveyor. The use of a flexible conveyor to remove the cut coal
away from the coal face while moving the shearer and roof assemblies forward allowed the
process to be very close to continuous. The only instances where the system needed to be shut
down were (a) for maintenance, either routine or forced, and (b) if the position of the shearer
needed to be reversed.85
The longwall mining system was first used in the UK in 1963.86
The Joint Coal Board
attempted to apply the UK system in NSW between 1967 and 1970 but operating problems
emerged as the UK design was not suited for NSW mining conditions. By 1972, through trial
and error, the JCB developed a modified design that worked for NSW conditions.87
In 1978,
the longwall mining system accounted for only 4.3 percent of NSW underground production
(1.63 mt) but by the end of the rapid growth period, its share of underground coal produced in
NSW had increased to 32 percent (16.6 mt longwall versus 51.8 mt total underground
production).88
As of 1986, Queensland was just starting to apply the longwall mining system
and production data were not available for the years 1978 through 1985 for Queensland.
Toward the end of the rapid growth period (1980-1986), longwall mining methods started to
displace bord and pillar mining methods in underground mines throughout Australia. The shift
to the longwall mining system and other improvements in underground mining technology
82
Ibid. 83
Ibid. 84
The roof material, known in Australia as ―goaf,‖ contains coal and needs to be properly ventilated and then
sealed underground to avoid risk of dust explosions and spontaneous combustion. 85
Ibid. 86
Ibid. 87
Joint Coal Board, ―Twenty-Sixth Annual Report for the Financial Year, 1972-73,‖ pp. 48-49. The specific
adjustments appear to the hydraulic roof supports and in particular the hydraulic chocks that are designed to
hold up the weight of the roof. 88
Joint Coal Board, ―Black Coal In Australia, 1986-87,‖ p.22.
Page 34
28 March 2011 34 PESD WP #101
allowed worker productivity in NSW underground mines to increase from 5.76 tonnes per
OMS in 1960 to 14.37 tonnes per OMS in 1986, a productivity gain of 5.8 percent per year.89
2.2.2 Shift to Open-Cut Mining
During the rapid growth phase, advanced equipment and technology were also used to open
new open-cut mines in Queensland as well as in NSW. But here the advance was one of scale
and efficiency for the new equipment. Table 1 shows the massive increase in handling
capacities of the overburden removal and coal extraction equipment used in Australia‘s open-
cut mines.
Table 1: Handling Capacities of Major Pieces of Equipment Used in Australian Open-
Cut Mines for Overburden Removal and Coal Extraction.
Type of Equipment Typical Capacities in Cubic Meters
1950 2001
Draglines 2 46 – 60
Shovels 2 14 - 46
Heavy Excavators/Bulldozers 1.5 - 2 10.0
Source: Australian Academy of Technological Sciences and Engineering, ―Technology in Australia 1788-
1988 (updated 21 Nov 2001)‖ p. 763.
At the start of the rapid growth phase, open-cut mines accounted for only 3 percent of NSW
raw coal production and 2 percent of total Australian black coal production. By the close of
this period, open-cut mines accounted for 40 percent of NSW raw coal production and 67
percent of all Australia black coal production.90
In the case of Queensland, open-cut mines
accounted for 67 percent of its 1970 raw coal production and more than 93 percent of its 1986
raw coal production.91
On an OMS (all employees) basis, worker productivity in Australia‘s
open-cut mines climbed from 14.64 tonnes per OMS (raw coal basis) in 1960 to 34.10 tonnes
per OMS (raw coal) in 1986, an improvement in labor productivity of 5.4 percent per year.92
89
Joint Coal Board, ―Fifteenth Annual Report for the Financial Year, 1961 – 1962,‖ Table II, p. 20 and ―Black
Coal In Australia, 1986-87,‖ Table 83, p. 78. 90
Joint Coal Board, ―Fifteenth Annual Report of the Joint Coal Board for the Financial Year 1960-1961,‖ Table
2, p. 150 and ―Black Coal in Australia 1985-86,‖ Table 18, p. 22. 91
Joint Coal Board, ―Black Coal in Australia 1985-86,‖ Table 11, p. 22. 92
Joint Coal Board, ―Fifteenth Annual Report of the Joint Coal Board for the Financial Year 1960-1961,‖ Table
2, p. 150 and ―Black Coal in Australia 1986-1987,‖ Table 80, p. 75.
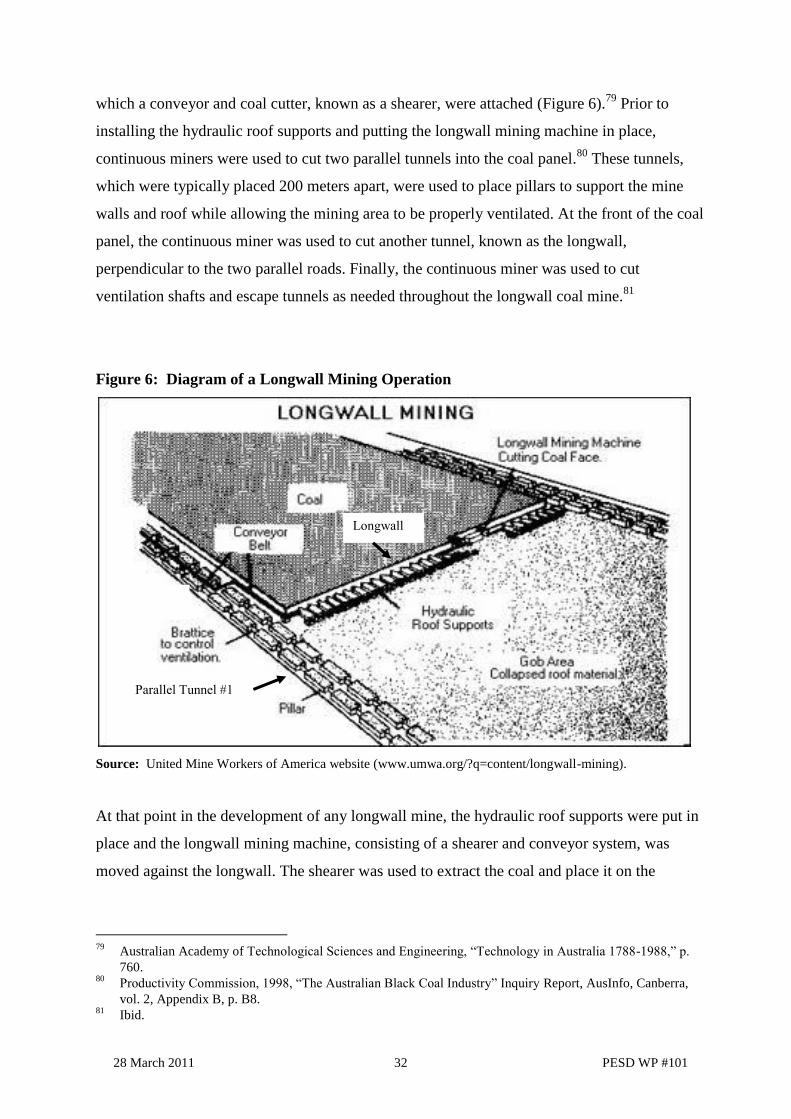
Page 35
28 March 2011 35 PESD WP #101
Figure 7, which shows labor productivity gains over the rapid growth period in tonnes per man
shift for both underground and open-cut mines, illustrates the productivity advantages enjoyed
by most open-cut mines. It is therefore not surprising that Australia‘s black coal industry
favored the development of open-cut mines from the 1950s onward.
2.2.3 The Labor Situation Revisited
During the 1960s, lost coal production due to ―industrial strife‖ or work stoppages was
minimal. In all years except one, the lost production due to industrial strife was less than 3
percent of possible production.93
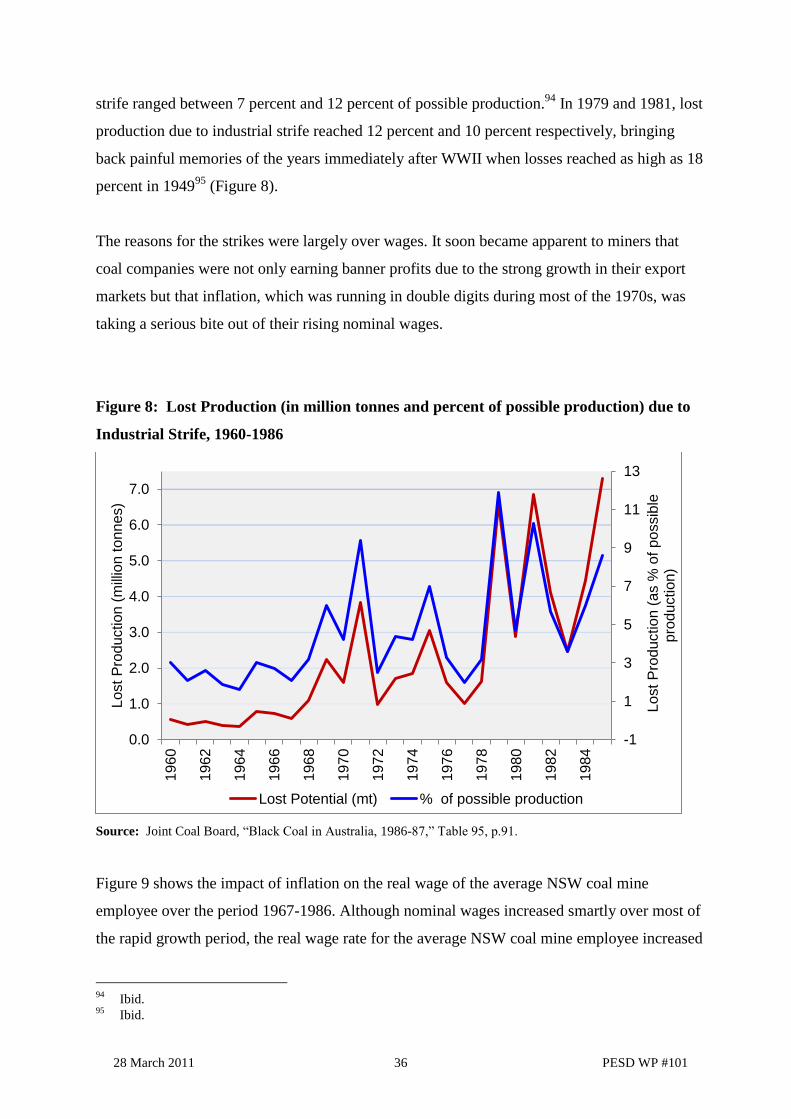
However, from 1969 on, lost production due to labor disputes
once again became a significant problem.
Figure 7: Raw Coal Output per Man shift (in tonnes) for All Australian Black Coal
Mines, 1960-1986
Source: Joint Coal Board ―Black Coal in Australia, 1986-87,‖ Table 80, p. 75.
Although coal producers were able to prevent labor disputes from causing serious disruptions
in production, the losses were nonetheless significant. During five of the 16 years that make up
the rapid growth period (1971, 1975, 1979, 1981, and 1985) lost production due to industrial
93
Joint Coal Board, ―Black Coal in Australia, 1986-87,‖ Table 95, p. 91.
0
10
20
30
40
50
60
1960 1962 1964 1966 1968 1970 1972 1974 1976 1978 1980 1982 1984 1986
Ra
w T
on
ne
s/ m
an
shif
t
Underground Mines Open Cut Mines
Page 36
28 March 2011 36 PESD WP #101
strife ranged between 7 percent and 12 percent of possible production.94
In 1979 and 1981, lost
production due to industrial strife reached 12 percent and 10 percent respectively, bringing
back painful memories of the years immediately after WWII when losses reached as high as 18
percent in 194995
(Figure 8).
The reasons for the strikes were largely over wages. It soon became apparent to miners that
coal companies were not only earning banner profits due to the strong growth in their export
markets but that inflation, which was running in double digits during most of the 1970s, was
taking a serious bite out of their rising nominal wages.
Figure 8: Lost Production (in million tonnes and percent of possible production) due to
Industrial Strife, 1960-1986
Source: Joint Coal Board, ―Black Coal in Australia, 1986-87,‖ Table 95, p.91.
Figure 9 shows the impact of inflation on the real wage of the average NSW coal mine
employee over the period 1967-1986. Although nominal wages increased smartly over most of
the rapid growth period, the real wage rate for the average NSW coal mine employee increased
94
Ibid. 95
Ibid.
-1
1
3
5
7
9
11
13
0.0
1.0
2.0
3.0
4.0
5.0
6.0
7.0
1960
1962
1964
1966
1968
1970
1972
1974
1976
1978
1980
1982
1984
Lo
st
Pro
du
ctio
n (
as %
of
po
ssib
le
pro
du
ctio
n)
Lost P
rodu
ction
(m
illio
n to
nn
es)
Lost Potential (mt) % of possible production
Page 37
28 March 2011 37 PESD WP #101
by 40 percent between 1969 and 1975 only to decrease by 35 percent over the remainder of the
rapid growth period. As a result of this setback in earning power, it is hardly any wonder that
miners returned to their strike-prone ways of the 1940s.
Figure 9: Nominal and Real Wages per Tonne of Saleable Coal Produced in A$, 1968-
1986
Source: ABARE, ―Australian commodity statistics 2009,‖ Table 9, p.9 for CPI data and Joint Coal Board, ―Black
Coal in Australia, 1986-87,‖ Table 95, p.91 for nominal wage data.
2.2.4 Exports
Production growth during the industry‘s rapid growth phase was largely export driven with the
previously dominant domestic market declining from 91 percent of total black coal sales in
1960 to 30 percent of total saleable production by 1986 (Figure 10). Between 1960 and 1986,
Australia‘s black coal exports increased from 1.9 mt to 95.7 mt as demand for steam and
coking coal in Asia grew at an impressive 28 percent annual growth rate while domestic
consumption grew at a much slower rate of 3 percent per year.96
96
Ibid, Table 100, p. 97.
$0
$2
$4
$6
$8
$10
$12
1968 1970 1972 1974 1976 1978 1980 1982 1984 1986
A$
per
to
nn
e s
ale
ab
le p
rod
uc
tio
n
Nominal Wage Real Wage
Page 38
28 March 2011 38 PESD WP #101
In addition to rapid growth in production and exports, the rapid growth phase was also
characterized by a very important diversification of export markets, sources of supply, and coal
products. Export demand for Australia‘s black coal was initially dominated by Japan, which
accounted for 90 percent of Australia‘s 1960 black coal exports.97
The primary coal imported
into Japan was hard and soft coking coal obtained from underground mines located in NSW.98
Although Japan remained the largest export customer for Australia‘s black coal producers
throughout the rapid growth phase of development, its share of Australia‘s black coal exports
dropped from 90 percent in 1960 to 49 percent of total exports by 1986 as Korea, Taiwan, and
Europe started to procure large quantities of Australian coking coal and later steam coal,
providing Australian coal producers with a more diversified market for their exports.99
Figure 10: Exports and Domestic Coal Sales, 1960 and 1986
1960 1986
Source: Joint Coal Board, ―23rd
Annual Report,
1969-70,‖ Table 9, p. 249.
Joint Coal Board, ―Black Coal in Australia, 1986-87,
(January 1988)‖, Table 100, p.97
(export) and Table 133, p. 126 (domestic).
Australia‘s initial reliance on the Japanese export market over the rapid growth phase benefited
the coal industry in a number of ways. The primary benefit was to create predictable and long-
97
Joint Coal Board, ―Fifteenth Annual Report of the Joint Coal Board for the Financial Year 1960-1961,‖ p. 75. 98
Ibid. 99
Joint Coal Board, ―Black Coal in Australia, 1986-87,‖ Table 126, p. 117.
Export 9%
Domestic 91%
Export 70%
Domestic 30%
Page 39
28 March 2011 39 PESD WP #101
term revenue streams for new mining projects, which allowed mining companies to obtain
long-term financing for both mining and transport infrastructure projects in NSW and
Queensland.
The Commonwealth government, however, did not initially view the relationship in such
symbiotic terms. Instead, it worried that Japan, because of its collective price bargaining
methods, would exert market power over Australia‘s coal producers, resulting in coal
producers accepting below-market prices for their exports and reduced royalties and tax
revenues for the Commonwealth and state governments. As a result of this concern, the
Australian government, in 1973, imposed price controls on all coal exports. These price
controls were not removed until 1993 but were only weakly enforced after 1983.100
In
retrospect, the Australian government now realizes the Japanese coal buyers have since 1990
been paying a premium for the steam coal that it procures from Australia.101
2.2.5 Queensland Becomes Australia’s Largest Black Coal Producer
Between 1960 and 1986, Australia‘s black coal industry also diversified the supply side of its
export business with Queensland replacing NSW as Australia‘s largest black coal exporter in
1975.102
Queensland‘s expansion of its black coal production was largely the work of Utah
International (Utah), an American mining company. Between 1973 and 1982, Utah accounted
for more than 70 percent of Queensland‘s black coal exports.103
Utah‘s share of Queensland‘s
total coal exports dropped from a peak of 85 percent in 1978 to 39 percent by the end of the
rapid growth phase.104
100
See Bowen, Bruce, and Peter Gooday, ―Coal: The economics of coal export controls,‖ ABARE Research
Report 93.8, ABARE 1993. 101
ABARE, ―Australian Commodity Statistics 2001,‖ Tables 253 and 257, pp. 253 and 258. ABARE commodity
statistics for the period 1990-2000 indicate that the FOB price paid by Japan for Australian steam coal was
higher than the average FOB prices paid by European and other Asian buyers of Australian steam coal.
Moreover, ABARE commodity statistics for the period 1992-2000, indicate that Japan sourced 60 percent to
70 percent of its steam coal and 45 percent to 58 percent of its coking coal from Australia. Japan‘s heavy
dependence on Australia for its black coal supplies probably acted to neutralize most of Japan‘s market power
over Australia‘s black coal producers. 102
NSW still remained the largest producer of saleable black coal due to the large quantity of black coal used by
NSW‘s steel-making and power-generating industries. In 1975, NSW consumed 19 mt of black coal in
domestic markets while Queensland had a much smaller domestic market requirement of 5.3 mt. It wasn‘t
until 1983 that Queensland became the largest total producer of saleable black coal. 103
Utah International also played a major role in establishing Indonesia‘s coal industry on Kalimantan. For a
superbly researched book on the subject of Utah International‘s role in the development of Queensland‘s
black coal industry, the reader is referred to Galligan, Brian, Utah and Queensland Coal: A Study in the
Micro Political Economy of Modern Capitalism and the State, University of Queensland Press, 1989. 104
Galligan, Brian, Utah and Queensland Coal: A Study in the Micro Political Economy of Modern Capitalism
and the State, University of Queensland Press, 1989, Table 1, p. 27.
Page 40
28 March 2011 40 PESD WP #101
The shift in supply-side dominance from NSW to Queensland was not due to lack of growth in
NSW‘s exports of black coal. NSW black coal exports increased during this development
phase at a growth rate of more than 21 percent per year, with export tonnage increasing from
1.9 mt in 1960 to 42.2 mt in 1986.105
It was just that Queensland‘s export growth was so much
faster. Over this same period, Queensland‘s black coal exports grew at 33 percent per year.
Starting from a very small export tonnage of 48,000 tonnes in 1960 and representing just 2
percent of Australia‘s black coal exports, Queensland‘s black coal exports grew to 53.5 mt in
1986, which translated into a 56 percent share of total black coal exports (Figure 11).106
Figure 11: Queensland and NSW Shares of Black Coal Exports, 1960 and 1986
1960 1986
Source: Joint Coal Board, ―Black Coal in Australia, 1986-87,‖ Table 100, p. 97.
In addition to having vast coking coal deposits that were amendable to open-cut mining,
Queensland also had a better ―topography‖; it had multiple locations for constructing deep-sea
coal ports, such as Gladstone, Hay Point, and Abbot Point. NSW‘s coal industry, on the other
hand, was largely limited to the Port of Newcastle for exporting its coals due to draft
limitations along most of its coast and mountain ranges that separate the inland Hunter Valley
coalfields from the coast. Finally, Queensland‘s coal export terminals, especially the Abbot
Point Coal Terminal, are located closer to the markets of North Asia, the largest market for
Australia‘s black coal during the rapid growth phase. Abbot Point in particular has a round-trip
105
Joint Coal Board, ―Black Coal in Australia, 1986-87,‖ Table 100, p. 97. 106
Ibid.
QLD 2%
NSW 98%
QLD 56%
NSW 98%
Page 41
28 March 2011 41 PESD WP #101
sea vessel journey to Japan that is at least two days shorter than the round-trip journey from the
Port of Newcastle to Japan.
2.2.6 Product Diversification
A third area of export diversification was in the types of coal offered to its customers. From
1960 through 1975, Australia‘s black coal industry shifted from almost total reliance on coking
coal as its sole coal export to a combination of coking and steam coal. While there are multiple
grades of coking coal, Australia, at the beginning of the rapid growth phase, was dependent on
a single industry—steelmaking. The small amount of steam coal that was exported over that
period was largely to Europe.
Between 1960 and 1969, steam coal exports increased from 85,000 tonnes to 877,000 tonnes,
an impressive growth rate of 30 percent per year, but the quantities were still so small as to be
considered negligible.107
From 1976 onward, however, exports of steam coal continued to
grow at 31 percent per year, resulting in steam coal exports increasing from 3.2 mt in 1976 to
45.9mt in 1986.108
Coking coal‘s share of Australia‘s black coal exports was 52 percent in
1986, still a large market share but down significantly from its overwhelmingly large 1960
market share of 96 percent (Figure 12).109
107
Ibid. 108
Ibid. 109
Ibid.
Page 42
28 March 2011 42 PESD WP #101
Figure 12: Steam Coal and Coking Coal Shares of Total Exports, 1960 and 1986
1960 1986
Source: Joint Coal Board, ―Black Coal in Australia, 1986-87,‖ January 1988, Table 100, page 97.
The shift in exports from coking coal to steam coal was largely the result of the Arab Oil
Embargo of 1973, which led OPEC to increase its posted crude price from $2.50 in early 1973
to more than $12 per barrel by 1975. This massive oil price increases put ―at risk‖ Asia‘s
power systems, which were almost totally dependent on cheap oil. The growth in steam coal
exports was ―encouraged‖ further by the Iranian Oil Crisis of 1978, which resulted in the
OPEC posted price peaking at $39.50 per barrel in 1980. As a result of these two oil price
shocks, Japan, and later Taiwan and Korea, saw steam coal and uranium as the most cost-
effective alternatives to petroleum products as a fuel source for power generation and over the
period 1980–1995 built many new coal-fired power plants, which expanded their demands for
Australian steam coal.
2.2.7 Port System Expansion
The major coal handling ports of NSW (Newcastle) and Queensland (Gladstone, Hay Point and
Abbot Point) were either built or expanded during the rapid growth phase.
The Port of Newcastle, which as of 2010 was the world‘s largest coal export port, has the
longest history of all of Australia‘s world-scale coal export ports. Its first commercial shipment
of coal—50 tonnes—occurred in 1799.110
During the rapid growth phase, the Port of
Newcastle became a significant player in the coal export markets with the commissioning of
110
http://www.newportcorp.com.au/site/index.cfm?display=111710 (History, Australia‘s First Port).
Steam 4%
Coking 96%
Steam 48%
Coking 52%
Page 43
28 March 2011 43 PESD WP #101
two coal terminals known as Carrington and Kooragang. The Carrington Coal Terminal (CCT)
was commissioned in 1976 with a ship loading capacity of 16 mtpa while the Kooragang Coal
Terminal (KCT) was commissioned in 1984 with an initial ship loading capacity of 25 mtpa.111
The Port of Gladstone commissioned two coal terminals—the Barney Point Coal Terminal
(BPCT) and the RG Tanna Coal Terminal (RGTCT)—during the rapid growth phase. BPCT
was commissioned in 1967 as a dedicated terminal for the export of Moura coal produced by
the Thiess Peabody Mitsui (TPM) Coal Pty. Ltd.112
The Port of Gladstone commenced the
construction of BPCT in the mid-1960s with first coal (1,600t) shipped from BPCT in 1967.113
Gladstone Port Authority (GPA), which is now known as the Gladstone Ports Corporation
(GPC), purchased BPCT in 1968. RGTCT, which was originally named the Clinton Coal
Facility, was approved for construction by the GPA in 1976 after BHP Co. Ltd. confirmed that
it had secured long-term contracts for the sale of coking coal to Japanese steel mills.114
Stage
one of the facility was completed in 1980 at a cost of A$45 million. During its first full year of
operation, RGTCT exported 4.3 Mt of coal. 115
The Port of Hay Point, which is located in Queensland, north of Gladstone, is Australia‘s
second largest coal export port. It is owned by the North Queensland Bulk Ports Corporation
(NQBP), which was formed in July 2009 through the merger of the Ports Corporation of
Queensland, with the Port of Mackay. Hay Point consists of two coal terminals, Hay Point and
Dalrymple Bay. The Hay Point Coal Terminal (HPCT) was originally constructed and owned
by Utah International.116
It has been operating since 1971. It is currently owned and operated
by the BHP Billiton Mitsubishi Alliance (BMA) and serves as a dedicated terminal for coal
exports of BMA.117
The Dalrymple Bay Coal Terminal (DBCT) was commissioned in 1983 as
a common user facility with a ship loading capacity of 15 mtpa.118
111
http://www.newportcorp.com.au/site/index.cfm?display=111710 (Port of Newcastle; Facilities). 112
http://www.gpcl.com.au/history.html (About GPC; History of GPC). 113
Ibid. 114
Ibid. In 1994, the Clinton Coal Facility was renamed the RG Tanna Coal Terminal (RGTCT), ―in recognition
of the efforts of Reg Tanna,‖ general manager of the Port of Gladstone during the early 1990s. 115
Ibid. 116
Galligan, Brian, Utah and Queensland Coal: A Study in the Micro Political Economy of Modern Capitalism
and the State, University of Queensland Press, 1989, p. 104. 117
http://www.nqbp.com.au/index.cfm?contentID=4 (NQBP Ports; Hay Point). 118
Ibid (NQBP Ports, Hay Point).
Page 44
28 March 2011 44 PESD WP #101
The Port of Abbot Point, which is located in the far north of Queensland, is also owned and
operated by the North Queensland Ports Corporation. It contains a coal terminal, known as
Abbot Point Coal Terminal (APCT), which was commissioned in the early 1980s.119
It is
owned by the Abbot Point Bulk Coal Pty. Ltd., a subsidiary of Xstrata Coal Queensland Pty.
Ltd. Information on APCT‘s actual commissioning date and initial ship loading capacity was
not available, either online or from other sources. Other ports located in Queensland and NSW
with coal handling capability are Brisbane in Queensland and Port Kembla in NSW.
Information on their commissioning dates and initial ship loading capacities were also not
available from online sources such as the port authority‘s website.
2.2.8 Rail Transport Systems
During the rapid growth phase, the states of Queensland and NSW constructed extensive rail
networks to haul coal from their inland coal mines to coastal export ports. They also
constructed railway spurs that delivered coal to specific power plants throughout each state.
For the entire rapid growth phase, the railway systems of NSW and Queensland were owned
and operated by the governments of the states within which they operated.120
The starting point for the development of Queensland‘s rail system was 1884, when the
Griffith government secured a 10 million pound loan for railroad expansion. These early rail
lines were primarily to haul passengers and agricultural products to market, which is not
surprising since Queensland‘s coal production amounted to less than 100,000 tonnes in 1881
and remained below 1 mtpa until 1913. 121
It was not until the late 1960s that the government of Queensland made a serious effort to
develop a rail network for hauling coal from the Bowen Basin to the ports of Gladstone and
Hay Point. The first major coal haul line was the Moura Short Line, which was completed in
119
http://www.dip.qld.gov.au/resources/major-projects/presentations/mpc10/brad-fish.pdf. 120
During the period 1850-1860, the state colonial governments were willing to allow the private sector to build,
own, and operate rail systems. However, due to financial constraints, these private rail systems were within a
short period of time taken over by government. For example, a private company, which attempted to build a
railway in NSW in 1854, went bankrupt in 1855 and had to be taken over by the government before
completion. South Australia's railways were government owned from the beginning, including a horse-drawn
line that opened in 1854 and a steam-powered line that opened in 1856. In Victoria, private railways became
insolvent soon after starting operations and were soon thereafter taken over by the colony government. 121
Official Australia Yearbook, 1916, ―Non-Metallic Minerals: Coal,‖ p. 426.
Page 45
28 March 2011 45 PESD WP #101
1968 with funding provided by Theiss Brothers and other mining companies.122
It was built
and operated by government-owned Queensland Railways (QR), as part of its network.123
Between 1960 and 1984, QR constructed additional coal haul lines between coal mines located
at (a) Moura, (b) Koorilgah, (c) Laleham, (d) Curragh, (e) Gregory, and (f) Gordonstone to the
Port of Gladstone. Spur lines and other expansions were constructed in the Blackwater area, as
well as on the Goonyella system from the Port of Hay Point to Goonyella and Blair Athol.
Many of these lines were funded by Utah International, Theiss Brothers, and other mining
companies that were developing mines in the Bowen Basin.124
Other mineral haul lines were built to Cobarra near Townsville and Greenvale for nickel ore
and Phosphate Hill in the Cloncurry district. In the mid-1980s the main coal haul rail lines in
central Queensland were electrified and more than 1,600 kilometers of railway lines were
upgraded to allow increased amounts of coal being moved to export ports in central
Queensland.125
2.2.9 Domestic Consumption
During Australia‘s rapid growth phase, domestic markets for black coal became increasingly
dominated by the power industry with steel and iron production and other industries combined
providing a ―second‖ significant domestic market. The power industry was always a large
black coal user. The change was one of consolidation with the disappearance of three
previously significant users of black coal—railway locomotives, town gas producers, and sea
vessels. Figure 13 shows the evolution of the domestic black coal market for all of Australia
between 1960 and 1986.
The loss of the town gas business started in the 1950s with the replacement of town gas with
low-cost refinery gases.126
However, the ultimate demise of the town gas business resulted
from the discovery, in 1967, of large oil and gas fields in the Gippsland Basin, which is located
offshore from the state of Victoria. A gas pipeline system was developed, and natural gas
supplies from the offshore Gippsland oil and gas fields and the onshore gas fields of the
Cooper Basin were brought to most major cities. The development of the retail gas industry in
122
Galligan, Brian, Utah and Queensland Coal: A study in the Micro Political Economy of Modern Capitalism
and the State, University of Queensland Press, 1989, pp. 202-203. 123
Ibid. 124
Ibid, pp. 43-76. 125
www.qld.gov.au/assetssale/businesses/qr-national/docs/railing-queenslands-coal-section-2.pdf, section 2: The
Tracks, p. 10. 126
http://www.austehc.unimelb.edu.au/tia/820.html (Manufactured Gas; The New Technology).
Page 46
28 March 2011 46 PESD WP #101
NSW, Queensland, Victoria, and South Australia led to the shutdown of most town gas plants
by 1975.
Figure 13: Shares of Domestic Consumption by Industry, 1960 and 1986
1960 1986
Sources: Australian Official Year Book,
#49,1962, p. 1090.
Joint Coal Board, ―Black Coal in Australia,
1986-1987,‖ Table 133, p.126.
General industry, commercial, and domestic consumers also made a significant shift out of
coal and into natural gas and petroleum products over this time period. This shift was made
for reasons of cost as well as convenience. Ironically, the domestic market experienced a
growth slowdown and became more concentrated over the industry‘s rapid growth phase,
while the export side of the business experienced exceptional growth and diversification. The
domestic market diversified somewhat from one that was dominated by NSW to one that had
a slightly better balance between states (Figure 14).
Other Industry
35% Power
Generation 73%
Steel Making
26% Power
Generation
39%
Steel
Making 16%
Page 47
28 March 2011 47 PESD WP #101
Figure 14: Queensland Doubled Its Share of Black Coal Consumption between 1960 and
1986
1960 1986
Sources: Joint Coal Board, ―19th
Annual
Report, 1965-1966,‖ Table 36, p. 71.
Joint Coal Board, ―Black Coal in Australia,
1986-1987,‖ Table 132, p. 125.
2.2.10 Evolution of Mining Regulatory Frameworks
During the rapid growth period, each state maintained its own laws and regulations related to
the awarding of coal exploration and mining licenses, known in Australia as tenements.127
In
general, these mining laws were attuned to the production methods and technologies in use
prior to WWII, a time when coal mining was a small-scale, labor-intensive industry. For
example, Queensland‘s coal mining companies, during the 1960s, were regulated under a
mining law that was passed into law in 1925.128
During the 1960s and 1970s, especially in the state of Queensland, large mines were
developed in outlying areas lacking rail and basic community infrastructure and amenities.
Developing these new mining areas required the private companies to make massive
investments in new rail and port facilities and to support the establishment of new
communities and towns for housing the miners and their families. Despite being subjected to
numerous amendments, the existing laws and supporting regulations did not provide a
127
Limited information is available from government sources concerning the specific regulations and laws that
were in force during the rapid growth phase. 128
Queensland State Government, ―Coal Mining Act 1925.‖
QLD 13%
NSW 68%
Other States 19%
QLD 27%
NSW 58%
Other States 15%
Page 48
28 March 2011 48 PESD WP #101
sufficient framework for developing these large-scale, capital-intensive mechanized mining
operations.129
To get around the limitations of archaic mining laws, mining companies were forced to
engage in negotiations with the minister responsible for mining in each state in order to
obtain licenses over large areas. The terms and conditions of the agreements reached between
each company and the relevant minister were then embodied in an act of that state‘s
Parliament.130
In the case of Queensland, an act of Parliament, known as the Central
Queensland Coal Associates (CQCA) Agreement Act, No. 58 of 1968, assented to on
December 24, 1968, was passed into law and appears to have provided most of the regulatory
support for open-cut coal projects implemented during the 1970s and 1980s.131
This cumbersome and uncertain method of acquiring a new mining license required numerous
amendments to the special law(s) passed to support the development of specific projects. The
process of making these amendments and passing special laws was very expensive for
individual companies to pursue and politically risky for both companies and governments to
implement. In 1972, the Queensland government passed into law the Queensland Mining Act
of 1968 to 1971 to resolve the issues related to ad hoc licensing agreements. NSW followed
with the New South Wales Act 1973, which become effective as a law in 1974. South Australia
also passed a new mining law in 1972.132
But even these so-called ―modern mining acts‖ were found to be wanting and the ad hoc
approach to issuing a mining license, i.e., direct negotiations with the minister-in-charge
followed by the passing into law either a supporting act of Parliament or an amendment to an
existing act, continued to be used by the governments of Queensland and NSW as part of the
129
Brian Galligan‘s Utah and Queensland Coal: A Study in the Micro Political Economy of Modern Capitalism
and the State, University of Queensland Press, 1989, pp. 44-76. 130
Official Yearbook of Australia, number 61, 1975-76, page 932. This ad hoc method of awarding mining
licenses was very similar to the approach followed by Indonesia between 1970 and 2000. In Indonesia,
government-to-business (G-T-B) agreements, known as coal contracts of work, effectively launched
Indonesia‘s steam coal industry, which to this day is dominated by companies operating under G-T-B
CCOWs (Bart Lucarelli, ―The History and Future of Indonesia‘s Coal Industry: Impact of Politics and
Regulatory Framework on Industry Structure and Performance,‖ PESD Working Paper #93, July 2010, pp.
17-35). This method of awarding mining licenses has now been officially replaced by a system of mining
licenses similar to the system that is now being followed in Australia. 131
Brian Galligan, Utah and Queensland Coal: A Study in the Micro Political Economy of Modern Capitalism
and the State, University of Queensland Press, 1989, pp. 45, 60-66. 132
Ibid.
Page 49
28 March 2011 49 PESD WP #101
process of awarding licenses for large mining projects.133
These government-to-business (G-T-
B) Agreements, such as the CQCA Agreement Act of 1968, had the force of law. This act,
which remains in effect today, led to the development of Queensland‘s vast coking coal
resources. During the mid-1970s, Utah International was producing more than 80 percent of
Queensland coal exports under the protection of the CQCA Agreement Act.134
The role of the JCB also changed. When it was established in 1946, the Commonwealth and
NSW governments empowered the JCB with broad and sweeping powers. In particular, they
set the powers and functions of the JCB to take any actions necessary in order to ensure that
(a) ―Coal is produced in the State (NSW) in such quantities and with such regularity as will
meet requirements throughout Australia and in trade with other countries;
(b) The coal resources of the State are conserved, developed, worked and used to the best
advantage in the public interest; and
(c) Coal produced in the State is distributed and used in such manner, quantities, classes
and grades and at such prices as are calculated best to serve the public interest and
secure the economical use of coal and the maintenance of essential services and
industrial activities.‖
The JCB also was mandated to promote the welfare of workers engaged in the coal industry in
the state. Of its four objectives, the JCB clearly viewed promoting the welfare of workers as
―subsidiary‖ to the other three objectives.
By 1970, the JCB was so successful in achieving its four objectives that its role shifted from
organizing the mechanization of mines, setting prices, and controlling production to a role that
focused on the publication of a very detailed statistics report titled ―Black Coal in Australia‖
and overseeing safety programs. In l983, the Commonwealth and NSW governments
conducted a review of the powers, structures, and membership of the JCB. The two
governments decided to keep the JCB‘s existing structure and powers but changed the
members of the JCB board to include union and mining company representatives. They also
required the JCB to appoint an independent chairman of the board. Although it was allowed to
133
Official Year of Australia, number 73, 1990, p. 469. 134
Indonesia copied the CQCA approach during the 1980s. Unsurprisingly, Utah International, one of the parties
to the CQCA, was a leading developer of mining areas on Kalimantan during the early 1980s.
Page 50
28 March 2011 50 PESD WP #101
continue its more limited operations, the continued role of the JCB was now starting to be
questioned within government and industry.
2.2.11 Export Contract Arrangements
Japan was the dominant export customer during the entire rapid growth period, though Korea
and Taiwan became significant customers toward the end of this period. Many Japanese
customers held equity stakes in their sources of coal supply through a Japanese trading house.
As buyers, the Japanese felt that their representation within the coal supply company would
allow cost-plus pricing arrangements to be effectively monitored for fairness.135
The objective
of Australian coal suppliers was to achieve revenue certainty, which would support bank and
equity financing for their green-field mining projects. In the case of the Japanese buyers, the
top concern was security of coal supply. Price appeared to be of secondary concern. In this
context, the interests of the buyer (Japanese steel mill or power utility) and seller (Australian
coal producer) appear to have been aligned at the start of the cost-plus negotiations.
Japanese customers and Australian coal suppliers opted for long-term, cost-plus coal supply
contracts with terms ranging from 10 to 15 years. The cost-plus agreements provided for a
starting coal price and pre-set escalation factors that allowed price adjustments over the term of
each contract.136
These contracts stipulated that the escalators and cost-plus arrangements were
to be reviewed after a fixed time period.
However, this arrangement became much more difficult for buyers to police than originally
expected. More importantly, the true market price, as measured by spot and later term contract
transactions, diverged significantly, year to year, from the prices resulting under the previously
agreed cost-plus mechanisms.137
This divergence from market became especially problematic
during the 1970s, when the price of oil and other commodities increased dramatically as a
result of the twin oil price shocks of 1973 and 1978.138
135
The best examples from Queensland were the Theiss-Mitsui and the Utah-Mitsubishi partnerships from the
1960s, which led to the development of the massive coking coal deposits of the Bowen Basin. Today, the
Utah-Mitsubishi partnership has morphed into the BHP-Billiton/Mitsubishi Alliance or BMA. 136
Productivity Commission, 1998, ―The Australian Black Coal Industry‖ Inquiry Report, AusInfo, Canberra,
vol. 2, Appendix D, p. 12. 137
Productivity Commission, 1998, ―The Australian Black Coal Industry‖ Inquiry Report, AusInfo, Canberra,
vol. 2, Appendix D, p. 12. 138
Ibid.
Page 51
28 March 2011 51 PESD WP #101
Over time, pricing provisions of term contracts were revised to allow annual negotiations of
the price, quantity, and quality for any coal sales in each year.139
Certain contracts such as the
Utah-Mitsubishi contracts with Japanese steel mills contained provisions that allowed
significant price adjustments in the event that cost-plus prices diverged from future spot and
term prices.140
Other contracts had their price provisions revised to reflect market conditions
either at the strong behest of the coal supplier or as a requirement of the Commonwealth
government during the 1970s. Once the long-term contracts expired, the parties to these
contracts had developed a sufficiently strong working relationship that they simply relied on
annual price and quantity negotiations rather than long-term contracts to determine price and
quantity of coal to be delivered in any years.141
2.2.12 Export Prices for Australian Black Coal
Between 1960 and 1973, the average A$ FOB price per tonne that Australian coal producers
received for their black coal exports varied between $8.00 and $12.50 per tonne. This period is
now viewed with a fair degree of nostalgia by coal buyers as a time when energy prices in
general and Australian black coal price in particular were stable and at very low levels. The
low energy price environment was supported by a stable US$:A$ exchange rate, which was the
result of the Bretton Woods Accord that the United States and other major Western economies
signed in 1944.
The stable and low energy price environment started to unravel during October 1971, when the
United States unilaterally terminated its participation in the Bretton Woods Accord. As a result
of its unilateral action, the US$ depreciated significantly against the A$ between 1972 and
1974. Since Australia‘s black coal exports were priced in US$, this market reaction would
normally have resulted in Australia‘s black coal producers reducing their output and/or
exerting pressure on miners to accept very small adjustments in their annual wages.
However, in October 1973, Australia‘s coal producers were rescued from that possible
predicament by OPEC, which imposed an embargo on oil exports to the United States and a
number of other Western countries as punishment for their bias toward Israel during the 1973
139
Ibid. 140
Brian Galligan Utah and Queensland Coal: A Study in the Micro Political Economy of Modern Capitalism
and the State, University of Queensland Press, 1989, p. 152 141
Productivity Commission, 1998, ―The Australian Black Coal Industry‖ Inquiry Report, AusInfo, Canberra,
vol. 2, Appendix D, p. 12
Page 52
28 March 2011 52 PESD WP #101
Yom Kippur War.142
Along with the oil embargo, Saudi Arabia and other Arab state members
increased OPEC‘s posted oil price in October 1973 from $3.00 per barrel to 5.11 per barrel.143
By 1975, the price of oil rose as high as $12 per barrel after which it traded between $12 and
$15 per barrel from 1975 through 1978. Then, in 1979, the shah of Iran fell, leading to the
Iranian Oil Crisis, which resulted in the price of oil increasing from $15.85 per barrel (April 5,
1979) to $39.50 per barrel in early 1980. From that point on, an oil glut emerged causing
nominal oil prices to slide to around $10 per barrel by 1986.144
The impact of the oil price increases and decreases during the 1970s and 1980s was a
significant factor in driving the expansion of Australia‘s black coal exports. The increase in the
FOB A$ price for Australian black coal provided Australian coal producers with substantial
windfall profits through 1980. Between 1980 and 1986, the nominal US$ price for Australian
black coal decreased from $54.85 to $36.65 per tonne, a 33 percent decline. However, the
impact on the A$ price of this large drop in the US$ price was more than offset by the 40
percent depreciation in the A$ against the US$ over the same time period (Figure 15).
142
Jay Hawkes, ―35 Years After the Arab Oil‖, 06 October 2008 (www.ensec.org/index?view=article&catid
http://www.ensec.org/index.php?view=article&catiden) . 143
Daniel Yergin, ―The Prize: The Epic Quest for Oil, Money and Power (New York: Simon and Shuster, 2008),
p.589. 144
James L. Williams ―Oil Price History And Analysis‖(2007: WTRG Economics) available from
http://www.wtrg.com/prices.htm)
Page 53
28 March 2011 53 PESD WP #101
Figure 15: Changes in the Average Nominal FOB Price for Australian Black Coal in A$
and US$ per Tonne, 1960-1986
Source: Joint Coal Board ―Black Coal in Australia,‖ Table 108, p. 104.
2.2.13 Establishment of the Australasian Joint Ore Reserves Committee (JORC)
One under-reported ―regulatory‖ event during the rapid growth phase, which has become of
great value to the mining industry, was the establishment of the Australasian Joint Ore
Reserves Committee (JORC).145
The Australian Mining Council (AMC) created JORC in 1971
with the mandate to develop clear and consistent rules and guidelines for mining companies to
apply before making any public declarations of their mineral resources and reserves.146
JORC issued a number of reports between 1972 and 1989, which recommended improved
procedures for publicly reporting and classifying coal deposits. These reports formed the basis
for the first JORC Code, which was issued in 1989.147
It was immediately adopted by the
Australian Stock Exchange (ASX) and imposed by the ASX as a mandatory requirement for all
publicly listed coal mining companies to use when reporting their ore reserves. The JORC
145
Joint Ore Reserves Committee, ―JORC — Its History, its Sponsors, and Current Committee,‖ September 27,
2009, p. 1. 146
Ibid. The AMC created JORC to address ―unacceptable reporting associated with the Poseidon nickel boom
and bust in Western Australia,‖ an event that occurred during the late 1960s and destroyed investor
confidence in the declarations of reserves by many publicly traded mining companies. 147
Ibid.
0
0.2
0.4
0.6
0.8
1
1.2
1.4
1.6
0
10
20
30
40
50
60
7019
60
19
62
19
64
19
66
19
68
19
70
19
72
19
74
19
76
19
78
19
80
19
82
19
84
19
86
Exch R
ate
US
$/A
$
$ p
er
to
nn
e
A$/t US$/t Exch Rate
Page 54
28 March 2011 54 PESD WP #101
Code is now in its fourth version and is widely accepted in Australia and throughout Asia as
the highest standard for reporting coal resources and reserves.
2.3 The Competitive Phase (1987-2003)
The greatest industry concern throughout the 1990s and the competitive phase was whether
Australia could continue to compete in Asian markets against competitors from Indonesia and
China. The competitive phase lasted for 16 years, with many industry analysts believing, as
late as 2003, that it would continue for at least another decade.
2.3.1 Declining Real FOB Prices and International Competitiveness
Between 1987 and 1996, Australian black coal producers experienced a 16 percent decline in
the average real price for their black coal exports. (Figure 16) Then, in 1997, Australia‘s black
coal producers were confronted by the Asian Financial Crisis, which continued to adversely
impact Asian demand for black coal through 2003.148
In response to these threats to Australia‘s black coal industry, Australia‘s Commonwealth
government commissioned the Productivity Commission in 1997 to examine the competitive
position of Australia‘s black coal industry and make recommendations for improving its
international competitiveness.149
The commission delivered a two-volume report that provided
an insightful critique of inefficient labor practices mostly at underground mines still using the
bord and pillar production method and government-imposed monopoly fees on users of
government-owned ports and rail networks.
148
Although the average FOB price of Australia‘s black coal exports increased by 16 percent per year between
2004 and 2007, price changes of this magnitude were not immediately recognized as a structural change in
the industry. The industry had experienced stable or declining prices for so long that few were willing to
second- guess historic price trends based on one or two years of price increases. 149
Productivity Commission, 1998 ―The Australian Black Coal Industry‖ Inquiry Report, AusInfo, Canberra.
Page 55
28 March 2011 55 PESD WP #101
Figure 16: Changes in Nominal and Real Prices of Australian Black Coal in A$ per
Tonne, 1987-2007
Source: Joint Coal Board, ―Black Coal in Australia, 1986-87‖ Table 108, p. 104 for nominal price data.
Between 1987 and 1991, one might have easily missed the emerging competitive threats to
Australia‘s black coal industry. In absolute terms, Australia‘s black coal industry continued to
expand with increases in saleable coal production above 10 mtpa for four out of those five
years. Moreover, coal mining companies were able to continue to reap profits by utilizing the
spare capacity resulting from past investments in transportation infrastructure and mine
capacity. Finally, Indonesian and Chinese competitors had not yet entered the export market in
a significant way.
By 1997, the year that the Asian Financial Crisis broke, it was impossible to ignore reality any
longer. Growth in coal exports had slowed dramatically from 16 percent per year during the
rapid growth phase to less than 4 percent between the first 10 years of the competitive phase
(1987-1996). Over the same 10-year period, real FOB prices for Australia‘s black coal exports
had tumbled by 16 percent. Although worker output per hour had improved by 40 percent
between 1987 and 1996, a significant portion of the productivity gains were likely offset by
higher wages and costs of materials and other inputs to the mining process.150
150
Joint Coal Board/Queensland Coal Board, ―1996 Australian Black Coal Statistics,‖ Table 21, p. 20. The JCB
stopped publishing statistics on average earnings of mine workers in the NSW coal mining industry after
1982 and one can only speculate that productivity gains were offset by higher nominal wages.
0
20
40
60
80
100
120
1987 1989 1991 1993 1995 1997 1999 2001 2003 2005 2007
Nominal FOB Price (A$/t) Real FOB Price (A$/t)
A$
/to
nn
e
Page 56
28 March 2011 56 PESD WP #101
2.3.2 Supply-Side Factors
Up until the start of Asian financial crisis in 1997, supply-side factors seemed to be the only
reasons for the slowdown in Australia‘s black coal exports. The two headline supply events
were the massive decline in the price of oil due to the oil glut of the 1980s and the emergence,
in 1995, of Indonesia as a major supplier of steam coal into the Asia Pacific region.151
From
1995 through 2003, Indonesian coal suppliers sold their coals to power companies located in
North and Southeast Asia at a significant energy-adjusted discount to the delivered prices
charged by Australian producers, which enabled them to take market share from Australian
producers.
They were able to do so because of the low stripping ratios of their bituminous and sub-
bituminous coal deposits and government-subsidized diesel prices that kept their cash costs of
production very low. By offering its coals at a significant discount to Newcastle grade coals on
an energy-adjusted basis and also allowing its customers to ―capture the benefits‖ of any
savings on transportation costs, Indonesia‘s coal producers were able to gain an increasing
share of the Asian steam coal market over time. By 2006, Indonesia became the world‘s largest
steam coal exporter in raw tonnage terms.
Over the competitive phase, the governments of NSW and Queensland were either unable or
unwilling to expand their rail and port infrastructure quickly enough to allow them to fully
compete for those markets. Indonesia, on the other hand, had a more flexible inland
transportation system dependent on river barges, trucks, and floating transshipment facilities,
which were easily expandable on an annual basis, allowing Indonesian suppliers to quickly
ramp up production over the past two decades.152
2.3.3 Exchange Rate Effects
Except for the three-year period when the region was affected by the Asian Financial Crisis
(1998-2001), exchange rate movements do not appear to have had much effect on the volatility
of FOB prices for Australian black coal during the competitive phase (Figure 17). The jumps
in price during the volatile price phase can be almost entirely attributed to other aspects of
151
Lucarelli, Bart, ―The History and Future of Indonesia‘s Coal Industry: Impact of Politics and Regulatory
Framework on Industry Structure and Performance,‖ (Program for Energy and Sustainable Development,
Stanford University) Working Paper #93, July 2010. 152
Ibid.
Page 57
28 March 2011 57 PESD WP #101
demand and supply for black coal exports, such as strong demand for steam coal from China
and chronic transportation infrastructure constraints and weather-related events.
Figure 17: FOB Price Performance of Australian Black Coal Exports in A$ and US$ per
Tonne, 1987 – 2006 (average price for all exports)
Source: Coal Services Pty. Ltd./Queensland Department of Mines and Energy ―1996 Australian Black Coal
Statistics‖ Table 40, p.38 for data from 1987 to 1995 and ―2006 Australian Black Coal Statistics‖ Table 42, p. 39
for data from 1996 to 2006.
2.3.4 Continued Application of New Mining Technology
The application of new mining technology in Australia continued during the competitive
phase. For example, underground mines in NSW increased their production of raw coal ―from
long wall faces‖ from 16.6 mt in 1986 (32 percent of total underground coal production) to
36.4 mt (77 percent of underground production) by 2003.153
But open-cut mining was clearly
the mining method of choice for those deposits that were amenable to open-cut mining.
Between 1986 and 2003, saleable coal produced from all Australian open-cut mines increased
from 98 mt to 219 mt respectively.154
153
Joint Coal Board, ―Black Coal in Australia, 1986-87,‖ Table 19, p. 22 and Coal Services Pty.,
Ltd./Queensland Department of Mines and Energy, ―2006 Australian Black Coal Statistics,‖ Table 13, p. 11.
(Note: 2003 and 2006 figure for all of Australia was 72.6 mt, 90 percent of underground production, and 80.9
mt, 91 percent of underground production, for 2003 and 2006 respectively.) 154
Ibid.
0
20
40
60
80
100
120
198
7
198
9
199
1
199
3
199
5
199
7
199
9
200
1
200
3
2005
200
7
$ p
er
ton
ne
A$ US$
<----------------- Competitive Phase -------------->
Page 58
28 March 2011 58 PESD WP #101
2.3.5 Changes to the Coal Industry Regulatory Framework
During the competitive phase, the governments of NSW and Queensland made a number of
important changes to their coal mining regulatory frameworks for NSW and Queensland. In
the case of Queensland, the state Parliament passed the Mineral Resources Act 1989, which
was assented to in 1990 and signed into law in 1992. The Parliament of NSW passed similar
legislation in 1992, titled the Mining Act of 1992. These acts, which were passed mostly in
response to the move to large open-cut mining projects in Queensland and NSW during the late
1960s and through the 1970s, allowed for the allocation of larger coal exploration blocks and
mining areas and for the provision of community services, taking away most of the need for
government-to-business (G-T-B) agreements.155
In addition, by the late 1980s, both NSW and Queensland were financially strong and their
state-owned rail and port companies were able to support infrastructure expansion on their
own. A mining company‘s requirements for participating in the development of new
infrastructure were now handled via business-to-business (B-T-B) agreements between the
mining company and the government-owned corporations that operated the rail and port
networks. These B-T-B agreements were entered into without the state guarantees being
required from government-owned rail and port corporations.
Other regulatory changes included the 1993 passing into law of the Commonwealth Native
Title Act, which required holders of mining tenements to conduct negotiations with native land
holders (aboriginal persons) on just compensation and other matters related to native land
rights.156
Other laws related to the allocation of water rights and environmental impact
assessments were either passed or amended during the competitive phase and required
amendments to the Queensland Mineral Resources Act of 1989 and the NSW Mining Act of
1992.
Significant changes to regulatory bodies also occurred during the competitive phase. By the
start of the competitive phase, Australia‘s black coal industry had matured to a point where
there was no longer a need for industry-specific regulatory bodies, such as the JCB, the CIT,
the QCB, and the Mines Rescue Board, with broad mandates to regulate levels of production,
155
The Queensland Mineral Resources Act 1989 covered all topics and regulatory issues related to the
exploration for mineral resources, awarding of licenses, and development of mines. Health and safety matters
were still handled under the Coal Mining Act 1925, which remained in force until 1999, when it was repealed
and replaced by the Coal Mining Safety and Health 1999. 156
http://www.dfat.gov.au/facts/indigenous_land_rights.html.
Page 59
28 March 2011 59 PESD WP #101
pricing, and technology adoption for Australia‘s black coal industry. The CIT and QCB were
dissolved in the late 1990s. The functions of the QCB were taken over by Queensland‘s
Department of Mines and Energy and the CIT‘s functions were folded into the appropriate
labor relations agencies of the Commonwealth and NSW governments. However, the JCB
managed to last until 2002, when it too was dissolved and its remaining functions transferred
to Coal Services Pty. Ltd., a newly formed agency owned by the NSW coal industry.157
Coal
Services functions were limited to workers‘ compensation, occupational health and
rehabilitation, and mines rescue services to the New South Wales coal industry.158
It also has
responsibility for compiling black coal statistics and selling them in report form to interested
parties.
One other significant change to the regulatory framework during the competitive phase
resulted from the successful asset privatization (asset sales) by the governments of NSW and
Queensland of their port and rail systems. In 2002, the NSW government allowed private
companies to own and operate rolling stock on its fixed rail lines. The bulk of NSW‘s freight
rail network is now being operated by Asciano, a private company traded on the ASX, under a
long-term lease with the government of NSW.159
2.3.6 Industry Concentration
Four large coal producers—BMA, (BHP-Billiton and Mitsubishi Development), Rio Tinto,
Xstrata, and Anglo American—have accounted for most of the country‘s saleable black coal
production and exports since 2001. These four large companies, referred to in the coal industry
as ―the Big Four,‖ increased their production, exports, and control over recoverable black coal
reserves primarily through acquisitions, with the objective of achieving economies of scale in
the mining, distribution, and marketing of black coal.160
With respect to their acquisitions, the largest acquired assets were those of the major oil
companies—Shell, Arco, Exxon, and MIM Holdings.161
These four companies, along with
Peabody Coal and Coal and Allied Industries, sold their coal assets to the Big Four between
157
National Archives of Australia, ―CA 154, Joint Coal Board‖
(http://naa12.naa.gov.au/SearchNRetrieve/Interface/DetailsReports/AgencyDetail.aspx?reg_no=CA%20154.
The NSW Minerals Council and the miner union, CFMEU, each own 50 percent of Coal Services. 158
Ibid. 159
Asciano is a private company traded over the Australian Stock Exchange. 160
Mimuroto, Yoshimitsu, Toru Kimura, and Koichi Koizumi, ―Restructuring of the Coal Industry in
Australia,‖ February 2004. 161
Ibid.
Page 60
28 March 2011 60 PESD WP #101
1997 and 2002, a time when prices for coal and other commodities were depressed and
expected to remain so into the foreseeable future.162
It was also a time when CO2 emissions
from coal-fired power plants and global warming in general started to take center stage as an
international environmental issue. As a result of these market and regulatory considerations,
major oil companies decided it was best to focus on fossil fuel assets that had less exposure to
climate change policies.
In 1997, Shell, Arco, Exxon, MIM Holdings, Peabody Coal, and QCT accounted for 20
percent of Australia‘s saleable black coal production while the Big Four accounted for only
38percent of saleable production. As a result of their acquisitions and also through organic
growth, the Big Four achieved a sizeable 64 percent share of Australia‘s production of saleable
black coal by 2002.163
2.4 Volatile Price Phase (2004-Present)
Despite a tightening of the Asian coal market in 2004, most analysts believed that the price of
coal would remain subdued into the foreseeable future. The period from 1980 through 2003
was one in which prices for both coking and steam coals were either stable or declining (Figure
18).
2.4.1 Start of Asian Coal Price Volatility
After 2003, however, a very wide price differential developed in favor of coking coal. This
increase in the coking to steam coal price differential caused supplies of PCI coals, which
previously were being sold into the steam coal market, to be redirected back into the coking
coal market due to the higher price they would earn if sold as PCI coals. These substitution
effects added to the price volatility of steam coal over the period 2004-2009.
For both coking and steam coal, the largest price increases occurred between 2007 and July
2008. They were due to (a) sudden increases in steam coal imports by China on regional
demand for steam coal; (b) the shutdown of nuclear power plants in Japan for safety reasons
that created an unexpected increase in that country‘s demand for steam coal; and (c) supply
162
Ibid. 163
Ibid, p. 3.
Page 61
28 March 2011 61 PESD WP #101
shortfalls in China, Australia, Indonesia, and South Africa due to exceptionally bad weather
plus chronic rail and port infrastructure constraints in Australia.164
Figure 18: FOB Prices for Australian Coking and Steam Coals, 1980-2009 in US$/Tonne
Source: ABARE Commodity Statistics, 2001 and 2009
2.4.2 Exports
By the beginning of the competitive phase in 1987, Queensland increased its share of exports
such that it had surpassed NSW in total production of saleable black coal.165
Thereafter,
Queensland and NSW were roughly equal in their annual production increases. In 2008, five
years after the end of the competitive phase, Queensland accounted for 60 percent of
Australia‘s black coal exports and NSW for the remaining 40% of black coal exports (see
164
Other supply-side factors, which contributed to the large price increases between 2007 and mid-2008, are the
following:
The Indonesian government‘s removal in 2005 of price subsidies on diesel and fuel oil, which caused
most Indonesian coal producers to experience significant increases in their costs of mining.
The decline in the US$ relative to the Australian $ and the Indonesian rupiah caused the US$ costs of
Australian and Indonesian coal producers to increase. On average, over the period 2005 and 2008, the
Australian $ and Indonesia rupiah appreciated by 60 percent and 15 percent respectively against the US$.
Most Indonesian coal producers had ―sold out‖ their low-cost bituminous and sub-bituminous coal
reserves and were starting to develop new resources with lower CVs, located further inland without
transport infrastructure but with higher stripping ratios than existing coal reserves. 165
In 1987, Queensland produced 70.6 mt (48 percent) of black coal versus NSW‘s 70.1 mt (47 percent). See
Joint Coal Board, ―Black Coal In Australia, 1997-98, June 1999,‖ Table 9, p. 8.
0
50
100
150
200
250
1980
1981
1982
1983
1984
1985
1986
1987
1988
1989
1990
1991
1992
1993
1994
1995
1996
1997
1998
1999
2000
2001
2002
2003
2004
2005
2006
2007
2008
(est
)
2009
(f)
US
$ / t
onne
Steam Coal Coking Coal
<------- Competitive Phase --------->
Volatile Phase
Page 62
28 March 2011 62 PESD WP #101
Figure 19).166
In 2008, steam coal exports reached 132.4 mt and 50% of total black coal
exports, up from 102.2 mt and 45% of black coal exports in 1987.167
Although the shift in exports was from coking coal to steam coal over this period, Queensland
still remained largely a producer of coking coal, which made up 74 percent of its exports. But
this is likely to change over the next decade once Hancock Coal, Waratah and Bandana
(Galilee Basin) and Xstrata and Syntech (Surat Basin) bring their vast deposits of steam coal
into production between 2013 and 2015.
Japan remained Australia‘s largest single export customer into the volatile price phase,
accounting for 42 percent of 2008 black coal exports.168
However, by 2008, in an unexpected
reversal of positions, Japan relied on Australia for around 70 percent of its black coal
imports.169
Significant growth in demand from Korea and Taiwan resulted in these two
countries accounting for 27 percent of Australia‘s 2008 black coal exports.170
More recently,
starting in 2009, demand by China and India for Australia‘s hard coking coal has contributed
to the shift in market share away from Japan and over to other Asian destinations. But these
two countries have had very little impact on steam coal exports from Australia. Thus far, India
and China have relied on Indonesia as their source of imported steam coal based on both price
and quality considerations.
166
In 2000, Australia‘s production of saleable black coal was 257.5 mt, of which 193.4 mt was exported. 167
Coal Services Pty. Ltd. and Queensland Department of Employment, Economic Development and
Innovation, ―Australian Black Coal Exports,‖ page 1 (issued April 2010) and Joint Coal Board/The
Queensland Coal Board, Äustralian Black Coal Statistics, 1989, Table 24, page 30. 168
Coal Services Pty Ltd. ―Australian Black Coal Exports‖, Issued April 2010. 169
ABARE, ―Commodity Report‖ April 2010. 170
ABARE, ―Australia‘s Mineral Statistics, 2010,‖ December Qtr 2009, Table 9, p. 17.
Page 63
28 March 2011 63 PESD WP #101
Figure 19: Queensland and NSW Shares of Black Coal Exports, 1987 and 2008
1987 2008
Source: Joint Coal Board/Queensland Coal Board,
―1996 Australian Black Coal Statistics,‖ Table 28,p.26
ABARE, Australian Commodity Statistics,
2008.
2.4.3 Impact of China and India on Australia’s Export Markets
China‘s imports of Australian black coal—both coking and steam coal—were scarcely
noticeable until 2009, when they tripled 2008 levels to reach 130 mt. China‘s coal imports
increased further in 2010 to reach 165 mt. Prior to 2009, China‘s main impact on Asian coal
markets was the reduction in its exports of both steam and coking coal to Taiwan, Korea, Japan
and the Philippines.
Figure 20 shows the massive increase in Indonesia‘s share of China‘s steam coal imports and
the decline of Australia‘s and Vietnam‘s shares of Chinese steam coal imports between 2004
and 2010. Indonesia‘s dominant position in China‘s steam coal import market is expected to be
maintained through 2015.
QLD 56%
NSW 44%
QLD 61%
NSW 39%
Page 64
28 March 2011 64 PESD WP #101
Figure 20: Coal Exporter Country Shares of China’s Steam Coal Imports Ω
2004 2010
Ω Vietnam‘s exports of anthracite to China are assumed to be used for power generation and therefore included
in the category of steam coal. Source: China Coal Statistics, Export Information Administration
Page 65
28 March 2011 65 PESD WP #101
Figure 21 shows China‘s imports of coking coal and steam coal between 2000 and 2010.
China‘s imports of both coking and steam coal occurred in 2009. If not for China, FOB prices
for steam and coking coal would have collapsed much below the $60- $70/t price that
prevailed for Newcastle grade coal in early 2009.
Figure 21: Chinese Imports of steam and coking coal between 2000 and 2010
Source: China Coal Statistics, Export Information Administration
Although the Chinese steel industry experienced robust growth between 2004 and 2008, its
members procured most of their coking coal requirements from domestic suppliers until 2009
when, in response to very attractive FOB prices for Australian coking coals and the very low
costs of chartering Panamax and Cape-size vessels, the Chinese mills increased their purchases
of hard and soft coking coals from Australia from 1.3 mt of coking coal in 2008, which was
less than 1% of Australia‘s total coking coal exports, to 31.1 mt in 2009, or 23% of its total
coking coal exports.
Australia‘s exports of steam coal to China increased from 2.2 mt or 2% of total steam coal
exports in 2008 to 16 mt or 12% of total steam coal exports in 2009 before declining to 13.4 mt
and 10% of total exports in 2010 due to higher prices. (Table 2)
Page 66
28 March 2011 66 PESD WP #101
Table 2: Chinese Imports of Australian Coking and Steam Coals and Percent Share of
Total Australian Exports (in million tons and percent share) (2004 -2010)
Year
Australian Coking Coal Australian Steam Coal
Chinese Imports
(mt)
Total Exports
(mt)
Chinese Share of Total Exports
(%)
Chinese Imports
(mt)
Total Exports
(mt)
Chinese Share of Total Exports
(%)
2004 4.24 117.18 3.6% 2.22 107.35 2.1%
2005 3.60 123.83 3.0% 1.95 109.84 1.8%
2006 2.11 124.10 1.7% 5.40 113.20 4.7%
2007 2.42 137.93 1.8% 1.50 112.50 1.4%
2008 1.32 135.29 1.0% 2.30 126.00 1.8%
2009 31.06 135.06 23.0% 16.00 136.10 11.7%
2010Ω 17.39 129.88 13.4% 13.40 138.76 9.7%
Ω 2010 figures over the months January-October 2010 only.
Source: Energy Publishing, ―Australian Coal Reports,‖ February 2006, 2007, 2008, 2009 and December 2010.
Indonesian coal producers, on the other hand, experienced spectacular growth in their exports
to China between 2008 and 2010 with Indonesia‘s steam coal exports to China increasing from
10.9 mt in 2008 to 52.8 mt in 2010. (Table 3) China‘s reliance on Indonesia for over 50% of
its coal imports may seem like an unhealthy dependency on a single country. But if looked at
as a percent of China‘s 2010 steam coal consumption, the dependency is close to nil – less than
2% of total consumption.
The very large increases in China‘s coal imports for the years 2009 and 2010, was
accompanied by its progressive reduction in steam coal exports from 74.6 mt in 2004 to an
estimated 13.8 mt in 2010. These two shifts in coal imports and exports, which are shown in
Figure 22, have contributed greatly to price increases and price volatility in the region. Over
the same period, imports of steam coal skyrocketed from 4 mt in 2004 to an estimated 91.2 mt
in 2010 (Figure 22).
Page 67
28 March 2011 67 PESD WP #101
Sources: China Coal Statistics, Export Information Administration (for Indonesian and All Countries coal import
data), Energy Publishing, Indonesia Coal and Power Report, 2004-2010 (for Total Indonesian Exports); IEA Coal
Information 2010 (for China Coal Consumption)
Figure 22 China’s steam coal imports and export, 2000-2010 (in million tons)
Source: China Customs Statistics, Export Information Administration,
Chinese coal buyers are highly opportunistic. They tend to enter and exit from the coal import
markets based on price alone. With the higher coal prices that have prevailed for both coking
and steam coals from January 2010 onward, it is surprising that China‘s imports of Australian
Year Indonesia All
Countries
Total Indonesia
Exports
China Coal Consumption
Total Chinese Steam Coal
Imports
Total Indonesian Coal Export
Chinese Coal Consumption
2004 1.3 4.0 105.4 n/a 32% 1% n/a
2005 2.4 6.1 117.2 1,816 39% 2% 0%
2006 4.9 11.0 146.0 1,965 45% 3% 0%
2007 13.6 16.4 163.5 2,073 83% 8% 1%
2008 10.9 14.6 158.0 2,295 74% 7% 0%
2009 28.7 57.8 176.4 2,640 50% 16% 1%
2010 52.8 91.2 190.0 3,036 58% 28% 2%
Chinese Imports of Indonesian Steam Coal as a % of
in million tons
Table 3 Chinese Imports of Indonesian Steam Coal, 2004-2010
Page 68
28 March 2011 68 PESD WP #101
coal from January to October 2010 are significantly higher on an annualized basis than imports
for all of 2009. But this may merely reflect a lag in the market response to higher prices that
will lead to a substantial reduction in Chinese coal imports during the first half of 2011.
India, for its part, has over the past decade accounted for a very large and growing share of
Australia‘s hard and semi-soft coking coal exports. For example, between 2004 and 2010,
India increased its share of Australia‘s coking coal exports from 13% (2004) to 21% (2010).
(Table 4) But because India only increased its coking coal imports at a moderate growth rate
each year, it never had a noticeable effect on FOB export prices for coking coal.
India‘s steam coal imports from Australia have been small and declining since 2004 and are
not expected to increase in a very dramatic fashion due to high shipping costs and premium
values that those coals can earn in other export markets. Australian steam coal exports to India
declined from 1.27 mt in 2004 (1.2% of Australia‘s total steam coal exports) to 0.45 mt in
2010 (0.3% of Australia‘s total steam coal exports) (Table 4).
Table 4: Indian Imports of Australian Coking and Steam Coals and Percent Share of Australian Exports (in million tons and percent share)
Year
Australian Coking Coal Australian Steam Coal
Indian Imports
(mt)
Total Exports
(mt)
Indian Share of Total Exports
(%)
Indian Imports
(mt)
Total Exports
(mt)
Indian Share (% of Total
Exports)
2004 15.23 117.18 13.0% 1.27 107.35 1.2%
2005 14.10 123.71 11.4% 1.48 109.92 1.4%
2006 14.71 124.10 11.9% 1.09 113.2 1.0%
2007 21.61 137.93 15.7% 0.51 112.5 0.5%
2008 24.72 135.29 18.3% 0.90 126.0 0.7%
2009 26.58 135.06 19.7% 0.60 136.1 0.4%
2010 27.25 156.28 17.4% 0.45 138.76 0.3%
Source: IEA, 2010 Coal Information.
India prefers steam coals from Indonesia based on price and quality factors. Indonesian coals
have qualities that make them more suitable as a blending stock for existing Indian power
plants than Australian steam coals plus they are significantly cheaper on a $/GJ basis. In
particular, Indonesia‘s coals have low to medium CVs with high to medium moisture contents
and low ash and sulfur contents while domestic coals have very low CVs, high ash and low
Page 69
28 March 2011 69 PESD WP #101
moisture contents. Australian steam coals, which sell at an FOB premium to Indonesian coals,
have a higher ash content (around 8 percent) than the Indonesian coals (around 3 percent to 5
percent by weight). As a result of this quality preference and the lower $/GJ price for
Indonesian steam coals relative to Australian steam coals, Indonesia‘s exports of steam coal to
India have increased smartly since 2005 (Table 5). Its exports to India are expected to increase
at an even greater growth rate over the next decade.
Sources: IEA, 2010 Coal Information except ―Total Indonesian Coal Exports‖ figures which were obtained from
Energy Publishing, Indonesian Coal and Power Report.
2.4.4 Impact of Volatile Prices on Investment Decisions
In late 2008, the United States and Europe went into a deep economic recession due to the
collapse of the housing and mortgage derivatives markets in the United States. For a short
time, it led to a massive decline in the prices of coking and steam coals. Since mid-2009, black
coal prices have recovered quite a bit of their lost ground. For the week of January 7, 2011, the
globalCOAL Newcastle Price Index stood at $129.90 per tonne, still a far cry from the July
2008 peak price of $184 per tonne.171
The volatile price movements for Australia‘s black coal exports after 2003 have served to
complicate the long-term investment decisions of Australia‘s coal mining companies, the
governments of NSW and Queensland, and Australia‘s black coal export customers. The result
171
http://www.globalcoal.com/
Year Indonesia All
Countries
Total
Indonesian
Coal Exports
Indian Coal
Consumption
Steam Coal
Imports from
All Countries
Total
Indonesian
Coal Exports
Indian Coal
Consumption
2004 n/a n/a 105.4 n/a n/a n/a n/a
2005 13.9 21.7 117.2 391.7 64% 12% 4%
2006 (est) 18.3 26.2 146.0 418.8 70% 13% 4%
2007 22.7 30.7 163.5 454.1 74% 14% 5%
2008 20.7 31.0 158.0 498.8 67% 13% 4%
2009 25.1 44.3 176.4 536.3 57% 14% 5%
2010 (est) 30.5 63.3 190.0 575.7 48% 16% 5%
in million tons Indian Imports of Indonesian Steam
Coal as a % of
Table 5 Indian Imports of Indonesian Steam Coal, 2004-2010
Page 70
28 March 2011 70 PESD WP #101
has been ―stop-and-go‖ decisions with mining companies and state governments making
―firm‖ decisions in 2008 to proceed with large mining projects and related transport
infrastructure projects one month and then in early 2009 reversing those decisions due to
changes in market conditions and financial constraints.
Although weather-related events created short-term price impacts during 2008, coal exports
were never seriously disrupted in the region. This was partly due to the maintenance of
stockpiles at ports, coal mines, and power plants. To some extent, the price volatility was due
to panic buying of coal as an over-reaction to weather-related events. Ample supplies of coal
were available in the region to meet needs but admittedly those supplies were more evenly
balanced against demand than had been the case in the past.
In late 2008 and through the first half of 2009, tight supply turned to oversupply before
returning to a more balanced demand–supply situation from September 2009 through May
2010. And then during December 2010 and January 2011, heavy rains and flooding hit the coal
mining industry of Queensland, causing black coal prices to increase by at least $30 per tonne
since October 2010.172
One can expect larger short-term increases to occur in response to the
short-term weather-related supply disruptions. But, in the medium- and longer- term,
implementation of new mine projects and expansions of the coal transport systems in Australia
and Indonesia, if they occur according to plan, are expected to alleviate the short-term capacity
constraints that are still being experienced throughout Asia.
2.4.5 Latest Data on Industry Concentration
As of 2008, the Big Four‘s share of total saleable production had decreased to 61 percent,
which was still very high level of concentration, given that we are considering only four coal
producers (Figure 23).173
Anglo, BMA, Rio Tinto, and Xstrata control most of Australia‘s
recoverable reserves of hard and soft coking coal. In 2009, BHP separately and through BMA-
owned assets controlled 60 percent of the hard coal coking reserves located in the Bowen
Basin of Queensland. An additional 20 percent of the Bowen Basin hard coking coal reserves
are controlled by Anglo, Peabody, Rio Tinto, and Xstrata.174
With respect to soft coking coal
reserves, Xstrata and Rio Tinto controlled 45 percent and 25 percent of NSW‘s recoverable
172
Ibid. 173
Coal Services Pty., Ltd./Queensland Department of Mines and Energy, ―2006 Australian Black Coal
Statistics,‖ pp 12-16 and pp. 46-60. 174
E-mail communication from Ron Sait of Geoscience Australia, Canberra, June 2010: More than 90 percent of
Australia‘s hard coking coal reserves are located in the Bowen Basin.
Page 71
28 March 2011 71 PESD WP #101
soft coking coal reserves as of December 2008.175
Steam coal is much less concentrated but
Xstrata owns Rolleston (8 mtpa), Anglo-American owns Callide (9 mtpa), and Rio Tinto owns
Blair Athol/Clermont (12 mtpa).176
Figure 23: Australia’s “Big Four” Coal Producers (Anglo, BMA, Rio, and Xstrata)
Produced 74 Percent of Australia’s 2006 Saleable Black Coal
Source: Coal Services Pty. Ltd./Queensland Department of Mines and Energy, ―2006 Australian Black Coal
Statistics,‖ Tables 14-17, pp. 12-16 and pp. 46-60.
One other outcome of the industry‘s consolidation has been the move toward larger mines. In
1996, average saleable coal production per coal mine in Australia was 1.6 million tonnes per
mine and only one mine produced more than 10 mtpa.177
By 2006, a total of eight mines
produced more than10 mtpa of saleable coal with five of these eight large mines owned by the
Big Four. The average saleable coal production per mine increased to 2.7 million tonnes and
3.2 million tonnes in 2002 and 2006, respectively.
The level of black coal industry concentration is extraordinarily high for any industry and is an
indication of the regulatory ease with which acquisitions can be made in the Australian
resource sector. Over the next few years, newcomers such as Hancock Coal, Waratah/First
Resources, and Syntech may break into the thermal coal sector with very large coal mining
operations that may reduce the current level of high concentration but will increase the average
175
Ibid. 176
Queensland Department of Mines and Energy website (www.dme.qld.gov.au). 177
Joint Coal Board/Queensland Coal Board, ―1996 Australian Black Coal Statistics,‖ pp. 7 and 8.
Rio Tinto 17%
Anglo 19%
BMA 19%
Xstrata 19%
Other 26%
Page 72
28 March 2011 72 PESD WP #101
mine size. But it is just as likely that some if not all of these newcomers will be acquired by
one of the Big Four. In summary, if the new mega-coal mines in the Galilee and Surat basins
are brought into production as planned over the next three to five years, the average size of
Australian coal mines and industry concentration for its steam coal segment are destined to
increase significantly with or without further industry consolidation.
2.4.6 Rail Network Expansion and Privatization
Between 1987 and 2004, the governments of NSW and Queensland accomplished timely
expansions of their rail networks, which allowed substantial increases in their exports of both
coking and steam coal up until 2004. From 2004 onward, however, the governments of NSW
and Queensland were unable to keep up with the rapid growth in demand by the coal industry
for additional rail infrastructure, contributing to long vessel queues at the Port of Newcastle
and later at Hay Point and even Gladstone. The rail constraints were significant contributors to
increased coal price volatility in the region.
At the same time that rail network constraints were being experienced, coal freight rates were
widely viewed as excessive. In 1998, the Commonwealth government‘s Productivity
Commission challenged the state governments of NSW and Queensland and their state-owned
railway corporations to improve their productivity and lower their costs of service to the coal
industry. The Productivity Commission made two important recommendations with respect to
rail freight:
(a) State governments should discontinue the practice of setting rail freight rates for
hauling coal at a level that allows the state railways to earn monopoly profits or the
state government to collect implicit royalties above the legally mandated royalty rate.
(b) State governments should encourage third-party access to fixed rail infrastructure and
allow coal producers and other investors to own and operate rolling stock on the fixed
rail network.
The government of NSW implemented most of the Productivity Commission‘s
recommendation in 2002, when it reorganized its FreightCorp in preparation for its divestment
to private investors. In that same year, the Commonwealth government and the government of
NSW combined the Australian government-owned National Rail Corporation‘s freight
operations and rolling stock with the NSW government‘s reorganized FreightCorp and in 2002
sold the combined assets to Toll Holdings and Patrick Corporation, which formed Pacific
Page 73
28 March 2011 73 PESD WP #101
National (PN) to operate and manage those assets.178
In 2001 Lang Corporation changed its
name to Patrick Corporation, which in 2006, was acquired by Toll Holdings in a hostile
takeover. Toll then split itself into Toll and Asciano, which holds the combined Toll and
Patrick shares of Pacific National Asciano is an ASX-listed company.
In 2009, PNR railed approximately 83 million tonnes of coal from the Hunter Valley, Southern
and Western coalfields of NSW to domestic customers and to export customers through the
Port of Newcastle and Port Kembla. It currently operates in all states and the Northern
Territory and, prior to the November 2010 IPO of Queensland Rail, was Australia‘s largest
private rail freight company.
PNR claimed that, in 2009, it delivered 93 percent of New South Wales‘s export coal and was
Australia‘s second largest coal hauler. Queensland Rail is the largest. Within NSW, PNR
operates more than the 650 km Hunter Valley rail network and the 400 km Western coalfields
network. It also operates trains over the 260 km dedicated coal haul route from Leigh Creek to
Port Augusta in South Australia.179
In the case of Queensland Rail, the Queensland government vacillated for a number of years
before implementing the recommendations of the Productivity Commission during the volatile
price phase. Its delay was most likely motivated by the importance of the monopoly rents
earned by Queensland‘s state government from Queensland Rail. However, on November 22,
2010, the government of Queensland took an historic step when it successfully conducted an
IPO for 60 percent of Queensland Rail National (QR National). Shares sold at $2.55 each,
which was at the low end of the offer range (A$2.50 - $3.00).180
A few months prior to the IPO
date, a consortium of coal producers, known as the Queensland Coal Industry Rail Group
(QCIRG) and representing 98 percent of Queensland‘s coal export business, proposed to the
Queensland government that it be allowed to buy only QR National‘s Central Queensland
178
See State Records Archive Investigator, ―FreightCorp‖
(http://investigator.records.nsw.gov.au/Entity.aspx?Path=%5CAgency%5C1079). and History of Patrick
Corporation at http://www.patrick.com.au/index.php?id=49. Patrick Corporation was named Lang
Corporation until October 2001. 179
www.pacificnational.com.au. 180
Bloomburg Businessweek, ―QR National Climbs in Sydney after A$4.05 Billion IPO,‖ November 22, 2010
(www.businessweek.com/news/2010-11-22/qr-national-climbs.
Page 74
28 March 2011 74 PESD WP #101
fixed coal rail network for A$4.5 billion. This proposal was withdrawn by QCIRG after a few
months of fruitless negotiations with the Queensland government.181
As of January 2011, the Queensland government still owns 40 percent of the newly privatized
QR National. It plans to sell off another 15 percent of QR National in 2012. The company was
sold off as an integrated railroad company with ownership of both the fixed rail networks and
its rolling stock. However, as part of the sales arrangements, third parties such as major coal
producers will be allowed to own and operate coal haul trains on the QR National fixed rail
network. Large coal producers, such as BHP Billiton, Xstrata, and Rio Tinto, are considering
buying their own rolling stock and hauling its coal to the ports from which they export their
coals.182
Ironically, the Queensland government‘s effort to privatize its railroad business may
eventually lead to a more vertically integrated black coal industry in Queensland, which will
own the rolling stock and port facilities used to transport and export their coals.
QRNational currently comprises various operating divisions. QRNational Coal is the division
responsible for the transport of coal within Queensland. Recently, it started a service to
transport coal from mines in NSW to the Port of Newcastle.183
In 2009-2010, QRNational Coal
delivered 198.3 million tonnes of black coal to export ports in Queensland and NSW and
directly to customers in both states.184
Asciano, owner of PNR, has not taken this competition
lightly. It recently announced that it has been awarded a contract by Anglo American to haul
16.5 mtpa of coal in Queensland with some deliveries beginning in 2010.185
It plans to double
its coal haul tonnage in Queensland over the next five years.186
QRNational Coal is divided into two service arms known as (a) QRNational Coal (South) and
(b) QRNational Coal (North):
QRNational Coal (South) operates the Blackwater and Moura systems in Central
Queensland, the West Moreton system in SE Queensland, and the Hunter Valley
System in NSW. In 2009-2010, it delivered 91.4 million tonnes of coal from 42 mines
181
Energy Publishing Inc., ―Coal Chain Australia‖ Issue 0013, November 2010, pp. 1-2. 182
Energy Publishing Inc., ―Coal Chain Australia‖ Issue 0014, December 2010, pp. 2-3. 183
www.qrnational.com.au/CoalFreight/Pages/CoalFreight.aspxwww.freight.qr.com.au. 184
Ibid. 185
Energy Publishing Inc., ―Coal Chain Australia Weekly,‖ Issue 34, June 15, 2010, p. 1. 186
Energy Publishing, ―Coal Chain Australia‖, Issue 0014, December 2010, pp. 2-3.
Page 75
28 March 2011 75 PESD WP #101
to six domestic customers and five export terminals, of which RG Tanna and Barney
Point at Gladstone, Brisbane, and Carrington and Kooragang at Newcastle receive of
the bulk of its deliveries. A small amount of coal was delivered to the Port of Hay
Point. Its operating area covers 1 million square kilometers. It operates a mixture of
electric and diesel locomotives.187
QRNational Coal (North) operates the Goonyella and Newlands rail systems, which
service 24 coal mines in the central and northern Bowen Basin. In 2009-2010, it
delivered 106.9 mt of black coal from 23 coal mines primarily to the coal export
terminals located at Abbot Point, Dalrymple Bay, and Hay Point. Some portion of its
coal deliveries are routed through the RG Tanna and Barney Point coal terminals
located within the Port of Gladstone.188
2.4.7 Chronic Port Constraints
Since 2004, the Port of Newcastle has dominated the news as Australia‘s most capacity-
constrained port, with long lines of ships often queuing up for days at a time and incurring
demurrage charges. However, from November 2009 through June 2010, DBCT and HPCT also
suffered from problems that captured negative headlines. Vessel queues at Hay Point‘s DBCT
ranged from 70 vessels in November 2009 and 29 days‘ average turnaround due to mechanical
problems with one of the terminal‘s coal in-loaders.189
In December 2009 and January 2010,
bad weather kept vessel queues consistently above 50 days, which in turn led to vessels
loading at DBCT experiencing higher than normal demurrage charges, ranging from $4 per
tonne to almost $10 per tonne. In March 2010, cyclone Ului caused extensive damage to the
Hay Point Coal Terminal forcing its closure from March 11 to April 2 and demurrage charges
to jump above $4 per tonne.190
Gladstone and Newcastle, on the other hand, experienced much lower vessel queues and
demurrage charges. Gladstone‘s RGTCT experienced rather light vessel queues of 5 to 24
vessels and demurrage charges well under $4 per tonne. Newcastle experienced moderately
high vessel queues of 8 to 39 days but demurrage rates of under $2.50 per tonne.191
187
www.qrnational.com.au/CoalFreight/Pages/CoalFreight.aspxwww.freight.qr.com.au. 188
Ibid. 189
Energy Publishing Inc., ―Coal Chain Australia Weekly,‖ Issue 0001, November 2009, pp. 5-9. 190
Energy Publishing Inc., ―Coal Chain Australia Weekly,‖ Issue 0004, February 2010, pp. 2-3, and Issue 0005,
March 2010, pp. 1, 8. 191
Ibid.
Page 76
28 March 2011 76 PESD WP #101
The 2010/11 cyclone and rainy season had just begun at the time of publication but already
excessive rains have led to closures of most open-cut mines in Queensland during December
2010 and the exhaustion of mine and port stockpiles.192
Lost tonnages are estimated to be
running at 3 mt per week with extended speed reductions on the Goonyella and Blackwater
lines, which carried over 130 mt of black coal in 2009/10. Many mines have already declared
force majeure due to flooding of pits caused by the heavy rains.193
A key question is what will
happen between January 2011 and May 2011 now that the real rains have arrived and the
cyclone season has begun. The outlook is for coal supplies from Queensland to experience
greater weather-related disruptions than had been experienced in 2008, which was the year
when the price of Newcastle grade coal reached $184 per tonne.
The main point illustrated by these figures is that Australia‘s annual coal exports can be
affected significantly in the short term by weather-related conditions that limit rail speed and
port loadings dramatically between December and May of each year. Worsening weather
conditions are a factor that may increase in importance over the next two decades and should
be viewed as a chronic issue, albeit one that is seasonal in nature. The longer-term, structural
shortage of rail and port capacity over the past six years has had a lasting effect on the
industry‘s level of new investments in mines and has limited Australia‘s coal exports over the
past decade. Both factors are critical constraints that have played a large role in limiting the
growth of exports in the past and are likely to do so into the foreseeable future.
2.4.8 Domestic Consumption
During the competitive and volatile price phases, Queensland continued to increase its
domestic consumption of black coal, both in absolute terms and as a percentage of total
domestic consumption. Queensland‘s domestic consumption, which stood at 12.2 mt or 26
percent of Australia‘s black coal consumption in 1987, reached 31 percent of Australia‘s black
coal consumption (23.4 mt) in 2008.194
By the end of 2008, steam coal (power generation +
other industry) accounted for 97 percent of domestic black coal consumption, up from an 84
percent share in 1987. The main user of steam coal was the power industry, which in 2008
consumed 89 percent of domestically used black coal, up from 73 percent in 1987 (Figure 24).
192
Energy Publishing, ―Australia Coal Report‖, December 2010, pp. 2-3. 193
Ibid. 194
Joint Coal Board and Queensland Coal Board, ―1996 Australian Black Coal Statistics,‖ Table 44, page 42,
and Coal Services Pty. Ltd. (data supplied via e-mail, March 2010).
Page 77
28 March 2011 77 PESD WP #101
Figure 24: Domestic Consumption of Black Coal by Industry, 1987 and 2008
1987 2008
Source: Joint Coal Board/Queensland Coal Board,
―1996 Australian Black Coal Statistics,‖ Table 43,
p.41.
Coal Services Pty. Ltd./Queensland Departmentof
Mines and Energy, ―2008 Australian Black Coal
Statistics‖ (pending).
Almost all of Queensland‘s black coal usage was steam coal used for power generation. In the
case of NSW, black coal use increased from 24.6 mt in 1987 to 32.3 mt in 2000. Similar to
Queensland, the increased use of black coal was of steam coal.195
Over this period, NSW
decreased its use of coking coals by 800,000 tonnes. Other states also generated a significant
increase in black coal usage that was totally steam coal used for power generation.
2.4.9 Regulatory Frameworks as of January 2011
Both NSW and Queensland have comprehensive and time-proven legal frameworks for
allocating areas for exploration and development of new coal mines. They also have clear
regulatory procedures and frameworks for developing new rail and port infrastructure projects
and managing labor relations, mine safety, and matters that infringe upon international
relations.
These mature frameworks do not appear to have significantly constrained the expansion of
steam coal production in either state. Complaints by coal producers tend to concentrate around
two topics: (a) the slow pace of implementing requests for project approval, a common
complaint in any jurisdiction where conflicting interests need to be considered before a public
195
Ibid.
Power Generation, 73%
Steel Making, 3%
Power Generation, 89%
Other Industry, 11%
Page 78
28 March 2011 78 PESD WP #101
decision can be made, and (b) the reversal of key decisions at the first sign of economic
adversity.196
Although the state of Queensland is described by a number of industry sources as a more
attractive regulatory venue than NSW for developing new coal mines, its state bureaucracy is
also criticized for not showing the political will and courage to make controversial decisions,
with the two examples most frequently cited as follows:197
Slowness in resolving overlapping claims between the separate industries of coal
mining, CBM extraction and UCG production
Delays in approving new port and rail projects and then not holding to those decisions
in the face of short-term changes to the domestic economy198
In the case of NSW, the same sources claimed that the NSW‘s government bureaucracy is less
friendly to miners. The regulatory process in NSW has been described by a number of sources
interviewed as an adversarial process that creates a much higher level of investor uncertainty
than coal miners have experienced in Queensland.
But, in general, the regulatory frameworks in both states operate with a reasonable degree of
efficiency and equity. Government agencies responsible for implementing the laws and
regulations largely reach decisions that the industry views as fair and balanced. The rules and
regulations are subject to public comment at reasonable intervals and the most important aspect
of implementing either a new coal mine or a rail or port project—the review and approval of a
project‘s environmental impact statement (EIS)—allows for the public to provide its comments
over a six-week period from the date that the EIS is submitted to the Office of the Coordinator
General (OCG), the government entity responsible for overseeing any significant infrastructure
or mining project.199
196
Confidential interviews with a number of coal producers during August 2008. 197
Ibid. 198
Ibid. This second ―complaint ― is probably of greatest concern from the perspective of sustainable coal
supply from Australia as new mining projects will not go ahead without related port and rail projects being
approved and under way. 199
www.epa.wa.gov.au/ABOUTTHEEPA/EIAREVIEW/Pages/default.aspx
Page 79
28 March 2011 79 PESD WP #101
Public hearings on any EIS are organized by the project proponent who is required to provide a
full and transparent response to any public comments.200
At the end of the public review
period, the OCG makes a final decision on whether a project should be allowed to proceed on
environmental grounds and whether additional conditions are to be attached to that approval.201
In most cases, the project proponent is required to issue a supplemental EIS that states the
actions the developer will take to address concerns raised by the public and deemed by the
OCG as significant.
Once a coal mine is operating, issues related to worker safety are handled by the Coal Services
Pty., Ltd., the successor to the Joint Coal Board, while health-related issues are handled by the
mines departments of both state governments. Over the past 50 years, the JCB/Coal Services
and the Queensland and NSW mines departments have successfully eliminated issues related to
worker health and safety that previously led to strikes and other worker actions that led to
significant losses in coal output prior to 1960.
As of December 2010, the regulatory issues of greatest concern to most coal mining companies
are not the existing regulatory frameworks and the specific actions of state government
bureaucrats. Instead, the primary concerns at this time are related to policies of the Australian
Commonwealth government and in particular its proposals to pass into law:
A carbon pollution reduction scheme (CPRS), which is a ―cap-and-trade‖ scheme for
reducing CO2 equivalent emissions throughout Australia
A 30 percent mineral resources rent tax (MRRT) on mining companies
Trade journals and Australia‘s newspapers unanimously mention the CPRS and the MRRT as
creating the greatest level of investment uncertainty at this time.
200
Ibid. 201
Ibid.
Page 80
28 March 2011 80 PESD WP #101
3. Future Challenges and Issues
At the close of 2008, coal remained Australia‘s largest export earner and one of its largest
employers. It is the one industry that can make or break the economies of NSW and
Queensland. According to the Australian Coal Association (ACA), the black coal industry of
Australia ―directly employs more than 30,000 people, predominantly in New South Wales and
Queensland. It‘s estimated that at least another 100,000 Australians are indirectly employed by
the coal industry. In regional areas such as Queensland‘s Bowen Basin, coal is responsible for
one in every four jobs. In the brown coal producing states such as Victoria, coal miners are
employed by power companies and in industries such as aluminium smelting. Australians in all
States provide services to the coal industry, including equipment, transport and insurance.‖202
While there may be some self-serving purpose as well as exaggerated claims in the ACA
information, the dependence of the Australian economy on the coal sector is indisputable. The
reality is Australia‘s black coal industry is Australia‘s single largest export earner and is a
sector that has tremendous economic and by extension political clout in Australia (Figure 25).
Figure 25: Black Coal Was Australia’s Largest Export Earner in 2008
Source: ACA Website
202
―The Australian Coal Industry,‖ australiancoal.com.au.
0 5 10 15 20 25 30
Coal
Iron ore
Education Services
Non-monetary gold
Personal travel (excl. Education)
Crude petroleum
Professional, technical and other business
Aluminium ores (incl. Alumina)
Natural gas
Aluminium
$bn
Page 81
28 March 2011 81 PESD WP #101
Queensland and NSW account for almost all of Australia‘s black coal production and all of its
exports. Although these two states are contiguously located, significant differences exist
between their coal industries with respect to (a) the types and quality of coal resources
available; (b) the inland transport infrastructure systems that have been developed to support
these industries; (c) the regulatory frameworks that have been developed to regulate both
industries; and (d) the political environments within which these frameworks exist.
But they both tend to face the same development issues that will affect their future levels of
sustainable production with the following being the most important common issues:
Resource and reserve depletion
Rail and port infrastructure constraints
Regulatory uncertainty caused by proposed legislation related to GHG reduction
(CPRS) and new taxes on the mining sector (RSPT)
Impacts that new technologies will have on the levels of production and types of energy
products produced from remaining recoverable reserves203
3.1 Resources and Reserves Depletion
The Australian government‘s official estimates of coal resources and reserves are published
annually by Geoscience Australia.204
It provides estimates of demonstrated resources—both
economic and sub-economic—as well as JORC reserves for all mineral resources, including
black and brown coal and CBM. Resource estimates are first expressed as demonstrated
resources and then separated into economic and sub-economic demonstrated resources.205
Economic demonstrated resources (EDR) are those resources that Geoscience Australia
concludes have either near-term or long-term potential to be developed economically. EDR of
black coal are approximately three to four times greater than JORC black coal reserves, which
are reported annually by publicly traded mining companies.
Geoscience Australia estimates that Australia had, as of December 2008, black coal EDR of
39.2 billion tonnes with the bulk of those reserves located in Queensland (56 percent) and
NSW (40 percent). Both states also accounted for 100 percent of Australia‘s 2008 black coal
203
The regulatory uncertainty created by Australia‘s CPRS is only half of the story. The impact of GHG policies
of the governments of Japan, Korea, Taiwan, and the rest of Asia, which in 2007 accounted for 89 percent of
Australia‘s steam coal exports will largely decide the fate of Australia‘s black coal industry. 204
See Geoscience Australia, Canberra, ―Australia‘s Identified Mineral Resources 2009‖ for the latest report.
Available online from www.geoscienceaustralia.com.au. 205
Ibid.
Page 82
28 March 2011 82 PESD WP #101
exports (Table 4).206
At 2008 raw coal production levels (438 million tonnes), Australia has
sufficient black coal EDR to last for 90 years.207
These estimates do not include the large black
coal deposits being developed in the Galilee and Surat basins.
Table 6: Australia’s Demonstrated Coal Resources and JORC Reserves at December
2008
Coal Type
Demonstrated Resources Company+Estimates
Economic
(EDR)
Accessible
EDR
(AEDR)
Sub-economic
Inferred
Resources
JORC
Reserves
(% of
AEDR)
Para-
marginal
Sub-
marginal
Black Coal
- in situ
56.2 n/a 3.0
10.3
106.0 n/a
-
recoverable
39.2 39.1 1.5 6.7
66.7
13.4
(34%)
Brown Coal
- in situ
44.3 n/a 43.1 18.1
112.3 n/a
-
recoverable
39.2 32.2 38.8 16.3
101.1 4.8 (15%)
Source: Geoscience Australia, Canberra, ―Australia‘s Identified Mineral Resources, 2009,‖ p. 5.
3.1.1 NSW Coal Resources
Geoscience Australia estimates that NSW had, as of December 2008, recoverable black coal
EDR of 15.7 bt. The resources are contained in six basins: (1) Sydney-Gunnedah; (2) Hunter;
(3) Gloucester; (4) Oaklands; (5) Newcastle; and (6) Western and Southern (Figure 26). Most
of NSW‘s black coal EDR (35 percent or 13.7 bt of total black coal EDR) are located in the
500 km long, 150 km wide Sydney-Gunnedah Basin.208
206
Ibid, p.5. 207
ABARE, ―Australia Commodity Statistics, 2009,‖ Table 244, p. 247. 208
Ibid, p. 1.
Page 83
28 March 2011 83 PESD WP #101
New steam coalfields that may be developed in NSW after 2015 will either be located in the
Gunnedah Basin or the Hunter Valley. Coal from these new developments will be more
expensive to deliver to export customers due to the longer distances from the new mine sites to
the Port of Newcastle and the need to either construct new rail lines or expand existing rail
lines.
Table 5 provides typical specifications for NSW export-grade steam coals by coalfield. Coals
from the NSW coalfields are typically exported under the Newcastle brand, which has a gross
calorific value of 6322 kcal/kg, gross, as received (gar) and 6000 kcal/kg, net, as received
(nar). These coals are exported out of the Port of Newcastle, hence the Newcastle brand name.
Figure 26: Coal Basins, Fields and Export Ports in NSW
Source: Government of NSW, Department of Primary Industries.
Page 84
28 March 2011 84 PESD WP #101
Table 7: Quality Specification for Typical NSW Export-Grade Steam Coals
Coal Quality
Parameter
Coal Field
Southern Western Hunter Newcastle Gunnedah
Reporting
Basis
GCV (kcal/kg) GAD 6,750 6,600 6,810 6,760 7,050
GCV (kcal/kg) GAR 6,390 6,220 6,360 6,330 6,515
Total Moisture (%) AR 6.4 8.0 9.1 8.5 9.0
Inherent Moist (%) AD 1.1 2.6 2.7 2.3 1.5
Ash (%) AD 19.5 20.4 13.5 15.1 17.5
VM (%) AD 20.8 28.7 32.7 30.6 26.8
TS (%) AD 0.45 0.55 0.60 0.60 0.65
AFT (c )
Int.
Deform.
Red.
Atmos.
1460 1460 1270 1380 1530
HGI (#) n/a 64 45 50 52 65
Source: www.AustralianMinesAtlas.com
3.1.2 Queensland Coal Resources
As of December 2008, Queensland had in situ black coal EDR of 22 billion tonnes.209
Almost
all of Queensland‘s coal reserves are located in the Bowen and Surat basins with small EDR
quantities located in the Clarence-Moreton and Callide basins.210
Queensland‘s coal resources
range from high-quality coking coals to low-rank brown coals. However, its coal industry has
been built around the high-quality coking coals that are located in the Bowen Basin. These
coals, which command premium prices in export markets, are produced mostly from large
open-cut mines in the Bowen Basin (Figure 27). However, export-quality black coal, especially
steam coal resources, can be found throughout the state and in particular in the Surat and
Galilee basins located inland from the Bowen Basin.
209
Ibid, p. 1 (39.2 bt x 0.56). 210
Geoscience Australia, Canberra, ―Australia‘s Identified Mineral Resources, 2009,‖ p. 1.
Page 85
28 March 2011 85 PESD WP #101
According to Geoscience Australia, approximately one-third of the remaining steam coal
resources located in the Bowen Basin are amenable to open-cut mining.211
Any other steam
coal mines developed in the Bowen Basin are likely to be underground longwall mines that
will entail higher mining costs.
3.2 Expansion of Existing Steam Coal Mines
Both the NSW and Queensland coal mining industries have enjoyed a period of exceptional
prosperity between 2004 and 2008 due to rising coal prices. Higher coal prices have also
stimulated new coal exploration projects and investments in either new mines or expansions of
existing mines. Table 6 summarizes the level of sustainable steam coal production from
existing mines and new mines, each with a potential output of less than 10 mpta. The level of
new output that may be generated from the sum of these coal mine expansion projects between
2010 and 2015 is estimated at 90 mtpa.212
It excludes production estimates for mines that will
be producing only coking coal and also for large steam coal developments planned for the
Galilee and Surat basins in Queensland and the Gunnedah Basin in NSW. These large planned
steam coal developments are discussed later.
211
Queensland Government: Department of Mines and Energy ―Queensland‘s World-class Coals: mine
Production and Developments, November 2007, p.1
(http://www.dme.qld.gov.au/zone_files/coal_files_pdf/wcc_nov_07.pdf) 212
A database showing the productive capacities of most steam coal mine expansions and new steam coal mines
for NSW and Queensland ,was prepared in 2009 for PESD by Michael Friederich, an independent coal
geologist from Queensland. It contains information on those steam coal projects that have advanced to the
stage of construction. The database excludes all developments for the Surat, Galilee, and Gunnedah basins
and mines in other basins that produce only hard coking coal. The production forecast assumes that each
announced project is economically feasible and will go forward.
Page 86
28 March 2011 86 PESD WP #101
Figure 27: Coalfields in Queensland
Source: www.AustralianMinesAtlas.com
Incremental expansions of existing steam coal mines will lead to very large increases in the
aggregate amount of steam coal produced in NSW and Queensland over the next decade.
However, over time, the mineable steam coal reserves of these competitive fields will be
exhausted and an inevitable decline in steam coal production will occur if new fields are not
developed.
For example, using current estimates of mineable reserves for each mine asset summarized in
Table 6, and assuming that each mine produces at 80 percent of its rated capacity, the level of
production capacity backed by mineable reserves will start to decline sometime between 2020
and 2025. Sometime between 2030 and 2040, if no new fields are brought into production,
then sustainable capacity for production of steam coal from these mines is expected to drop
Page 87
28 March 2011 87 PESD WP #101
below the 2010 production capacity of mines that produce either only steam coal or a
combination of steam and coking coal.
Table 8: Forecast of Increases in Steam Coal Mining Capacity Due to Expansion of
Existing Mines in NSW and Queensland, 2010-2040
State Mine type 2010 2015 2020 2025 2030 2040
Queensland
Open Cut 80.7 106.0 119.8 108.3 95.1 66.4
Underground 0.9 1.2 1.2 1.2 1.2 1.1
Subtotal 81.7 107.3 121.1 109.6 96.4 67.5
Newcastle
Open Cut 111.4 145.5 159.1 156.2 146.2 88.7
Underground 52.3 80.9 79.4 60.8 50.8 40.9
Subtotal 163.7 226.5 238.5 217.0 197.0 129.6
Both States
Open Cut 192.1 251.6 279.0 264.6 241.4 155.1
Underground 53.2 82.2 80.6 62.0 52.0 42.0
Total 245.4 333.7 359.6 326.6 293.4 197.1
Source: Summary of coal resource database prepared by Michael Friederich, consulting coal geologist, for this
study, 2009.
This forecast does not preclude the possibility of additional discoveries adding to the reserve
figures, especially in the form of new underground mines in NSW. But given the maturity of
the existing coalfields and the level of exploration that has been accomplished for these fields,
it is unlikely that additional discoveries and developments of open-cut mines will occur post-
2025.
The conclusions offered here regarding the nature of production expansion have significant
implications for not only future production costs but also export prices. The underground mine
developments that do occur will have a higher cash costs than the open-cut mines they
displace. It is expected that average, industry-wide cash costs for coal production will increase
significantly between 2010 and 2025 as new underground and open-cut mines are brought into
production.
Page 88
28 March 2011 88 PESD WP #101
3.3 Major New Coalfields Being Developed in Queensland
Sustaining a national production level of more than 300 mtpa of saleable steam coal after 2025
is likely to require the full development of the Galilee and Surat basins in Queensland and the
Gunnedah Basin in NSW. Over the next two decades, steam coal will capture a larger share of
Australia‘s black coal markets than it does today. The main reason for this shift will be the
eventual depletion of the high-quality coking coal deposits of the Bowen Basin and their
replacement with steam coals produced from within the Bowen Basin and Hunter Valley and
from new open-cut mines located in the Surat and Galilee basins and the Gunnedah Basin in
NSW.
3.3.1 Surat Basin
The Surat Basin lies to the south of the Bowen Basin and is reported to contain at least 4.0
billion tonnes of undeveloped, steam coal resources.213
Most of the Surat Basin coals can be
extracted using open-cut mining methods. The coals are viewed as attractive plays because of
their moderate ash (10-12 percent) and low sulfur contents (0.6 percent). However, Surat Basin
coals have one quality issue that may limit their sales in Asia, at least initially. The Surat Basin
coals have relatively low HGIs that range between 32 and 35.214
Most power plants in Asia
have mills designed to take coals having an HGI of 45 or higher. If lower HGI coals are used in
those plants, the mills may run out of grinding capacity and the plants‘ owners may need to
derate the generating capacity of these plants.
Some Surat Basin mines, such as Kogan Creek and Wilkie Creek, are already in production,
but most of the Surat Basin coal deposits still remain undeveloped. However, this is about to
change over the next three to five years if two companies—Xstrata and Syntech Resources—
bring their very large Surat Basin coal deposits into production. These two developments are
expected to add 50 mtpa of new steam coal production by 2015 (Box 3.1).
3.3.2 Galilee Basin
The second area of interest within Queensland is the Galilee Basin, which is located in north-
central Queensland, west of the Bowen Basin (Figure 28). The Galilee Basin is estimated to
hold more than 10 billion tonnes of in situ JORC-compliant steam coal deposits. The areas of
213
Surat Basin Rail Joint Venture, ―Rail Update Fact Sheet, November 2007
(www.suratbasinrail.com.au/files/SBR-fact-sheet-december07.pdf, Queensland Government) 214
HGI, which is short for Hardgrove Grindability Index, is a measure of a coal‘s hardness or more precisely the
difficulty that a power plant‘s coal mills will have in grinding it.
Page 89
28 March 2011 89 PESD WP #101
primary interest are those located in the eastern part of the Galilee Basin and referred to in the
industry as the ―Alpha deposits.‖ These coal resources are all steam coals.
The seams are shallow and the overburden can be removed with little or no blasting. The coals
are relatively high in ash and will need to be washed before railing to export ports. The yield of
saleable coal after washing is expected to range from 60 percent to 85 percent but the resulting
coal quality should equal the quality of washed Surat Basin coals, except for HGI, which will
be much higher for Galilee Basin coals (> 50 versus 32 to 35 for Surat Basin coals). A
description of the most advanced new steam coal projects that will be developed in the Galilee
Basin in Queensland are described in Box 3.2.
Figure 28: Railway-Port Connections from Existing and Planned Queensland Coal
Mines
Source: Queensland Government, ―Coal Transport Infrastructure in Queensland: Overview of Future
Expansion,‖ updated September 2008 and available at www.transport.qld.gov.au.
Page 90
28 March 2011 90 PESD WP #101
Box 3.1: Surat Basin Projects
Xstrata-Wandoan Project: Xstrata plans to bring its Wandoan field and the related Surat
Basin Rail project into commercial operation by 2014, the same time that the first stage of
WICET, the new coal terminal at Wiggins Island within the Port of Gladstone, is also
expected to be operating. Wandoan is conservatively estimated to have economically
recoverable reserves of 1.2 bt of steam coal with a typical CV of 5900 kcal/kg and ash
content of 8 percent to 10 percent. The coal will be sold after washing.215
Initially, Xstrata was planning to develop a mine at Wandoan capable of producing 30 mtpa
of raw coal over 30 years. However, subsequent exploration work has proved much larger
reserves. According to a recent Xstrata news release, Wandoan reserves are now deemed to
be sufficient to support a mining operation of 100 mtpa of run of mine steam coal over a
30-year period.
The full 100 mtpa mining capacity will be developed over the next decade as market
conditions and rail and port infrastructure allow. As part of the Wandoan project, Xstrata
will support the development of a new 210 km rail line, known as the Surat Basin railway
project, which will be constructed between the mine at Wandoan up to the existing Moura-
Gladstone line. Xstrata and two other companies are conducting the detailed feasibility
study for the new rail project. The Wandoan coal project received its EIS approval from the
government of Queensland in November 2010. The Surat Basin railway project is currently
at the stage of final EIS review.
Syntech–Cameby Downs Project: In early 2009, Syntech Resources, which announced
plans to develop its Cameby Downs steam coal project, estimates that the mine will cost
$250 million to develop with production commencing in 2010 at 1.4 mt of saleable coal.
Syntech plans to quickly ramp up production to 20 mtpa of saleable coal by 2013 with the
Port of Gladstone (Wiggins Island Coal Terminal) as the eventual export port. This project
is expected to share the costs of developing the Surat Basin railway project with Xstrata.
215
Details concerning the run-of-mine and washed coal specifications were not available for this draft of the
paper.
Page 91
28 March 2011 91 PESD WP #101
Box 3.2: Galilee Basin Projects
Hancock Coal216
and Waratah Coal are leading the development of the coal deposits
Galilee Basin.217
They have publicly announced plans to bring anywhere from 60 mtpa
to 120 mtpa of new steam coal deposits into production between 2013 and 2015. In
particular, Hancock and Waratah have developed two Galilee Basin projects—Alpha and
Waratah—to the point where they have reached the EIS and bank feasibility study phases
of development.
The Alpha and Kevins Corner coal projects, which are being developed by Hancock
Coal, are located right on the far eastern edge of the Galilee Basin. These two deposits
have been most extensively drilled and delineated according to JORC standards. As of
December 2010, Hancock claims to have identified 7.9 billion tonnes of JORC-compliant
resources (measured, indicated, and inferred), of which at least 2.4 billion tonnes are
classified as measured and indicated resources. Hancock estimates that its coal after
washing will have the following quality parameters:
o HGIs - 50 and above
o CVs - 5500 kcal/kg (gar) to 6900 kcal/kg
o Sulfur - 0.4 percent to 0.8 percent
o Ash - 8 percent to 14 percent.
Development of the Alpha and Kevins Corner resources will require the construction of a
new railway line between these two mine sites and a new coal terminal with a coal
handling capacity of 60 mtpa within the existing Port of Abbot Point. This coal handling
capacity is in addition to previously announced plans to expand Abbot Point‘s coal
handling capacity to 110 mtpa by 2020. The plan is to construct two mines and
supporting rail and port infrastructure that can support an eventual ROM production of
60-80 mtpa.
The Waratah project is being developed by Waratah Coal, which holds steam coal
216
Hancock Coal Pty. Ltd., a subsidiary of Hancock Prospecting Pty. Ltd. 217
Waratah Coal was recently acquired by Clive Palmer and the asset names and other details are likely to
change over the next year. He plans to hold the asset through his Hong Kong-based company called
Resourcehouse and to raise A$2 billion to A$3 billion in an IPO for Resourcehouse to finance the
development of the Waratah Coal project and its related infrastructure.
Page 92
28 March 2011 92 PESD WP #101
tenements that are contiguous to Hancock‘s Alpha and Kevins Corner deposits.
Waratah‘s tenements are considered an extension of Hancock‘s two deposits. Less
information is available on the Waratah tenements and the company‘s development plans
than is available for the Hancock projects. Waratah Coal plans to develop a mine with a
ROM production capacity of 40 mtpa that will generate saleable steam coal production
after washing of 30 mtpa. Waratah will either build its own 290 km rail link to Abbot
Point or build it in cooperation with Hancock Coal. The ―go-it-alone‖ cost of the railroad
is estimated at A$2.1 billion (2008 prices) while the mine and port are estimated to cost
A$3.18 billion and A$1.27 billion, respectively.
Table 7 provides a summary of the new mining projects that are at advanced stages of
development. Other less developed projects, such as the Adani and Bandanna projects in the
Galilee Basin, are likely to follow. Additional tenements are being considered for development
in the Galilee and Surat basins, not only for coal production but also for production of CBM
and for UCG projects.
Page 93
28 March 2011 93 PESD WP #101
Table 9: New Mining Projects in the Galilee and Surat Basins at an Advanced Stage of
Development (as of June 2010)
Developer Basin Deposit
2010
Resource
Estimate
Ω (billion
tonnes)
First
Shipment
(years)
Export
Capacity
(mtpa)
Distance
to Port
(km)
Total
Capital
(billion
AUS$)
Hancock Coal Galilee Alpha Coal 3.6 2013 30 495 7.5
Hancock Coal Galilee Kevin
Comer 3.4 2013 30 495 9.0
Waratah Coal Galilee Waratah 4.3 2013 40 495 5.3
Xstrata Surat Wandoan 2.7 Late 2014 22 380 6.0
Syntech Surat Cameby
Downs 1.4 2010 12-15 430 n/a
Ω Hancock Coal and Wandoan resource estimates include Measured, Indicated and Inferred only; Xstrata also estimated
that it has 400 mt of Marketable Reserves (Proved and Probable).
Sources: Hancock Coal (www.hancockcoal.com.au/go/current-projects/kevin-s-corner); Waratah Coal
(www.dip.qld.gov.au/projects/mining-and-mineral-processing/coal/waratah-galilee-coal-project.html); Xstrata
(www.wandoancoalproject.com.au/mediacentre_protocols.cfm); and Syntech (www.syntechresources.com.au).
3.4 Rail and Port Infrastructure Constraints
Rail and port infrastructure capacity shortages have constrained Australia‘s black coal exports
off and on since 1997. Their occurrence, although only emerging as a serious issue in 1997,
were given prominent mention in the report of Productivity Commission on Australia‘s black
coal industry.218
However, they have become a sustained and chronic issue since 2006.
Delays in loading ships at the major ports of Newcastle, Gladstone, and Hay Point have, over
the past five years, created cost and reputational issues for Australia‘s black coal industry.
With regard to costs, miners have been confronted with substantial demurrage charges, which
in 1997 were estimated for the Port of Newcastle at A$ 100 million. The impact of these
demurrage charges was to effectively double Newcastle port charges from A$2.80 per tonne to
A$5.40 per tonne in 1997. From a reputation standpoint, the word quickly spreads that coal
shipments from Australia will be subject to long and variable delays with miners occasionally
218
Productivity Commission, 1998,―The Australian Black Coal Industry,‖ Inquiry Report, AusInfo, Canberra.
Page 94
28 March 2011 94 PESD WP #101
using such delays to excuse themselves from their contract obligations. During the volatile
price phase, the issue of port and rail capacity constraints reached a critical point with vessel
queues at the Port of Newcastle ranging from 70 to 80 vessels over extended periods of time in
2007 and 2008.
More recently, the ―port of Newcastle disease‖ appears to have spread to Hay Point‘s
Dalrymple Bay Coal Terminal (DBCT). For the month of November 2010, DBCT suffered an
average vessel queue of 30 vessels and an average turnaround per vessel of 25 days. The
Kooragang/Carrington Coal Terminals (KCCT) at the Port of Newcastle had a much longer
vessel queue (45 vessels) but a much shorter turnaround time for each vessel (14 days).219
To put these numbers in perspective, a well-managed port with adequate capacity should take
no more than four days to turnaround a Panamax vessel and six days to turnaround a Cape-size
vessel. The four- to six-day allowance includes the time required to berth the vessel, load the
coal into the holds of the vessels, and trim the vessel for sailing. At 2010‘s depressed vessel
charter rates it cost only $20,000 per day to charter a Panamax vessel with a 70,000 tonne
cargo-carrying capacity and $25,000 per day to charter a Cape-size vessel with a cargo
carrying capacity of 160,000 tonnes. The demurrage charge for the Panamax vessel will
amount to US $200,000 or US $2.86 per tonne while the demurrage charge for the Cape will
equal US$1.56 per tonne at KCCT. In the case of DBCT, the demurrage charges will be much
higher at $5.10 per tonne for a Panamax vessel and $2.78 per tonne for a Cape-size vessel.
Despite these unresolved infrastructure constraints, Australia still managed to increase its black
coal exports by a respectable 4.7 percent per year between 2006 and 2009. The real question is
what could have been achieved if adequate rail and port infrastructure was available during
those years.220
3.4.1 Queensland Ports and Rail Networks
Figure 24 shows the locations of the four main coal ports of Queensland—Abbot Point,
Dalrymple Bay/Hay Point, Gladstone, and Brisbane—and their related rail systems. The
government of Queensland owns the four coal ports through three government corporations:
219
Energy Publishing, ―Coal Chain Australia,‖ Issue 0014, December 2010, pp. 4-8. 220
During 2007-2008, the coal supply problems caused by the chronic transport constraints were exacerbated by
a severe storm in June 2007 in the Hunter Valley, which reduced expected black coal output by more than 3
million tonnes.
Page 95
28 March 2011 95 PESD WP #101
The Port Corporation of Queensland, which owns and operates the ports of Abbot
Point and Hay Point
The Gladstone Ports Corporation, which owns the Port of Gladstone
The Port of Brisbane
The government of Queensland, in 2008, publicized its plans for expanding the capacities of a
number of its coal ports and their related rail systems over the next decade, which, if realized,
would result in the expansion of the nameplate coal handling capacity of Queensland‘s ports
from 263 mtpa in 2008 to 392 mtpa by 2020.221
Moreover, these plans do not consider the most
recent projects announced by Hancock Coal, Waratah Coal and Adani to build separate rail
lines and coal terminals at Abbot Point and elsewhere that might lead to another 100 mtpa of
new nameplate port capacity being added by 2020. Significant expansion projects as
announced by the government of Queensland for each coal handling port, including very recent
announcements for Abbot Point, are described below.
Port of Abbot Point: The Port of Abbot Point is owned and operated by the North Queensland
Ports Corporation Ltd. (NQPC), a government-owned corporation. Abbot Point has a single
coal terminal with a nameplate capacity of 25 mtpa, which is owned and operated by Xstrata
through its subsidiary, Abbot Point Bulk Coal Pty. Ltd. (APBC). Xstrata also owns the
Newland and Collinsville mines, which export 100 percent of their saleable production through
the Abbot Point coal terminal.
The Abbot Point coal terminal will be expanded to 50 mtpa by 2012. The expansion is being
completed in three stages at an estimated cost of A$690 million (2007A$). Once it completes
the 50 mtpa expansion project, the government of Queensland will start the implementation of
its X110 expansion project, which will involve expanding the coal handling capacity of the
Port of Abbot Point to 110 mtpa and constructing the necessary rail lines, primarily the
northern missing link rail line, to carry coal from coal mines in the central Bowen Basin to
Abbot Point. Finally, both BHP Billiton and Hancock Coal have been awarded preferred
developer status to develop their own coal handling facilities at Abbot Point plus related rail
221
In 2008, the Ministry of Industry issued a comprehensive report outlining its plans for expanding port and rail
infrastructure to support the development of the Surat and Galilee basins and allow increased production from
the Bowen Basin. This report, which is dated September 2008, is available from www.transport.qld.gov.au.
Page 96
28 March 2011 96 PESD WP #101
lines, which may result in an additional 100 mtpa of nameplate coal handling capacity being
added to Abbot Point beyond the X110 planned expansion. A recent presentation by the
government of Queensland suggests that Abbot Point might reach a total coal handling
capacity of 180 mtpa by 2020.222
Port of Gladstone: The Port of Gladstone is owned and operated by the Gladstone Ports
Corporation (GPC), a government-owned corporation previously known as the Central
Queensland Port Authority. GPC also manages the port terminal at Alma. Coal is the largest
commodity shipped out of Gladstone, which has two coal handling terminals:
Barney Point Coal Terminal with a throughput capacity of 7 mtpa
RG Tanna Coal Terminal with a 2008 throughput capacity of 72 mtpa
The capacity of the Barney Point terminal will remain fixed at 7 mtpa until 2015 when it will
be retired and its capacity handled by the new Wiggins Island Terminal. RG Tanna will remain
fixed at 72 mtpa and will continue in operation at that capacity until at least 2030. The RG
Tanna Coal Terminal is shown on the far right of Figure 29.
To meet industry needs for additional coal handling capacity, GPC is supporting the
development of a new coal terminal, known as the Wiggins Island Coal Export Terminal
(WICET), within the Port of Gladstone. WICET will be operational by 2013 with an initial
capacity of 25 mtpa. In 2008, a consortium of 16 coal companies was awarded ―preferred
developer status‖ by the government of Queensland to develop WICET.223
State and Australian
government environmental planning approvals for the terminal were obtained in the same year.
The plan is for the WICET consortium to build, own, and finance the new terminal, under a
long-term lease, with Gladstone Ports Corporation as the operator.
222
Fish, Brad, ―The Port of Abbot Point Multi Cargo Facility Project,‖ Presentation to the Major Projects
Conference – October 19, 2010 (available online: http://www.dip.qld.gov.au/resources/major-
projects/presentations/mpc10/brad-fish.pdf ). 223
Originally, there were 16 members of the WICET consortium: Anglo Coal Australia, Aquila Resources, BHP
Billiton, BHP Billiton Mitsubishi Alliance (BMA), Caledon Coal, Cockatoo Coal, Felix Resources, Jellinbah
Resources, Macarthur Coal, Northern Energy Corporation, Qcoal, Rio Tinto Coal Australia, Syntech
Resources, Vale Australia, Wesfarmers Curragh, and Xstrata Coal Queensland. As of June 2009, the number
of shareholders in WICET has decreased to 12 as a few companies had to drop out for financial reasons.
Page 97
28 March 2011 97 PESD WP #101
Figure 29: Coal Terminals at Port of Gladstone
Source: Port of Gladstone website (www.gpc.co.au).
The GPC is proposing to expand WICET‘s capacity to 70 mtpa after 2015. Concurrent rail
extensions will include the Surat Basin railway project, a 230-kilometer rail line that will
connect the Surat Basin coalfields with the existing Moura-Gladstone line. The existing line
will be upgraded to support the development of WICET. The cost of WICET is estimated at
A$4 billion and the related rail expansions, including the Surat Basin railroad, at A$1 billion.
In October 2010, the WICET consortium announced that the commissioning date for the first
stage of WICET (27 mtpa) would occur in 2014, two years later than originally planned.
Before financial close can be announced, eight coal producers—Aquila Resources, Bandanna
Energy, Caledon Resources, Cockatoo Coal, Northern Energy Corp., Wesfarmers Curragh,
Xstrata Coal, and Yancoal—must sign legally binding take-or-pay agreements with WICET.
The delay in commissioning the first stage of WICET until 2014 will also delay the start of
production for Xstrata‘s Wandoan project and the full expansion of the Syntech Resources
Cameby Downs project.224
224
(www.gladstoneobserver.com.au/story/2010/10/01/eight-sign-on-for-wicet-wiggins-island-coal).
.
Page 98
28 March 2011 98 PESD WP #101
Port of Hay Point: The Port of Hay Point is owned and operated by the North Queensland Port
Commission (NQPC). It consists of two separate coal terminals:
Hay Point Coal Terminal (HPCT), which is owned and operated by the BHP Billiton-
Mitsubishi Alliance (BMA) and handles only coking coals, has a nameplate capacity of 44
mtpa. In 2009, HPCT exported 34.7 mt of coking coal down from 36.9 mt in 2007/2008. It
is now considering expansion projects to bring the potential export capacity to 55 mtpa by
2012.
Dalrymple Bay Coal Terminal (DBCT), which is a leased by Babcock & Brown
Infrastructure (BBI) from the Port Corporation of Queensland (PCQ) (renamed as NQPC)
and is currently rated at 85 mtpa nameplate capacity. The coal terminal is available to all
coal suppliers. It handles both steam and coking coals. In 2009, DBCT handled 54.2 mt of
coal exports, a significant improvement over FY 2007/2008 when DBCT exported only
43.6 mt of steam and coking coal. However, given its very high nameplate capacity of 85
mtpa, it is surprising how low DBCT‘s annual throughput has been.
3.4.2 NSW Ports and Rail Networks
NSW is limited to one very large coal port—the Port of Newcastle. This limitation is partly
due to the topography of the state, which has a coastal mountain range that separates the coal
mines of the Hunter Valley from the coast until Newcastle. Port Kembla, which handles both
steam and coking coals, provides some ―back-up‖ port capacity. But it has a very limited
nameplate capacity of 18 mtpa and does not have room for further expansion.
Port of Newcastle: The Port of Newcastle is government owned through the Newcastle Port
Corporation. Government oversight is provided by the Ministry for Ports and Waterways, the
Ministry of Finance, and the Treasurer‘s Office. Within the Port of Newcastle, there are two
coal terminals—the Kooragang Coal Terminal with a 2010 nameplate capacity of 77 mtpa and
the Carrington Coal Terminal with a 2010 nameplate capacity of 25 mtpa. (Figure 30) These
two coal terminals, which are operated by Port Waratah Coal Services, Pty. Ltd. (PWCS) under
contract to the Newcastle Port Corporation, handled 93.0 mt of black coal exports in 2009.
The government of NSW plans to increase the port‘s coal handling capacity by adding a third
coal terminal known as the Newcastle Coal Infrastructure Group (NCIG) terminal. The first
stage of the NCIG terminal achieved commercial operation in late 2010 with an initial coal
handling capacity of 30 mtpa. By 2015, NCIG is expected to reach a total coal handling
capacity of 66 mtpa and the Port of Newcastle will have a total nameplate capacity of 192
Page 99
28 March 2011 99 PESD WP #101
mtpa. The total cost of the NCIG terminal is estimated at A$1 billion including construction
contingencies. NCIG will be owned by six coal producers: BHP Billiton, Centennial Coal,
Donaldson Coal, Felix Resources, Peabody, and Whitehaven Coal.
Figure 30: Port of Newcastle’s Kooragang and Carrington Coal Terminals
Source: Port of Newcastle website.
Port Kembla: NSW‘s only other significant coal handling port is Port Kembla with a
nameplate capacity of 18 mtpa. Port Kembla‘s coal handling capacity is expected to remain
fixed at that level through 2020. In 2009, Port Kembla processed 14.4 mtpa of mainly coking
coals.
3.4.3 Continuation of Chronic Port and Rail Shortages
The government of Queensland put forward a plan in 2008 to expand its port and rail capacities
from 238 mtpa in 2008 to 392 mtpa by 2020. (Table 8) The government of NSW similarly put
forward a plan to expand the Port of Newcastle‘s coal handling capability from 102 mtpa in
2008 to 192 mtpa in 2020. Once the new terminals at Abbot Point, Newcastle, and Gladstone
Carrington CT
Kooragang CT
Page 100
28 March 2011 100 PESD WP #101
are completed, the total nameplate coal handling capacity of the ports of Queensland and
Newcastle will increase from 263 mtpa by the end of 2008 to 392 mtpa, an increase of almost
50 percent.
The coal ports located in Queensland and NSW had for all of 2010 a capacity utilization factor
of 73 percent. If these ports could, on average, achieve an 80 percent capacity utilization
factor, total black coal exports could reach 480 million tonnes by 2020, up from 261 mt in
2008. Assuming that the current split between coking coal and steam coal exports continues
through 2020, steam coal exports could increase from 120 mtpa in 2008 to 216 mtpa without
incurring any port or rail constraints. Figure 26 shows the existing rail network with planned
extensions called the Northern Missing Link and the Surat Basin railways.
These expansion plans do not take into account the potential development of the Hancock and
Waratah projects within the Galilee Basin, which will add an additional 60 mtpa to 100 mtpa
of new steam coal production capacity over the next decade. Steam coal is therefore about to
become a bigger share of Australia‘s black coal exports over the next decade due to stagnant
demand for coking coal and expected moderate increases in steam coal to fuel new power
plants in Korea, Taiwan, and China.
However, the budget deficit problems of the Queensland government and the regulatory
uncertainty caused by the previous Commonwealth government led by Kevin Rudd have
created doubts about the timings for most new projects. During his tenure as PM, Rudd
attempted to pass into law a CO2 cap-and-trade program and a resource super profits tax
(RSPT), which created investor uncertainty and delayed a number of important rail and port
expansion projects, especially the Surat Basin railway project and the Northern Missing Link
railway project. Any prolonged delay in the Northern Missing Link rail project will also lead to
a delay in the project to expand the Abbot Point Coal Terminal from 50 mt to 110 mt.
Moreover, delays with these two projects will cause delays in developing new coal mines in
the Galilee Basin and the northern Bowen Basin. If the Northern Missing Link project and/or
the Surat Basin project are delayed for an extended period of time, the delay has also affected
the commercial operation date for the new Wiggins Island Coal Terminal that is planned for
the Port of Gladstone.
Page 101
28 March 2011 101 PESD WP #101
In June 2010, the WICET consortium announced a delay of one year for WICET, until 2014,
largely due to the RSPT and other factors.225
As a result of the delay in WICET, the Surat rail
project was delayed until 2014 with spill-over effects on the timing for Syntech Resources‘
Cameby Downs project. In short, additional steam coal supplies of about 100 mtpa will be two
years late in reaching the market due to the investor uncertainty created by the policies of
Kevin Rudd during his brief tenure as prime minister of Australia.
On the other hand, projects to expand the capacity of the port of Newcastle—and in particular,
the project by the Newcastle Coal Infrastructure Group (NCIG) to build a second coal terminal
on Kooragang Island with an eventual capacity of 60 mtpa—are on schedule. The first stage of
the NCIG terminal (30 mtpa) was commissioned in late 2010 and the second stage (36 mt) has
a planned commissioning date in mid-2012.
Figure 31 and Table 8 provide the 2008 port expansion plans for Queensland and NSW and the
rail expansion plans of Queensland Rail up to 2020. They have not been updated to reflect
delays announced during 2009 and 2010 by the Queensland government and Xstrata.
225
Energy Publishing Ltd., ―Coal Chain Australia: Surat Rail frozen in tax debate, Wiggins delayed,‖ Issue 0008
June 2010, pp. 1-2.
Page 102
28 March 2011 102 PESD WP #101
Figure 31: Queensland’s Planned Rail and Port Capacity Expansions 2010 to 2020
Source: Queensland Government, ―Coal Transport Infrastructure in Queensland: Overview of
Future Expansion,‖ September 2008.
Page 103
28 March 2011 103 PESD WP #101
Table 10: Nameplate Capacity Forecasts for Major Coal Handling Terminals at Ports
Located in NSW and Queensland
Port/Coal Terminal Location Nameplate Capacity (mtpa)
2006 2008 2010 2012 2015 2020
Newcastle NSW
1. Kooragang
Coal Terminal 64.0 77.0 91.0 101.0 101.0 101.0
2. Carrington
Coal Terminal 25.0 25.0 25.0 25.0 25.0 25.0
3. NCIG Coal
Terminal Planned) 0.0 0.0 30.0 45.0 66.0 66.0
Sub Total 89.0 102.0 146.0 171.0 192.0 192.0
Port Kembla NSW 16.0 16.0 16.0 16.0 16.0 16.0
NSW Total 105.0 118.0 162.0 187.0 208.0 208.0
Gladstone Queensland
1. RG Tanna
Coal Terminal 51.0 72.0 72.0 72.0 72.0 72.0
2. Barney Point
Coal Terminal 7.0 7.0 7.0 7.0 0.0 0.0
3. Wiggins Island
(Planned) 0.0 0.0 0.0 0.0 25.0 70.0
Sub Total 58.0 79.0 79.0 79.0 97.0 142.0
Hay Point Queensland
1. Dalrymple Bay
Coal Terminal 55.7 85.0 85.0 85.0 85.0 85.0
2. Hay Point
Coal Terminal 40.0 44.0 44.0 55.0 55.0 55.0
Sub Total 95.7 129.0 129.0 140.0 140.0 140.0
Abbot Point Queensland 15.0 25.0 50.0 80.0 100.0 100.0
Brisbane Queensland 5.0 5.0 5.0 5.0 8.0 10.0
Queensland Total 173.7 238.0 263.0 304.0 345.0 392.0
TOTAL 278.7 356.0 425.0 491.0 553.0 600.0
Source: Queensland Government, ―Coal Transport Infrastructure in Queensland: Overview of Future
Expansion,‖ September 2008 (www.transport.qld.gov.au). (2006-2008 figures actual nameplate capacities, 2010-
2020 figures are government forecasts)
Page 104
28 March 2011 104 PESD WP #101
3.5 Regulatory Issues
Between January 2008 and June 2010, the Commonwealth government, led by then Prime
Minister Kevin Rudd, proposed sweeping changes to environmental rules and regulations and
natural resources taxes—changes that generated political controversy and a fair amount of
uncertainty in Australia‘s coal mining and power industries. Due to his advocacy of these
controversial issues and, in the minds of many, his non-consultative style of governing, Rudd
was removed from power by his own party in June 2010. In his wake, he left behind two
proposals—a carbon pollution reduction scheme (CPRS) and a resources super profits tax
(RSPT)—subsequently restructured and renamed mineral resources rent tax (MRRT), which
continues to generate serious concern within the coal mining industry.
3.5.1 Australia’s CPRS
The CPRS was borne out of a study prepared by Professor Ross Garnaut, one of Australia‘s
most distinguished economists.226
Garnaut issued the study in April 2008. It provided the
rationales and principles upon which the government‘s CPRS proposal was later structured. In
particular, Garnaut proposed that Australia play its part in mitigating the impacts of climate
change by passing into law a scheme for implementing a cap-and-trade CO2 emissions
reduction program based on the following principles:
The UNFCCC227
definitions of greenhouse gases (CO2 and five other greenhouse
gases) and the methodology adopted by the UNFCC to convert those different gases
into CO2 equivalent values (CO2e) should be used for determining the amount of CO2
emitted by a polluter.228
The year 2000 should be adopted as Australia‘s base year for assessing any targeted
reductions in CO2e emissions.
The government should set CO2e reduction targets equal to 20 percent of Australia‘s
2000 CO2e emission levels by 2020 and a 90 percent reduction by 2050 based on other
226
The Garnaut Climate Change Review: Final Report (available online at www.garnautreview.org.au ). 227
UNFCCC stands for the United Nations Framework Convention on Climate Change. 228
The cap-and-trade concept was first proposed during the late 1960s as a practical emissions abatement
method by the U.S. National Air Pollution Control Administration (NAPCA), the predecessor to the United
States Environmental Protection Agency's Office of Air and Radiation. At that time, NAPCA completed
extensive computer simulation exercises, which showed that a ―cap-and-trade‖ approach to pollution
abatement was by far the least-cost solution for reducing emissions. The concept was not applied until 1990,
when it was used for reducing SO2 emission as part of the Acid Rain Program of the 1990 Clean Air Act. The
SO2 cap-and-trade system reportedly led to a 50 percent reduction in the 1987 level of SO2 emissions by
2007.
Page 105
28 March 2011 105 PESD WP #101
polluting nations agreeing to proportionate reductions in their CO2e emissions such that
global CO2e levels would be held at 450 ppm.
Relying heavily on the Garnaut report and his follow-on advice, the newly elected Rudd
government, in early 2008, prepared a green paper, which spelled out the principles and
mechanics of the proposed CPRS.229
The green paper was submitted to the public for its
comments in July 2008. Based on extensive public inputs and government analysis of those
inputs, a CPRS white paper was prepared and issued in December 2008.
The white paper was issued in two volumes and titled ―Carbon Pollution Reduction Scheme:
Australia‘s Low Pollution Future.‖230
It was comprehensive, logically organized,
professionally edited, and insightful. Most importantly, it addressed significant issues raised by
the public during the green paper consultation period in a direct and clear manner.231
The white
paper contained the following key components:
Baseline year of 2000, for setting carbon emissions reductions
Start date of July 2010, for CPRS
Exempted sector: agriculture
Affected entities: 1,000 (accounting for 75 percent of CO2e emissions)
Targeted reduction by 2020 (in year 2000 baseline emissions)
(a) 5 percent (as an unconditional commitment, independent of other country‘s CO2e
reduction commitments)
(b) 15 percent (if a global agreement is reached for which all major economies
commit to substantially restrain their CO2e emissions and all developed countries
accept binding CO2e reduction targets equal to Australia‘s)
Long-term (2050) reduction target,60 percent of 2000 CO2e emissions
Starting CO2e permit price, A$40/tonne
229
In Australia, a green paper is a national government report that contains a first proposal for a change in law
without any commitment to action. It is a ―first call for public inputs‖ and the first step taken before initiating
a significant change in law. Green papers may result in the production of a white paper, which is an official
statement of policy by the Australian government. It derived its name due to the historical fact that such
papers were originally bound in white paper. The green paper supporting the CPRS can be found at
www.climatechange.gov.au/~/media/publications/green-paper/greenpaper.ashx. 230
The white paper for the CPRS can be found at www.climatechange.gov.au/publications/cprs/white-
paper/cprs-whitepaper.aspx.
Page 106
28 March 2011 106 PESD WP #101
Once a white paper has been approved by the Cabinet, the next step in the Australian
legislative process is to prepare ―exposure draft legislation‖ and submit the draft bill to either
the House of Representatives or the Senate to be considered for passing as an act of
Parliament. The CPRS exposure legislation was a package of six related bills of which the
Carbon Pollution Reduction Scheme 2009 was the main bill.
Draft bills are typically sent first to the House of Representatives, which is where most of the
ministers reside. In the case of the CPRS draft bill, Senator Wong, despite being a senator,
decided to have the bill originate in the House of Representatives, where it was strongly
supported. The draft CPRS legislation was introduced into the House and read for the first time
on May 14, 2009.232
The House of Representatives completed the necessary three readings of
the revised CPRS bill on June 4, 2009.
Recognizing that the CPRS legislation would face stiff opposition in the Senate, Rudd decided
to submit to the Senate a ―gutted‖ version of the bill that had just passed the House. The
revised CPRS legislation contained the following concessions:
The start date for the CPRS was delayed until July 2012.
Polluters were allowed free issuance of 85 percent of all required carbon permits.
The price of all other permits was set at a very low price of A$10 per tonne during the
first year of the CPRS.233
But the Senate remained unmoved by Rudd‘s many concessions. The draft legislation was
submitted to the Senate for its consideration on June 15, 2009, but it failed to pass the
necessary three readings and was rejected in August 2009. The opposition senators focused the
debate on CPRS around one key point—Australia should not unilaterally commit to a CO2 cap-
and-trade scheme before other far larger polluters, such as the United States, Japan, Korea,
Taiwan, and China, agreed to a proportional reduction in their CO2e emissions through a
binding international agreement. In their view, consideration of the CPRS in the Australian
232
Bills are not deemed approved by either of the two houses until the bill has gone through three readings. The
first reading simply introduces the bill and reads it into the record. The second reading involves the debate of
policy and principles and the third reading involves debating the details of the bill. Once it passes the third
reading, the bill is typically passed from the originating house to the second house. 233
Australian Government Department of Climate Change ―Summary: Key Changes to the Carbon Pollution
Reduction Scheme Legislation,‖ May 2009.
Page 107
28 March 2011 107 PESD WP #101
Senate should be delayed until after the United Nations Climate Change Conference in
Copenhagen.234
Australia‘s coal mining industry opposed the revised draft CPRS legislation for more specific
reasons. First, industry representatives were upset at being ruled ineligible for transitional
support under the emission-intensive trade-exposed sectors (EITES) program. They claimed
that the government‘s rule for determining eligibility—based on CO2e emissions per $ of
revenue and CO2e emissions per $ value added over two years (2007 and 2008)—arbitrarily
resulted in the coal industry being declared ineligible. Coal industry representatives argued if a
longer period of time, say four to five years was used, the coal industry would have qualified
for EITES‘s funding.
Second, and more importantly, the government decided to include fugitive methane emissions
from both open-cut and underground coal mines as one of the coal industry‘s CO2e emission
obligations. The coal industry objected and argued that methodologies for making such
estimates are incomplete, if not fatally flawed. It argued further that any attempt to impose
such a liability on Australia‘s coal producers was both inequitable and would lead to an
inefficient market solution.
Finally, the coal industry stated that no other government in the world was presently
considering fugitive methane emissions from coal mines as a cap-and-trade obligation due to
the difficulty in measuring such emissions from open-cut mines. Industry respondents
recommended that this provision of the CPRS be dropped until an international agreement
could be reached on how to deal with fugitive methane emissions from all coal mines—both
underground and open-cut mines—as a CPRS obligation. The coal industry was also frustrated
by what it felt was favored treatment for the LNG and pipeline gas industries.
A revised CPRS bill, known as the Carbon Pollution Reduction Scheme Bill 2009 (No. 2), was
introduced in the Australian House of Representatives on October 22, 2009, which approved it
for sending to the Senate on November 16, 2009. The following day, November 17, 2009,
234
Participants to the UN‘s Copenhagen Conference were expected to agree on a successor to the Kyoto
Protocol and CO2e emission reduction provisions that would commit all developed countries to reduce their
CO2e emissions in 2020 and 2050 below some baseline levels and in the case of developing countries agree to
a binding program for reducing the growth of their emissions. The conference was held between December 7
and December 19, 2009, in Copenhagen but failed to meet its lofty goals. A subsequent climate change
conference organized under the auspices of the UN‘s COP15 organization was held in Cancun, Mexico,
between November 29 and December 10, 2010. Only minor agreements were reached at that conference.
Page 108
28 March 2011 108 PESD WP #101
CPRS No. 2 was introduced into the Senate but was rejected on December 2, 2009. In early
2010, the Rudd government tried a third time to pass the CPRS into law with the introduction
of a revised bill, known as the Carbon Pollution Reduction Scheme Bill 2010. It passed
through the House on February 11, 2010 and was introduced into the Senate on February 22,
2010, where it was once again voted down.
As a result of three failed attempts, Rudd decided to drop any further attempts to pass the
CPRS into law until 2013. He blamed the failure of the COP15 Copenhagen Climate Change
Conference and the lack of a broad international commitment to reduce emissions of GHGs as
the reason. In fact, Rudd probably realized that he would never get the CPRS passed in the
Senate and was simply looking for a face-saving way to put it on the back burner.
Because the Australian Senate rejected the CPRS bill twice, under the Australian Constitution,
the government could have, at that point in time, dissolved Parliament and called a general
election. In March 2010, Rudd proceeded to call a general election for October 2010 but,
ironically, not based on the Senate‘s multiple rejection of the CPRS legislation but due to the
two-time rejection of a health care reform bill. But Rudd did not stay in power long enough to
contest the 2010 general election. In June 2010, as a result of Rudd‘s attempt to impose a very
unpopular resource super profits tax (discussed next), Rudd was voted out as PM by his own
party and replaced by veteran politician, Julia Gillard.
The CPRS remained on hold until 21 December 2010, when an ad hoc committee known as the
Multi-Party Climate Change Committee (MPCCC), consisting of members of the ruling
Labour Party, the Greens and two independent parliamentarians, released a proposal to
implement a fixed carbon tax by July 2012.235
However, it was not until 24 February 2011 that
the Prime Minister formally announced that the government intended to implement a fixed
―carbon tax‖ by July 2012 and intended to introduce legislation to do so by the second half of
2011.236
Details concerning the carbon tax scheme are minimal. All that has been proposed as
of late February 2011 is:237
(a) The proposed commencement date for the Carbon Tax is 1 July 2012.
235
Multiparty Climate Change Committee, ―Carbon Price Mechanism‖, 21 December 2010 (available online
from http://www.scribd.com/doc/49435346/MPCCC-Carbon-Price-Mechanism). 236
Tim Leslie, ―Gillard unveils carbon price details‖ABC News, February 24, 2011
(http://www.abc.net.au/news/stories/2011/02/24/3147523.htm) 237
Deutsche Bank Australasia, ―Äustralian Carbon Policy: Tax-then-trade to start July 2012‖ 24 February 2011.
Page 109
28 March 2011 109 PESD WP #101
(b) The Carbon Tax would be fixed for 3-5 years after which it would be replaced by a cap
and trade system, presumably the CPRS or some hybrid based on its 2009 form.
(c) The following entities/activities will initially be subject to the Carbon Tax: (i)
stationary energy sources such as power plants, (ii) transport, (iii) industrial processes,
(iv) sources of fugitive emissions. Agricultural and land use activities that generate
significant carbon emissions will not be taxed for their emission generating activities.
The proposal is notable for its surprising lack of detail. Given all of the debate and research
completed for the CPRS, one would have expected a more detailed proposal to have been
released by the government. It appears that political realities may have limited the government
options. Tony Windsor, who is one of the two independent parliamentarians supporting the
current Gillard/Labor Government, agreed to have the proposal released for public
consultations but is decidedly against imposing a carbon tax at this time.238
The Greens on the
other hand may have forced Gillard‘s hand by threatening to leave the government if she did
not take meaningful action to pass a tax on carbon.
Public approval of the proposed carbon tax scheme is low if one considers the results of a
NewsPol survey on public approval of political parties on the federal level and specific
politicians. The results of NewsPol survey, which were published on March 7, 2011, indicated
that the federal Labour Party and PM Gillard public approval ratings had fallen to ―record
lows‖.239
She is now less popular than previous Labor PM Kevin Rudd.
It remains to be seen how this twist in Australia‘s efforts to implement some form of carbon
pollution reduction scheme will play out. In many ways, the political gridlock that has
developed around the implementation of a cap and trade program in Australia is very similar to
the situation that exists in the US, where carbon pollution reduction legislation stalled after
failing to pass the US Senate in 2010. Such programs are proving very difficult to implement
worldwide due to public misunderstanding of how these complex programs will affect their
daily lives and the very accurate understandings of those industrial interest groups such as
power, fuel production and industrial processing companies, which will be adversely impacted
by any cap and trade program.
238
ABC News, ―Windsor savages carbon tax strategy‖, 9 March 2011.
(http://www.abc.net.au/news/stories/2011/03/09/3158764.htm?site=news) 239 ABC News, ―Gillard vows to fight after poll hammering‖, March 8, 2011.
Page 110
28 March 2011 110 PESD WP #101
3.5.2 Resource Super Profits Tax/Mineral Resources Rent Tax
Before the election could be held, however, Rudd attempted to impose a resource super profits
tax (RSPT) on the mining industry. This turned out to be a huge political miscalculation on
Rudd‘s part. Rudd announced the RSPT to the nation and the mining and natural resource
industries in May 2010. Except for its total opposition to the tax, the mining community had a
hard time voicing its specific complaints because there was so much still unknown about the
proposed tax scheme. A fact sheet issued by the Australian government on the RSPT was
embarrassingly short on details.240
An article in Sydney‘s The Daily Telegraph provided much
clearer details on how the RSPT was expected to work than the government‘s own
documents.241
A 40 percent tax will be imposed on all profits earned by mining as well as oil and gas
extraction companies that earn a profit greater than 5.7 percent, which is the
government‘s long-term bond rate.
Profit was to be calculated after the deduction of royalties, operating expenses,
depreciation, federal company tax, and a capital allowance of around $5 million for
each company.
The federal company tax was to be reduced from 30 percent to 28 percent.
If a company fails to make a profit, the Commonwealth government will reimburse that
company for 40 percent of its initial investment in the mine.
The tax will be applied retroactively.
The Commonwealth government expected to earn A$12 billion in extra tax revenues starting in
2012 from the RSPT. The monies were to be used to ―bail out‖ the government superannuation
funds (about one-third of the RSPT revenues) and to finance transport infrastructure projects in
NSW and Queensland.
As opposition to the RSPT grew in June 2010, rumors circulated that the Rudd government
would offer a compromise to the mining sector, which would increase the threshold profit rate
from 5.7 percent to 10 percent or 12 percent. It was also rumored that the Rudd government
would drop the proposal to reimburse 40 percent of the cost of any failed mines. But these
rumors were squashed on June 11, 2010, by Wayne Swan, the government treasurer, who
240
Australian Government, ―Fact Sheet: Resource Super Profits Tax‖ (available at
www.futuretax.gov.au/documents/attachments/10_Fact_sheet_Resource_Profit_Tax_Final.pdf). 241
Andrew Carswell, ―Your Simple Guide to the Resource Super Profits Tax,‖ June 17, 2010.
Page 111
28 March 2011 111 PESD WP #101
announced that consultations with industry are ongoing and a final design would only be
announced after these consultations have been completed.
Industry reactions to the RSPT were, as could be expected, uniformly negative. Many of those
opposed to the tax and even some in favor of the tax felt that it was a hypocritical attempt by
Rudd to position his government for the upcoming federal election in November 2010. In
response to the proposed RSPT, Xstrata announced that its Wandoan coal project was on hold,
which would have also delayed the Surat rail project and WICET. Coal miners such as BHP
and others threatened to do the same.
Whatever Rudd‘s rationale for proposing the RSPT, it turned out to be a serious political
miscalculation. In late June 2010, the Australian Labour Party, under considerable pressure
from the public and declining in the polls, decided to remove Rudd as its choice for prime
minister. He was replaced by his deputy, Julia Gillard, who took immediate action to remove
the biggest issue of the election—the RSPT—from the table. She renamed the initiative the
MRRT (for minerals resources rent tax) and changed its threshold values, in consultation with
BHP and other large mining companies. She also moved up the date for the general election
from October 2010 to August 2010. Labour managed to win the election by a narrow margin
and then, against all odds, to cobble together a government by joining with two independents
and one member of the Greens Party.
As of February 2011, Gillard‘s hold on power is considered by most Australian political
analysts to be very weak with a new election likely sometime during 2011. Until the current
―hung parliament‖ is decided in favor or either the National or the Labour party, it appears
unlikely that either the MRRT or its new Carbon Tax proposal will gain much traction in the
Australian parliament. Even if Gillard government were able to pass into law legislation in
support of both measures, the Opposition has stated unequivocally that it will rescind both laws
if voters, in the next general election, should give the Opposition sufficient votes to form the
next government and have a majority in both the House and Senate. Given all of this political
and regulatory uncertainty, it is hardly any wonder that major investment decisions to open
new mines and to construct new rail and port infrastructure in Queensland and NSW are
constantly being second-guessed by private investors and state governments.
Page 112
28 March 2011 112 PESD WP #101
4. New Technology to the Rescue?
In response to global warming and resource availability issues, the Australian government and
the coal industry of Australia have decided to bank heavily on technology to solve their
―greenhouse gas emission problems. Both coal and power companies in Australia are
confronted with continued uncertainty over how and when national or international GHG
mitigation polies could impact their businesses. As a result, the industry is examining several
key technologies that might play a role in reducing both their emissions and their exposure to
emissions mitigation policies: carbon capture and sequestration (CCS), coal bed methane
(CBM), and underground coal gasification (UCG).
4.1 Carbon Capture and Sequestration
Carbon capture and sequestration (CCS) is a process for removing CO2 from a stream of
process gases, liquefying the CO2, transporting it to a storage site and then injecting the liquid
CO2 deep underground into a geological formation that ensures safe and permanent storage.
The process consists of three generic technologies:
CO2 capture technologies, which remove CO2 from either (a) syngas, which is
produced through the gasification of coal or (b) flue gas, which is produced through the
direct combustion of the coal, and then produce a concentrated steam of CO2 that is
compressed into liquid form prior to transport
CO2 transportation technologies, which utilize pipelines as a primary transportation
method, though some CCS projects may rely on transportation of CO2 by truck, ship or
rail
CO2 sequestration technologies, which involve identifying acceptable geological
formations and then injecting the liquid CO2 into these geological formations for
permanent storage
Of the three generic technologies, CO2 capture technologies, which typically account for the
greatest share of costs in the CCS value chain, have until recently received the lion‘s share of
government and industry attention and funding. Capture technologies have traditionally been
separated into three distinct categories.
(1) Precombustion technologies, which rely on downdraft gasifiers to convert the coal into
a syngas of CO, H and CO2 and then other technologies for removing the CO2 from the
Page 113
28 March 2011 113 PESD WP #101
syngas stream and liquefying it.242
Gasification is typically envisioned as being
accomplished via an integrated gas combined cycle (IGCC) power plant, which
produces electricity and process steam along with the stream of liquid CO2.
(2) Postcombustion solvent capture technologies, which rely on combustion of coal in a PC
boiler and mixing the resulting flue gas from the combustion process with either
chemical or physical solvents that have an affinity for CO2. The combined solvent-CO2
solution is then passed through a distillation column where the CO2 is vaporized,
collected as 100% CO2 and then liquefied.
(3) Oxy-fuel combustion, which produces a concentrated stream of almost pure CO2 from
the combustion of coal in a PC boiler an atmosphere of concentrated oxygen. The
resulting flue gas is composed primarily of CO2 and water. The concentrated CO2
stream is then stripped of any remaining impurities and then compressed into a liquid.
Transportation technologies are technically proven and account for a small part of total CCS
costs. They have therefore not received much government funding or attention as part of any
government CCS R&D program. In short, they are not viewed as a critical technological
constraint for CCS.243
The costs of CO2 pipelines are analogous to those of natural gas
pipelines, which have significant exposure to raw material input costs such as steel.244
Storage technologies actually refers to the geoscience research necessary for the identification
of specific geological formations that pose the lowest risk of CO2 leakage either into the
atmosphere or the water table. Government funded research has focused on the delineation of
areas that can provide the safe and long-term storage of CO2.245
But due to growing public
242
The CO is either burned with the H2 to produce electricity or is passed over a catalyst in the presence of water
(water shift conversion) to produce more H2 and CO2 and some CH4 and more CO2. Both streams of CO2 are
captured and liquefied. 243
It should be noted however that were CCS widely deployed across coal-fired plants in the US, the sheer size
of the pipeline network likely required would be substantial and require massive investment. The US
National Energy Technology Laboratory (NETL) analyzed the costs and barriers to a US CO2 pipeline
network in A Policy, Legal, and Regulatory Evaluation of the Feasibility of a National Pipeline
Infrastructure for the Transport and Storage of Carbon Dioxide, available at
http://www.sseb.org/downloads/pipeline.pdf. 244
A Policy, Legal, and Regulatory Evaluation of the Feasibility of a National Pipeline Infrastructure for the
Transport and Storage of Carbon Dioxide, NETL 2010. 245
The US Department of Energy funds extensive research on carbon sequestration, much of which can be found
at: http://www.netl.doe.gov/technologies/carbon_seq/refshelf/atlasIII/index.html. The National Energy
Technology Laboratory‘s ―2010 Carbon Sequestration Atlas of the United States and Canada – Third Edition
(Atlas III)‖ is available at http://www.netl.doe.gov/technologies/carbon_seq/refshelf/atlasIII/index.html.
Early research on China‘s storage potential has also been carried out by US national labs. The Pacific
Northwest National Lab‘s estimate of China‘s CO2 sequestration potential, ―Regional Opportunities for
Carbon
Page 114
28 March 2011 114 PESD WP #101
opposition to CCS projects that would store CO2 on sites that are near to or under populated
areas, governments are starting to address negative public perceptions about the environmental
risks of terrestrial CO2 storage. This very recent activity involves development of enhanced
and comprehensive regulatory approval processes that focus on public consultations and
education concerning the entire CCS project pathway including the environmental risks and
regulatory approvals needed for all components of a CCS project, including geosequestration
of CO2 and its risks.246
CCS is widely recognized as a key technology for mitigating global carbon emissions (the
majority of which come from burning coal). The US Secretary of Energy, Steven Chu, said in
2009 that because coal accounts for 40% of global emissions, ―I believe we must make it our
goal to advance carbon capture and storage technology to the point where widespread,
affordable deployment can begin in 8 to 10 years.‖247
IEA research shows that CCS will have
to contribute 19% of global GHG mitigation to 2050—2% more than renewable energy at
17%— in order to stabilize the global climate.248
The IPCC argued that under a least-cost
mitigation portfolio approach, CCS might contribute 15-55% of global mitigation before 2100
(depending on the scenario and assumptions).249
The IPCC further argued that including CCS
in the global mitigation portfolio would reduce mitigation costs by 30% or more.250
Numerous
industry groups also support the development of CCS technology, including the Electric Power
Research Institute (EPRI), the World Coal Association, and even the World Wildlife
Federation (WWF), which has voiced qualified support for funding CCS demonstration
Dioxide Capture and Storage in China: A Comprehensive CO2 Storage Cost Curve and Analysis of the
Potential for Large Scale Deployment of CCS in the People‘s Republic of China‖, is available at
http://energyenvironment.pnl.gov/pdf/roccs_china_pnnl_19091.pdf. 246
For example, see recent work completed by the Scottish government with support from the Global CCS
Institute located in Canberra, Australia The Scottish Government, “Carbon Capture and Storage Regulatory
Test Toolkit” and Carbon Capture, Transport and Storage Regulatory Test Exercise: 11 -12 August 2010
Output Report””available at http://www.globalccsinstitute.com 247
Open letter from the US Secretary of Energy, October 12, 2009. Available at
http://www.energy.gov/media/CCS_Letter_-_Final.pdf. 248
Analysis based on IEA‘s Energy Technology Perpsectives 2010. GHG reduction targets refer to IEA‘s Blue
Map Scenario. 249
IPCC, 2005: IPCC Special Report on Carbon Dioxide Capture and Storage. Prepared by Working Group III
of the Intergovernmental Panel on Climate Change [Metz, B., O. Davidson, H. C. de Coninck, M. Loos, and
L. A. Meyer (eds.)]. Cambridge University Press, Cambridge, United Kingdom and New York, NY, USA,
pp. 442. 250
IPCC, 2005: IPCC Special Report on Carbon Dioxide Capture and Storage. Prepared by Working Group III
of the Intergovernmental Panel on Climate Change [Metz, B., O. Davidson, H. C. de Coninck, M. Loos, and
L. A. Meyer (eds.)]. Cambridge University Press, Cambridge, United Kingdom and New York, NY, USA,
pp. 442.
Page 115
28 March 2011 115 PESD WP #101
projects as a means of determining if this technology can succeed.251,252,253,254
In short,
addressing climate change requires addressing emissions from burning coal, and CCS is the
leading candidate for achieving such CO2 emission reductions.
Australia‘s CCS support program is an integrated effort that is being led by the Australian
Government in partnership with a number of state governments, particularly the governments
of Queensland, NSW and Victoria, and companies and industry trade groups with an interest in
coal and its conversion into low GHG emission energy, such as the Australian Coal
Association, the NSW Mineral Council, GE , MHI and Shell Oil Company.
The Australian Government is supporting the implementation of CCS demonstration and
research through a special CCS fund, known as the CCS Flagships Program, which forms part
of the government‘s broader A$4.5 billion Clean Energy Initiative. The CCS Flagships
Program was established in 2008, with initial funding of A$1.85 billion. Its targeted goals are
to: (a) support the development of two-to-four integrated industrial scale CCS projects; (b)
―contribute to the development of at least 20 CCS projects by 2020‖ and (c) help establish
―1000 MW of low emission fossil fuel power generation in Australia‖.255
The CCS Flagships Program is being implemented in two stages. Stage one, which was
completed in December 2009, involved the solicitation of preliminary proposals from
interested parties from which a shortlist of bidders allowed to compete in Stage two was
selected. Stage two of the program is expected to commence sometime during the second half
of 2011.256
The Australian Government expects that these funds will help leverage an
additional $4 billion of state and industry funding for the CCS demonstration projects.257
251
International Energy Agency, ―CO2 Capture nd Storage: A Key Carbon Abatement Option‖ 2008 and
―Technology Roadmap: Carbon capture and storage‖ undated but believed to be issued in 2009. 252
Electric Power Research Institute (EPRI), ―Advanced Coal Plants, Capture and Storage‖, March 2011. 253
World Wildlife Federation ―WWF joins world‘s leading environmental proponents in CCS call‖ 15 April
2008 (http://www.wwf.org.au/news/wwf-joins-worlds-leading-environment-proponents-in-ccs-call/). 254
World Coal Association ―Carbon Capture and Storage‖ March 2011 (http://www.worldcoal.org/carbon-
capture-storage/). 255
Australian Government: Department of Resources, Energy and Tourism, Carbon Capture and Storage
Flagships Program Fact Sheet‖, 2010
(http://www.ret.gov.au/energy/Documents/cei/ccsfp/CCS_Fact_Sheet.pdf) 256
Ibid. 257
Ibid.
Page 116
28 March 2011 116 PESD WP #101
Based on potential support under the CCS Flagships Program and additional support available
from state governments and from a special coal industry fund of A$1 billion, which was
generated from a voluntary levy paid by coal mining companies, a number of CCS projects are
under development in Australia. Over 15 such projects were identified by CO2CRC,258
a
research organization established as a collaboration of industry, government and research
organizations, either in construction in Australia or at an advanced stage of planning as of
January 2009.259
Since that listing was published other significant CCS projects have surfaced, such as the 400
MW Wandoan Power Project, which will develop a 400 MW IGCC-CCS project on a site that
is close to Xstrata‘s Wandoan coal resource in the Surat Basin. The project, which is being
developed by GE, will implement CCS technologies at commercial scale and will be capable
of capturing 90% of CO2 emissions using precombustion capture of CO2. The Australian
Government has also played a lead role in establishing the Global CCS Institute, which was
launched in early 2009 with A$100 million of funding from the Australian Government.260
The efforts of the Australian Government have been exemplary in both their scope and long-
term commitment to CCS as a GHG reduction option. Nonetheless, the future of CCS in
Australia and the rest of the World rests upon the R&D efforts and demonstration projects that
are starting from a very early stage. The Government of Australia and industry proponents of
different CCS technologies are making the expected shows of confidence as they announce the
start of their projects and research programs.261
But the Australia Government had not yet funded a single project under its CCS Flagships
Program as of early 2011 and does not intend to request full project proposals from companies
until the second half of 2011.262
Moreover, a number of the proposed CO2 capture technologies
258
CO2CRC, which is a research centre focused on CCS related research, was established in 2009 under the
Australian Government‘s Cooperative Research Centre‘s Programme. It is a partnership between industry,
state governments and various research organizations such as CSIRO and Australian universities. 259
Cooperative Research Centre for Greenhouse Gas Technologies (CO2CRC) ―CCS Activity in Australia, 2009
(http://www.co2crc.com.au/dls/gen/CCS_activities_2008.pdf) 260
GCCSI publishes reports a wide selection of technical and economic reports covering the status of global
CCS projects, economics of CCS and many other matters of interest to those interested in CCS, These
reports, which are of very high quality are available free of charge from the Global CCS Institute website
(http://www.globalccsinstitute.com) 261
Wandoan Power, ―Wandoan Power Project Summary (www.wandoanpower.com.au); ZeroGen ―Project
Overview‖(http://www.zerogen.com.au/project/overview.aspx 262
Ibid.
Page 117
28 March 2011 117 PESD WP #101
under the Flagships Program are still at the demonstration stage and some are still at the pilot
stage of development. Even proven post-combustion capture technologies, such as
monoethanolamine (MEA) solvent extraction, face formidable challenges scaling up to a plant
size sufficient to handle the huge volumes of dilute CO2 gas streams generated by coal-fired
power plants.
The impediments to wide-scale deployment of CCS are substantial. All CO2 removal
systems—both pre and post combustion systems—are likely to pose significant operating risks
for power plants due to their need to rely on power plant auxiliary systems to remove CO2.
Even if one assumes that technology and cost issues are resolved at the single-plant level,
significant technical and economic issues are also likely to emerge as countries attempt to
widely implement these systems. In this author‘s view, constraints are also likely to emerge in
the form of solvent and equipment shortages, leading to higher than expected costs for plants
once their systems are fully demonstrated at commercial scale.
But societies will be lucky to reach that level of commercial deployment of CCS systems.
Many of the technology options being explored today face the risk of failing the test of
commercialization due to ―inscalability‖ and poor operating efficiency. There is no guarantee
that even one of the possible options will prove technically feasible at scale or whether CCS
will ever be able to achieve CO2 capture at an acceptable cost.263
In short, the ability to achieve the requisite economies of scale and improvements in efficiency
for CCS processes is far from certain.264
But, a large challenge confronting CCS is that in
order to address emission from the existing stock of coal-fired plants, the technology must be
flexible enough to be retrofitted onto the existing global coal generation fleet.
263
A Stanford University study examined in detail the obstacles facing CCS deployment at scale in China,
arguably the largest target market. See Morse, Rai, and He, ―The Real Drivers of Carbon Capture and
Storage in China‖, Stanford University, 2009. 264
In addition to the IPCC report cited in this chapter, readers are referred to other sources that review existing
and emerging CCS technologies:
a. International Energy Agency, ―Technology Roadmap: Carbon Capture and Storage‖ (undated);
b. Clean Air Task Force, ―Coal Without Carbon: An Investment Plan for Federal Action,‖ September
2009 (available from www.catf.us);
c. Wilson, Elizabeth J., and David Gerard Wilson (eds.), ―Carbon Capture and Sequestration:
Integrating Technology, Monitoring, and Regulation,‖ Wiley-Blackwell, April 2007;
d. Shackley, Simon, and Clair Gough (eds.), ―Carbon Capture and its Storage: An Integrated
Assessment,‖ Ashgate Publishing, December 2006.
Page 118
28 March 2011 118 PESD WP #101
Only post-combustion systems offer the possible option of retrofitting an existing power plant,
as there are a very coal plants currently in existence that could be integrated with pre-
combustion CCS. But retrofitting existing power plants, steel mills and industrial processing
plants with post-combustion systems is at present prohibitively expensive and creates very
large drops in a coal-fired power plant‘s efficiency (see Tables 10 and 11). Moreover, retrofits
always involve additional costs due to the need to modify the power plant to accommodate the
CO2 capture system, which will, in most cases, experience sub-optimal performance due to site
limitations and being bolted onto an already built facility.
As a result, governments that choose to implement CCS as a major plank of their CO2
reduction programs will need to consider early retirement of existing coal-fired power plants
and their replacement with new, more efficient coal-fired power plant equipped with CCS..
Moreover, CCS technologies—both pre and post combustion systems—will cause a significant
increase in the consumption of coal with additional levels of CO2 production (beyond the
amounts of CO2 produced on the same plant without CCS) as the price for its later capture and
sequestration.
Australia, which relies on coal-fired power for 80% of its 2009 electricity generation and other
countries such as the United States, China, and Indonesia, which also rely heavily on coal for
power generation, will face significant increases in their power prices, if they follow through
on CCS, due to the high cost of installing and operating CCS systems. The UN‘s
Intergovernmental Panel on Climate Change (IPCC) estimates that the cost of electricity
produced in a new supercritical power plant with CCS would be from 40 percent to 85 percent
higher than a supercritical plant without CCS while a new integrated gas combined cycle
(IGCC) plant would have its costs of production increased by 20 percent to 55 percent.265
The IEA estimated in 2008 that demonstration-scale post-combustion CCS plants would result
in increases in the cost of generating electricity by $0.08 – $ 0.10 per kWh at the power plant‘s
bus bar. CO2 abatement costs would range from $60-75 per tonne of CO2 abated.266
If capital
and operating and maintenance costs for a CCS plant were recovered through a tax on each
265
IPCC, 2005: IPCC Special Report on Carbon Dioxide Capture and Storage. It should be noted an IGCC plant
without CCS has substantially higher costs of production than a supercritical plant without CCS. There are
very few IGCC plants in operation. So switching from PC-type boiler plants to IGCC technology with CCS
will still involve a huge increase in the cost of electricity. 266
International Energy Agency, ―CO2 Capture and Storage: A Key Carbon Abatement Option‖, 2008.
Page 119
28 March 2011 119 PESD WP #101
tonne of coal sold, the tax on coal would range from $135.60 - $169.50 per tonne for
demonstration plants and would range from $124.30 – 135.60 per tonne for commercial scale
plants, which the IEA forecasts will only be available after 2030. All of these estimates assume
2008 price levels.267
Retrofitting existing plants, which will be largely plants equipped with
subcritical boilers, will entail even greater increases in the price of electricity.
The Global CCS Institute has issued a detailed study which assesses the costs of CO2
abatement and the increased price of electricity that will result from installing CCS on new
power plants.268
Although the results are more promising than those reported by the IEA,
McKinsey and Harvard, the costs of CO2 abatement remain stubbornly high at $44 - $78 per
tonne of CO2 abated.269
This translates into a change in the coal price of over $100 per tonne.
Moreover, the authors of the Global CCS Institute study go to great lengths to explain the
limits to their cost estimation methodologies and indicate that the estimates have a margin of
erro equal to +/- 40% with the greatest price risk being to the upside.270
Tables 9, 10, and 11 provide a critical analysis of CCS as an option for reducing CO2
emissions from existing power plants, highlighting likely impediments for full-scale
deployment of the technology.
Table 9 separates the potential offered by CCS from the risks of where we are today in
the development stages of each CCS technology.
267
The methodology for converting a CO2 abatement cost into an additional coal price is as follows:
1. a tonne of CO2 forms during coal combustion when one atom of carbon (C) unites with two atoms of
oxygen (O) from the air.
2. The atomic weight of carbon is 12 and that of oxygen is 16, which makes the atomic weight of CO2
is 44.
3. Assuming complete combustion, 1 tonne of carbon combines with 2.667 tonnes of oxygen to
produce 3.667 tonnes of CO2.
4. Each tonne of Australia‘s bituminous coal will contain around 700 kgs of carbon (70% C content)
when measured from an Ultimate (elemental) Analysis of C, H, O and N and reported on a dry basis.
Assuming that the coal has a total moisture content of 12%, the carbon content on an as received
basis would be closer to 620 kgs per tonne of bituminous coal.
5. Each tonne of coal burned would therefore generate 2.26 tonnes of CO2.
6. A cost of CO2 abatement of $60 per tonne therefore translates into an equivalent coal price adder of
$135.60 per tonne of CO2 abated. (Coal Price Adder = $60/tonne CO2 abated x 2.26 tonnes
CO2/tonne of coal = $135.60/tonne of coal) Source: Author‘s calculations using standard CO2
estimation methods. 268
WorleyParson Services Pty Ltd, ―Ëconomic Assessment of Carbon Capture and Storage Technologies, 2011
Update‖(report funded by the Global CCS Institute), 2011. 269
Ibid, p.7. 270
Ibid, p.11
Page 120
28 March 2011 120 PESD WP #101
Table 10 shows for a coal-fired power plant located in Conesville, Indiana, the cost and
technical performance impacts of retrofitting that power plant with an MEA-based
CCS. Oxyfuel and other early-stage CO2 abatement technologies would have even
worse cost and performance implications.
Table 11 provides a summary of the cost implications of applying CCS as reported by
the IEA, McKinsey, Harvard University and Worley Parson.271
Table 11: CCS Technology: Potential versus Risks
Potential The Risks
1. Cost of CCS can be defrayed by
putting CO2 to productive use:
– enhanced oil recovery (EOR)
– producing biomass (microalgae)
– making cement
Markets that reuse CO2:
– are limited in size (EOR)
– require low or zero cost CO2
– must rely on uncompetitive and
unproven technologies (algae, cement,
oxy-fuel and MEA extraction)
2. New technologies will soon lower
CCS costs and improve the efficiency
of the carbon capture process.
New CCS systems are still in the early test
phase.
3. Up to 90% CO2 can be captured from
existing power plants.
90% CO2 capture as a retrofit technology
comes at very high price. The retrofitted
CO2 extraction plant would
– reduce power plant output by 10% and
efficiency by ~ 30%
– require extra capital costs ranging from
$1,319/kW to $1,649/kW
– increase the price of power by at least
60%
4. Captured CO2 can be safely Distance of such reservoirs from power
271
See IEA, ―CO2 Capture and Storage: A Key Carbon Abatement Option‖, 2008; Al-Juaied, Mohammed, and
Adam Whitmore, ―Realistic Costs of Carbon Capture,‖ Belfer Center for Science and International Affairs,
Harvard Kennedy School, Harvard University, July 2009;McKinsey & Company ―Carbon Capture and
Storage: Assessing the Economics‖ (undated), and Worley Parsons Pty Ltd., ―Economic Assessment of
Carbon Capture and Storage Technologies, 2011 Update (funded and issued by Global CCS Institute).
Page 121
28 March 2011 121 PESD WP #101
sequestered for hundreds, if not
thousands, of years, in saline
formations and depleted oil wells.
plant sites will limit applications.
No long-term studies to confirm that CO2
will be permanently sequestered.
5. Transport and injection technology
will be well-understood and
commercial.
Private companies unlikely to take ―long-
term sequestration risk‖ without some form
of government-backed indemnity.
Table 12: Impact of MEA Carbon Capture System w/90 Percent CO2 Capture on Cost
and Technical Performance of an Existing Coal–Fired Power Plant2
Performance Parameter 2001
Technology
2006
Technology
Future
Technology
No
CCS
Solvent Regeneration Energy
(Btu/bm-CO2) 2350 1550 1200 n/a
New Plant Output (MW) 303 365 384 434
New Plant Efficiency (%) 20.2 24.4 25.7 35.0
Incremental Capex ($/kW) $2,748 -
$3,435
$1,319 -
$1,649 $1,279 - $ 1,600 n/a
Increase in LCOE due to
CCS1
(c/kWh) 12.54 6.92 6.32 n/a
Cost of CO2 Abated
(US$/tonne) $127 $89 $85 n/a
Cost of CO2 Capture $84 $59 $56 n/a
1. New Coal-Fired Power Plant assumed to have levelized cost of electricity (LCOE) of 6.4
c/kWh
2. AEP Conesville (Ind.) #5 Unit used as case study
Source: NETL ―Carbon Dioxide Capture from Existing Coal-Fired Power Plants: Final Report‖ November
2007.
Page 122
28 March 2011 122 PESD WP #101
Table 13: Recent Cost Estimates for CO2 Abatement Using CCS (supercritical PC plant)
IEA ,CO2 Capture and Storage: A Key
Carbon Abatement Option, 2008
Harvard/McKinsey/Global CCS
Institute Studies
Demo Plants (2010)
• $60-75/t CO2 abated
• ↑ in Electricity Price - $0.08 -$0.10/kWh
(2008 prices)
Competitive Commercial Scale Plants
(2030+)
• $55 -65/t CO2 abated
• ↑ in Electricity Price (2030-50/ Blue Map
Scenario)
– Average ↑ 90%
– Range ↑ 65 - 163%
Demo (Power) Plants (2010-2020)
• $80 - 120/t CO2 abated (McKinsey)
• $120 - $180/t CO2 abated (Harvard)
• $47 -$81/t CO2 abated (GCCSI)
• ↑ in Electricity Price - $0.08 -
$0.10/kWh (Harvard, 2008 prices)
• In Electricity Price -$0.05 -
$0.06/kWh (GCCSI 2010 Prices)
Competitive Commercial Scale Plants
(2020+)
• $40 – 60/t CO2 abated (McKinsey)
• $35 – 70/t CO2 abated (Harvard)
• $44 – 78/t CO2 abated (GCCSI)
• ↑ Electricity Price- $0.02 $0.05/
kWh (Harvard, 2008 prices)
• ↑ Electricity Price- $0.04- $0.05/
kWh (GCCSI, 2010 prices)
Unless an unexpected CCS technology breakthrough occurs, any government that chooses to
rely on CCS to address its CO2emission problem is, in this author‘s view, exposing its
economy to high technical and economic risks. Due to the high risks and costs associated with
CCS, other technology opportunities are likely to gain market share as alternatives. Several
sustainable alternatives are discussed in the following two sections.
Page 123
28 March 2011 123 PESD WP #101
4.2 CBM as an Alternative to CCS
Coal bed methane (CBM)272
could provide a cost-effective alternative to CCS by serving as the
low carbon fuel for new power plants that will be built as Australia‘s aging coal-fired power
plants are retired.273
In addition to its lower GHG impacts, CBM, along with UCG, has the
potential to diversify the ownership and broaden the structure of Australia‘s coal industry as
well as the mix of energy products that it offers to its customers.
4.2.1 CBM Resources of Queensland and NSW
The states of Queensland, NSW, and South Australia contain huge untapped reservoirs of
CBM. Commercial production of CBM is a relatively recent development in Australia, which
did not reach a significant scale until 2005.274
Since then, the rate at which new proved +
probable (2P) reserves are being booked and production is being ramped up has been
breathtaking.275
With respect to 2P reserves, most CBM reserves have been ―booked‖ in Queensland, which at
the end of June 30, 2009, were estimated to be 18,289 PJ, a 160 percent increase over the level
of 2P reserves reported at the end of calendar year 2007 (7,052 PJ).276
Queensland currently
272
Coal Bed Methane (CBM), also known as coal seam gas or CSG in Australia, refers to methane that has been
adsorbed in a near-liquid state inside the pores and fractures or cleats of the ―solid matrix‖ of unmined coal.
The size of a particular CBM source depends on (a) the rank of the coal as measured by its vitrinite
reflectance number (a VN# of 0.8 percent to 1.5 percent suggests a high CBM potential); (b) fracture
permeability, which is dependent on the types and extent of fractures or cleats in the coal seams; (c) porosity
of the coal bed reservoir, which is usually very low, ranging from 0.1 percent to 10 percent; and (d)
adsorption capacity, defined as the volume of gas adsorbed per unit mass of coal usually expressed in SCF
CBM/tonne of coal. 273
CBM is 90% methane and has a carbon content roughly one half of coal and one third lower than diesel and
other petroleum products. 274
In February 1996, BHP Pty., Ltd. attempted the first commercial coal mine methane (CMM) operation
commenced at the Moura mine in Queensland as part of a methane drainage project. In the same year, BHP
also implemented CMM projects at its Appin and Tower underground mines with the collected CMM used to
fuel on-site power generators. The first stand-alone commercial production of CBM in Australia commenced
in December 1996 at the Dawson Valley project, which was then owned by Conoco, adjoining the Moura
coal mine. 275
Proved and probable reserves with a 50 percent probability that the gas can be economically recovered
(http://www.dip.qld.gov.au/resources/factsheet/lng/lng-reserves-and-resources.pdf). 276
Queensland Government, Department of Mines and Energy: ―Queensland‘s coal seam gas overview: April
2010 (www.dme.qld.gov.au/zone_file_pdf/new_csg_cc.pdf).
Page 124
28 March 2011 124 PESD WP #101
accounts for 94 percent of Australia‘s 2P CBM reserves (7,050 PJ) and 96 percent of its 2008
CBM production (138.5PJ). The remaining 450 PJ of 2P reserves were located in NSW.
The growth in the Queensland‘s 2P CBM reserves has been astonishing when one considers
that they stood at 4,640 PJ at the end of 2005 and were probably close to nil in 2004.
Geoscience Australia estimated the life of the 2008 2P CBM reserves at 115 years at the 2008
extraction rate of 138.5 PJ. Geoscience Australia estimates that CBM met 80 percent of
Queensland 2008 gas requirements. The industry is growing so fast that one cannot keep up
with the new levels of record production, reserves, and mega-LNG projects that CBM
companies such as Arrow Energy, Santos, and others are announcing each week in
Queensland.
4.2.2 Role of Improved Drilling and Seismic Technology
Advances in general exploration and drilling know-how have contributed greatly to the growth
of Australia‘s budding CBM industry. With respect to improvements in the areas of
exploration and drilling methods, most of them would be characterized as mundane, if not
pedestrian sounding, improvements in technical expertise for developing the CBM resources.
Specific know-how improvements include the following:
Improved ability to interpret seismic and core sample data and in particular to
determine where the ―CBM fairways‖ are located and their likely productivity
Greater expertise in drilling horizontal directional wells (HDD), which is constantly
improving as the base of experienced drillers grows and as greater experience is gained
in specific basins
Advances in technology that contributed to the growth in Australia‘s CBM production include
improved down-hole drilling motors, known as mud motors because they are driven by
the hydraulic force of the drilling mud being pumped through the drill pipe and through
the motor, which allows the bit to be rotated at the bottom of the hole while the drill
pipe remains stationary; and
improved ―in-hole‖ measurement devices that allow directional data to be sent back by
telemetry and for the drill bit and the drilling motor to be guided electronically.
Page 125
28 March 2011 125 PESD WP #101
The end result is that in-seam HDD wells are being drilled more quickly and more accurately
than ever before. As drilling companies and their field teams gain more experience working
with the geological conditions of specific coal basins, the cost of drilling each well is expected
to drop over the next five to six years.
The proactive involvement of the Queensland government in resolving overlapping claims has
also contributed to the rapid growth of the CBM industry in Queensland. These issues were
largely resolved under the Petroleum and Gas (Production and Safety) Act of 2004 and related
amendments that were made to the Mineral Resources Act of 1989 and subsequent guidelines
on ―coordination agreements‖ that should be considered by parties to an overlapping claim
dispute. In addition, the holder of a petroleum license (PL) was provided a more favorable
priority over the holder of a mining license (ML) in any dispute resolution proceeding, if the
two parties cannot reach an agreement on their own. The new and booming CBM industry that
has developed in Queensland appears to be finally spreading to the state of NSW, where CBM
projects languished due to a lack of government initiative to resolve problems related to
overlapping claims to the same tenement.277
4.2.3 Case Study for Arrow/Dart Energy
Up-to-date (January 2011), industry-wide data on CBM reserves and production are not
available from either the Queensland or NSW governments. Nonetheless, a good picture of the
ongoing, torrid pace of CBM development of Queensland‘s CBM industry can be obtained by
examining the public documents of Dart Energy, which was until 2010 known as Arrow
Energy.278
Dart Energy is currently Australia's largest holder of coal seam gas acreage with
interests in more than 65,000 km2 of resource area. As of June 2010, Dart Energy was
supplying 20 percent of Queensland‘s gas production.
277
NSW has yet to amend its Petroleum Act to provide the same level of clarity and this may be one of the main
reasons for the delay in the development of its CBM industry. Queensland, on the other hand, implemented a
transparent process for resolving disputes that might occur between a mining company with a claim to
specific coal mining claim to a tenement and an independent CBM company that wishes to develop that sane
tenement under a petroleum exploration and development license. The process is enshrined in the Petroleum
and Gas (Production and Safety) Act 2004 (P&G 2004) and supporting amendments to the Mineral Resources
Act of 1989. In addition, Queensland‘s Department of Mines and Energy issued draft guidelines describing
different types of coordination agreements that disputing parties should discuss among themselves before
asking the minister to intervene and decide among the warring parties. Finally, the P&G 2004 gave to the
holder of the petroleum license (PL) a ―preferred‖ position in any dispute resolution proceeding over the
holder of a mining license (ML). 278
In August 2010, Shell Oil Company, which was Arrow Energy‘s largest shareholder, and PetroChina
purchased the remaining shares of Arrow Energy for A$4.70 per share, which was reported to be a 35 percent
premium over the weighted average share price one month prior to the initial offer. It also involved existing
shareholders receiving one Dart Energy share for every two Arrow Energy shares. Once the deal was closed,
Shell and Petro China renamed Arrow Energy as Dart Energy.
Page 126
28 March 2011 126 PESD WP #101
Arrow Energy went public in August 2000 with an IPO that netted it a mere A$5 million. By
August 2009, Arrow had a market capitalization of A$2.4 billion. What makes this growth in
value even more impressive is that Arrow did not achieve its first production (and sale) of
CBM until January 2006, when it brought its Kogan North CBM field into commercial
operation. Despite the worldwide financial crisis, FY 2009 was another bumper year for Arrow
Energy. In September 2009, the company announced plans to supply 55 PJ/y of CBM to the
first train of a 2 x 1.5 mtpa LNG facility at Fisherman‘s Landing within the Port of Gladstone.
The first train of the facility is expected to become operational by 2012. Toyota Tsusho has
already signed a heads of agreement to buy the full output from the first train of the LNG plant.
Arrow, prior to its acquisition by Shell and Petro China, had also announced plans for a
drilling program to confirm 2P reserves sufficient to support a second LNG plant that will be
constructed by Shell at the Port of Gladstone.
Table 12 shows Arrow Energy‘s extraordinary growth in both reserves and gas output from
2006 through February 2009. In fewer than two calendar years, Arrow increased its gross 2P
reserves by 375 percent from 719 PJ at the end of FY 2006/2007 (meaning June 30, 2007) to
2,692 PJ by the end of February 2009. It has also expanded production from 10.4 PJ at the end
of FY2006/2007 to 28.6 PJ by the end of FY 2007/08, a 275 percent increase over a period of
only one year. Production and 2P reserves would be at even higher levels if only domestic
markets were sufficient to take any increased production.
As a result of domestic market constraints, Dart will sell its gas to a 2 x 1.5 mtpa LNG facility
at the Port of Gladstone with an expected commercial operation date of April 2012. Detailed
information on CBM reserves and production was not available from the public filings of other
large CBM producers such as Origin Energy, Queensland Gas, and Santos. But the story would
probably be the same — extraordinary levels of growth over a relatively short period of time.
More than 90 percent of Dart's acreage was still to be certified as of June 30, 2010, which
means that these reserve figures are destined to grow even larger over time.
Page 127
28 March 2011 127 PESD WP #101
Table 14: Growth in Dart’s CBM Resources, Reserves, and Production, FYs 2006-2009
FY 2005/06
FY 2006/07 FY 2007/08 FY 2008/09 FY 2009/10
FY
2005/06
June 30,
2006
FY
2007/08
June 30,
2007
FY
2007/08
June 30,
2008
FY
2008/09
June 30,
2009
FY
2009/10
(@ 12/09)
Dec 30,
2009
Reserves (in PJ)
1P (Proved) 25 86 427 703 808
2P (Proved+Probable) 166 716 2,247 4,092 6,150
3P
(Proved+Probable+Possible)
2,148
2,760
5,084
9,312 11,042
Production (in PJ) 1.0 10.4 28.6 32.4
38.8
(annualized
result)Ω
Producing Wells
50 243 281 n/a n/a
Sources: Arrow Energy, ―Annual Reports for FY 2006 through 2008‖ and ―Half-Year Financial Statements FY 2010 (issued February 17, 2010)‖ for FY 2009/2010.
Ω Production estimate for FY 2009/2010 = two times the half-year result. This is a very conservative estimate but even if it should come to pass, it would still represent a 20
percent increase over the previous FY.
Page 128
28 March 2011 128 PESD WP #101
4.2.4 Environmental Impacts of CBM Development
The most significant environmental impact caused by CBM wells is from the associated water
that is pumped out the well in order to start and later maintain production. Due to the high
concentrations of dissolved solids in the associated CBM water, if not properly handled, the
associated water could pollute surface water and even nearby sub-surface groundwater.
Removing the water cap from above the coal seams may also depress aquifers over a large area
and affect groundwater flows.
In Queensland, water produced during CBM production was, until 2009, pumped into large
ponds and allowed to evaporate.279
On May 14, 2009, the government of Queensland issued a set
of rules and procedures that put a stop to this practice.280
The rationale for its decision was
ironically the success of the CBM industry. In 2007, CBM companies produced 12.5 gigaliters
(GL) of associated water, which was already a significant quantity of waste water. However,
once the Surat Basin CBM deposits are developed, the government of Queensland estimates that
the quantity of associated water will reach 25 GL per year for the next 25 years. This associated
water forecast does not take into account the recent attempts by CBM manufacturers to develop
CBM resources to supply to LNG facilities at the Port of Gladstone, which will add to the
associated water production estimate.
The government of Queensland estimated in 2009 that, if it allowed the practice of CBM
associated water being stored in open ponds to continue, 25 km2 of land would be required to
hold the estimated 25 GL per year of water produced by the CBM industry.281
This estimate,
which assumed the waste water was held in two-meter deep evaporation ponds, did not include
an allowance for land, which must be used for managing safety, maintaining the ponds, and
allowing for catchment of rainfall. If CBM producers were successful in developing their LNG
export business using CBM, associated water production would have increased to levels of up to
100 GL per year, which would require a minimum of 100 km2 of land area to be dedicated to
279
Because the associated water contains high levels of dissolved solids, such as sodium bicarbonate and chloride,
it is not suitable for either human or animal consumption. 280
Queensland Government: ―Management of Water Produced from Coal Seam Gas Production: Discussion
Paper,‖ May 2009 (available through www.dip.qld.gov.au). 281
Ibid.
Page 129
28 March 2011 129 PESD WP #101
evaporation ponds over the next 30 years. It will also produce over time 7.5 million tonnes of dry
salts from the saline effluent.282
As a result of these findings, the government of Queensland disallowed the use of evaporation
ponds as a means of disposing of CBM-associated water. If the water was not re-injected into the
ground in an environmentally sound manner or if it could not be put to some beneficial use,
CBM producers now needed, at their expense, to treat the associated CBM water and dispose of
any saline effluent (if such effluent has a saline content greater than 10,000 TDS) ―to a standard
defined by [Australia‘s] Environmental Protection Agency.‖283
CBM producers with existing
evaporation ponds are required to remediate these ponds within three years from May 2009.
Recently, a number of gas companies have commenced operating water treatment plants to treat
the water to a point that it is safe enough for discharge into streams. In a few cases, the CBM
companies have initiated water treatment projects that allow the water to be used as a source of
domestic water supply and/or as cooling water for power stations. In these cases, the CBM
companies have applied reverse osmosis to treat the product water.
4.3 Underground Coal Gasification
Underground coal gasification (UCG) refers to an in situ process for converting coal into a
synthetic gas through partial oxidation. Once the coal is partially oxidized, the resulting gas is
then extracted from the underground ―gasifier,‖ cleaned of particulates, water, tars, and other
impurities, and sold as either a power plant fuel or as a feedstock to the chemical industry for the
production of ammonia, methanol, and other chemicals. UCG has four main attractive properties:
It uses coals that are stranded, i.e., located below economic basement for either open-cut
or underground mining.
It achieves much greater energy removal rates than standard mining methods by a factor
of 15 and even greater energy removal rates when compared with CBM.
It leaves ash and unburned carbon in the ground.
282
Ibid. 283
Ibid.
Page 130
28 March 2011 130 PESD WP #101
It eliminates the cost of mining the coal and investing in an aboveground gasifier and
water shift reactor.
UCG technology might allow the economic recovery of CO2 using CCS technology due to the
highly concentrated streams of CO2 contained in the syngas produced by a UCG facility. Passing
concentrated streams of CO2 through CCS capture facilities will allow less costly capture
technologies to be used in association with UCG plants.
The first commercial-scale UCG facility was implemented in Uzbekistan in 1960, when it was
still part of the former Soviet Union. For almost 50 years, the Uzbekistan project has been the
single, largest semi-commercial-demonstration of UCG technology in the world. UCG became a
subject of interest in Australia in the late 1970s after the second oil shock of 1978. Based on U.S.
interest in synthetic fuels, a number of Australian university professors started to track
development of UCG technology in the United States. The leading proponent of UCG
technology through the 1980s was a professor from the University of New South Wales named
Ian Smith.
Professor Smith pushed for government support of UCG technology in the late 1970s. He was
rewarded with contracts from the governments of NSW and South Australia to study the
feasibility of developing a UCG demonstration program. In 1984, Smith issued his report to the
government of New South Wales titled ―In Situ Gasification of Coal for Australia‖. In that
report, he concluded the following:
UCG was a proven technology.
Its successful application in Australia could lead to the development of a cost-competitive
synthetic fuels industry in Australia and export of the technology worldwide.
In 1984, Smith tried to take his advocacy a step further by recommending in his report to the
government of South Australia that it utilize UCG technology at the existing Leigh Creek coal
mine to produce gas for a power plant. He concluded in his engineering feasibility study that the
cost of producing power from synthetic gas produced by the UCG process was economically
competitive against the price of power from a conventional coal-fired power plant. However, at
Page 131
28 March 2011 131 PESD WP #101
the time Smith issued his reports, world oil prices were starting their steep, two-decade-long
decline and all interest in the UCG concept was lost. Both governments refused to fund further
research into UCG technology.
4.3.1 Linc Energy
From 1984 until around 1996, UCG was largely relegated to the back burner. In 1996, interest in
UCG remerged with the establishment of Linc Energy by Len Walker, one of Ian Smith‘s
students who worked on the Leigh Creek feasibility study in 1984.284
In 1996, Walker convinced
investors to fund the establishment of Linc Energy, for which he served as CEO until 2002.
During his six-year tenure, he established an association with Ergo Energy Technologies of
Montreal (Ergo), at that time a UCG technology leader.
The two companies obtained private and government funding to conduct a test burn using Ergo‘s
UCG technology at Linc Energy‘s test site in the Surat Basin near the town of Chinchilla.285
The
test burn, which was successfully conducted over a three-year period (1999-2002), was the first
extended UCG demonstration outside of the former Soviet Union. It gasified 35,000 tonnes of
coal without violating any of its environmental clearances. Although the test burn was a
technical success, due to the low oil prices of that time Linc was unable to obtain additional
funding for taking the project to commercial scale. It therefore needed to decommission the test
facility in 2002 and in that same year, Walker left Linc Energy to pursue other interests.
The company was later acquired by Australian entrepreneur Peter Bond, who took the company
public on the ASX in October 2006. He also dropped the company‘s association with Ergo
Energy Technologies and acquired the Uzbeki company that developed the first commercial
UCG project. Finally, he has shifted Linc‘s focus from using UCG-produced syngas for power
production to the production of liquid fuels. A picture of the demonstration gas to liquids plant is
shown in Figure 32.
284
Between 1989 and 1996, Walker completed a series of self-funded UCG-to-power studies, which convinced
him of the technical feasibility and economic potentials for UCG in Australia. 285
Ergo Exergy‘s technology was a variation on the theme of the former Soviet Union technology applied in
Uzbekistan.
Page 132
28 March 2011 132 PESD WP #101
Figure 32: Linc Energy GTL Plant in Chinchilla
Source: http://www.lincenergy.com/
4.3.2 Carbon Energy
Carbon Energy, which is also listed on the ASX, trades under the symbol CNX. Prior to June 23,
2008, Carbon Energy was named Coal Gas Corporation, which was a fifty-fifty joint venture
between Metex Resources Ltd. (Metex), a mining company that specialized in the development
of gold deposits, and CSIRO, the Australian government research organization that held the
rights and the title to special UCG technology, as well as various licenses to operate that
technology.286
Carbon Energy in early 2008 became a 100-percent-owned subsidiary of Metex,
with CSIRO holding its prior ownership in CGC in Metex. In June 2008, the company name was
changed from Metex to Carbon Energy.
Carbon Energy‘s UCG technology is known as controlled retraction injection point (CRIP),
which the U.S. DOE successfully demonstrated at its Rocky Mountain test facility in Colorado in
286
http://www.carbonenergy.com.au/index.php/about-us/history.
Page 133
28 March 2011 133 PESD WP #101
1988.287
CSIRO made various improvements to this system, obtained patents to the technology,
and sold the rights to the technology to Metex.
The Carbon Energy UCG technology differs significantly from the systems being applied by
Linc and another competitor named Cougar. Specific differences are as follows:
(a) injection of oxygen rather than air into the gasification chamber or cavity, which allows
for higher levels of methane production and lower NOx emissions;
(b) use of horizontal directional drilling, rather than vertical wells, to position inlet and outlet
pipelines into the coal seams to be gasified;
(c) adoption of the CRIP system to achieve continuous retraction of the inlet and outlet pipes
during the gasification process; and
(d) application of advanced geological models and simulation tools for designing the UCG
modules and then monitoring their performance.
Carbon Energy claims that its application of these advanced technologies and methods allows for
finer control of the in situ gasification process and therefore the production of better quality gas
and control of any environmental impacts.
Between December 2008 and April 2009, Carbon Energy successfully demonstrated the
technical feasibility of its CRIP UCG process at its Bloodworth Creek demonstration site.288
The
facility design was based upon the U.S. DOE experience at its RM-1 demonstration facility
during the 1980s. Carbon Energy claims that improvements it has made to the U.S. DOE CRIP
system have moved the technology ―from an experimental stage to commercial reality.‖
The trial was performed using a UCG module that was sized to generate 1 PJ (petajoule) per year
of syngas with a three-year module life, which was sufficient to fire a 20 MW combined-cycle
287
The ―CRIP‖ system involves the use of direction drilling to create a channel that connects the production well to
the injection well. A gasification cavity forms at the end of the injection well in the horizontal section of the
coal seam. Once the coal in the cavity area is expended, the injection point is withdrawn (usually by burning a
section of the liner) and a new gasification cavity is initiated. (Clean Air Task Force, ―Coal Without Carbon: An
Investment Plan for Federal Action: Expert Reports on Research, Development, and Demonstration for
Affordable Carbon Capture and Sequestration,‖ September 2009). 288
Carbon Energy holds mining leases in the Surat Basin at a location called Bloodworth, which is located 55 km
west of Dalby in southeast Queensland. The Bloodworth site reportedly contains more than 600 mt of JORC-
certified resources.
Page 134
28 March 2011 134 PESD WP #101
gas-turbine power plant. The 100-day field trial demonstrated that the Carbon Energy process
could produce a sustainable supply of syngas of consistent quality without causing unacceptable
environmental impacts.
At the end of the trial, the module, now known as UCG Panel 1, was placed on standby mode
while surface facilities for commercial production were put in place. The plan was to restart the
UCG Panel 1 and use the gas to fire a 5x1 reciprocating engine power plant by January 2010.
However this scheduled date for restarting syngas production from Panel 1 was recently
rescheduled due to a delay in completing remediation work on the injection well to Panel 1,
which became blocked toward the end of the demonstration project. Carbon Energy has not
provided a firm date for restarting Panel 1 but as a contingency has proceeded with the design
and construction of Panel 2 in case its remediation efforts on Panel 1 are unsuccessful.289
In December 2009, Carbon Energy provided estimates of independent gas reserve at its
Bloodworth Creek test site based on Society of Petroleum Engineers guidelines for converting
coal into syngas for two of the tenements that form part of theBloodworth Creek site. The
reserves as of December 2009 are as follows:
(a) 1P Reserve (Proven) 11.0 PJ
(b) 2P Reserve (Proven + Probable) 743.9 PJ
(c) 3P Reserve (Proven + Probable + Possible) 1,042.8 PJ
The reserve certificate includes those resources that are contained within 20 percent of the area
covered by Carbon Energy‘s mining development license issued for the Bloodworth Creek area.
It expects the 2P reserve estimates to increase over the next few years as more exploratory
drilling is completed in the area.
Earlier in 2008, Carbon Energy executed a memorandum of understanding (MOU) with Incitec
Pivot Ltd. (IPL), a manufacturer of ammonia and ammonia-based derivatives. The MOU states
289
Carbon Energy, ―ASX Announcement: Australia‘s First UCG Syngas Power Station - Commissioning Update,‖
March 3, 2010.
Page 135
28 March 2011 135 PESD WP #101
that both companies intend to form a joint venture company upon the successful conclusion of
Carbon Energy‘s field trial at its Bloodworth site. The MOU also provides IPL with exclusive
global rights to the use of Carbon Energy‘s UCG technology for the manufacture of ammonia
and ammonia-derived products.
4.3.3 Cougar Energy
Cougar Energy Limited is a publicly listed Australian company that trades on the Australian
Stock Exchange (ASX) industrials board under the code CXY. Cougar Energy was established in
2006 by Len Walker, the original founder of Linc Energy. The technology being applied by
Cougar Energy is a variation of the old Soviet technology that is also being applied by Linc
Energy. Cougar Energy has a licensing agreement with Ergo Exergy Technologies of Canada for
the provision of Ergo Exergy‘s UCG technology to all UCG projects to be developed by Cougar
Energy Ltd.
Cougar attempted a UCG test burn project at its Kingaroy site in Queensland. The plan was to
use this site to develop a 400 MW power station with an initial capacity of 186 MW (gross).
Cougar attempted the UCG test burn in January 2010 at its Kingaroy site. Cougar‘s intention was
to use the test burn results as the basis for proceeding to the next stage of the project‘s
development —the preparation of a bank feasibility study and solicitation of bank financing.
Once funding was obtained, Cougar intended to commence construction of the power plant and a
commercial scale UCG facility. The Kingaroy site, which is located 10 km south of the township
of Kingaroy, was reported to contain a JORC-compliant resource of 73 million tonnes with two
primary seams at depths of 130 to 300 meters and having thicknesses of 5 to 17 meters, which
would have been sufficient to support the power plant project for 30 years.
Unfortunately, the test burn did not proceed in accordance with the terms of its environmental
permit. Very low levels of benzene and toluene were detected in groundwater samples taken
from test wells located next to the test burn site. Cougar was forced to shut down its test burn and
to conduct additional tests for benzene and toluene over the following four to six months.
According to Cougar, these new test results showed that the earlier test may have been transitory
readings, as new results showed benzene and toluene to be at undetectable levels. The
Page 136
28 March 2011 136 PESD WP #101
Queensland Department of Environmental Resource Management (DERM) is still considering
the most recent test results. Until a final DERM decision is made, the Cougar test burn site
remains on standby. In the meantime, Cougar has managed to obtain a sizable investment from a
Chinese resource company, which is interested in applying the UCG process followed by Cougar
at various Chinese coal sites.
Page 137
28 March 2011 137 PESD WP #101
5. Into the Future
At the beginning of the 1950s, there were many sceptics who felt that Australia‘s black coal
industry would never amount to much due to the actions of radical trade unions and the
competitive threat posed by cheap oil. However, the post-WWII history of Australia‘s black coal
industry has turned out to be a Cinderella story come true. The story of its recovery from a
threatened and declining industry in the early 1950s to the world‘s largest black coal exporter in
1984 is a phenomenal success story, especially when one considers the barriers to development
posed by Australia‘s radical trade unions prior to 1950 and cheap oil through the early 1970s.
One can cite many reasons why this successful transformation of the coal industry occurred. But
the foremost reason is undoubtedly the proactive steps taken by the state governments of NSW
and Queensland that either corrected past deficiencies of the industry (NSW) or implemented
policies that supported the cost-effective and timely new mining developments (Queensland).
These industry and government actions coupled with strong demand from Japan for high-quality
coking coal and, after 1978, for steam coal occurred during the rapid growth phase of the
industry, which lasted from 1960 to 1986.
The rebirth of Australia‘s black coal industry was also made possible by the following:
The discovery of vast deposits of high-quality coking and steam coals in the Bowen
Basin area of Queensland and the Hunter Valley area of NSW. It was also helpful that
many of these new deposits were amendable to open-cut mining and located within a
reasonable distance of deep sea ports.
The availability of advanced technologies for discovering these and other black coal
deposits and then mining them using either open-cut mining methods or advanced
underground mining methods. The aggressive application of these advanced technologies
led to huge increases in mine worker productivity and led to low-cost development of its
black coal resources.
The economic expansions of Korea and Taiwan (1980-1995) and the twin oil price
shocks of the 1970s, which created huge export markets for Australia‘s steam coal.
Page 138
28 March 2011 138 PESD WP #101
By the end of the 26-year rapid growth phase, Australia became not only the world‘s largest
black coal exporter, but also achieved a substantial diversification of its customer base and
product offerings with the following achievements:290
Exports in 1986 accounted for 69 percent of total sales compared with only 9 percent in
1960.
Steam coal supplied 48 percent of total exports in 1986, up from less than 1 percent in
1960.
Queensland emerged as Australia‘s largest exporter of black coal, jumping from 48,000
tonnes (less than 3 percent of total exports) in 1960 to 50.8 mt (57 percent of total
exports) in 1984.
Japan‘s share of total exports was reduced from 90 percent of total exports in 1960 to 45
percent in 1986.
During the industry‘s competitive phase (1987-2009), Australia‘s black coal industry
experienced a dramatic slowing in its annual rate of growth. This slowing in growth was mainly
due to supply-side factors such as the entry of Indonesia as a significant exporter of steam coal
and the inability of the governments of NSW and Queensland to increase their ports and railway
systems fast enough. This slowdown in the industry‘s rate of expansion affected both domestic
consumption and exports. The competitive phase was also a time when both Queensland and
NSW made significant changes to their regulatory frameworks, with Queensland first passing
into law its Mineral Resources Act of 1988. NSW followed with the Mining Act of 1992. During
the 1990s, the Commonwealth government lifted controls on export prices for coal (1993) and
started to discuss greenhouse gas issues as a serious public policy issue (1996).
With the move into the volatile price phase, Australia‘s black coal industry is positioned to
expand its market share but will need to implement more effective measures for dealing with the
many challenges that threaten its position as the world‘s largest black coal exporter.
290
Joint Coal Board, ―Black Coal in Australia, 1986-87,‖ Table 1, p. 5; Table 100, p. 97; and Table 101, p. 99; and
Annual Report of the Joint Coal Board, 1960-61, Table 10, p. 134.
Page 139
28 March 2011 139 PESD WP #101
5.1 Sufficient Reserves and Resources Exist
The states of NSW and Queensland have sufficient black coal resources, known as economic
demonstrated resources (EDRs) that will allow Australia to sustain its 2008 level of raw coal
production (438 million tonnes) for 90 years. Resources under development in the Galilee,
Gunnedah, and Surat basins by Hancock Coal, Syntech Resources, Waratah Coal, Xstrata, and
others will add to the impressive EDR totals and sustainable production period.
Coals from the three largely undeveloped basins of Galilee, Gunnedah, and Surat are mostly
steam coals and hence the share of steam coal in the overall mix of black coal exports is also
likely to grow significantly over the next two decades. If the two ―advanced-stage‖ Surat Basin
projects and the two Galilee Basin projects were to enter commercial operation on schedule,
Queensland could be producing an additional 110 mtpa of steam coal by 2015. To put this figure
in perspective, Australia exported 115 mt of steam coal in 2008.
5.2 But Infrastructure Constraints and Regulatory Uncertainty Are Delaying Expansion
Efforts
The most pressing and immediate technical challenge to the black coal industry of Australia is
the shortage of rail and port infrastructure to support its further growth. The governments of
Queensland and NSW have proposed projects for expanding their rail and port networks to
support a significant level of new black coal mining developments. If these proposed
infrastructure expansions were implemented according to their 2008 schedules, NSW and
Queensland could increase their combined exports of steam and coking coal from 240 million
tonnes in 2010 to close to 540 million tonnes by 2020.291
However, schedule adherence in today‘s planning and fiscal environments is highly unlikely for
either Queensland or NSW. Part of the reason that chronic infrastructure shortages are likely to
persist has to do with the type of technology being implemented — large rail and fixed land port
systems. In an attempt to maximize economies of scale for mining and transport projects, port
and rail expansion projects need to be very large in scale. This means that first costs for such
291
This estimate assumes that the rail and port infrastructure project outlined on Table 5 and Figure 21 proceed
according to schedule and that port capacity is used at 90 percent of its nameplate capacity.
Page 140
28 March 2011 140 PESD WP #101
projects are very high first costs, lead times are long, and regulatory clearances are complex. The
scale effects of these projects add to the sense of uncertainty and difficulty in implementing such
projects.
A second reason for the chronic shortage of infrastructure has been the reliance on state-owned
entities to make the necessary investments in the rail and port systems. Even though the
government-owned corporations have been established as for-profit corporations, they tended to
be less nimble and entrepreneurial in their decision-making processes than private-sector firms
and relied on monopoly profits and fees to compensate for their lack of competitiveness. Over
the past decade, Queensland and NSW have privatized both their port and the rail systems, which
may lessen in the future the importance of government-infrastructure ownership as a cause of
chronic shorts of rail and port infrastructure.
The recent decisions of the Queensland government to first postpone indefinitely the project to
implement the Northern Missing Link railway project and then to restart the project based on
industry complaints does not bode well for other projects to expand rail and port systems. Due to
a lack of commitment from QR to expand Abbot Point from 50 mt to 110 mt, Hancock and
Waratah Coal will need to invest in entirely new rail lines and coal terminals if they are to bring
their vast Galilee Basin resources to market. For these reasons, the current transport
infrastructure constraints are unlikely to be overcome any time soon.
Expansion of Australia‘s black coal industry is also clouded by the regulatory uncertainty that
has been created by the government of Australia‘s carbon pollution reduction scheme (CPRS)
and its 2011 proposal to implement as an interim measure a fixed carbon tax. A second source of
investor uncertainty is the proposed mineral resource rent tax (MRRT), which is the successor to
the ill-fated resource super profits tax (RSPT). The regulatory uncertainty that these proposals
have created continues to slow the decision-making processes of coal mining companies that are
interested in developing new coal resources and expanding existing mines and related transport
infrastructure in Australia.
Page 141
28 March 2011 141 PESD WP #101
Potential coal mining projects most at risk due to regulatory uncertainty are the massive, new
steam coal projects planned for the Galilee, Gunnedah, and Surat basins. Only time will tell how
the industry will eventually respond. But one can expect a slowdown in project decision making
if uncertainty increases about the status of either the CPRS or the MRRT proposals.
The CPRS has received a high level of political scrutiny over the past two years. Domestic sales
of steam coal are likely to suffer the greatest adverse impacts if Australia implements the interim
fixed carbon tax proposal before moving to a flexible cap and trade program as envisioned under
the CPRS. In the short term, the domestic users of steam coal most at risk under either a fixed
carbon tax or a flexible CPRS are the owners of brown coal power plants located primarily in
Victoria, which have the highest CO2 emission intensities of all power plants in Australia.
However, a number of other brown coal plants, such as the Millmerran and Callide plants in
Queensland, may also be adversely affected by these two GHG reduction measures, despite their
use of higher efficiency supercritical boiler technology. Nonetheless, the Victoria brown coal
plants, due to their age and high CO2 emission footprints, would be prime candidates for early
retirement. Some are already approaching 30 years old and nearing their retirement age.
Early retirement of the brown coal plants would not have an immediate adverse effect on the
black coal industry. On the contrary such an outcome might lead to higher dispatch for the
remaining coal-fired power plants that are fired on higher rank, steam coal.
However, over the long term, the impact on domestic sales of black coal will be substantial,
particularly if the price of CO2 emission permits were allowed to increase significantly over time.
The effect would be to discourage the building of new coal-fired power plants and to encourage
the development of new power plants based on natural gas and renewable energy resources. As
existing black coal power plants are retired, this domestic market would decline over time in
much the same way as the shipping and railway industries did in the 1960s.
The domestic power industry is a very significant market for black coal producers in NSW and
Queensland. In 2007, Australia‘s domestic market for steam coal was equal to 39 percent of
Australia‘s total steam coal sales, i.e., domestic plus export sales of steam coal, and 22 percent of
its total black coal sales. These figures exclude brown coal, which is not accounted for under
Page 142
28 March 2011 142 PESD WP #101
black coal statistics. Therefore, from the perspective of steam coal producers in NSW and
Queensland, the CPRS and its fixed carbon tax sibling may deprive them over time of a very
significant and lucrative market.
But the bigger concern for Australia‘s black coal producers must be with their export markets. If
the governments of North Asia (China, Japan, Korea, and Taiwan) were also to implement
aggressive GHG emission reduction programs that favored alternatives to coal and therefore
reduced coal demand growth, the impact on their core business could be devastating. NSW, with
its higher proportion of steam to coking coal than for Queensland, will experience greater near-
term impacts from any regional carbon tax and/or cap and trade programs. However, over time,
the effects would also be strongly felt in Queensland in the form of reduced investments in the
Galilee and Surat basins.
5.3 Limits to New Technology as an Tool for Reducing GHG Emissions
The coal and power industries, along with governments around the world, are looking for new
technologies to provide the solution to the greenhouse gas and climate change issues. Australia‘s
black coal industry has a long history of applying state-of-the-art mining and exploration
technologies and making them work in the Australian context. It can be expected that, given the
size of the economic stakes at risk, either Australia‘s black coal industry or new entities such as
CBM extraction companies and UCG production companies will find innovative solutions to the
issue of GHG emissions.
Although there is a comforting, if not compelling, story to be told of a resourceful and adaptive
industry that finds technical as well as political solutions to its problems, it would be naive to
assume that history will automatically repeat itself this time around, especially if one assumes
that new technology is the main option for future expansion of Australia‘s black coal industry.
Technologies for removing CO2 on a post-combustion basis are extremely expensive and their
application at new coal-fired power plants will over time lead to a substantial reduction in
demand for steam coal by making substitute generation technologies more competitive. Their
application will also lead to a reduced ―net back price‖ being paid to Australia‘s steam coal
producers as coal producers will only be able to pass through to its customers a portion of the
Page 143
28 March 2011 143 PESD WP #101
additional costs for CCS. To retain customers, coal producers will face one of two alternatives:
(1) lower their prices or (2) reduce their production capacity. Most likely, producers will need to
do a little bit of both: lower their prices and reduce output. High capital and operating costs of
CCS system are not the only constraint. Widespread public opposition to CO2 storage, even in
rural areas, is starting to emerge in both Europe and the United States and is already leading to
project cancellations For example, in Europe the Vattenfall Schwarze Pump project (Germany),
which was a small 30 MW demonstration of the Oxyfuel process was not able to store the CO2
underground due to strong local opposition.292
A second example of local opposition derailing a
mature CCS project was Shell‘s Barendrecht CCS project in the Netherlands, which was recently
cancelled due to local opposition to sequestering CO2 deep underground but directly beneath
their communities.293
Assuming that global regulation of GHGs will only increase over time, unless a major
technological breakthrough occurs in the area of CCS, the economics of burning coal in its
current solid, high-carbon content form will undoubtedly become less economically attractive
over the next two decades in regions that adopt regulation. Betting on a major breakthrough in
either pre- or post-combustion carbon capture technology appears to require governments
worldwide to assume an extremely high level of technical and economic risk.
Those technologies that offer the greatest near-term application—CBM and UCG—will most
likely lead to a significant diversification of Australia‘s black coal industry from one that is
currently focused on extracting and selling high carbon solid fuels to one that also extracts and
markets gaseous and perhaps liquid fuels with substantially reduced carbon contents.
Both UCG and CBM producers have the benefit of producing their energy products from coal
resources that are at depths that are uneconomic to mine via underground mining methods. This
292
Stina Rydberg, ―Experience from Schwarze Pumpe‖(Power Point presentation dated 2010-11-11 and available
online at http://www.vtt.fi/files/projects/ccsfinland/seminaari2010/09-rydberg.pdf) 293
Carbon Capture Journal ―Shell Barendrecht project cancelled‖ (article dated November 05 2010 and available at
http://www.carboncapturejournal.com/displaynews.php?NewsID=676); Also see: Fred Pals, ―Barendrechters
Stand Up to Shell‘s Plan to Bury Co2‖, Bloomberg, April 2009
(http://www.bloomberg.com/apps/news?pid=newsarchive&sid=apxoWWj1cCh0) Richard, I would appreciate
your kind offer of help to find a few other appropriate citations
Page 144
28 March 2011 144 PESD WP #101
feature of both technologies will limit competition between traditional coal producers and CBM
and UCG producers. Except for the water disposal issues created by CBM production and the
CO2 emissions from the UCG process, both technologies have a very small aboveground
footprint when compared with open-cut mining methods and their visual impacts are minimal.
From the standpoint of resource conservation and land use environmental impacts, both
technologies appear to offer significant environmental advantages over traditional production of
solid fuels.
UCG allows the in situ conversion of solid coal into a synthetic gas that can be used for power
production or the production of petrochemicals and, in particular, ammonia-based petrochemical
products such as fertilizers and explosives. When compared with CBM or even the most efficient
open-cut mining methods, UCG allows much greater densities of energy extraction from
underground coal resources. Finally, it maintains the ash and unburned carbon and other residues
deep below ground.
However, for UCG to be successful, improvements appear necessary in two supporting
technologies:
(a) Carbon capture and sequestration: In situ gasification produces the same level of CO2 as
a coal-fired power plant but at much higher levels of concentration in the gas stream.
Ironically, UCG may be the catalyst for development of a small but economically viable
CCS industry, which relies on gas streams containing CO2 concentrations of 50 percent
or more, not the highly dilute CO2 concentrations of less than 15 percent found in most
power plant flue gases. In order for that to happen, improved technologies for capturing
the highly concentrated CO2 as it exits with the syngas from the extraction well are
urgently required.
(b) Air separation plants: Oxygen-blown UCG has a number of advantages over the use of
air. It allows the production of higher concentrations of CO2, H2 and CH4, and less CO
in the production gas. It also minimizes the formation of NOx during the gasification
process. But existing air separation technology is capital intensive and expensive to
operate. If significant improvements can be made to the efficiency of such plants and in
Page 145
28 March 2011 145 PESD WP #101
particular to the compressors used to extract oxygen from the air, this breakthrough
could tip the balance toward UCG processes that use oxygen instead of air to produce
their energy products.
UCG‘s success will also be dependent on government regulations that encourage, if not require,
―peaceful coexistence‖ between CBM and UCG proponents.
In the case of CBM and Australia, a vibrant CBM industry exists today, which, over the next two
decades, should lead to a significant reduction in the carbon footprint of Australia‘s power
sector. The CBM extraction industry of Queensland is already providing competitively priced
methane as an alternative to solid steam coal. Since methane has 50 percent less carbon than
methane, over time, if Australia‘s existing coal-fired plants are retired and replaced by new
combined cycle gas turbine (CCGT) power plants fired on CBM, this replacement program
would lead to a significant and progressive reduction in the carbon emissions of Australia‘s
power sector. This coal-to-CBM transition is already occurring in the states of Queensland and
NSW. Substituting CBM-fired plants for new coal-fired plants is likely to lead to the same
reduction in GHG emissions as a CCS program that requires a 50 percent CO2 removal target for
each newly built power plant —but at a far lower cost and risk of failure.
5.4 Alternative Futures
Given this uncertain industry outlook and in particular the uncertainties concerning cap-and-
trade CO2 emission programs and new technology, it is not possible to suggest a single future for
Australia‘s black coal industry. Instead, Australia‘s black coal industry faces the prospect of
confronting at least one of two opposing futures:
1. A ―business as usual‖ (BAU) scenario, which assumes (a) weak actions by Asian
governments to reduce GHG emissions, (b) only minor improvements in CCS, UCG, and
other technologies for reducing GHG emissions, and (c) the governments of NSW and
Queensland continuing to play their traditional roles of supplying transportation
infrastructure to the black coal industry
Page 146
28 March 2011 146 PESD WP #101
2. An aggressive GHG reduction scenario that assumes strong GHG emissions standards
and implementation by Asian governments of cap-and-trade policies coupled with
significant technological breakthroughs for CSS and UCG
Under the BAU scenario, one can expect coal producers to continue delivering energy from coal
almost exclusively in solid form using existing rail and port networks expanded to meet their
increased production. CBM and UCG projects will be developed at a much slower pace than
would occur under an aggressive GHG reduction scenario. But growth in the production of CBM
would continue and further development of the UCG industry should also continue, due to the
significantly higher cash costs for delivering the resources of the Galilee, Gunnedah, and Surat
basins to their end-use markets in solid form.
In response to these price signals, albeit weaker than the signals from an aggressive GHG
reduction scenario, one would still expect power plant owners to choose to build new, CBM-
fired, CCGT plants rather than new, coal-fired, power plants. Over time (20 to 30 years) there
should be a more significant shift to gas-fired CCGT plants, as coal-fired plants are retired and
new CCGT plants are fired on either CBM or UCG-derived syngas. However, the lifetimes of
coal-fired power plants are at a minimum 40 years, with 50- to 70-year operating lives not
uncommon. The potential for early retirement of black coal-fired power plants in Queensland
and NSW is not very strong under a BAU scenario. Victoria‘s brown coal power plants are a
different matter. Given their age, they offer the strongest prospects for early retirement under a
BAU scenario and replacement with gas-fired CCGT plants located either in Victoria or in other
states with power transmitted to Victoria.
But the power sector transition would be very slow. It is difficult to imagine a case were a
significant reduction in CO2e emissions from the coal-fired power sector would ever occur under
a BAU scenario by 2030. Instead the domestic use of steam coal in Australia would be expected
to maintain its current use level (in million tonnes) for the foreseeable future.
Under the aggressive GHG reduction scenario, governments of North Asia, i.e., Japan, Korea,
and Taiwan, and the Australian government are assumed to enter into an international agreement
Page 147
28 March 2011 147 PESD WP #101
to reduce GHG emissions in line with previous UN Framework Convention on Climate Change
(UNFCCC) recommendations:
A 25 percent to 30 percent reduction in 2020 CO2e emissions from 1990 levels
Even greater reductions by 2050
The impacts on the steam coal portion of Australia‘s black coal industry will depend largely on
technology. If ―hoped-for‖ reductions in cost and improvements in efficiency of CCS systems
occur over the next decade, power companies and other large coal consumers are expected to
adopt these systems for new plants and possible existing plants. Under this case, one would
expect some reduction in steam coal usage due to expedited retirement of coal-fired power plants
and their replacement by gas-fired power plants and to a small extent by power plants that rely
on renewable energy resources. The outcome will be dependent on the magnitude of the CCS
cost reductions and efficiency improvements in competing technologies such as CBM, UCG, and
renewable energy resources.
However, it is unlikely that cost reductions and improvements to CCS systems will be sufficient
to maintain the status quo over the next decade. If aggressive GHG reduction standards are
adopted in Australia and the rest of the Asia-Pacific region, it is likely that Australia‘s steam coal
industry will diversify from one that is based on the extraction and marketing of solid, high-
carbon fuels to a two-tiered industry consisting of a competitive, slow-growing solid fuel
segment and a fast-growing liquid and gaseous fuel segment, which will rely on the extraction of
gaseous and liquid fuels from coal resources that are at depths that are uneconomic to extract as
solid fuels. Under this scenario, the CBM industry located in NSW and Queensland will continue
to grow and prosper. Coupled with a still-to-be-created UCG industry, these two new industry
segments might offer an alternative pathway for the industry‘s growth and prosperity.
There will of course be winners and losers, with those companies adhering to the old methods of
extracting coal over time losing their current growth premiums and perhaps becoming declining
industries. Examples of this happening in the past include the town gas industry and those die-
hard adherents to ships and railway locomotives running on coal. The choices may appear
Page 148
28 March 2011 148 PESD WP #101
exceptionally challenging if not stark; but Australia‘s black coal industry has been here before.
What remains to be seen is whether it can repeat the development miracle of the past 60 years in
a brave new world of carbon emission limits and with new technology choices that are much less
proven than the technologies considered for adoption immediately after WWII.
Page 149
28 March 2011 149 PESD WP #101
Bibliography
A
ABARE, ―Australian Commodity Statistics,‖ 2001.
ABARE, ―Australian Commodity Statistics,‖ 2009.
Al-Juaied, Mohammed, and Adam Whitmore, ―Realistic Costs of Carbon Capture,‖ Belfer
Center for Science and International Affairs, Harvard Kennedy School, Harvard University, July
2009, and McKinsey & Company ―Carbon Capture and Storage: Assessing the Economics‖
(undated).
Andrew Carswell, ―Your Simple Guide to the Resource Super Profits Tax,‖ June 17, 2010.
Australia Canberra, ―Australia‘s Identified Mineral Resources,‖ 2009.
Australian Academy of Technological Sciences and Engineering, ―Technology in Australia
1788-1988,‖ p.758 (Chapter 11, Coal Transition at the Coal Face).
Australian Government, ―Fact Sheet: Resource Super Profits Tax‖ (available at
www.futuretax.gov.au/documents/attachments/10_Fact_sheet_Resource_Profit_Tax_Final.pdf).
―The Australian Coal Industry,‖ australiancoal.com.au.
B
Bowen, Bruce, and Peter Gooday, ―Coal: The economics of coal export controls,‖ ABARE
Research Report 93.8, ABARE 1993.
Lucarelli, Bart, ―The History and Future of Indonesia‘s Coal Industry: Impact of Politics and
Regulatory Framework on Industry Structure and Performance‖, (Program for Energy and
Sustainable Development, Stanford University) Working Paper #93, July 2010.
C
Carbon Energy, ―ASX Announcement: Australia‘s First UCG Syngas Power Station -
Commissioning Update,‖ March 3, 2010.
Clean Air Task Force, ―Coal Without Carbon: An Investment Plan for Federal Action,‖
September 2009 (available from www.catf.us).
Coal Services Pty, Ltd ―2008 Australian Black Coal Statistics‖.
Coal Services Pty Limited/Queensland Department of Mines and Energy, ―2006 Australian
Black Coal Statistics‖.
Page 150
28 March 2011 150 PESD WP #101
Commonwealth Bureau of Census and Statistics, ―Official Yearbook of the Commonwealth of
Australia‖ .
D
Department of Information Planning: Queensland Port:
http://www.dip.qld.gov.au/resources/major-projects/presentations/mpc10/brad-fish.pdf
Department of Foreign Affairs and Trade:
http://www.dfat.gov.au/facts/indigenous_land_rights.html
E
E.M. Warner, ―A History of American Continuous Miners‖ (paper presented at 1979
International Conference on Mining Machines, Brisbane, July 2-6, 1979).
Energy Publishing Inc., ―Australia Coal Reports‖ (January 2009 to February 2010).
Energy Publishing Inc., ―Coal Chain Australia‖ Issue 0013, November 2010.
Energy Publishing Inc., ―Coal Chain Australia‖ Issue 0014, December 2010.
Energy Publishing Inc., ―Coal Chain Australia Weekly‖.
Energy Publishing Inc., ―Australia Coal Report‖, December 2010.
F
Fish, Brad, ―The Port of Abbot Point Multi Cargo Facility Project‖, Presentation to the Major
Projects Conference – 19 October 2010 (available on line:
http://www.dip.qld.gov.au/resources/major-projects/presentations/mpc10/brad-fish.pdf).
G
Galligan, Brian, ―Utah and Queensland Coal: A Study in the Micro Political Economy of
Modern Capitalism and the State,‖ University of Queensland Press, 1989.
Gladstone Port: http://www.gpcl.com.au/history.html (About GPC; History of GPC).
GlobalCOAL website (www.globalcoal.com) for updated information on the globalCOAL
Newcastle index.
The Garnaut Climate Change Review: Final Report (available online at
www.garnautreview.org.au).
Page 151
28 March 2011 151 PESD WP #101
Gladstone Observer: www.gladstoneobserver.com.au/story/2010/10/01/eight-sign-on-for-wicet-
wiggins-island-coal
Government of Australia: www.climatechange.gov.au/publications/cprs/white- paper/cprs-
whitepaper.aspx
I
IEA and in particular three reports: (i) ―IEA Statistics: Coal Information 2008,‖ (ii) ―Technology
Roadmap: Carbon Capture and Storage‖ (2009), and (iii) ―CO2 Capture and Storage: A Key
Carbon Abatement Option‖ (2008).
Illawara Coal Port : http://www.illawarracoal.com/technology.htm
International Energy Agency, ―Technology Roadmap: Carbon Capture and Storage‖ (undated).
IPCC, 2005: IPCC Special Report on Carbon Dioxide Capture and Storage.
J
Joint Coal Board, ―Annual Reports, (1947-1979) and ―Black Coal in Australia‖ (1980-87) and
Coal Services, which provide historical commentary as background to the Coal Services supplied
data.
Joint Ore Reserves Committee, ―JORC — Its History, its Sponsors, and Current Committee,‖
September 27, 2009, p. 1.
M
Mineral Resources and Ore Reserves: The JORC Code, (2004 edition)‖.
Mimuroto, Yshimitsu, Toru Kimura, and Koichi Koizumi, ―Restructuring of the Coal Industry
in Australia‖, February 2004.
N
National Archives of Australia, ―CA 154, Joint Coal Board‖.
(http://naa12.naa.gov.au/SearchNRetrieve/Interface/DetailsReports/AgencyDetail.aspx?reg_no=
CA%20154
New Port: http://www.newportcorp.com.au/site/index.cfm?display=111710 (History, Australia‘s
First Port).
North Queensland Port: http://www.nqbp.com.au/index.cfm?contentID=4 (NQBP Ports; Hay
Point).
Page 152
28 March 2011 152 PESD WP #101
O
Official Yearbook of Australia, number 73, 1990, p. 469.
P
Pacific National Railroad: www.pacificnational.com.au.
Productivity Commission, 1998, ―The Australian Black Coal Industry‖ Inquiry Report, AusInfo,
Canberra, vol. 2
Q
QR National:
www.qrnational.com.au/CoalFreight/Pages/CoalFreight.aspxwww.freight.qr.com.au
Queensland State Government, ―Coal Mining Act 1925‖.
Queensland Department of Mines and Energy website (www.dme.qld.gov.au).
Queensland Government: www.transport.qld.gov.au.
Queensland Coal: www.qld.gov.au/assetssale/businesses/qr-national/docs/railing-queenslands-
coal-section-2.pdf
R
Reports obtained from Internet searches and out-of-date books covering Australia‘s black coal
from 1900 to 1985.
S
Shaw, A.G.L., and G.R. Bruns, ―The Australian Coal Industry,‖ Melbourne University Press,
1948.
Shackley, Simon, and Clair Gough (eds.), ―Carbon Capture and its Storage: An Integrated
Assessment,‖Ashgate Publishing, December 2006.
W
Westin EPA:
www.epa.wa.gov.au/ABOUTTHEEPA/EIAREVIEW/Pages/default.aspx?
Page 153
28 March 2011 153 PESD WP #101
Wilson, Elizabeth J., and David Gerard Wilson (eds.), ―Carbon Capture and Sequestration:
Integrating Technology, Monitoring, and Regulation,‖ Wiley-Blackwell, April 2007.