UNIVERSITÀ CATTOLICA DEL SACRO CUORE Dipartimento di Economia e Finanza Working Paper Series Minority Salience and Political Extremism Tommaso Colussi, Ingo E. Isphording, Nico Pestel Working Paper n. 80 March 2019
Transcript
UNIVERSITÀ CATTOLICA DEL SACRO CUORE
Dipartimento di Economia e Finanza
Working Paper Series
Minority Salience and Political Extremism
Tommaso Colussi, Ingo E. Isphording, Nico Pestel
Working Paper n. 80
March 2019
Minority Salience and Political Extremism
Tommaso Colussi Università Cattolica del Sacro Cuore
Ingo E. Isphording IZA Institute of Labor Economics
Nico Pestel IZA Institute of Labor Economics and Centre for European Economic
Research ZEW
Working Paper n. 80 March 2019
Dipartimento di Economia e Finanza Università Cattolica del Sacro Cuore
Largo Gemelli 1 - 20123 Milano – Italy tel: +39.02.7234.2976 - fax: +39.02.7234.2781
The Working Paper Series promotes the circulation of research results produced by the members and affiliates of the Dipartimento di Economia e Finanza, with the aim of encouraging their dissemination and discussion. Results may be in a preliminary or advanced stage. The Dipartimento di Economia e Finanza is part of the Dipartimenti e Istituti di Scienze Economiche (DISCE) of the Università Cattolica del Sacro Cuore.
Minority Salience and Political Extremism∗
Tommaso Colussi† Ingo E. Isphording‡ Nico Pestel§
Tuesday 5th March, 2019
Abstract
We investigate how changes in the salience of a minority group affect the majoritygroup’s voting behavior. Specifically, we focus on Muslim communities and their in-creased salience in daily life during Ramadan. To estimate a causal effect, we exploitexogenous variation in the distance of German federal and state elections to the monthof Ramadan over the 1980–2013 period. Our findings reveal an increased polarizationof the electorate: vote shares for both right- and left-wing extremist parties increasein municipalities where mosques are located when the election date is closer to Ra-madan. We use individual-level survey data to provide evidence on potential mecha-nisms. During Ramadan respondents perceive the share of foreign-born people living intheir country as larger and reveal more negative attitudes towards Muslims. We com-plement these findings with evidence on increased numbers of violent attacks againstMuslim communities shortly after Ramadan.
∗We would like to thank Daron Acemoglu, Alberto Alesina, Ghazala Azmat, George Borjas, JanaCahlikova, Pierre Cahuc, Arnaud Chevalier, Giacomo De Giorgi, Ahmed Elsayed, Ben Elsner, FrancescoFasani, Nicola Gennaioli, Robert Gold, Dan Hamermesh, Stephan Heblich, Andrea Ichino, Rafael Lalive,Andreas Lichter, Andreas Madestam, Marco Manacorda, Joniada Milla, Elie Murard, Daniele Paserman,Michele Pellizzari, Barbara Petrongolo, Simone Quercia, Chris Roth, Seyhun Sakalli, Andrei Shleifer, Se-bastian Siegloch, Nadiya Ukrayinchuk, Felipe Valencia, Alessandro Vecchiato, Joachim Voth, Basit Zafar,Luigi Zingales, Ulf Zölitz, and seminar participants at NBER SI 2017- Political Economy, 73rd IIPF, Uni-versitá Cattolica, OECD, Brucchi Luchino, U Girona, QMUL, Liser, U Texas-Austin, XXII SOLE and VIIfRDB. We are thankful to Georgios Tassoukis for his help with the data collection. Stephan Ermert, EricLustenberger, Maximilian Mähr, and Rebecca Schreiber provided excellent research assistance. TommasoColussi gratefully acknowledges funding from Universitá Cattolica D32 ESEM strategic research grant. Anearlier version of this paper circulates as IZA Discussion Paper No. 10417.†Corresponding author. Catholic University of Milan and IZA, [email protected]‡IZA - Institute of Labor Economics, [email protected]§IZA - Institute of Labor Economics and Centre for European Economic Research (ZEW), [email protected]
What is the impact of increased ethnic diversity on social and economic outcomes? This
question has been subject to an intensive debate, particularly in immigration-receiving coun-
tries (Alesina & La Ferrara, 2005; Putnam, 2007). While diversity may have positive effects
on the economy in the long run (Alesina et al. , 2016), it might decrease trust and social
capital (Alesina & La Ferrara, 2002; Putnam, 2007), reduce preferences for redistribution
(Dahlberg et al. , 2012) and weaken social relationships (Algan et al. , 2016). Recent em-
pirical studies show that these effects spill over into electoral outcomes, ultimately affecting
the support for nationalist parties.1
Against this background, this paper empirically investigates the impact of the visibility
of religious minorities on the majority group’s political choices. Specifically, we focus on
a setting where Muslim communities’ salience rather than their size changes over time.
Salience theory (Bordalo et al. , 2012, 2013) predicts that due to limited attention individuals
over-emphasize salient features of choices and underrate less prominent, but still important
ones. The role of salience as a driver of individual decision-making has been recognized by
economists in several contexts, such as consumers’ choices (Chetty et al. , 2009), tax rates
(Finkelstein, 2009) or judicial and investment decisions (Barber & Odean, 2008; Bordalo
et al. , 2015). Whether salience plays a role in shaping political choices and attitudes
towards minorities still remains largely unexplored.
To establish a causal link between the salience of Muslim communities and electoral
outcomes, we exploit variation in the distance of election dates to the festivity of Ramadan.
During Ramadan – a month of religious observances, comprising fasting and extra prayers
– Muslim communities become more visible due to increased mosque attendance, regular
1 Increasing vote shares for right-wing parties due to higher immigrant shares have been found for Italy(Barone et al. , 2016), Austria (Halla et al. , 2016), Denmark (Dustmann et al. , 2016), Switzerland(Brunner & Kuhn, 2014), the UK (Becker & Fetzer, 2016), and the city of Hamburg in Germany(Otto & Steinhardt, 2014). By contrast, Steinmayr (2016) finds that exposure to refugees in Austrianneighborhoods reduces the support for the far-right. Along similar lines, Dill (2013) shows a negativerelationship between foreigners’ share and right-wing voting in Germany.
1
festivities and higher media attention, resulting in a plausibly exogenous increase in the
salience of Muslim minorities during this period. The month of Ramadan rotates over the
seasons according to the lunar calendar: its start date moves backwards by eleven days each
year, thus creating an idiosyncratic variation in the distance to election dates.2
We use this over-time variation in salience in a difference-in-differences (DiD) framework
by comparing differences in elections which are or are not affected by Ramadan, and between
municipalities which have or have not a Muslim community. In absence of any administrative
information on Muslim communities, we use locations of representative mosques as a proxy
for religious Muslims’ presence. The DiD framework allows us to separate the effect of a
change in salience from unobserved confounding factors and reversed causality related to
selective mosque location or Muslims’ location choices.3
For our main analysis, we combine data on mosques’ establishment with election results
at the municipality level and focus on eighteen federal and state elections between 1980
and 2013 in the state of North Rhine-Westphalia (NRW). Germany displays a very relevant
setting for our analysis. It is home to more than four million Muslims, the largest number
among European countries, who make up about 5% of the total population, with the majority
residing in the state of NRW. Germany has a long-running history of heated debates on topics
of immigration and cultural identity, which only renewed in the wake of escalating acts of
Islamic terrorism and the recent inflow of refugees from the Middle East.4
Our results paint a picture of increased polarization in response to a higher minority
salience. The difference in the vote share for far-right parties between municipalities with
2 Several studies have used the exogenous timing of Ramadan to estimate the effect of religious practiceson health (Almond & Mazumder, 2011) and educational outcomes (Oosterbeek & van der Klaauw,2013; Almond et al. , 2015). Campante & Yanagizawa-Drott (2015) show that Ramadan fasting reducesproductivity in Muslim countries, but it increases Muslims’ subjective well-being.
3 We acknowledge that salience of Muslim minorities might be affected by a number of different sources,e.g., media attention on crimes and terror attacks perpetrated by Muslim minority members or economicshocks attributed to Muslim immigration.
4 Anti-Muslim resentments can be traced back to the first Turkish guest-workers arriving in the 1960s.In its multi-party system covering the full political spectrum, both right- and left-fringe parties havesuccessfully exploited this controversial issue by tailoring their messages and targeting potentially ex-tremist voters in an attempt to increase their political support.
2
and without a mosque increases by about 14% of a standard deviation if an election takes
place within three months after the start of Ramadan. The respective effect for left-fringe
parties displays a similar effect of 22% of a standard deviation. This average effect is sensitive
to local economic conditions and substantially increases during economic downturns. We
provide a variety of robustness checks for the validity of our results. The estimated effects
fade away with time: as the distance of the election date from Ramadan increases, the
magnitude of the electoral effects decrease. We find a similar pattern of polarization in a
larger sample of all West German municipalities. Analyzing smaller geographical units, i.e.,
electoral districts in the city of Berlin, we find heterogeneous effects on left- and right-wing
parties within a city; right-wing parties gain support in districts nearby mosques, while the
effect on far-left parties increases with the distance to a mosque.
We use individual-level survey data from the European Social Survey to shed light on
the potential mechanisms driving our results. Respondents interviewed just after Ramadan
reveal more extreme political standpoints than those surveyed later on. This group of
respondents show more negative attitudes towards Muslims, they perceive a larger share
of foreign-born persons living in the country and they are more concerned about cultural
dissimilarities between natives and immigrants. Finally, we show that the increased negative
attitudes against Muslims spill over into violent behavior. Using daily records of attacks on
Muslim communities in Germany over the 2001–2011 period, we find a considerable increase
in the probability of an attack during the two months after the end of Ramadan.
This paper provides first-time field evidence of the effect of salience on voters’ political
choices by showing the responsiveness of the electorate to the salience of information. Over-
all, our findings show a significant effect of minority salience on individuals’ voting behavior.
Voters cast their ballot for parties claiming that Muslims pose a serious threat to Germany
when this minority group becomes salient. The increased right-wing consensus triggers the
reaction of left-wing voters in an attempt to stop the far-right wave; we attribute the effect
on the left to a “second-order” salience effect and document the responsiveness of the left to
3
right wing activities using data on left- and right-wing protests in Germany. As Muslims
become more salient, right-wing movements gain momentum, with left-wing movements re-
acting through counter-rallies, ultimately increasing their consensus among German voters.
As the shock in minority salience is arguably small and temporary, the responsiveness of the
public is noteworthy. The political consequences of changes in minority salience may have
further social repercussions: the estimated effects on vote shares are large enough to push
fringe parties above the threshold to get public financing for their political activities. Given
the German sensitivity to right-wing topics, even small increases in extremist vote shares
draw disproportionate media attention, ultimately conveying information about the social
acceptance of extremist opinions (Bursztyn et al. , 2017).
Our findings contribute to at least three strands of literature. First, our results fit the
narrative of social identity theory that in-group favoritism and out-group discrimination
increase with the salience of the out-group (Turner, 1981; Tajfel, 1982). Second, this paper
relates to the growing number of studies applying the general insight of the intergroup
interaction theory to the field of political interaction. Here, a number of studies demonstrates
how coexistence of different ethnic groups has led to increased political polarization and
support for extremist positions in response to economic or political shocks.5 Finally, by
documenting behavioral responses to changes in the salience of a particular minority, we also
connect to the empirical literature on the effects of limited attention and fallible memory
on individual decision-making.6
5 Sakalli (2016) studies historical settlement patterns in Turkey, arguing that the coexistence of differentreligious groups has a long-term impact on political extremism through its effect on culture and itsinteraction with formal institutions. Similar patterns of regional coexistence and political polarizationhave been identified for Jews and Gentiles in the Russian Empire (Grosfeld et al. , 2013). Other studieshave also found increased ethnic hatred among Croatians being exposed to Serbian Radio (DellaVignaet al. , 2014) and negative externalities of forced coexistence of different Native-American tribes in theUS reservation system (Dippel, 2014).
6 Fouka & Voth (2016) show that the public disagreement between German and Greek politicians duringthe sovereign debt crisis of 2010–2014 reactivated past memories of World War II atrocities committedby German troops in Greece. For Austria, Ochsner (2017) find that right-wing voting increased inmunicipalities pillaged during the sieges of Vienna by Turkish troops in 1529 and 1683 compared tonon-pillaged municipalities after Austrian right-wing populists started to campaign against Turks andMuslims explicitly referring to the Turkish sieges in 2005.
4
The remainder of this paper proceeds as follows. Section 2 provides a conceptual frame-
work. Section 3 describes background and data sources on the political system and Muslim
communities in Germany. We further provide empirical evidence on the higher salience of
Muslims during Ramadan. We discuss the identification strategy in Section 4. Section 5
presents main empirical findings, robustness checks and additional analyses. We discuss
several aspects of our results in Section 6. Section 7 concludes.
2 Conceptual framework
In this paper, we analyze how salience of a minority group might influence voting decisions.
Similar to Bordalo et al. (2013), we define salience as the “phenomenon that when one’s
attention is differentially directed to one portion of the environment rather than to others, the
information contained in that portion will receive disproportionate weighting in subsequent
judgments” (Taylor & Thompson, 1982, cited in Bordalo et al. (2013)).
In our setting, the part of the environment that receives disproportionate attention are
religiously active Muslim communities. During Ramadan, Muslim communities are more
salient through a stronger display of cultural traits, more religious activities and a rise in
media coverage. In close proximity to a mosque, increased attendance, regular fast-breaking
meals and festivities marking the beginning and end of Ramadan will draw voters’ attention.
Outside a mosque’s immediate vicinity, voters are still exposed to increased local media
attention.7
Salient minorities can affect voters’ decisions if they are mentally linked to topics and
policy fields. In German elections, voters mainly choose between parties representing plat-
forms summarizing opinions and attitudes with regard to a range of policy areas. When
7 In recent advances of salience theory (Bordalo et al. , 2013), decision makers’ attention is endogenouslydrawn to specific dimensions of alternatives in which these differentiate most. In contrast, in ourempirical exercise, we exploit arguably exogenous changes in salience through the distance of electionsto the beginning of Ramadan as a natural experiment. In this sense, our setting resembles otherexperimental settings of artificially raised salience (Chetty et al. , 2009).
5
casting their vote, voters weigh off expected net benefits from policy bundles which are
associated with parties. The attention voters give to benefits and costs of different topics
and policy fields varies across voters and may be affected by variation in salience.
We allege that an increase in Muslim minority salience may affect voting through at least
two mechanisms. The first mechanism works through voters’ weights on topics of immigra-
tion policy. As virtually all Muslims living in Germany have a migration background as
first-, second- or third-generation migrants, a higher salience of this group increases voters’
attention to heatedly debated immigration policies. This mechanism might be facilitated
through highlighted cultural differences, raising the topic salience of cultural identity. With
especially right-wing extremist parties traditionally taking strong stances on immigration
and cultural identity, voters might be swayed to vote for nationalistic parties. This mecha-
nism relates to the concept of issue salience in political science: voters cast their ballots for
the party that “owns” a political issue when it becomes salient (Bélanger & Meguid, 2008).
A second mechanism works through increases in-group bias due to more salient group
differences (Turner, 1981; Tajfel, 1982; Jenkins, 2014). By highlighting cultural dissimi-
larities between majority and minority, the higher salience of Muslim communities during
Ramadan might trigger in-group favoritism among majority members. Such in-group bias
as a function of out-group salience has been extensively tested in the lab (Chen & Li, 2009;
McLeish & Oxoby, 2011). Expressing support for nationalist ideologies through voting for
right-wing extremist parties can be seen as strong expression of in-group favoritism. Again,
this mechanism of native in-group favoritism might be of specific importance in our field
setting through the highlighting of cultural and religious differences during Ramadan.8
8 On similar lines, Adida et al. (2016) found that players with no recent immigrant background discrim-inated against Muslims in simple dictator games when the proportion of Muslims in their midst wasincreased. When interpreting the effects of the interaction of Ramadan and mosque exposure as theeffect of a higher salience of Muslim minorities, we take into account the specific features of Muslimcommunities highlighted by Ramadan, i.e. cultural and religious differences. This sets our settingapart from situations in which migrants are primarily seen as a threat through competition on thelabor market (e.g. Halla et al. (2016)).
6
3 Background and data
In this section, we first describe the German political system and the election data used
in the main analysis where we focus on the West German federal state of North Rhine-
Westphalia (NRW). We then provide a brief overview on the history of Muslims, mosques
and anti-Muslim rhetoric in Germany and describe the data on mosques.9 We further provide
empirical evidence on how public attention is drawn to Muslim communities in response to
higher salience during Ramadan.
3.1 Electoral and party system
Germany is a federal parliamentary republic comprising sixteen constituent states (Länder).
In elections for the federal and the states’ parliaments, voters cast two different votes for
candidate and party list. We focus on the second vote (Zweitstimme) cast for a party
list as it expresses voters’ party preferences and is unaffected by preferences for individual
candidates on the local level. In general, the federal parliament (Bundestag) is elected for
a four-year term, the state parliament (Landtag) for a five-year term. Election dates for
the Landtag are in general in May, while most Bundestag elections are in September and
October.
The multi-party system in Germany covers the entire spectrum of political preferences
from extreme left to extreme right. Since World War II, either the center-right Christian
Democrats (CDU ) or the center-left Social Democrats (SPD) have exclusively led federal
and state governments, occasionally in joint coalitions. The Liberal Party (FDP) and the
Green Party (GRÜNE ) have lent support to coalition governments.
Smaller parties, especially right-wing fringe parties, in general fail to surpass the required
vote share of at least 5%. As an exception, the left-wing successor party of the former
Communist Party of East Germany (currently Die Linke) has regularly won seats in the
9 Additional data on Berlin elections, individual attitudes and crimes against Muslims is described in therespective sections.
7
Bundestag and occasionally in the state parliaments of NRW and Berlin. Since 2014, though,
the right-wing party Alternative für Deutschland (AfD) has increasingly gained seats in all
state parliaments and is represented in the federal parliament since 2017. Regardless of
entering the parliament, political parties in Germany become eligible for public subsidies
to fund their political activities if they received at least 0.5% of votes in the last federal or
European election or at least 1.0% in a state election.10
We aggregate votes for single parties to votes for established, far-right and far-left parties
following Falck et al. (2014). Established parties include the Christian Democrats (CDU ),
the Social Democrats (SPD), the Liberal Party (FDP) and the Green Party (GRÜNE ).
Right-wing parties are movements following anti-immigration and nationalist ideologies.
Left-wing parties are those characterized by communist ideologies, featuring anti-capitalist
and anti-globalist opinions. The respective full party lists are described in Table 1.
Data on Elections in NRW. In our main analysis, we focus on electoral outcomes
over the period 1980–2013 in 396 municipalities (Gemeinden) in the state of North Rhine-
Westphalia (NRW). The state of NRW has the largest population size among the German
Länder, about 18 million or more than 20% of the total population of Germany. The
period encompasses ten federal elections as well as eight elections for the state parliament.
Overall, the estimation sample comprises 7,128 municipality-election observations.11 For
each election, we collect the number of eligible voters by municipality, the actual number of
valid and invalid votes as well as the number of valid votes cast for each party. In addition,
we obtain time-varying municipality characteristics from the Statistical Office: population
10 Each year, eligible parties receive 1 euro from the government budget for the first four million votesand 0.83 euros for each additional vote in state, federal and European elections, up to the maximumof self-raised revenues.
11 We exclude data on municipal elections (Kommunalwahlen) from the main analysis for three reasons:first, non-German European Union citizens are eligible to vote in these elections; second, the data maymis-specify information on some local extremist parties; and finally, mosques’ construction may directlyinfluence the political campaign of extremist parties at the very local level.
8
size, population density, share of foreigners, share of women and number of employed.12
3.2 Muslims and mosques in Germany
Islam is the largest minority religion in Germany. Muslim religious affiliation is not recorded
in any official register. Based on extrapolations of immigrant origin countries, the Federal
Office for Migration and Refugees estimated that in 2008 Germany was home to about four
million Muslims, accounting for roughly 5% of the total population. An estimated 45% of
them naturalized between 1998 and 2005 (Haug et al. , 2009). Figure 1 plots the distribution
of Muslims across German states as of 2008. Muslims are geographically concentrated in
West Germany (98%), whereby more than 30% of them reside in the state of NRW.
About 70% of Germany’s Muslims are of Turkish origin, most of them being descendants
of Turkish guest-workers arriving in the 1960s (Stoop, 2016). Other large sending countries
are Albania, Bosnia and Middle Eastern countries. The most numerous religious group are
Sunnis, followed by Alevis and Shiites: these three groups alone account for about 94% of
the total Muslim population in Germany (Haug et al. , 2009).
Anti-Muslim rhetoric is not a recent phenomenon. Resentments towards the Muslim
population began to mount shortly after the first guest-workers from Turkey arriving in the
early 1960s. A steady inflow of migrants throughout the 1980s and 1990s continuously fueled
a heated public debate about the consequences of increasing cultural diversity in Germany.
Nationalist right-wing magazines, like Junge Freiheit or Nation und Europa, portrayed the
Muslim community as not willing to assimilate and warned of the infiltration of Germany
by a Muslim majority.13 Right-wing parties tried to utilize the increasing public resentment
by adding anti-Muslim statements to their political agendas.
Apart from verbal attacks against Muslims, far-right movements even called for an
12 Table A.1 provides means of party vote shares for established, right- and left-wing fringe parties as wellas municipality characteristics for the observation period.
13 See the 1994 Annual Report of the Federal Office for the Protection of the Constitution, Germany’sinternal secret service.
9
“armed fight against the Turks”.14 Reports of the German intelligence service provide evi-
dence for recurrent assaults on Muslim minorities throughout the 1980s and 1990s, culmi-
nating in assassination attempts in the city of Mölln in 1992 and an arson attack in Solingen
in 1993, targeting Turkish Muslim families.
More recently, following the increase in Islamist terror and the aftermath of the refugee
crisis in 2015, mass movements, like the so-called Pegida protests, have brought anti-Muslim
rhetoric back to the public focus.
Mosques in Germany. Starting in the mid-1970s, mosque associations and Islamic
centers were set up to build representative places of worship, relocating their members from
backyard locations to proper mosques with minarets and domes (Kuppinger, 2014).15
This construction of mosques was and remains a highly-debated phenomenon in Ger-
many (Schmitt, 2003). Local residents and anti-immigration movements express concerns
related to Islamic fundamentalism, influence from foreign countries and ethnic segregation
(Stoop, 2016). Far-right parties have used these concerns as propaganda vehicles to support
anti-immigration ideologies. Constructions of mosques were regularly met with protests and
demonstrations.16 Left-wing counter-rallies opposing the anti-Islam protesters resulted in
increased social tension.17
Data on Mosques. German administrative data do not contain any information on
ethnicity, race or religion apart from Christian affiliation. We therefore use the existence
14 See the 1983 Annual Report of the Federal Office for the Protection of the Constitution.15 Mosque constructions were mainly driven by organizations like the Turkish-Islamic Union of the In-
stitutions for Religious Affairs (DITIB), the Union of Islamic Cultural Centres (VIKZ), the IslamicCouncil of the Federal Republic (IRD) and the Central Council of Muslims in Germany (ZMD). Thefirst two are associations for Muslims of Turkish origin, whereas the IRD and the ZMD gather Muslimsof different backgrounds (Stoop, 2016).
16 In Cologne, the largest municipality of the state of NRW, the anti-mosque movement (Pro Köln) spilledover into local politics by setting up a party running for the 2009 city council elections which has sparkedrelated parties at the federal and state level (ProNRW and ProDeutschland).
17 As anecdotal evidence, Figures A.1(a) and A.1(b) show pictures taken at the Pro Köln rally in Cologneand the counter-protests organized by left-wing parties. Figures A.2(a) and A.2(b) show electoralposters of two far-right parties (Pro-NRW and REP) targeting Muslims and mosques’ construction.Figures A.2(c) and A.2(d) show electoral posters of the PDS (far-left) against far-right parties.
10
of a mosque in a municipality or electoral district as a strong proxy for the existence of a
sizable and active Muslim community.
We obtained mosque data from the online mosque register www.moscheesuche.de pro-
viding information for each mosque, including its year of opening (or closure), the postal
code as well as the organization running the mosque. In addition, we have information
on different characteristics of the mosque. For each prayer house, we know whether it is
located in a residential area, the size in square meters and the height of the minaret(s). To
ensure the validity of the information provided by the website, we ran extensive validation
checks. First, for each Muslim organization appearing in the raw data we downloaded the
list of their prayer houses, including the year of establishment and the address. We then
used Google Earth and Street View to check whether the prayer houses was present in the
indicated address. The total number of mosques in our data is in line with other studies
conducting similar research, such as Schmitt (2003).
Figure 2 provides a map of mosques’ presence across municipalities of NRW by decade.
Prior to 1980, there were only eight municipalities where a mosque was established, whereas
this number increased to 53 in the following three decades. We only have information
on “visible” mosques, i.e., those with a minaret as well as a dome. So-called backyard
mosques, which are accommodated in buildings previously used for different purposes, e.g.,
warehouses, factory halls or supermarkets, are not part of our data.18
3.3 Ramadan and Muslims’ salience
Ramadan is the ninth month of the Islamic lunar calendar, when according to the Islamic
Faith the Quran was revealed to the prophet Muhammad. During the 30 days of Ramadan
Muslims are called upon to re-evaluate their lives in light of Islamic guidance, which includes
fasting from sunrise to sunset along with daily prayers, charity and pilgrimage to Mecca at
18 Figures A.1(e) and A.1(f) in the Appendix illustrate the difference between a backyard mosque and amosque with a minaret and dome.
11
least once in a Muslim’s lifetime. The individual lifestyles and social lives of Muslims across
the world are thus strongly affected by Ramadan (Marshall Cavendish, 2010).
Ramadan is a time of socialization, during which Muslims come together and visit the
mosque to share meals with relatives and acquaintances. Daily routine during Ramadan
includes pre-dawn and fast-breaking meals taking place at the mosque. The end of Ramadan
is celebrated with a three-day event.19 These celebrations and additional prayers result in
increased mosque attendance and higher levels of displayed religiosity (Akay et al. , 2013;
Campante & Yanagizawa-Drott, 2015).
Timing of Ramadan and Elections. In our empirical analysis, we exploit the
fact that Ramadan moves backwards through the year by a mismatch of eleven days in the
Gregorian and the Islamic calendar. Figure 3 depicts how Ramadan rotates over the seasons
over the time period under investigation from 1980 to 2013. Each scatter point indicates the
start date of a 30-day Ramadan period. Elections usually take place in May and September.
Accordingly, the distance between election dates and Ramadan periods varies systematically
with Ramadan moving backwards through the year. For the purpose of this study, we can
plausibly assume that this distance is exogenous to fringe party success. Out of eighteen
elections, four elections occur in close proximity to Ramadan, i.e., the national elections in
1980, 2009 and 2013 and state parliament elections in 1990.20
Salience of Muslims during Ramadan. Our identification of electoral effects
relies on Ramadan increasing the salience of Muslim communities. Here, we provide evidence
on this relationship. We first use data on the contents of a national news program on
German television, the Tagesschau and the related Tagesthemen, followed by about ten
19 Figures A.1(c) and A.1(d) in the Appendix portray typical Ramadan banquets at the mosque in Duis-burg and Dortmund.
20 We choose a time window of 90 days after the beginning date in our preferred specification and analyzelater the sensitivity of our results to different definitions. Figure 4 visualizes the distance in days afterthe beginning of the last Ramadan cycle for each election as vertical bars. Additionally, the dashedline highlights the increased mosque dissemination during the time window of observation, increasingfrom eight to 53 municipalities with a mosque.
12
million viewers every day. Based on the daily content of each show since April 2013 as
listed on the official web page www.tagesschau.de, Figure 5 plots the coverage of Ramadan
by Tagesschau and Tagesthemen aggregated by week. The beginning and end dates of
Ramadan are clearly covered by these national TV news shows, providing a first indication
for news coverage.
The nationwide media coverage leads to a uniform availability across the entire country
and raises the salience of Muslim minorities among German voters in general. However, the
change in salience is arguably stronger in places where a sizable and visible Muslim commu-
nity is based. We accordingly illustrate that Muslim minority salience changes differently
during Ramadan periods between places with and without a mosque. To do so, we use
city-level information on Google searches and Twitter use to examine whether the search
for or the use of Muslim-related terms respond to Ramadan more strongly in cities with a
mosque.
We accessed detailed data on the total number of Google searches by calendar month
for 533 cities across Germany with a population size of at least 10,000. Among them, 141
cities have at least one mosque. The data cover a period of four years from September
2014 to August 2018, including four Ramadan cycles starting in May/June and ending in
June/July respectively. We retrieved search words in German language related to Muslims:
“Muslim”, “Islam”, “Moschee” (mosque) and “Ramadan”. Similarly, we retrieved the number
of localized tweets on a weekly basis using these terms from the Twitter platform over the
period from April 25th to August 24th 2018, i.e., from three weeks before the start and
about ten weeks after the end of the 2018 Ramadan cycle. For tweets, we focused on the
396 municipalities of North Rhine-Westphalia.21
Figures 6(a) and 6(b) show averages of searches for and tweets using Muslim-related
terms. Both graphs show a strong correlation between the use of Muslim-related terms and
Ramadan cycles. This relationship is significantly more pronounced in cities where a visible
21 We describe the Google and Twitter data in more detail in Appendix B.
13
mosque is located.22 We interpret these differences in internet and social media behavior
as evidence for a disproportional attention and salience gain of Muslim-related topics in
vicinity to a mosque in response to Ramadan.23
4 Identification
Our empirical strategy to estimate the causal effect of Muslims’ salience on election results
exploits idiosyncratic variation in the time passed between the beginning of Ramadan and
election dates. During Ramadan, more religious activities and increased media coverage
draw public attention to religiously active Muslim communities. As such, the distance
between Ramadan and elections induces variation in the salience of Muslims in voters’
decision-making process. This variation in salience is likely to be larger in municipalities
where a sizable Muslim community is present than in municipalities where it is not.
We proxy the existence of an active religious Muslim community by the location of
mosques. Mosque locations are not necessarily orthogonal to unobserved factors affecting
election outcomes. To separate a causal effect of increased salience from potential con-
founders on the level of single elections and municipalities, we use a difference-in-differences
strategy that compares differences between voting outcomes in elections affected by Ra-
madan and elections unaffected by Ramadan, between municipalities with and without a
religiously active Muslim community. To interpret this difference-in-differences as the causal
estimate of Muslim salience on outcomes, we have to assume strict exogeneity between the
joint treatment of Ramadan and mosque existence – the interaction of mosque presence and
Ramadan occurrence – and further determinants of political extremism in any period.
22 Plots of residuals of separate regressions on the total number of searches and tweets for any of theseMuslim-related terms on city and year-by-month fixed effects (week fixed effects for Twitter) are dis-played in Figures A.3(a) and A.3(b). Patterns are similar to the raw numbers in Figures 6.
23 As the data do not provide us with information on the identity of the users who use these words, we donot know their religious affiliation. Hence, we cannot fully rule out that part of this picture is due totweets and search queries by Muslims themselves looking for information about mosques and Ramadan.In an additional keyword-wise analysis we find that also single search terms with a clear anti-Islamconnotation display the same pattern. Results are available on request.
Voting outcomes in municipality i in election t – vote shares for extremist and established
parties as well as voter turnout – are regressed on a binary indicator mit, that switches to
one when a mosque has been established in municipality i by election date t. We interact the
presence of a mosque with a binary indicator rt for election t happening in a specified time
window after the start of Ramadan. This interaction is meant to capture the difference in
voting outcomes that can be plausibly attributed to the increase of Muslim salience during
Ramadan.
This effect of salience is identified through a two-way fixed effects model to control for
unobserved factors that simultaneously affect anti-Muslim sentiments and electoral results.
First, we include fixed effects at the level of municipalities (δi) that absorb unobserved time-
invariant factors at the municipality level, such as remoteness, geographical endowments
and historical determinants of political preferences. Second, we control for unobserved
time-varying factors that are shared by all municipalities by adding election fixed effects
(λt).24 Such factors could be the set of parties that decide to run in a specific election, and
factors driving the demand for extremist parties such as recent terrorist attacks or the state
of the national economy. Relying on this specification, we can plausibly assume that the
error term εit is orthogonal to changes in salience conditional on unit and time fixed effects,
i.e., E[mit × rt, εit|λi, δt] = 0, and that β2 provides us with a causal estimate of the effect
of the increased salience of religious minorities through the presence of a mosque during
Ramadan.
24 Election and election date fixed effects are equivalent, as each one of the 18 elections that we observetakes place at a different date.
15
Identifying variation. It is important to note that the identification of our key pa-
rameter does not rely on the diffusion of mosques over time. In regression model (1), only the
parameter β1 is entirely identified by mosque construction over time within municipalities.
This source of variation is potentially endogenous and we therefore refrain from interpreting
the coefficient as the causal effect of mosque construction. Our main parameter of interest
though, β2, is identified by comparing Ramadan-affected elections between municipalities
with or without a mosque. As such, β2 is therefore identified even in the absence of time
variation in mosques through the comparison of Ramadan-induced changes across munici-
palities. The Ramadan indicator rt only enters the specification through the interaction with
the mosque indicator, while its main level is absorbed when adding the election fixed effects.
We therefore do not identify the average effect of increased salience during Ramadan, but
the difference between cities with and without a mosque.
Balancing tests. The identification of β2 relies on the assumption that the residual
variation of the main explanatory variable Mosque×Ramadan is independent of the error
term εit. Although this assumption is essentially untestable, Table 2 provides results from
a balancing test based on observable characteristics. Specifically, we test whether several
municipal characteristics that may potentially influence electoral outcomes are correlated
with our treatmentMosque×Ramadan. The estimated coefficients in Table 2 do not reject
the hypothesis of the treatment being orthogonal to observable characteristics. Point esti-
mates are small in magnitude and insignificant and do not provide evidence of a systematic
correlation with time-varying municipal characteristics.
To further ensure the idiosyncratic and unsystematic nature of our treatment and assess
the potential influence of a lack of balancing on our results, we conduct an omnibus test
in the spirit of Satyanath et al. (2017) by predicting right and left vote shares based on
the full set of observed municipality characteristics – population density, share of women,
share of foreigners and the log number of private sector employees – and regressing this
16
prediction on our main explanatory variables, mosque presence, Ramadan and their inter-
action. The results of this omnibus test are summarized in Table 3. The test does not reject
our assumption of the as-good-as-random nature of elections after Ramadan and we do not
find any significant correlation between joint municipality characteristics and the interaction
between Ramadan and mosque presence. The coefficients are precisely estimated and very
small. As expected, the results indicate a strong significant association between observable
municipality characteristics and the presence of a mosque, a result that is already apparent
from the descriptive statistics in Appendix Table A.1. Accordingly, we avoid interpreting
coefficients of the mosque indicator as representing causal relationships.
5 Results
5.1 Minority salience and election results
First, we present results for the effect of salience of Muslim communities on NRW elections.
The results are summarized in Table 4. The table is organized into four panels organized
by dependent variable: vote shares for far-right, far-left and established parties as well as
voter turnout. Vote shares are expressed as the percentage of eligible voters to condition on
changes in the turnout.
Columns differ by the set of included controls. Column (1) of Table 4 reports the raw
partial correlation of Ramadan and voting outcomes without controls and fixed effects. To
capture the short-run change in salience during and shortly after Ramadan, we consider
elections being potentially affected if they are taking place within three months (90 days)
after the first day of Ramadan. The results indicate higher vote shares for both right- and
left-fringe parties in elections occurring in close proximity of Ramadan. By contrast, we
observe lower support for established parties and lower voter turnout.25
25 To take into account the range of municipality sizes in our sample, we ran regressions weighted byeligible voters (Panel D of Table A.2). The estimated coefficients are similar to those in Table 4 interms of both magnitude and statistical significance.
17
In column (2), we include the mosque dummy and its interaction with the Ramadan vari-
able. Using again the 90-days window after beginning of Ramadan, 1.8% of all municipality-
election observations are affected by the interaction of Ramadan and mosque presence. While
the coefficient of Ramadan remains largely unaffected, both mosque indicator and its in-
teraction with Ramadan display a positive and significant correlation on the support for
extremist parties, while they have a negative correlation with turnout and established par-
ties. However, in the absence of controls for time-varying heterogeneity and unobservable
factors at the municipality level, these results yet cannot be interpreted as a causal effect.
We include fixed effects for election date, municipality and election type in column (3),
now representing the specification discussed in Section 4. Once we include election date
fixed effects, the Ramadan coefficient is absorbed in these. The inclusion of election date
fixed effects is crucial, though, as our dependent variables are vote shares to a defined group
of parties. Some of these parties ran in some elections but they did not in others, whereby
the election fixed effects takes into account this issue. Therefore, from here onwards we focus
on the interaction term Ramadan × Mosque, which picks up the causal effect of a change
in Muslims’ salience in municipalities where they are active on political extremism.26 The
inclusion of additional controls for municipalities’ characteristics in column (4) leaves the
estimated coefficients unaffected, suggesting that the distance of the election to Ramadan
is indeed orthogonal to selected observable characteristics.27
The results of this preferred specification indicate that far-right parties’ vote share is
increased by 14% of a standard deviation in municipalities where a mosque is present and
when the election is within three months after the start of Ramadan. Similarly, far-left
parties’ support is increased in elections during Ramadan by about 22% of a standard
deviation. As such, the occurrence of Ramadan appears to increase the attention to Muslim
26 Appendix Table A.3 shows the sensitivity of our results to the inclusion of different sets of fixed effects.27 Our setting might be affected by spatial correlation in the error terms. We followed the suggestions by
Dell et al. (2014) and explored the sensitivity of our results towards clustering on a larger geographicallevel (districts) or allowing for decreasing correlation in error terms following Conley (1999). Therespective results are summarized in the appendix in Table A.4. Standard errors increase, though ourmain results remain significant for both right- and left-wing vote shares.
18
communities in German municipalities, ultimately polarizing the political preferences of
voters.28
In contrast to the effects on fringe parties, established parties experience a one percentage
point reduction in treated municipalities and elections. The increased political extremism
reduces voter turnout as shown by the negative coefficients. The effect is negligible in
size, but is consistent with the idea that polarization has led to a general withdrawal from
politics: as the political debate becomes harsher, the moderate voter may decide not to vote
(Rogowski, 2014; Guiso et al. , 2017).
5.2 Robustness checks
In this section, we undertake a number of analyses to test for the sensitivity of our main
results and to rule out potential threats to the validity of our identification. For clarity of
exposition, we focus on vote shares for far-right and far-left parties. Robustness tests on
further outcome variables are presented in Appendix Table A.6.
Trends and outliers. To allow for different latent trends across cities, we interact
municipality fixed effects with linear time trends or with dummies for ten- and five-year sub-
periods. The results are reported in columns (1) to (4) of Table 5. Estimated coefficients
remain virtually unchanged for the far-right support when we include a linear time trend
(column (1)). They become smaller for left-fringe parties, but remain statistically significant
at the 1% level. Controlling for non-parametric trends, i.e., columns (2) and (3), slightly
reduces the magnitude of the estimates, which remain statistically significant at conventional
levels. Identification within sub-periods relies on differences in relatively close elections,
28 A further plausible mechanism behind our results is an endogenous campaign rhetoric in response to ahigher minority salience. We investigated this mechanism by relating the number of tweets from right-wing party-owned twitter accounts to our treatment of increased salience. The respective coefficient inAppendix Table A.5 is close to zero and precisely estimated. Though we cannot rule out that strategiccampaigning took place at earlier times of our observational period, parties would have to anticipatemoderate changes in attention resulting from higher minority salience and would have to engage in acostly regional adjustment of campaigning.
19
leading to less precise estimates. We additionally test for diverging time trends as a result
of the increasing importance of Muslims in German politics. We do so by including a linear
time trend interacted with the presence of a mosque. Results in column (4) remain largely
unaffected.
We further investigate the robustness of our estimates towards outliers in voting out-
comes. We transform the dependent variables by taking the square root of the vote shares
for each party.29 The estimated coefficients are reduced in magnitude, but remain positive
and statistically significant for both left and right fringe parties. Outlier-robust median
regressions (column (5)) arrive at similar conclusions. Estimates are slightly reduced in
magnitude for both far-right and far-left vote shares.
Timing of mosque construction. Our empirical model is based on an assumption
of strict exogeneity of regressors. Election results should therefore not affect the probability
of being affected by salience changes in later periods. Such a violation of strict exogeneity
could happen through increased polarization to affect later mosque construction. We can
relax this assumption in an alternative specification in which we replace the contemporary
mosque presence with a dummy that takes a value of one if the municipality has ever had a
mosque, and the interaction between this indicator with the Ramadan dummy. This speci-
fication allows us further to have a larger proportion of treated observations and mitigates
the problem of the uneven distribution of the mosques over the time window analyzed. The
estimated coefficients (Table 5, column (7)) are slightly smaller but more precisely estimated
than the main results in Table 4, and still statistically significant in terms of both far-right
and far-left support.
A related concern is that our main specification implies that Muslim communities only
become visible during Ramadan or after a mosque has been built. This specification does
29 We prefer the square root to a logarithmic transformation as our dependent variables contain manyzeros. Square root transformation treats numbers of one and above differently than non-negativenumbers lower than one (Osborne, 2005). These regression results are unchanged if we take the squareroot of the share (i.e. 0-1) or percentage (i.e. 0-100) of the votes to far-right and far-left parties.
20
not take into account the fact that these religious groups may have been active and thus
visible before the official opening. Results are insensitive, though, to anticipating mosque
construction by five years (Table 5, column (8)).30
In Appendix Table A.2 we show similar results when we replace the mosque dummy
with the share of foreign born individuals living in a municipality as an alternative proxy
for the presence of Muslims (Panel A). Furthermore, we interact the Ramadan dummy with
the share of Muslims living in a county in 1987, i.e., Panel B of Table A.2.31
Muslims vote, too! A considerable share of Muslims are German citizens and thus
are entitled to vote at state and federal elections. We therefore cannot rule out that a part
of the estimated electoral effects is driven by a change in Muslims’ voting behavior. While
it is unlikely that Muslims vote for anti-Islam and xenophobe political parties, it could be
the case that far-left support is partially explained by changing voting patterns of Muslim
voters.
To assess the effect of Ramadan on Muslim voters, we draw from the European Social
Survey and construct a sample of about 10,000 Muslims in 35 countries over the period 2002
to 2017. This data contains information about the individual level of interest in politics
and political orientation on a 0-10 left to right scale, as well as gender, age and ISCED-
coded highest educational level. We use this information to assess the influence of being
interviewed during Ramadan on political interest and orientation, while holding constant
year of interview, month and country of interview, as well as gender, age and education.
Political interest is unrelated to the interview held during Ramadan, with a very small
and insignificant partial correlation (n = 13,733, β = −.017[.047]). The correlation be-
tween political orientation and interview held during Ramadan is larger in magnitude, but
insignificant, too (n=10,841, β = −.05[.045]). For the smaller set of observations (n= from
30 This specification allows us to further take into consideration the years between the beginning and theend of the construction works of mosques.
31 The information on the county-level population share of Muslims comes from the population census(Volkszählung) conducted in West Germany in 1987 (see Appendix B for details).
21
Germany (n=399), distributions for Muslims interviewed during or outside of Ramadan are
virtually identical. We conclude from these results that Muslims’ votes are unlikely to drive
the results on extremist parties on the left and right.
Timing of Ramadan and elections. Information that is further into the past is
likely to be less salient than more recently conveyed information (DellaVigna, 2009). We
therefore should expect the estimated effects to decline as the distance of the election to
the first day of Ramadan increases. What is considered to be a long-enough period for
features to loose their salience is an empirical question. We run separate regressions where
the definition of treated elections varies from two to six months after the start of Ramadan.
Figure 7 plots estimates of β2 from five different regressions for both far-right and far-left
parties. The specification is the same as in column (4) of Table 4, with standard errors
clustered at the municipality level.
The estimated effect declines over time. The share of treated observations is .95% for
elections within two months since the first day of Ramadan, 1.81% for elections within three
months, 2.19% for elections within four and five months and 2.61% for elections within six
months. It becomes statistically not significantly different from zero after the fifth month
since the first day of the Islamic month for the far-right parties. For the far-left parties, the
effect remains significant, although its magnitude reduced by half. Table A.2 in the Appendix
further provides regression results in which the Ramadan dummy has been replaced with a
continuous variable indicating the distance in days since the last Ramadan. The results are
robust and consistent with previous findings, showing that the effect on political extremism
declines as the election moves away from the start of Ramadan.
Permutation tests. We perform a permutation exercise to assess the validity of the
parametric standard errors of our main estimations and to ensure that our main results
are not driven by a “bad random draw” of treated observations. To provide evidence that
our results actually represent a meaningful effect exceeding random fluctuations in voting
22
outcomes, we randomly define elections to happen close to Ramadan, as well as artificially
distributing mosques to municipalities on a random basis.
In particular, we artificially assign mosques and Ramadan to municipality-election ob-
servations according to the actual share of treated observations. Repeating the procedure
5,000 times yields the distribution of of placebo estimates shown in Figure 8. In almost every
case, the placebo coefficients are lower than the “true” one. The estimated coefficient exceeds
about 99% and 100% of all simulated coefficients for the far-right and far-left dependent vari-
ables, respectively. The implied p-values for the hypothesis that |β2|Placebo > |β2|True are
close to zero for both far-right and far-left vote shares. The intuition is the following: if
the treatment had a significant effect on extremist votes, we would expect the estimated
coefficient to be in the upper tail of estimated placebo effects. These tests confirm that the
occurrence of Ramadan in municipalities with a mosque led to an unusually high level of
support for fringe political parties.
5.3 Individual attitudes
We analyze individual attitudes to shed light on the potential mechanisms behind the ef-
fect of increased Muslim salience on political preferences. We use the seventh wave of the
European Social Survey (ESS), which interviewed roughly 3,000 German residents between
August 2014 and February 2015. The European Social Survey provides data on Europeans’
attitudes, beliefs and behavior patterns. It is conducted every two years in European coun-
tries. A more detailed description of the ESS data can be found in the supplementary
appendix in Section B.
Do respondents differ in their expressed opinion about Muslims and their political orien-
tation when they are interviewed during Ramadan? We answer this question by exploiting
variations in the interview date with respect to Ramadan. We define individuals as exposed
if they are interviewed within three months after the start of Ramadan. We estimate
23
yi = γ0 + γ1Ramadani + εi, (2)
where yi is the outcome of respondent i and Ramadan is a dummy indicating whether the
interview took place within three months after the start of Ramadan. The share of treated
individuals is about 21%. Figure A.4 plots the share of respondents by date of interview.
The equation further includes controls for the state of residence and a set of individual
characteristics such as gender, age, education, country of birth and employment status. The
identification relies on the assumption that the time of the interview is as good-as-random,
and is not correlated with unobservable characteristics also influencing attitudes towards
minorities and political preferences.
The ESS provides information about respondents’ opinions towards minorities and immi-
gration, as well as political preferences and socio-economic characteristics.32 Table 6 reports
regression results for a wide range of outcomes considered. For each outcome, we report
three estimates: OLS with and without control variables as well as marginal effects from
an ordered probit specification. As first set of outcomes, we consider indicators of political
extremism constructed from the question on individuals’ placement on a left-to-right scale,
where 0 represents extreme left and 10 indicates far-right. Respondents interviewed during
and just after Ramadan indeed display more extremist political preferences than others.
When we distinguish between far-right (Panel B) and far-left (Panel C) extremism, both
extremes of the political spectrum are affected. However, the effect on the far-left is only
weakly significant.
Ramadan specifically influences attitudes towards Muslims compared to other ethnici-
ties. This test acts as a kind of placebo test: there is no reason to believe that Ramadan
should affect opinions against Jewish people. Panel D analyses the answers to the question
“Would you allow many or few Muslims to come and live in country?”. The respondent has
four choices ranging from “allow many” (1) to “allow none” (4). Regression results show that
32 Table A.7 reports descriptive statistics of all dependent variables analyzed.
24
treated individuals have less favorable attitudes towards Muslims than non-treated ones.
Replicating the same exercise with Jewish communities instead does not provide statisti-
cally significant differences (Panel E).
The higher salience of Muslims during Ramadan may create misperceptions about the
number of Muslim living in a municipality. We use answers to the question “Of every
100 people in Germany how many born outside Germany” to compute the log share of
perceived foreigners as dependent variable in Panel F. The perceived share of foreigners
increases by about 8% when the survey takes places within three months after the start of
Ramadan. Adding the full set of individual characteristics slightly increases the magnitude
of the estimated coefficient. We argue that this misperception is a likely mediator for the
observed effects in aggregated voting data.
We further show that surveyed individuals are more likely to agree with the sentence
“Better for a country if almost everyone shares customs and traditions” when interviewed
in the proximity of Ramadan (Panel G). This result is in line with the particular nature of
the salience shock of Ramadan which specifically highlights cultural dissimilarities between
minority and majority. During Ramadan, respondents also perceive “White” and “Christian”
as more desirable attributes of immigrants (Panel H).
5.4 Additional analyses
We now turn to a series of additional analyses on the heterogeneity of our main results and
the external validity in different settings – a broader sample of all-West German municipali-
ties, smaller geographical scale units (voting districts) in Berlin, and on potential spill-overs
of political extremism into violent behavior.
Heterogeneity by municipality and mosque characteristics. The aver-
age effect of salience might mask heterogeneity if either voters are heterogeneous in their
sensitivity towards raised salience or characteristics of mosques lead to differential increases
25
in visibility. In the following, we use information on the characteristics of mosques and
municipalities of the state of NRW to uncover this potential heterogeneity and shed light
on the type of voters of react the most.
Effects of salience potentially differ by the exposed population, which may differ in their
potential for fringe parties’ mobilization. Topics of immigration might have higher impact
in municipalities with difficult labor market conditions. We examine such heterogeneity in
columns (1) to (3) of Table 7. We interact the treatment variable with a dummy equal to
one for values above the median for municipal characteristics: population density, share of
18–24 years old and the gender ratio. We observe stronger polarization in municipalities
with a higher population density. Effects on the far-right are larger in areas with a younger
population structure. These observations are in line with descriptive characterizations of
far-right support being stronger among the young and in urbanized areas. The regression
results in column (3) show no statistically significant differences in municipalities where
there is a large male-to-female ratio.
Mosques differ strongly in their visibility, appearance and size. These differences might
mediate the effect of higher salience during Ramadan. To test for this heterogeneity, we
acquired additional data on the mosques in NRW: the height of the mosques’ minaret in
meters, the year of construction and whether they are located in a residential area. Results
of interactions of our treatment with the respective mosque characteristics are summarized
in columns (4) to (6) of Table 7. While both location in a residential area and minaret height
are a priori expected to increase the salience effect, they seem to effect different parts of the
electorate. Location in a residential area raises the effect of salience on extreme left support.
The height of minarets raises the effect on support for right-wing parties. The latter is in
line with the presence of minarets being an especially sensitive issue in the public debate,
which even has triggered calls for a ban of minarets in Germany and Switzerland.33 We do
33 In 2009, the Swiss People’s Party and the Federal Democratic Union proposed an initiative against theconstruction of minarets in Switzerland, which 57.5% of the Swiss electorate eventually approved. In2016, the party AfD backed an election manifesto calling for a ban on minarets in Germany.
26
not observe heterogeneity with respect to the time since construction of a mosque. This
suggests that the effect does not disappear over the years as the majority group becomes
acquainted with the minority group.
Elections across all West German States. To test for the robustness of our
observed pattern in a larger sample, we repeat the analysis at the municipality level on
78 federal and state elections that took place in West Germany between 1980 to 2013.34
Due to limited availability and lack of harmonization of federal statistics, this sample does
not include control variables on sociodemographic characteristics of cities. The number of
treated elections, i.e., within three months after the start of Ramadan, increases from four
to 20. However, the share of Ramadan ×Mosque treated observations decrease to 0.29%,
as there are fewer mosques outside NRW. Mosques in other German states are located
in 92 municipalities; these mosques are also more recent than the ones in NRW, as most
of them had been built in the last 15 years of the observed period. Relative to NRW,
municipalities in other German states are also much smaller in population size, as shown in
Table A.8. Overall, the final sample includes ten federal elections and 68 state elections in
8,311 municipalities. In total, we have 149,253 election-municipality observations.
Results summarized in Table 8 yield a similar pattern of polarization in response to
higher salience of Muslims as the NRW sample. In elections that happened within 90
days after the start of Ramadan right-wing fringe parties increase their vote share by 0.65
for municipality and election date fixed effects, we again observe a substantially stronger
polarization in municipalities with a mosque (column (2)). Far-left and far-right parties
increase their vote share by 0.387 p.p. and 0.309 p.p. (corresponding to 23% and 18%
of a standard deviation) respectively. Excluding observations from NRW, hence focusing
on a distinct sample than the one used in the main analysis does not change the observed
34 We are very thankful to Stephan Heblich and Robert Gold who provided us with their election data.
27
patterns (columns (4) to (5)). This makes us confident that the results of the main analysis
are not driven by outlier characteristics of single municipalities or elections in NRW.
We observe some differences compared to the main analysis. The mosque coefficients
turn out to be negative and statistical significant for far-right support; as we claimed before,
we cannot interpret this coefficient as casual: for instance, mosques may be built in munici-
palities that are more friendly to Muslims than others, such as municipalities in which there
is a decreasing support for far-right parties and increasing consensus for far-left parties. In
Appendix Table A.9, we show that our treatment variable does not significantly affect the
support for established parties, while there is a significant and positive effect on turnout.
Elections in Berlin. The results presented so far are based on municipalities differing
strongly in size, with an average population size of 44,000 inhabitants in NRW. Hence,
results on this aggregate geographical level might mask within-city dynamics and effect
heterogeneity on a closer neighborhood level in the response to higher salience of Muslims.
We use data for the electoral districts of Berlin over the 2006–2016 period to investigate such
heterogeneities in the effect of increased salience on political extremism at a very detailed
geographical level.35
The city state of Berlin has a population of about 3.5 million people. It is sub-divided
into twelve boroughs (Bezirk), comprising of about 160 smaller electoral districts (Wahlkreis)
with an average population of 1,700 people. Our sample covers two federal and three state-
level elections between 2006 and 2016: all elections aside from those in 2006 and 2016
happened within three months after the start of Ramadan.36 Besides voting outcomes,
we observe the number of foreigners and population size in any election for each electoral
district. The number of observed districts ranges from 1,709 to 2,501 over the period con-
35 The statistical office of Berlin does not provide information on previous elections at such geographicallevel. Data on Berlin elections at the municipality level are available since 1990.
36 The city of Berlin is both a city and a federal state. As for the state of NRW, federal elections tookplace on September 27, 2009 and September 22, 2013. State elections instead occurred on September17, 2006, September 18, 2011 and September 18, 2016.
28
sidered. Our final sample comprises 9,709 electoral district-election observations. A more
detailed description of the Berlin data can be found in Section B in the appendix.
We merge the election data with the location and dates of construction of all mosques
in Berlin. Using the exact address of each mosque we construct the distance from the
centroid of each electoral district. Figure 9 depicts the borders of electoral districts and
boroughs in Berlin: the color intensity of each electoral district varies depending on its
distance to the closest mosque. There are seven visible mosques in Berlin, all of which were
established prior to 2006. About 11% of all electoral district-election observations have a
mosque within 1,500m of their geographical centroid. Voter turnout is virtually the same
for electoral districts within or outside this 1,500m radius circle (47%), while vote shares
of right-wing parties are lower on average in proximity to mosque (2.0% vs 3.1%) (Table
A.10). Electoral districts in close proximity to mosques display a significantly higher share
of foreigners (23%) than those outside the 1,500m radius (12%).
We estimate a version of equation (1) where β2 estimates the interaction effect of the
exact (log) distance between each district and the closest mosque. Borders of electoral
districts change across elections. We therefore consider the dataset as a repeated cross-
section. Within each borough, the smaller geographical units of observations change over
time. In our main specification we include fixed effects for boroughs, the election date and
the election type.
Table 9 summarizes the regression results. Doubling the distance between a mosque
and the geographic centroid of an electoral district reduces the share of right-wing votes
by 0.7 percentage points in elections that happen within three months after the start of
Ramadan (column (1)).37 The inclusion of population controls in column (2) does not affect
our results. Columns (3) to (5) report results for specifications where the continuously
measured distance is replaced with a dummy equal to one when a mosque is within a 1,000,
1,500, or 2,000 meter radius, respectively. Blocks within a distance of 1,500 meters from
37 Using the linear distance instead of the logarithm provides similar results: each additional 100m distancebetween a district and a mosque reduces the far-right vote shares by 0.16 percentage points.
29
a mosque experience an increase of about 0.78 percentage points in far-right vote shares
during elections that happen during or just after Ramadan.
At this small geographical level, we do not find evidence of political polarization: if
anything, vote shares for the extreme left are reduced, although the coefficients remain in-
significant at any conventional confidence level. One plausible interpretation for this result
is that the increased salience of Muslims does not affect far-left support in the areas sur-
rounding a mosque; thus, there is no evidence that polarization occurs within the same
electoral district, although it could still arise at a more aggregate level, e.g., within a munic-
ipality. These results also suggest that the effect on the left-wing extremism is not due to a
direct exposure to Muslims, but rather could be driven by exposure to far-right rallies and
propaganda, i.e., second-order salience. We discuss this second-order salience mechanism
in more detail in Section 6. An alternative explanation relates to the political history of
Berlin, where far-left parties have been seen as established parties in contrast to West Ger-
many. In East Berlin, the predecessor of the party Die Linke held the incumbent position
in the German Democratic Republic (GDR) for about 40 years, and as such follows a more
centered program.
To investigate potential non-linear effects, we use more flexible specification using dif-
ferent distance categories in the relationship between distance and increased salience during
Ramadan. Figure 10(a) plots estimated effects on the far-left of the interaction between
the Ramadan variable and a set of dummies indicating the distance (grouped in 1,500 me-
ter intervals) of each electoral district to the nearest mosque. Blocks between 0 and 1,500
meters are used as comparison category. The figure reports coefficients from two separate
regressions: in the first one, the dependent variable is the vote shares for far-left parties
(dark-gray triangles), while in the second one (light-gray crosses) we excluded the party Die
Linke from the group of far-left parties. Using this non-linear specification, the effect on
the far-left increases with the distance to the nearest mosque. This suggests that the polar-
ization of the electorate does not happen in the same areas of the municipality. This effect
30
for far-left parties is stronger when we exclude the Die Linke party. The same regression
coefficients on the support for the far-right are shown in Figure 10(b): the effect becomes
smaller with the distance to the nearest mosque. The estimated effects at different distances
for each dependent variables are statistically different from each other.38
Taken together, the results of the estimations based on the Berlin sample are useful to
disentangle the aggregated polarization observed in the municipality-level data of NRW: The
results show that effects on the left and right appear to be driven by different neighborhoods.
Left-wing support in peripheral neighborhoods in response to a higher mosque salience
are consistent with a NIMBY (“Not in My Backyard”) explanation: close proximity to
Muslim communities generates negative attitudes of the majority group towards them; as
the distance increases, negative attitudes become attenuated, while support for left-wing
parties increases. This pattern is further at odds with a contact hypothesis as argued for
by Steinmayr (2016) who finds increased pro-immigration attitudes in response to direct
within-neighborhood contact with refugees.
Politically-motivated crimes. Thus far, our empirical findings have shown that
a change in the salience of a religious minority significantly affects the political preferences
of natives. We now investigate whether the increase in political extremism translates into
actions beyond voting, e.g., violent behavior against minorities. This section specifically
addresses this point by examining whether the change in Muslims’ salience during Ramadan
also affects the probability that a mosque is attacked.
We collected information on politically-motivated crimes against Muslims. Following a
parliamentary inquiry by the Die Linke party, the Federal Ministry of the Interior released
a list of “anti-Muslim” offenses that occurred between January 2001 and December 2011
across Germany. This list comprises 219 offenses against mosques, including vandalism
38 We reject the hypothesis of equality of coefficient in the three regressions as the F-statistics are highlysignificant; in particular, the F-statistics for the far-left, far-left (w/o Die Linke), and far-right are32.99, 9.34, and 11.31, respectively.
31
(e.g., swastika graffiti), death threats and arsons.39 The final sample used in this analysis is
a time series comprising 4,017 observations, i.e., each day from January 1, 2001 to December
31, 2011. We estimate the following linear probability model:
yt = θ0 + θ1Ramadant + εt (3)
where y is a dummy indicating whether an attack occurred on day t. Ramadan is a
dummy that switches on when day t is within 90 days after the start of Ramadan. We
augment the equation with controls for the day of the week, the day of the year and the
calendar month by interactions between month and year. Standard errors are clustered at
the week level to allow for arbitrary correlation of errors across the observations of the same
calendar week.40
Table 10 shows the regression results. In column (1), the estimated coefficient indicates
that the likelihood of attacks increases by four percentage points on days within three months
after Ramadan starts. This is a considerable increase given that the baseline probability is
about 5.3%. In column (2), we include a dummy indicating whether an offense happened the
day before t, as this may lower the likelihood that a mosque is attacked due to an increase
in police displacement around mosques. The estimated coefficient is almost unchanged. In
column (3), we split our explanatory variable into two different variables: a dummy for days
during Ramadan and another dummy indicating days in the second and third month after
the beginning of Ramadan. We expect offenses to be unlikely to happen during the festivity
given the increased number of Muslims going to the mosque at any time of the day. The
results show that the estimated effect turns to be positive but statistically not significant
39 The complete list can be found at the following website:http://dip21.bundestag.de/dip21/btd/17/095/1709523.pdf. This list may be incomplete, with severalMuslim organizations having complained that there is a large number of unreported offenses. Still,it displays the most comprehensive data available on violent attacks against Muslims. The datasetcontains information on crimes’ calendar date and type. The state of NRW experienced the largestnumber of attacks (79), followed by Baden-Württemberg, the second most populated state by Muslims.
40 These results are robust to a more conservative clustering of standard errors, e.g. clustering at thecalendar month level or the week level.
32
for days during Ramadan and positive and statistically significant for the days in the two
months after the end of Ramadan. We eventually run placebo regressions including a dummy
for days in the three months before, i.e., column (4): the estimated coefficient is smaller
than the ones in column (1) and not significant, thus confirming our intuition. In column
(5) we include dummies for 90–61 days and 60 days before Ramadan, analogous to column
(3). Since an attack on a mosque is more difficult to perform during Ramadan than during
other periods, crimes against Muslims may be postponed or anticipated. However, there is
no statistically significant reduction in crime on days during Ramadan nor an increase in
the days before the start of Ramadan.41
Figure 11 plots estimated coefficients of days since the start of Ramadan on the attack
probability. In practice, we modify model (3) by replacing the dummy Ramadan with a
set of dummies for each day since the start of the Ramadan. As we can only identify 354
coefficients, we restrict the coefficient of the first day of Ramadan to be zero. The model
additionally includes fixed effects for the calendar week. The figure shows a clear pattern
on the offense probability: it starts increasing after the second week of Ramadan, reaching
its peak in the third month and finally decreasing after the 120th day.
6 Discussion
6.1 Polarization
While it is straightforward to argue for an immediate reaction on the far-right of the political
spectrum to higher Muslim salience, the equivalent effects on the left appears counter-
intuitive at first. In the following, we provide a rationale for the political polarization that
we observe in both the NRW and Berlin results based on observed protest patterns of the
German left and right.
41 In order to prevent fixed effects creating an incidental parameters problem, we also run Poisson regres-sions (Cameron & Trivedi, 1998), which provide very similar estimates.
33
Where does the observed effect on the left stems from? While the German extreme
left occasionally served marginalized social groups with anti-globalization, anti-immigration
positions, extreme left platforms rather support open borders and “melting pot” policies.
Therefore, there is no obvious direct effect to be expected. Instead, we attribute the strong
equivalent response on the left to a counter-reaction of left-wing groups and increased sup-
port for left-wing parties triggered by increased right-wing support. This mechanism of a
“second-order salience” effect on the left is an artifact of the responsiveness of the left to
right wing activities. In Germany, the mobilization against the radical right is considered as
a huge identifying element of the radical left dating back to the 1960s (Backes, 2007; Jesse,
2013).42
We support this view by employing data on German protests from PRODAT, a compre-
hensive dataset on protest events in Germany between 1950 and 2002. We use information on
political background of protests (left vs right), whether a protest was considered a counter-
protest or triggered a counter-protest. The data reveal a robust pattern of differences in
the ability of the left and light in terms of topics and counter-protest culture. Figure 12
reveals a clear pattern. Almost 90% of left-wing protests with the relevant information in
the data are classified as being triggered by a right-wing protest, while only about a third
of right-wing protests are considered a counter-protest. Vice versa, while only a third of
left-wing protests triggered a right-wing counter-protest, almost 90% of right-wing protests
were accompanied by a left-wing counter-protest.
This pattern is mirrored in the political claims and topics, which are coded for a larger
number of protests: while about 10% of left-wing protests explicitly state to be a counter-
protest against right-wing activities, only about 2% of right-wing protests address explicitly
left-wing activities. Instead, responses to other fields of politics (foreigners, inner security
42 For example, a key goal of the left-wing German student movements (“movement of 1968”) was to dealwith the National Socialist past of their parents’ generation, in particular among the political elites ofpost-war West Germany (“Vergangenheitsbewältigung”). Further, increasing right-wing radicalism afterGermany’s reunification in 1990 gave rise to a massive counter-movement by the extreme political left(Rucht, 2013).
34
etc.) are much more prevalent. These numbers highlight the responsiveness of the left
to increased right-wing support and support the rationale of marginal left-wing supporters
being pushed to more extreme positions when experiencing higher levels of right-wing sup-
port which again was triggered by the higher salience of minorities, ultimately leading to a
polarization of the electorate.
6.2 Economic significance
Increased Muslim salience affects voting, individual attitudes and hate crimes. Overall,
our findings confirm anecdotal evidence that the growth and thus the increased visibility
of Muslim communities have polarized the German electorate. Given that the increase in
Muslim salience through Ramadan will only temporarily affect a very small portion of the
environment, this robust effect on different outcomes points to a high level of responsiveness
to minority salience. The effects on individual attitudes even point to a malleability of
preferences through the salience of topics; these findings have not been demonstrated in
field settings before.
Besides this conceptual contribution, we see at least three further reasons for the eco-
nomic significance of our results. First, while the actual size of the estimates is moderate
and not sufficiently large to allow any representative of these extremist parties to win a seat
in parliament, even small changes in right-wing voting outcomes receive disproportionate
public attention and media coverage due to Germany’s history of National Socialism be-
tween 1933 and 1945. In response, moderate political parties may marginally adjust their
party agenda on the supply side to accommodate more extreme opinions. Hence, minority
salience may have a more pronounced impact on the equilibrium of political competition
in a given election than actual voting outcomes suggest. Second, in the light of recent ex-
perimental results by Bursztyn et al. (2017), increased aggregate voting shares expressing
extremist opinions convey information about the public acceptance of extremist positions.
Facilitated by disproportionate media attention, a perceived higher acceptance of extremist
35
positions makes public expression of these positions less costly. Third, increased vote shares
for extremist parties may have longer-run effects if they tip them across the threshold for
making parties eligible for Germany’s system of public funding of political parties. These
additional resources can be used for subsequent election campaigns.43
Finally, the question arises how our estimates of a minority salience effect relate to the
far-right surge in the 2017 elections in Germany, resulting in a right-wing party winning
94 seats in the national parliament. Previous studies (Dippel et al. , 2015; Autor et al. ,
2016) have shown that local economic conditions are behind the rise of right-wing populism
throughout Europe and the increasing polarization of US politics (Autor et al. , 2016); we
therefore test how the electoral effects of a shock to minority salience change with economic
downturns. Table A.11 shows regression results for a triple interaction between the presence
of a mosque, the occurrence of Ramadan and employment growth in the municipality. In-
deed, the salience effect appears to interact with local economic conditions. A one-standard
deviation decrease in the employment growth rate more than doubles the salience effect on
far-right parties. This result is in line with previous results on the idea that the coexistence
of different ethnic groups increases political polarization and support for extremist parties
when coupled with some economic or political shocks (Grosfeld et al. , 2013; Dippel, 2014;
Sakalli, 2016). Hence, our findings show that changes in Muslims’ visibility only affect small
shares of the electorate, but this is significantly amplified when these changes coincide with
bad economic conditions.
43 In the 2012 NRW State elections, the total number of votes that a party should have received to becomeeligible for public funding was roughly 80,000 votes, i.e. 1% of the valid votes, or about 200 votes onaverage in each of the 396 municipalities. The average increase in the vote share of far-right partiesestimated in Panel A of Table 4 translates into about 110 votes in municipalities with a mosque andelections just after Ramadan. The right-wing party Pro-NRW became eligible for public funding ofabout 120,000 euros each year until the next state elections (source: “Festsetzung der staatlichen Mittelfür das Jahr 2014").
36
7 Conclusion
In this paper, we show a causal link between the exposure of natives to Muslim communities
and political extremism. We use the increased salience of Muslim communities during Ra-
madan as a natural experiment to estimate the causal effect of Muslim salience on German
election results as well as individual attitudes and hate crimes in a difference-in-differences
framework. We thus examine how elections happening closely after Ramadan have differ-
ential vote shares for extremist parties in municipalities with and without the presence of a
mosque.
Both right- and left-fringe parties gain substantial support in response to higher salience
of Muslims. Effects on right-wing party support are amplified during economic downturns.
Individual level attitudes reveal that people interviewed during Ramadan have less favorable
attitudes towards Muslims and they also perceive a larger share of foreign-born living in the
country. In addition, immigration concerns play a bigger role in determining individual
political orientation during Ramadan. Finally, in addition to the effect on voters’ behavior,
we also find a considerable effect on politically-motivated crime: the likelihood that a mosque
is attacked or damaged significantly increases in the two months after Ramadan.
While previous studies have primarily focused on the (relative) size of the immigrant
population, this paper investigates the role of visibility of minorities. The effect on the right
may be explained to two different mechanisms: a higher issue salience of immigration- and
cultural identity-related topics, and a higher in-group bias through more salient cultural
differences. We explain the equivalent effect on the left through a “second-order” salience
effect in which the left gains support only through counter-rallies and protest behavior
against increased right support.
These results add to the evidence of negative implications of ethnic diversity in the
short run, such as increased social unrest and political polarization. Social conflicts, hostil-
ity and prejudice against particular ethnic or religious minorities ultimately increase their
costs of assimilation and hence their integration in the host country (Gould & Klor, 2015;
37
Charles et al. , 2017). In order to address these undesirable ramifications, policy-makers
should ensure the better integration of religious minorities; for example, by improving ex-
change between Muslim and native groups and opposing social segregation along cultural
and religious lines within communities. Finally, we argue that our results contribute to our
understanding of the determinants of voting behavior by illustrating how increased salience
of religious minorities may nudge marginal voters towards more extremist positions.
38
References
Adida, Claire L., Laitin, David D., & Valfort, Marie-Anne. 2016. “One Muslim is
Enough!” Evidence from a Field Experiment in France. Annals of Economics and Statistics,
121–160.
Akay, Alpaslan, Karabulut, Gökhan, & Martinsson, Peter. 2013. The effect of religiosity
and religious festivals on positional concerns–an experimental investigation of Ramadan. Applied
Economics, 45(27), 3914–3921.
Alesina, Alberto, & La Ferrara, Eliana. 2002. Who trusts others? Journal of Public
Economics, 85(2), 207–234.
Alesina, Alberto, & La Ferrara, Eliana. 2005. Ethnic diversity and economic performance.
(eds), Handwörterbuch des politischen Systems der Bundesrepublik Deutschland. Springer.
43
Sakalli, Seyhun Orcan. 2016. Coexistence, Religiosity, and Education: The Armenian Legacy
in Modern Turkey. Tech. rept. Paris School of Economics, mimeo.
Satyanath, Shanker, Voigtländer, Nico, & Voth, Hans-Joachim. 2017. Bowling for
fascism: social capital and the rise of the Nazi Party. Journal of Political Economy, 125(2),
478–526.
Schmitt, Karl, Rattinger, Hans, & Oberndörfer, Dieter. 1994. Kreisdaten (Volkszählun-
gen 1950–1987). GESIS Datenarchiv, Köln. ZA2472 Datenfile Version 1.0.0, doi:10.4232/1.2472.
Schmitt, Thomas. 2003. Moscheen in Deutschland. Konflikte um ihre Errichtung und Nutzung.
Dissertationsschrift TU München.
Steinmayr, Andreas. 2016. Exposure to Refugees and Voting for the Far-Right:(Unexpected)
Results from Austria. IZA Discussion Paper.
Stoop, David Christopher. 2016. Moscheedebatten in Deutschland zwischen Religionsfreiheit
und antimuslimischer Propaganda. In: Rassismuskritik und Widerstandsformen. Springer forth-
coming.
Tajfel, Henri. 1982. Social Psychology of Intergroup Relations. Annual Review of Psychology,
Vol. 33, 1–39.
Taylor, Shelley E, & Thompson, Suzanne C. 1982. Stalking the elusive" vividness" effect.
Psychological Review, 89(2), 155.
Turner, J. C. 1981. Intergroup behavior. University of Chicago Press. Chap. The experimental
social psychology of intergroup behavior, pages pp. 66–101.
44
Figures and Tables
Figure 1: The geographical distribution of Muslims across German states
BWBY
BE
BB
HB
HH
HE
MV
NI
NRW
RP
SL
SN
ST
SH
TH
% Muslims(20,35](15,20](10,15](5,10](1,5][0,1]
Notes: Authors’ calculations on data provided by the report “Muslim Life in Germany” (2009). The figureplots the estimated number of Muslims residing in each German state as a proportion of the total Muslimpopulation in 2008.
45
Figure 2: Mosques’ diffusion in North Rhine-Westphalia
Notes: The figure shows the diffusion of mosques across municipalities in the state of NRW by decade from1980 to 2010. Black-colored areas indicate municipalities where at least one mosque is present.
46
Figure 3: Ramadan cycle and election dates
LW80
BW80
BW83
LW85
BW87
LW90
BW90
BW94
LW95
BW98
LW00
BW02
LW05
BW05BW09
LW10LW12
BW13
jan
feb
mar
apr
may
jun
july
aug
sep
oct
nov
dec
Mon
th
1979
1980
1981
1982
1983
1984
1985
1986
1987
1988
1989
1990
1991
1992
1993
1994
1995
1996
1997
1998
1999
2000
2001
2002
2003
2004
2005
2006
2007
2008
2009
2010
2011
2012
2013
Year
Ramadan Election
Notes: Black squares indicate the week of the year in which Ramadan started; year 1997 is the leap year.Red x-symbols represent the week of the year in which the election took place. The labels BW and LWrefer to federal (Bundestagswahlen) and state elections (Landtagswahlen), respectively.
47
Figure 4: Municipalities with mosques, election dates and distance to Ramadan
010
2030
4050
60M
unic
ipal
ities
with
Mos
ques
030
6090
120
150
180
265
365
Day
s si
nce
Ram
adan
sta
rt
11may
1980
05oc
t1980
06mar1
983
12may
1985
25jan
1987
13may
1990
02de
c199
0
16oc
t1994
14may
1995
27se
p199
8
14may
2000
22se
p200
2
22may
2005
18se
p200
5
27se
p200
9
09may
2010
13may
2012
22se
p201
3
Elections
Bundestagswahlen Landtagswahlen Mosques
Notes: Vertical bars on the left y-axis show the distance (in days) of each election to the beginning dateof the last Ramadan; dark-gray and light-gray bars indicate federal (Bundestagswahlen) and state elections(Landtagswahlen), respectively. On the right y-axis, the dashed line reports the number of municipalities inwhich at least a mosque is present.
48
Figure 5: Ramadan coverage by national news program
Notes: The figure plots weekly data on coverage by German national news programs Tagesschau andTagesthemen of the term Ramadan over the period 2013–2016. Highlighted areas indicate weeks duringRamadan. Coverage indicates the number of times in a week the term Ramadan has been reported in thesetwo shows.
49
Figure 6: Muslim-related Google searches and tweets(a) Google searches by cities 2014–2018
�
���
���
���
*RRJOH�VHDUFKHV�IRU�0
XVOLP
�UHODWHG�WHUPV
�� �� �� �� 6WDUW�5DPDGDQ (QG�5DPDGDQ � � �
0RQWK�UHODWLYH�WR�VWDUW�RI�5DPDGDQ
ZLWK�PRVTXH
Z�RXW�PRVTXH
(b) Tweets by cities from April to August 2018
050
010
0015
0020
00Tw
eets
for M
uslim
-rela
ted
term
s
April 25 Start Ramadan End Ramadan August 24Date
with mosque
w/out mosque
Notes: Panel (a) draws averages of monthly city-level Google searches for Muslim, Ramadan, Mosque,and Islam in German cities with (N=141) and without mosques (N=392). The sample covers cities with apopulation of at least 10,000 and covers the period September 2014 to August 2018. Panel (b) plots averagesof weekly city-level Tweets for Muslim, Ramadan, Mosque, and Islam in cities with (N=53) and withoutmosques (N=343) in the State of NRW. The sample covers the period April 23rd to August 24th 2018.
50
Figure 7: Electoral effect and distance to Ramadan
.03
0.1
5M
osqu
e*R
amad
an
30 60 90 120 150 180Days after Ramadan
95% CI
90% CI
Far-Right.1
90
.38
Mos
que*
Ram
adan
30 60 90 120 150 180Days after Ramadan
95% CI
90% CI
Far-Left
Notes: The figure plots estimated coefficients from separate regressions in which the definition of treatedelection varies from 2 months to 6 months since the start of Ramadan. All regressions include the same setof controls as in Table 4, Column (4). The vertical lines denote 95% and 90% confidence intervals based onstandard errors clustered at the municipality level.
51
Figure 8: Permutation Tests
05
1015
Den
sity
0 .117Estimated placebo coefficients
Implied p-value = .0032
Far-Right
02
46
810
Den
sity
0 .352Estimated placebo coefficients
Implied p-value = 0
Far-Left
Notes: The figure plot the distribution of placebo coefficients obtained by estimating regression (2) with ajoint “placebo” mosque dummy and Ramadan dates. All regressions include the same set of controls as inTable 4, Column (4). Placebo mosques and dates have been obtained by randomly assigning mosques tomunicipalities and Ramadan treatment to election dates. We repeated this procedure 5,000 times. Verticaldashed lines report the true coefficient, i.e. Column (4) Table 4. The implied p-values are computed as thenumber of placebo parameters above the true coefficient over the number of repetitions, i.e. 5,000.
52
Figure 9: Mosques and electoral districts in Berlin
Distance to mosques (2500,35000](2000,2500] (1500,2000](1000,1500] [0,1000]
Notes: The figure shows the distribution of mosques (red dots) across electoral districts in Berlin in 2016.Districts are shaded according to the distance towards the closest mosque. Yellow dashed lines indicate thetwelve boroughs’ borders.
53
Figure 10: Electoral effect and distance to the mosque - Berlin(a) Far-left parties
-2-1
01
23
45
<1.5 1.5-3 3-4.5 4.5-6 6-7.5 7.5-9 9-10.5 10.5-12 12-13.5 13.5-15 15-16.5 16.5-18 18-19.5 19.5-21 >21Distance to the nearest mosque
Far-left 90% CI
Far-left (w/o DieLinke) 95% CI
(b) Far-right parties
-7-6
-5-4
-3-2
-10
12
<1.5 1.5-3 3-4.5 4.5-6 6-7.5 7.5-9 9-10.5 10.5-12 12-13.5 13.5-15 15-16.5 16.5-18 18-19.5 19.5-21 >21Distance to the nearest mosque
95% CI
90% CI
Notes: The figure shows regression coefficients of the interaction between the Ramadan variable and a set ofdummies indicating the distance of each electoral district to the closest mosque. In Panel (a), the dark-graytriangles report the estimated effects on the vote share for far-left parties; the light-gray crosses indicatethe estimated effects on the vote shares for the far-left parties excluding the party Die Linke. The averagevote share for far-left parties without Die Linke is .44. The dependent variable in Panel (b) is the voteshare for far-right parties. The distance-to-mosque dummies group electoral districts in intervals of 1,500meters. The coefficient for electoral districts within 1500-meter away from the mosque has been normalizedto zero, estimates of this coefficient are shown in Table 9 The vertical lines denote 95% and 90% confidenceintervals based on standard errors clustered at the level of the interaction between the year and the borough.The test for joint significance of the coefficients at different distances for the Far-left, Far-left (without DieLinke), and Far-right regressions produces F-Stats equal to: 11.31 (p-value=0.000), 32.99 (p-value=0.000),and 9.34 (p-value=0.000) respectively.
54
Figure 11: Attacks on mosques and days after the start of Ramadan
-1
0
1
2
1 30 60 90 120
150
180
210
240
270
300
330
354
Days since Ramadan
95% CI
90% CI
Notes: The figure plots estimated coefficients of dummies for each day since the start of Ramadan onthe attack on a mosque. The baseline is the first day of Ramadan. Vertical lines indicate 95% and 90%confidence intervals. Standard errors are clustered at the calendar week level.
55
Figure 12: Left and right protests by topic and trigger
0
.2
.4
.6
.8
n = 160
Is counter-protest (left)Is counter-protest (right)
0
.2
.4
.6
.8
n = 222
Triggered protest (left)Triggered protest (right)
0
.2
.4
.6
.8
n = 1656
Counter-right topic if leftCounter-left topic if right
Notes: The left panel displays shares of left and right protests which can be clearly assigned as addressingthe political oppenent instead of contentual topics. The middle panel displays shares of left and righttopics which are characterized as counter-protests. The right panel displays shares of left and right protestswhich have triggered a direct counter-protest. Numbers of observations with relevant information. Owncalculations using PRODAT database.
56
Table 1: Established, right- and left-wing parties
Established Right-Wing Left-Wing
CDU NPD DKPSPD REP KPDGRÜNE DVU KBWFDP DIE RECHTE MLPD
ProDEU/ProNRW PSGOKOLIDie LinkePDSWASG
Notes: Party lists include further minor fringe parties who only ran in single elections. The exclusionof these minor parties does not affect results in magnitude or significance. Abbreviations are ChristianDemocrats (CDU ), Social Democrats (SPD), Liberal Party (FDP), Green Party (GRÜNE ), NationalDemocratic Party of Germany (NPD), Republicans (REP), German People’s Union (DVU ), Die Rechte(DIE RECHTE ), Alternative for Germany (AfD) Pro Germany Citizens’ Movement (Pro-NRW, GermanCommunist Party (DKP), Communist Party of Germany (KPD), Kommunistischer Bund Westdeutsch-land (KBW ), Marxist-Leninist Party of Germany (MLPD), Social Equality Party (PSG), Eco-Social Left(OKOLI ) Left Party (Die Linke), Party of Democratic Socialism (PDS ) Electoral Alternative for Labourand Social Justice (WASG).
Table 2: Balancing tests
Eligible Voters Employed Foreigners Pop Density Female(1) (2) (3) (4) (5)
Controls:Municipality*Election type YElection date YObservations 7,128
Notes: * p<0.10, **p<0.05, ***p<0.01. Mosque × Ramadan is a dummy switching on when the election dateis within 3 months since the start of Ramadan and a mosque is located in the municipality. Standard errors areclustered at the municipality level. The dependent variables are the log number of eligible voters, private sectoremployees, foreign residents, the population density and the share of women.
57
Table 3: Omnibus tests(1) (2) (3)
Panel A: Far-right (%)Mosque 0.3069∗∗∗ 0.3054∗∗∗
(0.0104) (0.0120)
Ramadan 0.0009 -0.0028(0.0069) (0.0068)
Ramadan × Mosque 0.0064(0.0242)
Panel B: Far-left (%)Mosque 0.4982∗∗∗ 0.4952∗∗∗
(0.0152) (0.0175)
Ramadan 0.0070 0.0008(0.0102) (0.0099)
Ramadan × Mosque 0.0119(0.0353)
Observations 7,128
Notes: * p<0.10, **p<0.05, ***p<0.01. The omnibus test uses the set ofcontrols used in Table 4 (foreigners (%), female (%), population density,the log number of private sector employees) to predict the vote share offringe parties. The predicted values are then regressed on the explanatoryvariables (Mosque, Ramadan, Mosque × Ramadan).
(0.3086) (0.1299) (0.1242)Control group mean 76.2607
Controls:Municipality*Election type N N Y YElection date N N Y YMunicipality characteristics N N N YObservations 7,128
Notes: * p<0.10, **p<0.05, ***p<0.01. The dependent variables are expressed as percentage of the eligiblevoters (0-100). Standard errors are clustered at the municipality level. Mosque is a dummy indicating thepresence of a mosque in the municipality. Ramadan×Mosque is a dummy switching on when the electiondate is within 3 months after the start of Ramadan and a mosque is located in the municipality. The shareof Ramadan ×Mosque treated observations is 1.80%. Column (1) only includes a fixed effect for the typeof the election, i.e. Federal or State election. Election date fixed effects are collinear to election fixed effects.Characteristics of the municipalities included are: population density, share of women, share of foreignersand the log number of private sector employees. Control group means refer to the mean of the dependentvariables when the Ramadan and the mosque dummies are both equal to zero.
59
Table5:
Rob
ustnesschecks
Tim
etrends
Outliers
Mosqu
eop
ening
(1)
(2)
(3)
(4)
(5)
(6)
(7)
(8)
Pan
elA:Fa
r-righ
t(%
))Mosqu
e0.0095
-0.070
1*-0.041
7-0.0059
0.02
32(0.051
1)(0.038
6)(0.046
8)(0.017
9)(0.038
5)Ram
adan×
Mosqu
e0.11
05***
0.09
63**
*0.08
22**
0.10
81**
*0.04
52**
*0.1088
**(0.035
8)(0.031
6)(0.033
4)(0.034
1)(0.014
6)(0.050
1)Ram
adan×
EverMosqu
e0.09
09**
*(0.030
8)Ram
adan×
Mosqu
e(t-5)
0.12
07**
*(0.038
0)
Pan
elB:Fa
r-left
(%)
Mosqu
e-0.030
10.07
87-0.0208
0.01
680.12
55**
*(0.058
8)(0.075
6)(0.096
0)(0.016
8)(0.048
7)Ram
adan×
Mosqu
e0.27
45***
0.30
04**
*0.25
58**
*0.24
95**
*0.0342
***
0.23
46*
(0.053
2)(0.055
9)(0.047
1)(0.048
4)(0.011
6)(0.132
9)Ram
adan×
EverMosqu
e0.20
98**
*(0.042
7)Ram
adan×
Mosqu
e(t-5)
0.31
99**
*(0.058
1)
Con
trols:
Mun
icipality
*Electiontype
YY
YY
YY
YY
Electionda
teY
YY
YY
YY
YMun
icipality
Linear
Trend
YN
NN
NN
NN
10Year*Mun
icipality
NY
NN
NN
NN
5Year*Mun
icipality
NN
YN
NN
NN
Linear
Tim
eTr
end*
Mosqu
eN
NN
YN
NN
NObservation
s7,12
8
Notes:*p<
0.10
,**
p<0.05
,**
*p<0.01
.Stan
dard
errors
areclustered
atthemun
icipalitylevel.
InColum
n(1),
wead
ded
alin
eartimetrend
interacted
withmun
icipalityfix
edeff
ects.Colum
ns(2)an
d(3)includ
eten-
andfiv
e-year
dummiesinteracted
withmun
icipalityfix
edeff
ects.Colum
n(4)introd
uces
alin
eartimetrendinteracted
withthedu
mmyforthepresence
ofamosqu
e.In
Colum
n(5),thedepe
ndentvariab
leha
sbe
entran
sformed
bytaking
itssqua
reroot,w
hile
Colum
n(6)repo
rtscoeffi
cients
from
medianregression
s.The
variab
leEverM
osqu
eindicatesmun
icipalitiesthat
ever
hadamosqu
e;M
osqu
e(t−5)
isadu
mmyforthepresence
ofamosqu
ein
which
wean
ticipa
tedtheyear
ofop
enings
byfiv
eyears.
60
Table 6: Ramadan and individual attitudesOLS Probit Obs.
(1) (2) (3)
Panel A: Political extremismRamadan 0.0263*** 0.0235** 0.0221***
Panel G: Cultural dissimilarities attitudesRamadan 0.0232** 0.0207** 0.0201***
(0.0092) (0.0090) (0.0067) 3,008
Qualification for immigrantsPanel H1: Being whiteRamadan 0.0063* 0.0061* 0.0062**
(0.0032) (0.0033) (0.0025) 3,009Panel H2: Being ChristianRamadan 0.0080** 0.0068* 0.0071**
(0.0036) (0.0037) (0.0028) 3,008Panel H3: Being educatedRamadan 0.0003 -0.0078 0.0015
(0.0136) (0.0129) (0.0133) 3,007
ControlsRegion FE Y Y YIndividual characteristics N Y N
Notes: Data from the 7th wave of the European Social Survey. Columns (1) and (2)report OLS regressions, while Column (3) shows marginal effects from probit regressions.Standard errors are clustered at the level of the interaction between the region and thecalendar month. Individual characteristics are age, gender, country of birth, educationlevel and employment status. Dependent variables are dummy variables equal to one ifthe respondents place themselves at the extreme left (Panel C), right (Panel B), or both(Panel A) on the left right scale. The dependent variable is equal to one if the respondentsthink that “none” or “a few” Muslims (Panel D) or Jewish people should be allowed tolive in the country. Panel F analyses the perceived (log) share of immigrants living in thecountry, while the dependent variable in Panel G is equal to one if respondents “stronglyagree” with the statement “Better for a country if almost everyone shares customs andtraditions". Panel H finally looks at respondents who think that “being white” (Panel H1),“being Christian” (Panel H2), and “having good educational qualifications” are “extremely”important requirements for immigrants. Ramadan is a dummy equal to one if the interviewtook place within three months since the start of Ramadan.
61
Table7:
Heterog
eneous
effects
Municipality
Mosqu
ePop
density
Pop
(18-24)
GenderRatio
Residential
Minaret
Years
(1)
(2)
(3)
(4)
(5)
(6)
Pan
elA:Fa
r-righ
t(%
)Ramadan×Mosque×Median
0.4025***
0.2227***
0.0777
0.0880
0.1859***
0.1383
(0.0759)
(0.0822)
(0.0926)
(0.0699)
(0.0714)
(0.0869)
Pan
elB:Fa
r-left
(%)
Ramadan×Mosque×Median
0.4633*
-0.1696
-0.0133
0.2432**
0.0752
0.1219
(0.2423)
(0.1581)
(0.1383)
(0.1096)
(0.1323)
(0.1348)
Con
trols:
Mun
icipality
*Electiontype
YElectionda
teY
Observation
s7,128
Notes:*p<
0.10,*
*p<0.05,*
**p<
0.01.Stan
dard
errors
areclusteredat
themun
icipalitylevel.
The
tableon
lyrepo
rtscoeffi
cients
ofthetriple
interactionM
osqu
e×
Ramadan×
Median,which
isadu
mmyindicating
mun
icipalities’
values
abovethemed
ianforeach
characteristic
ofthemun
icipalityor
mosqu
e.Pop
(18-24)is
theshareof
mun
icipality’sresidentsaged
18to
24.Genderratiois
the
ratioof
maleto
femaleresidentsaged
18-49.
Pop
densityis
themun
icipality’spo
pulation
density.
Residential
isadu
mmyindicating
ifthemosqu
eislocatedin
aresidentiala
rea.
Minaret
indicatestheheight
ofthemosqu
e’sminaret.Years
referto
themediannu
mbe
rof
yearssincethemosqu
ewas
establishedin
amun
icipality,
i.e.12
years.
62
Table 8: Ramadan and electoral outcomes in West GermanyWest Germany w/out NRW
Controls:Municipality*Election type N Y Y Y YElection date N Y Y Y YObservations 152,418 152,123 152,123 144,995 144,995
Notes: * p<0.10, **p<0.05, ***p<0.01. Standard errors are clustered at the county level. Columns (1) to(3) include elections in Western Germany from 1980 to 2013. Columns (4) to (5) exclude from the sampleelections in NRW. Column (1) only includes a fixed effect for the type of the election, i.e. Federal or Stateelection. Columns (2) and (4) include the full set of fixed effects as in Table 4, Column (3). Columns (3)and (5) report estimates of a regression in which the Mosque dummy has been replaced by an Ever Mosquedummy, as in Table 5, Column (7).
63
Table 9: Ramadan and electoral outcomes in BerlinDistance Radius
Controls:Election type Y Y Y Y YElection date Y Y Y Y YBorough Y Y Y Y YForeigners (%) N Y Y Y YObservations 9,709
Notes: * p<0.10, **p<0.05, ***p<0.01. The dependent variables are expressed as percentage of theeligible voters (0-100). Standard errors are clustered at the interaction between the borough and theelection. In Columns (1) and (2) DistanceMosque indicates the log distance to the closest mosque. InColumns (3) to (5) DistanceMosque is equal to 1 in the presence of a mosque within a defined radiusaround the geographic centroid of an electoral district. Ramadan is a dummy switching on when theelection date is within 3 months after the start of Ramadan.
Ramadan before 0.0124(90 days before) (0.0201)Ramadan before 0.0250(90-61 days before) (0.0223)Ramadan before -0.0025(60 days before) (0.0220)Controls:Day of the week Y Y Y Y YDay of the year Y Y Y Y YMonth*Year Y Y Y Y YAttacks t-1 N Y N N NObservations 4,017Mean dep. Var. 0.0533SD dep. Var. 0.2246
Notes: * p<0.10, **p<0.05, ***p<0.01. Standard errors clustered at the calendar weeklevel. The dependent variable is the probability of attack on a mosque in Germany. Dataare daily and cover the period 1/1/2001-31/12/2011. Ramadan is a dummy switching onwhen the day is within 3 months after the start of Ramadan.
65
A Appendix Tables and Figures
66
Figure A.1: Anecdotal evidence(a) Pro Köln rally (b) Anti Pro Köln
(c) Iftar at the Merkez-Moschee in Duisburg (d) Festiramazan in Dortmund
Sources: Figure (a) de.indymedia.org/2008/09/227906.shtml. Figure (b)www.nrhz.de/flyer/beitrag.php?id=16499. Figures (c) and (d) ruhrblogger.de/ramadan-im-ruhrgebiet.Figures (e) and (f) were taken from Google Street View.
Figure A.3: Muslim-related Google searches and Tweets - Residuals(a) Google searches by cities 2014–2018
���
�
��
���
���
*RRJOH�VHDUFKHV�IRU�0
XVOLP
�UHODWHG�WHUPV���5
HVLGXDOV
�� �� �� �� 6WDUW�5DPDGDQ (QG�5DPDGDQ � � �
0RQWK�UHODWLYH�WR�VWDUW�RI�5DPDGDQ
ZLWK�PRVTXH
Z�RXW�PRVTXH
(b) Tweets by cities from April to August 2018
-10
010
20Tw
eets
for M
uslim
-rela
ted
term
s - R
esid
uals
April 25 Start Ramadan End Ramadan August 24Date
with mosque
w/out mosque
Notes: Panel (a) draws residuals from a regression of monthly city-level Google searches for Muslim,Ramadan, Mosque, and Islam on city and year-by-month fixed effects for cities with (N=141) and withouta mosque (N=392). The sample covers cities with a population of at least 10,000 and covers the periodSeptember 2014 to August 2018. Panel (b) plots residuals from a regression of weekly city-level Tweets forMuslim, Ramadan, Mosque, and Islam on city and week fixed effects for cities with (N=53) and without amosque (N=343). The sample covers the period April 25th to August 24th 2018.
69
Figure A.4: Interview dates and Ramadan - ESS 7th Wave
010
2030
4050
Res
pond
ents
(#)
01sep2014 01oct2014 01nov2014 01dec2014 01jan2015 01feb2015Interview date
Ramadan No-Ramadan
Notes: The figure plots the number of respondents by date of the interview. Dark grey bars indicate dateswithin 90 days after the start of Ramadan.
Notes: The table reports averages of electoral results and municipalities’ characteristicsat each election over the time window analyzed across NRW municipalities. The tabledistinguishes between municipalities that have ever had a mosque (53) and those that havenot (343).
71
TableA.2:NRW
Elections,foreign
ersan
dda
yssinceRam
adan
Far-righ
t(%
)Fa
r-left
(%)
Estab
lished(%
)Tu
rnou
t(%
)(1)
(2)
(3)
(4)
(5)
(6)
(7)
(8)
Pan
elA:%
Foreigners
Foreigners
-0.009
80.00
57-0.067
0*-0.067
3*-0.065
5-0.017
4-0.219
6-0.138
0(0.022
9)(0.022
2)(0.037
6)(0.035
5)(0.226
4)(0.229
4)(0.177
2)(0.186
3)Fo
reigners×
Ram
adan
0.04
19**
*0.04
33**
*0.09
95**
*0.10
10**
*-0.310
7***
-0.319
1***
-0.148
6***
-0.1519*
**(0.011
6)(0.011
7)(0.019
0)(0.018
8)(0.064
4)(0.063
3)(0.044
9)(0.043
4)
Pan
elB:Shareof
Muslim
sin
1987
Muslim
s19
87×
Ram
adan
0.06
23**
*0.06
25**
*0.14
86**
*0.14
46**
*-0.371
9***
-0.364
3***
-0.132
0**
-0.1304*
*(0.009
2)(0.009
2)(0.011
6)(0.011
2)(0.067
8)(0.067
6)(0.064
0)(0.063
8)
Pan
elC:DaysafterRam
adan
Mosqu
e0.14
80**
0.13
10**
0.5009
***
0.4694
***
-1.733
9***
-1.461
4***
-0.856
2**
-0.6535*
(0.059
8)(0.057
1)(0.101
9)(0.101
9)(0.432
6)(0.402
7)(0.379
3)(0.367
4)Mosqu
e×
Day
s-0.000
4***
-0.000
4***
-0.001
0***
-0.001
0***
0.00
37**
*0.00
37**
*0.00
15**
*0.00
15**
*(0.000
1)(0.000
1)(0.000
2)(0.000
2)(0.000
6)(0.000
6)(0.000
5)(0.000
5)
Pan
elD:Weigh
tedRegressions
Mosqu
e0.05
390.00
780.2289
***
0.13
74-0.011
10.35
300.28
030.4870
(0.073
9)(0.053
8)(0.075
5)(0.085
1)(0.461
0)(0.443
7)(0.416
7)(0.423
9)Ram
adan×
Mosqu
e0.10
06*
0.10
60**
0.37
39**
*0.36
98**
*-0.888
7***
-0.850
9***
-0.246
1-0.209
7(0.056
6)(0.052
1)(0.067
0)(0.061
7)(0.208
6)(0.156
4)(0.160
4)(0.131
8)
Con
trols:
Mun
icipality
*ElectionTyp
eY
YY
YY
YY
YElectionDate
YY
YY
YY
YY
Mun
icipality
characteristics
NY
NY
NY
NY
Observation
s7,12
8
Notes:*p<
0.10
,**p
<0.05
,***
p<0.01
.Stan
dard
errors
areclusteredat
themun
icipalitylevel.
Foreigners
isthe(stand
ardized)
shareof
foreigne
rs(bycitizenship)
living
ineach
mun
icipality.
Muslim
s19
87is
the(stand
ardized)
shareof
Muslim
sliv
ingin
each
coun
tyin
1987
.Daysis
avariab
leindicating
thenu
mbe
rof
days
sincethelast
Ram
adan
.Pan
elD
repo
rtsregression
sweigh
tedby
thenu
mbe
rof
eligible
voters.
72
Table A.3: Sensitivity to alternative specifications(1) (2) (3) (4)
Notes: * p<0.10, **p<0.05, ***p<0.01. The dependent variable is the number oftweets from AfD twitter accounts, which mention the term AfD (Columns 1 and2) and Muslim-related words (Columns 3 and 4). Standard errors are clusteredat the municipality level.
Notes: The table reports averages of electoral results and municipalities’ characteristicsat each election over the time window analyzed across Western German municipalities,excluding the state of NRW. The table distinguishes between municipalities that haveever had a mosque (92) and those that have not (8219).
77
Table A.9: Ramadan and electoral outcomes in GermanyWhole Germany w/out NRW
(0.2076) (0.2161)Control group mean 75.0579 74.9926
Controls:Election type FE Y Y Y Y YElection type X Municipality N Y Y Y YElection Date FE N Y Y Y YObservations 152,418 152,123 152,123 144,995 144,995
Notes: * p<0.10, **p<0.05, ***p<0.01. Standard errors are clustered at the county level. Columns (1) to(3) include elections in Western Germany from 1980 to 2013. Columns (4) to (5) exclude from the sampleelections in NRW. Column (1) only includes a fixed effect for the type of the election, i.e. Federal or Stateelection. Columns (2) and (4) include the full set of fixed effects as in Table 4, Column (3). Columns (3)and (5) report estimates of a regression in which the Mosque dummy has been replaced by an Ever Mosquedummy, as in Table 5, Column (7).
Notes: The table reports averages of electoral results and electoral districts’ character-istics at each election over the time window analyzed in Berlin. The table distinguishesbetween blocks that are located within a 1500 radius from a mosque and those whowere not.
79
Table A.11: Salience effects on far-right support by employment and foreigners growth rate(1) (2)
Controls:Election type FE Y YElection type X Municipality Y YElection Date FE Y YObservations 7,128
Notes: * p<0.10, **p<0.05, ***p<0.01. Standard errors are clustered atthe municipality level. The dependent variable is the vote share for far-right parties. The table reports coefficients from four different regressions inwhich the treatment variable (Ramadan ×Mosque ) has been interacted withthe (standardized) employment growth rate in the year before the election(Column 1), the (standardized) average employment growth rate in the twoyears before the election (Column 2).
80
B Data Appendix
In this section we provide a description of the ancillary datasets used in the paper Minority Salience
and Political Extremism.
Google Searches. We collected geo-coded information on Google searches in Germany at
the monthly level over the years 2014–2018.44 The sample includes municipalities with a population
size of at least 10,000, i.e., 533 cities. Among them, 141 cities have at least one mosque. The data
focus is on searches for Muslim-related words, such as Muslim, Islam, Mosque and Ramadan (in
German). On average, the monthly number of searches for any of these words is around 130
per month. The two most searched words are Islam (on average 57 searches) and Ramadan (39
searches). The strong increase in Muslim-related searches during the calendar month of Ramadan
start (almost 320 searches on average) are mainly driven by substantially more searches for the
word Ramadan (213), but also the number of searches for the other Muslim-related terms spikes
during Ramadan periods (105).
Twitter data. We developed a python code that retrieves tweets by keyword and location.
We first defined a set of words that should capture Muslims’ salience, these are: Ramadan, Muslim,
Mosque, Islam. We then looked for anti-Muslim tweets, e.g., containing words such as stop islam
and islamization, anti-racist tweets, i.e., including the term anti-racism. We finally searched for
tweets containing the name of the main far-right and far-left parties, i.e., AfD and Die Linke,
respectively. For each tweet that includes one of these keyword, we know the user name of the
Twitter user, its location (at the city level), the text of the tweet and the number of re-tweets. The
code only retrieves tweets back by ten days.45 For this reason, we only focus on last Ramadan over
a time window that goes from 21 days before and 100 days after the start of Ramadan (May 16th
2018). Additionally, we focused on the 396 municipalities of North-Rhine Westphalia. Overall, the
sample is composed of 48,312 observations (396 municipalities × 122 days). We are able to identify
more than 5,000 twitter users in the data that produced more than 69,000 tweets (and 120,000
44 We purchased these data from a consultancy specialized in social media marketing based in Germany.45 This is a limit imposed by the Twitter platform. We thus ran the code every ten days over the period
May 5th to August 25th 2018, thus allowing to cover the period April 25th to August 25th.
81
re-tweets) over the period observed.
Berlin elections. We use data for the electoral districts (Wahlkreis) of Berlin over the
period 2006–2016. These data are publicly available online.46 The sample covers two federal (2009,
2013) and three state-level (2006, 2011, 2013) elections. The statistical office of Berlin does not
provide information on previous elections at such finely grained geographical level. However, data
on Berlin elections at the (aggregate) municipality level are available since 1990. The data provide
information on votes to each party and a set of population characteristics at the Wahlkreis level.47
Table A.10 provides a description of the data, distinguishing between districts within a 1,500
meter radius from a mosque and those outside. The city of Berlin is divided into twelve boroughs
(Bezirk), comprising a number of smaller neighborhoods (approx. 160), roughly coinciding with
electoral districts (Wahlkreis) whose average population is about 1,700 people. One disadvantage
of the data is that the number and the definition of electoral districts within a borough vary across
elections due to changes in population; however, the definition of any borough does not change:
the number of observed districts ranges from 1,709 to 2,501 depending on the election considered.
European Social Survey. The European Social Survey provides data on European citi-
zens’ attitudes, beliefs and behavior patterns. It is conducted every two years in European countries.
The survey consists of a core module and two or more rotating modules, repeated at intervals. Core
topics each year include: political engagement and trust, social and political values, national, ethnic
and religious identify. We use the seventh wave of the European Social Survey, which interviewed
roughly 3,000 German residents between August 2014 and February 2015. This survey wave is
particularly suitable for our purposes as they ask specific questions eliciting individual attitudes
towards minority groups, including Muslims.48 The data also provide information on demographic
46 See https://www.wahlen-berlin.de/.47 The set of variables reported changes in each election. The only variables that are always present are
the total population and the foreign born population.48 Respondents are asked a variety of questions aimed at measuring opinions towards minorities and
immigration, as well as political preferences and socio-economic characteristics (Card et al. , 2012;d’Hombres & Nunziata, 2016). The specific question on attitudes toward Muslims is: “Would youallow many or few Muslims to come and live in your country? ”. Answers range from “Allow many tocome and live here” (1) to “None” (4). The website http://www.europeansocialsurvey.org/ provides acomplete description of the data.
82
and economic characteristics of the respondents that we use as controls. As the municipality of
residence is not disclosed, we only exploit variation in the interview date, defining as treated all
individuals interviewed within three months after the start of Ramadan. The share of treated re-
spondents is about 21%. Figure A.4 plots the share of respondents by date of interview. Table A.7
reports main demographic, economic, political outcomes of respondents.
Attacks on mosques. We collected information on attacks against mosques from a list
released by the Federal Ministry of the Interior in May 2012. The list is part of the response by
the Federal Government to an inquiry from the party Die Linke. The list contains all recorded
offenses against Muslim communities in Germany from January 2001 to December 2011. The data
provide information on each attack’s date, municipality, and type. We counted 219 offenses against
mosques, including vandalism (e.g., swastika graffiti), death threats and arsons.49
PRODAT. The PRODAT project collected data on protests in (West) Germany over the period
1950 until 2002 based on newspaper articles in national newspapers. Out of 16,000 recorded protest
events, 1,656 protests can be identified as either left- or right-oriented. The information covers a
broad range of attributes to each recorded protests: exact place and time, and precise information
on topic, size, and the interest groups/supporters, including their political orientation, and whether
these protests triggered or displayed a counter-protest.50
Census 1987. The information on the county-level population share of Muslims comes from
the population census (Volkszählung) conducted in West Germany in 1987. We use county-level
census tabulations provided by Schmitt et al. (1994).
49 The complete list can be found at the following website: http://dip21.bundestag.de/dip21/btd/17/095/1709523.pdf
50 A public use version of the data is available at https://www.wzb.eu/de/forschung/beendete-forschungsprogramme/zivilgesellschaft-und-politische-mobilisierung/projekte/prodat-dokumentation-und-analyse-von-protestereignissen-in-der-bundesrepublik.
83
Working Paper del Dipartimento di Economia e Finanza
1. L. Colombo, H. Dawid, Strategic Location Choice under Dynamic Oligopolistic
Competition and Spillovers, novembre 2013.
2. M. Bordignon, M. Gamalerio, G. Turati, Decentralization, Vertical Fiscal Imbalance, and
Political Selection, novembre 2013.
3. M. Guerini, Is the Friedman Rule Stabilizing? Some Unpleasant Results in a Heterogeneous
Expectations Framework, novembre 2013.
4. E. Brenna, C. Di Novi, Is caring for elderly parents detrimental to women’s mental health?
The influence of the European North-South gradient, novembre 2013.
5. F. Sobbrio, Citizen-Editors' Endogenous Information Acquisition and News Accuracy,
novembre 2013.
6. P. Bingley, L. Cappellari, Correlation of Brothers Earnings and Intergenerational
Transmission, novembre 2013.
7. T. Assenza, W. A. Brock, C. H. Hommes, Animal Spirits, Heterogeneous Expectations and
the Emergence of Booms and Busts, dicembre 2013.
8. D. Parisi, Is There Room for ‘Fear’ as a Human Passion in the Work by Adam Smith?,
gennaio 2014.
9. E. Brenna, F. Spandonaro, Does federalism induce patients’ mobility across regions?
Evidence from the Italian experience, febbraio 2014.
10. A. Monticini, F. Ravazzolo, Forecasting the intraday market price of money, febbraio 2014.
11. Tiziana Assenza, Jakob Grazzini, Cars Hommes, Domenico Massaro, PQ Strategies in
Monopolistic Competition: Some Insights from the Lab, marzo 2014.
12. R. Davidson, A. Monticini, Heteroskedasticity-and-Autocorrelation-Consistent
Bootstrapping, marzo 2014.
13. C. Lucifora, S. Moriconi, Policy Myopia and Labour Market Institutions, giugno 2014.
14. N. Pecora, A. Spelta, Shareholding Network in the Euro Area Banking Market, giugno 2014.
15. G. Mazzolini, The economic consequences of accidents at work, giugno 2014.
16. M. Ambrosanio, P. Balduzzi, M. Bordignon, Economic crisis and fiscal federalism in Italy,
settembre 2014.
17. P. Bingley, L. Cappellari, K. Tatsiramos, Family, Community and Long-Term Earnings
Inequality, ottobre 2014.
18. S. Frazzoni, M. L. Mancusi, Z. Rotondi, M. Sobrero, A. Vezzulli, Innovation and export in
SMEs: the role of relationship banking, novembre 2014.
19. H. Gnutzmann, Price Discrimination in Asymmetric Industries: Implications for
Competition and Welfare, novembre 2014.
20. A. Baglioni, A. Boitani, M. Bordignon, Labor mobility and fiscal policy in a currency union,
novembre 2014.
21. C. Nielsen, Rational Overconfidence and Social Security, dicembre 2014.
22. M. Kurz, M. Motolese, G. Piccillo, H. Wu, Monetary Policy with Diverse Private
Expectations, febbraio 2015.
23. S. Piccolo, P. Tedeschi, G. Ursino, How Limiting Deceptive Practices Harms Consumers,
maggio 2015.
24. A.K.S. Chand, S. Currarini, G. Ursino, Cheap Talk with Correlated Signals, maggio 2015.
25. S. Piccolo, P. Tedeschi, G. Ursino, Deceptive Advertising with Rational Buyers, giugno
2015.
26. S. Piccolo, E. Tarantino, G. Ursino, The Value of Transparency in Multidivisional Firms,
giugno 2015.
27. G. Ursino, Supply Chain Control: a Theory of Vertical Integration, giugno 2015.
28. I. Aldasoro, D. Delli Gatti, E. Faia, Bank Networks: Contagion, Systemic Risk and
Prudential Policy, luglio 2015.
29. S. Moriconi, G. Peri, Country-Specific Preferences and Employment Rates in Europe,
settembre 2015.
30. R. Crinò, L. Ogliari, Financial Frictions, Product Quality, and International Trade,
settembre 2015.
31. J. Grazzini, A. Spelta, An empirical analysis of the global input-output network and its
evolution, ottobre 2015.
32. L. Cappellari, A. Di Paolo, Bilingual Schooling and Earnings: Evidence from a Language-
in-Education Reform, novembre 2015.
33. A. Litina, S. Moriconi, S. Zanaj, The Cultural Transmission of Environmental Preferences:
Evidence from International Migration, novembre 2015.
34. S. Moriconi, P. M. Picard, S. Zanaj, Commodity Taxation and Regulatory Competition,
novembre 2015.
35. M. Bordignon, V. Grembi, S. Piazza, Who do you blame in local finance? An analysis of
municipal financing in Italy, dicembre 2015.
36. A. Spelta, A unified view of systemic risk: detecting SIFIs and forecasting the financial cycle
via EWSs, gennaio 2016.
37. N. Pecora, A. Spelta, Discovering SIFIs in interbank communities, febbraio 2016.
38. M. Botta, L. Colombo, Macroeconomic and Institutional Determinants of Capital Structure
Decisions, aprile 2016.
39. A. Gamba, G. Immordino, S. Piccolo, Organized Crime and the Bright Side of Subversion of
Law, maggio 2016.
40. L. Corno, N. Hildebrandt, A. Voena, Weather Shocks, Age of Marriage and the Direction of
Marriage Payments, maggio 2016.
41. A. Spelta, Stock prices prediction via tensor decomposition and links forecast, maggio 2016.
42. T. Assenza, D. Delli Gatti, J. Grazzini, G. Ricchiuti, Heterogeneous Firms and International
Trade: The role of productivity and financial fragility, giugno 2016.
43. S. Moriconi, Taxation, industry integration and production efficiency, giugno 2016.
44. L. Fiorito, C. Orsi, Survival Value and a Robust, Practical, Joyless Individualism: Thomas
Nixon Carver, Social Justice, and Eugenics, luglio 2016.
45. E. Cottini, P. Ghinetti, Employment insecurity and employees’ health in Denmark, settembre
2016.
46. G. Cecere, N. Corrocher, M. L. Mancusi, Financial constraints and public funding for eco-
innovation: Empirical evidence on European SMEs, settembre 2016.
47. E. Brenna, L. Gitto, Financing elderly care in Italy and Europe. Is there a common vision?,
settembre 2016.
48. D. G. C. Britto, Unemployment Insurance and the Duration of Employment: Theory and
Evidence from a Regression Kink Design, settembre 2016.
49. E. Caroli, C.Lucifora, D. Vigani, Is there a Retirement-Health Care utilization puzzle?
Evidence from SHARE data in Europe, ottobre 2016.
50. G. Femminis, From simple growth to numerical simulations: A primer in dynamic
programming, ottobre 2016.
51. C. Lucifora, M. Tonello, Monitoring and sanctioning cheating at school: What works? Evidence from a national evaluation program, ottobre 2016.
52. A. Baglioni, M. Esposito, Modigliani-Miller Doesn’t Hold in a “Bailinable” World: A New
Capital Structure to Reduce the Banks’ Funding Cost, novembre 2016.
53. L. Cappellari, P. Castelnovo, D. Checchi, M. Leonardi, Skilled or educated? Educational
reforms, human capital and earnings, novembre 2016.
54. D. Britto, S. Fiorin, Corruption and Legislature Size: Evidence from Brazil, dicembre 2016.
55. F. Andreoli, E. Peluso, So close yet so unequal: Reconsidering spatial inequality in U.S.
cities, febbraio 2017.
56. E. Cottini, P. Ghinetti, Is it the way you live or the job you have? Health effects of lifestyles
and working conditions, marzo 2017.
57. A. Albanese, L. Cappellari, M. Leonardi, The Effects of Youth Labor Market Reforms:
Evidence from Italian Apprenticeships; maggio 2017.
58. S. Perdichizzi, Estimating Fiscal multipliers in the Eurozone. A Nonlinear Panel Data
Approach, maggio 2017.
59. S. Perdichizzi, The impact of ECBs conventional and unconventional monetary policies on
European banking indexes returns, maggio 2017.
60. E. Brenna, Healthcare tax credits: financial help to taxpayers or support to higher income
and better educated patients? Evidence from Italy, giugno 2017.
61. G. Gokmen, T. Nannicini, M. G. Onorato, C. Papageorgiou, Policies in Hard Times:
Assessing the Impact of Financial Crises on Structural Reforms, settembre 2017.
62. M. Tettamanzi, E Many Pluribus Unum: A Behavioural Macro-Economic Agent Based
Model, novembre 2017.
63. A. Boitani, C. Punzo, Banks’ leverage behaviour in a two-agent New Keynesian model,
gennaio 2018.
64. M. Bertoni, G. Brunello, L. Cappellari, Parents, Siblings and Schoolmates. The Effects of
Family-School Interactions on Educational Achievement and Long-term Labor Market
Outcomes, gennaio 2018.
65. G. P. Barbetta, G. Sorrenti, G. Turati, Multigrading and Child Achievement, gennaio 2018.
66. S. Gagliarducci, M. G. Onorato, F. Sobbrio, G. Tabellini, War of the Waves: Radio and
Resistance During World War II, febbraio 2018.
67. P. Bingley, L. Cappellari, Workers, Firms and Life-Cycle Wage Dynamics, marzo 2018.
68. A. Boitani, S. Perdichizzi, Public Expenditure Multipliers in recessions. Evidence from the
Eurozone, marzo 2018.
69. M. Le Moglie, G. Turati, Electoral Cycle Bias in the Media Coverage of Corruption News,
aprile 2018.
70. R. Davidson, A. Monticini, Improvements in Bootstrap Inference, aprile 2018.
71. R. Crinò, G. Immordino, S. Piccolo, Fighting Mobile Crime, giugno 2018.
72. R. Caminal, L. Cappellari, A. Di Paolo, Linguistic skills and the intergenerational
transmission of language, agosto 2018.
73. E. Brenna, L. Gitto, Adult education, the use of Information and Communication
Technologies and the impact on quality of life: a case study, settembre 2018.
74. M. Bordignon, Y. Deng, J. Huang, J. Yang, Plunging into the Sea: Ideological Change,
Institutional Environments and Private Entrepreneurship in China, settembre 2018.
75. M. Bordignon, D. Xiang, L. Zhan, Predicting the Effects of a Sugar Sweetened Beverage
Tax in a Household Production Model, settembre 2018.
76. C. Punzo, L. Rossi, The Redistributive Effects of a Money-Financed Fiscal Stimulus,
gennaio 2019.
77. A. Baglioni, L. Colombo, P. Rossi, Debt restructuring with multiple bank relationships,
gennaio 2019.
78. E. Cottini, P. Ghinetti, S. Moriconi, Higher Education Supply, Neighbourhood effects and
Economic Welfare, febbraio 2019.
79. S. Della Lena, F. Panebianco, Cultural Transmission with Incomplete Information: Parental
Perceived Efficacy and Group Misrepresentation, marzo 2019.
80. T. Colussi, Ingo E. Isphording, Nico Pestel, Minority Salience and Political Extremism,


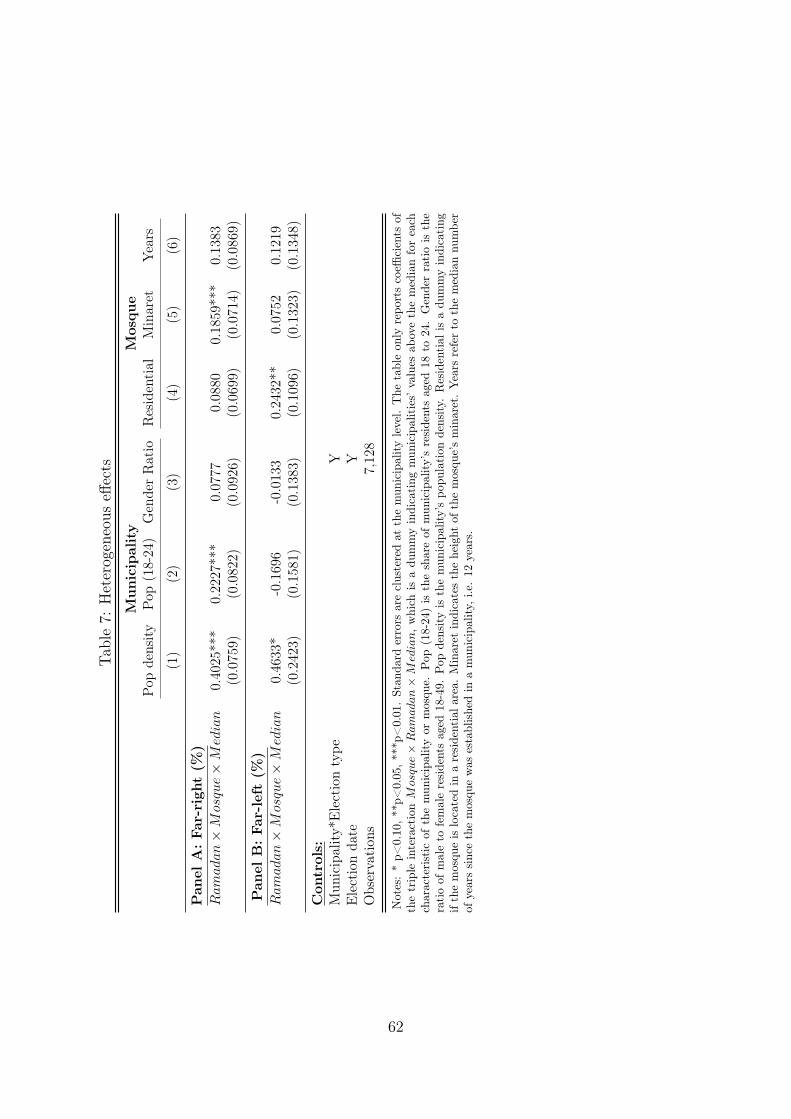
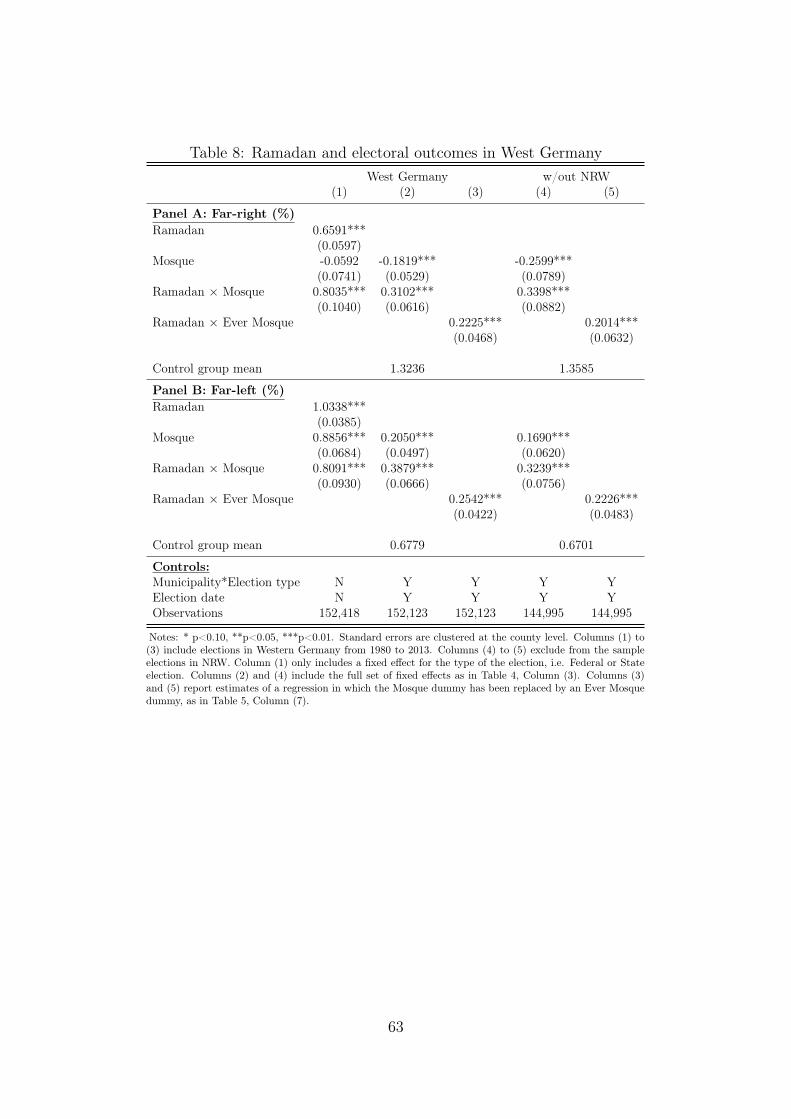


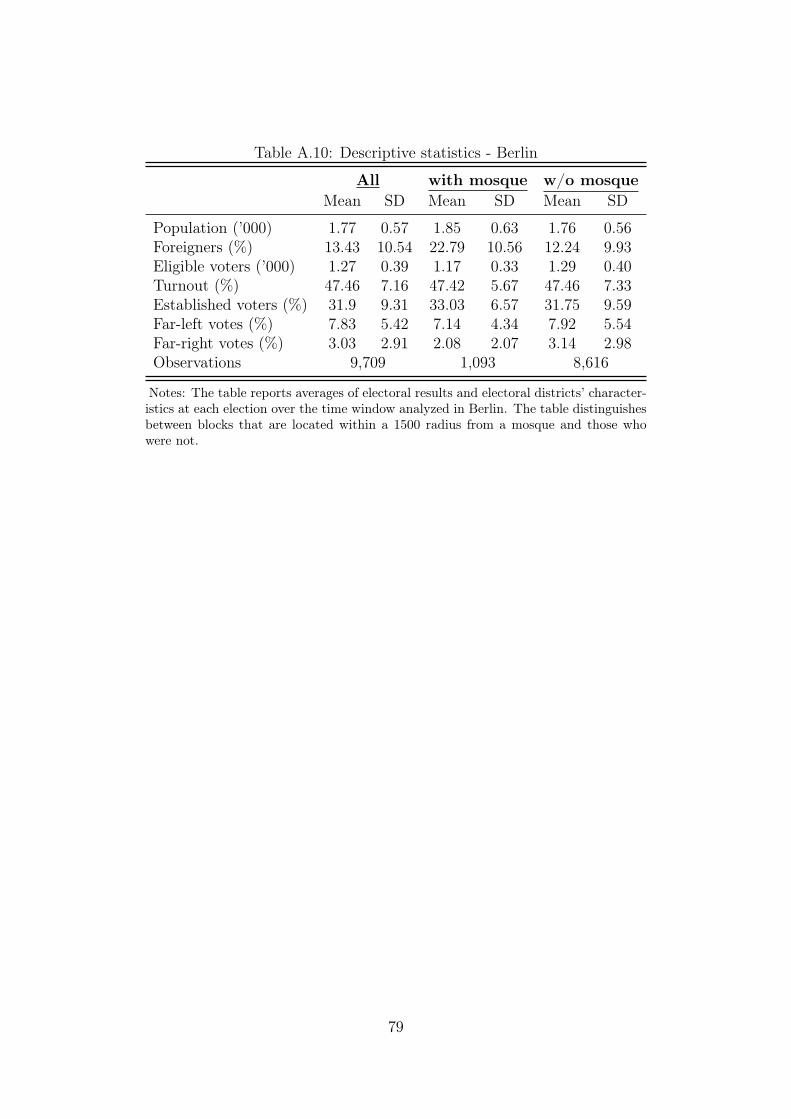


![Dipartimenti - Dipartimenti - Università di Cagliari...[IJ2] M. Manca, L. Boratto, and S. Carta, "Behavioral data mining to produce novel and serendipitous friend recommendations](https://static.documents.pub/doc/80x56/5f4c05684118014c5b7cc08a/dipartimenti-dipartimenti-universit-di-cagliari-ij2-m-manca-l-boratto.jpg)


