Working Paper No. 358 Towards sustainable, productive and profitable agriculture: Case of Rice and Sugarcane Ashok Gulati Gayathri Mohan April 2018 INDIAN COUNCIL FOR RESEARCH ON INTERNATIONAL ECONOMIC RELATIONS
Transcript
i
Working Paper No. 358
Towards sustainable, productive and
profitable agriculture:
Case of Rice and Sugarcane
Ashok Gulati
Gayathri Mohan
April 2018
INDIAN COUNCIL FOR RESEARCH ON INTERNATIONAL ECONOMIC RELATIONS
Table of Contents
List of Abbreviations ................................................................................................................ i
Preface and Acknowledgement ............................................................................................. iii
Abstract .................................................................................................................................... iv
Executive Summary ................................................................................................................. v
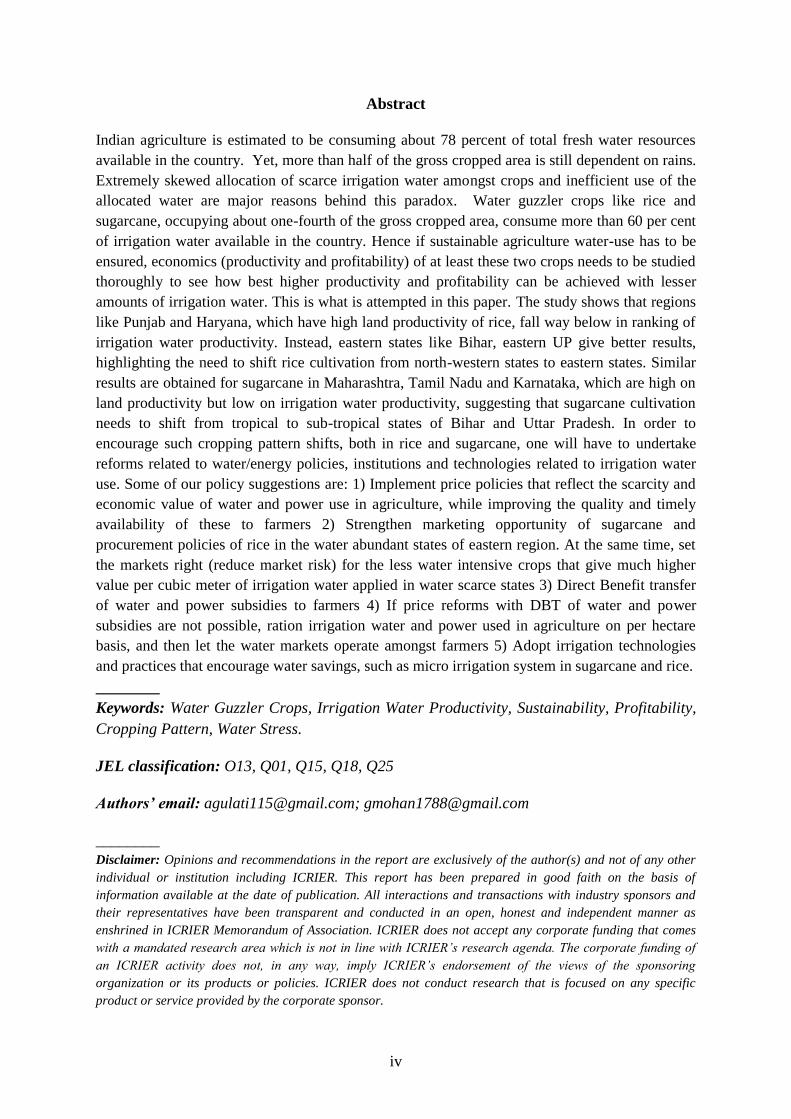
Disclaimer: Opinions and recommendations in the report are exclusively of the author(s) and not of any other
individual or institution including ICRIER. This report has been prepared in good faith on the basis of
information available at the date of publication. All interactions and transactions with industry sponsors and
their representatives have been transparent and conducted in an open, honest and independent manner as
enshrined in ICRIER Memorandum of Association. ICRIER does not accept any corporate funding that comes
with a mandated research area which is not in line with ICRIER’s research agenda. The corporate funding of
an ICRIER activity does not, in any way, imply ICRIER’s endorsement of the views of the sponsoring
organization or its products or policies. ICRIER does not conduct research that is focused on any specific
product or service provided by the corporate sponsor.
v
Executive Summary
Water in agriculture – The sustainability issue
Water is going to be a bigger binding constraint than land in India’s agriculture development.
With a population of more than 1.3 billion in 2017, India is likely to surpass China’s
population and emerge as most populous country in the world by 2024 (UN Revised
Population Projections, 2017)1. Supporting more than 17 per cent of the global population on
2 per cent of world’s land area (11% of global arable land) and 4 per cent of fresh water
resource will be a herculean task. On an average an Indian household still spends about 45.5
percent of its expenditure on food (NSSO, 2011). As such, with per capita incomes likely to
rise by about 6 percent per annum for the coming decade or so, demand pressures on food,
feed and fiber are going to increase rapidly. Almost 46 per cent of land area and about 78 per
cent2 of water resource is already diverted towards agriculture production in India. Despite
this large supplies of water towards agriculture, more than half (52%) of Indian agriculture is
still rainfed, resulting in underachievement of potential productivity and profitability. This
situation emerges primarily due to highly skewed distribution of irrigation water amongst
crops. More than 60 per cent of water available for agriculture use in the country is diverted
towards irrigating two water guzzler crops, rice and sugarcane, having a share of just 24 per
cent in gross cropped area. This skewed water allocation and inefficient irrigation practices
like flood irrigation, are raising flags regarding sustainability of water use in Indian
agriculture. If Prime Minister’s vision of “har khet ko pani” (water to every field), and “per
drop, more crop” is to be achieved within a reasonable time frame, one needs to look at the
economics of agriculture (its productivity and profitability) with a different lens. It must shift
its focus from land productivity and profitability to irrigation water productivity and
profitability. This has to be done for at least two crops, rice and sugarcane.
Our approach
In this paper, we focus on two crops in two regions -rice in Punjab and sugarcane in
Maharashtra- where they pose a major paradox in terms of their productivity and profitability,
when measured on the basis of per unit of land and per unit of irrigation water applied. The
two states also display classic paradox of cultivating water guzzler crops in the midst of water
crisis. Punjab is facing groundwater depletion at an alarming rate of 70cm to 120 cm per year
(The World Bank, 2010), but it is the frontrunner in terms of rice productivity per unit area.
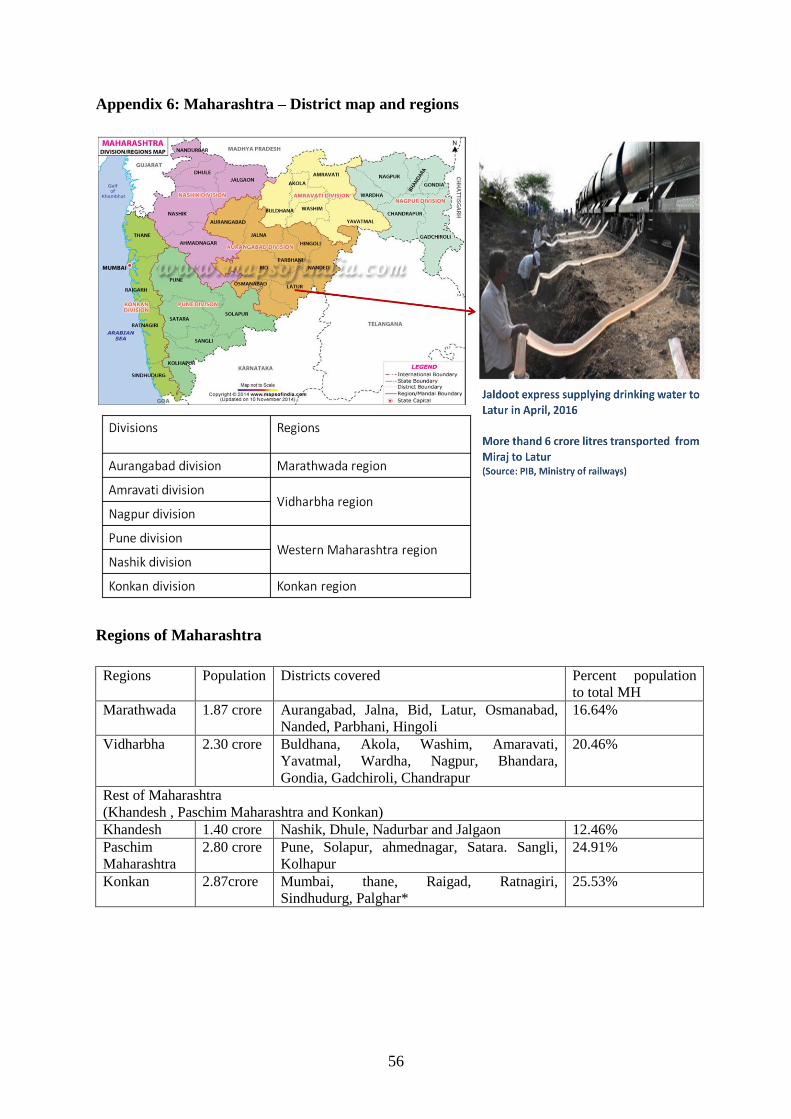
Maharashtra faced acute water shortage during the 2014-15 drought, and even trains (Jaldoot
express) had to be put in service to ferry drinking water to quench the thirst of its people, but
it stands high (third) on sugarcane land productivity.
In our study we estimate irrigation water productivity (crop output produced per unit of
irrigation water applied by farmers) of rice and sugarcane crops to bring out the mis-
alignment existing in cropping pattern and irrigation water use across major states. The
1 https://www.un.org/development/desa/publications/world-population-prospects-the-2017-revision.html 2 Another estimation in source (CWC, 2015) puts this figure even higher at 85 percent in 2010.
vi
economic water productivity (expressed as Rs./m3) has also been worked out to understand in
value terms the crop output produced per unit of irrigation water applied. Further, the
profitability of the two crops across the states has been compared to map out policies to
promote sustainability without compromising profitability. In case of Maharashtra, we have
attempted to compare the Irrigation Water Productivity (IWP), Economic Water Productivity
(EWP) and profitability across major crops grown in the state, in order to highlight the
inequity in irrigation water allocation across crops in the state.
The Inconvenient Truth
Paddy in Punjab: An irrational choice?
The analysis of irrigation water productivity across states for rice reveals that Punjab lags
behind major rice growing states. For example, it uses almost two times more irrigation water
than West Bengal, and three times more irrigation water than Bihar, for producing one
kilogram of rice. Bihar recorded the highest irrigation water productivity of 56 kg per lakh
litres of irrigation water supplied while Punjab produced just 19 kg rice from the same
quantity of irrigation water applied. The EWP also shows similar results with Punjab
emerging as the most inefficient in paddy cultivation producing paddy output worth Rs. 3.81/
m3 of irrigation water applied while the eastern states of West Bengal and Bihar producing
output worth three times more than that of Punjab from the same quantity of water applied.
Thus, cultivating paddy crop in Punjab totally based on irrigation water emerges as an
anomaly from the point of view of ensuring sustainable water use in Punjab agriculture. But
because of robust procurement policy coupled with highly subsidized power (almost free),
the profitability of paddy cultivation on per hectare basis remains very high in Punjab. This is
what encourages farmers to cultivate this crop despite high social cost incurred in terms of
fast depleting water table, which will impact the sustainability of agriculture and welfare of
future generations in Punjab.
Sugarcane in Maharashtra – A paradox?
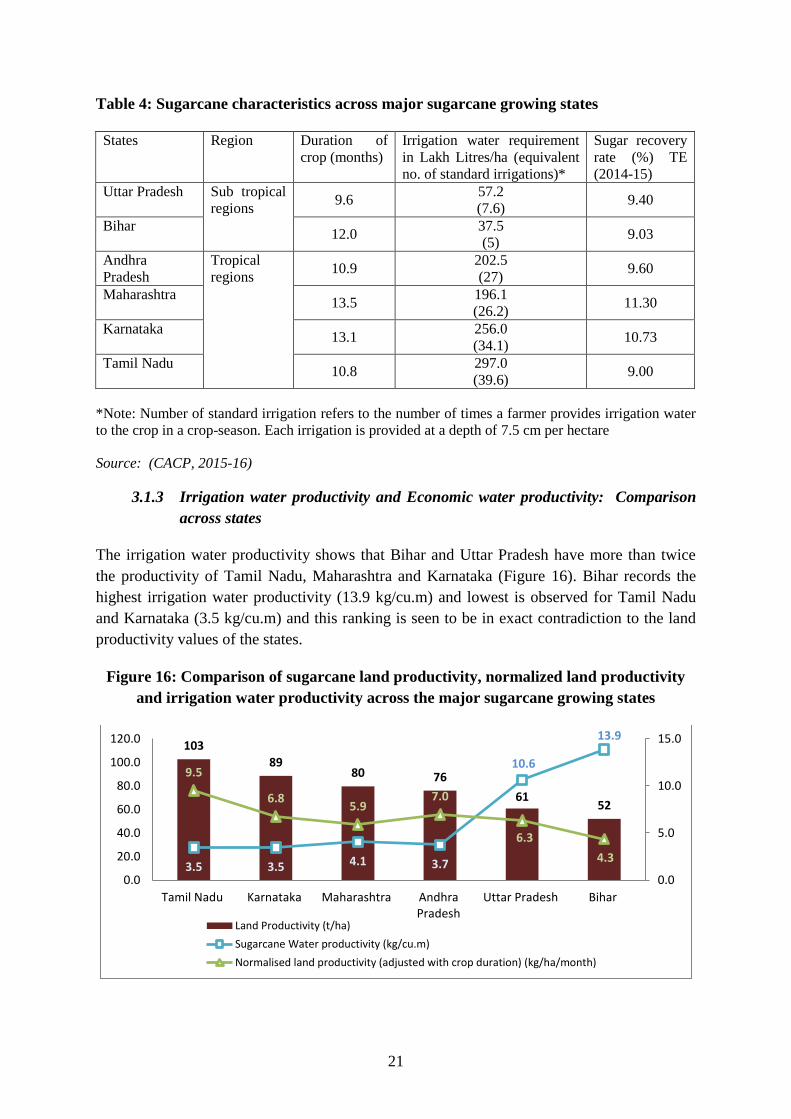
A similar analysis for sugarcane across major sugarcane growing states showed that the
irrigation water productivity in traditional sub-tropical sugarcane region (Uttar Pradesh and
Bihar) was almost three times more than the tropical region comprising of Maharashtra,
Tamil Nadu and Karnataka, while it was the other way round when land productivity (per
unit area basis) was considered. Despite the existence of better established cooperative sugar
mills in Maharashtra, the per month profitability of the crop (after adjusting crop duration)
when compared across states showed sugarcane cultivation in Uttar Pradesh to be more
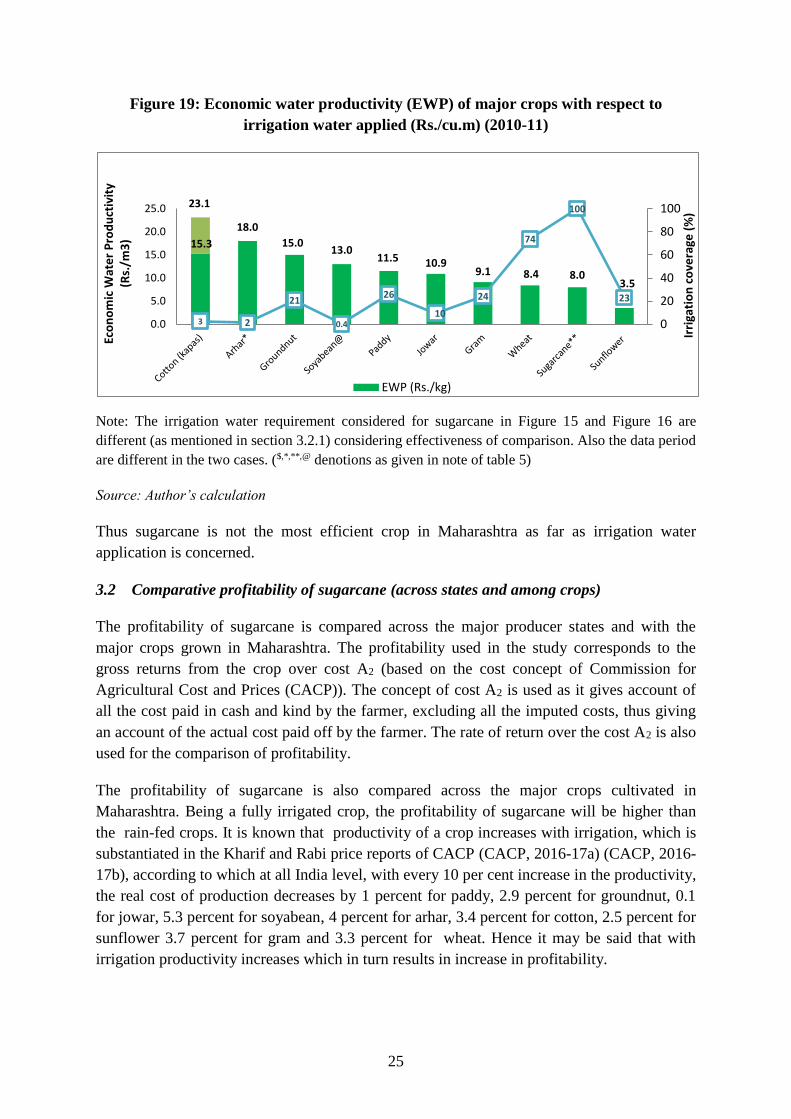
profitable than in Maharashtra. On comparing the economic productivity (value of crop
output produced per unit of irrigation water applied) of sugarcane with other major crops
grown within Maharashtra showed the less water intensive cotton, tur and groundnut to be
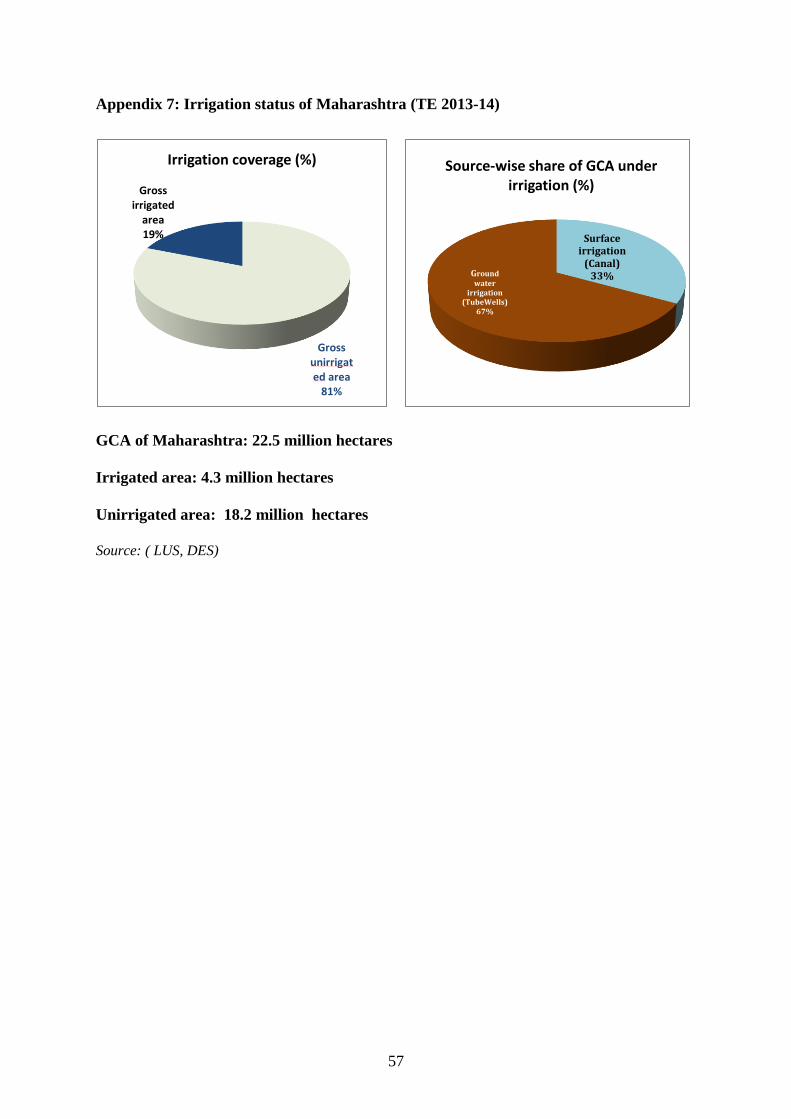
more efficient. However, it is an irony that sugarcane occupying 4 percent of gross cropped
area in Maharashtra takes away almost two-thirds of irrigation water of the state. And this
happens when overall irrigation cover in Maharashtra is just 19 percent compared to about 48
percent at all India level. These clearly indicate that cultivation of a water guzzler crop like
vii
sugarcane stands out as a paradox in water stressed state like Maharashtra. But due to the full
irrigation coverage in sugarcane and higher profitability due to assured marketing through
sugar mills, the sugarcane farmers in Maharashtra are mostly reluctant to shift their cropping
pattern to other crops. Hence emphasis should be laid upon improving the existing flood
irrigation practice to drip irrigation so that water saved from sugarcane cultivation could be
supplied for irrigating other crops in the area. For instance, the water saved through drip
technology in one ha of sugarcane area can bring an additional 2.29 ha area under
conventional irrigation and double this area, if drip irrigation is adopted in cotton. From this
additional 2.29 ha irrigated area under cotton, if other things remain constant, output worth
up to Rs. 1.95 lakh can be produced (considering farm harvest price and yield data of 2014-
15). This would help improve the prosperity of farmers cultivating those crops too. Further,
investment friendly climate must be created to set up new sugar mills and rejuvenate the sick
sugar mills in states like Bihar having high potential for sustainable sugar production.
Specific Policy recommendations emanating from the study
Shifting water intensive crops to water abundant regions
Rice and sugarcane exhibit serious misalignment between the cropping patterns and
hydrological suitability in the major cultivating states. Rice cultivation needs to be shifted
from the north-western water stressed states like Punjab to the water abundant eastern region
while sugarcane needs to be shifted from the water scarce tropical region (Maharashtra,
Tamil Nadu, Karnataka and Andhra Pradesh) to the traditional water abundant sub tropical
region of UP and Bihar. These changes are needed not as zero-one game, but at the margin, to
restore the balance between irrigation water available and demand for that water by these
crops so that a sustainable cropping pattern can be encouraged in line with water availability.
Marketing opportunities for sugarcane and procurement policies of rice must be
strengthened in the water abundant states. At the same time in the water scarce states,
marketing risks of less water intensive crops must be reduced.
Implementing efficient price reforms in water and power use in agriculture: Effective
pricing of water and power in sync with their improved quality and timely availability is
essential to ensure judicious use of these inputs for sustainable agriculture development.
Direct Benefit transfer of water and power subsidies: The price based subsidy existing for
inputs at present must shift to direct income support policies, wherein the input
subsidies/benefits must be directly transferred to the farmer’s account rather than getting
reflected in the distorted (very low) prices of these particular inputs.
In case it is not possible to carry out price reforms in water and power sector, rationing
mechanism in supply of irrigation water from canal system through a ‘warabandi’ type
system, and metering mechanism in supplying power for irrigation through separate
dedicated feeder and distribution line for irrigation must be implemented. Farmers can be
viii
given these inputs on per hectare basis, and thereafter allow a water market amongst
farmers themselves.
Adopting irrigation technologies like micro irrigation for improving water use efficiency.
Other Supporting policies
Efficient implementation and scaling up of drought proofing schemes like Nanaji
Deshmukh Krishi Sanjivani Yojana and Jalyukt Shivar Yojana (Maharashtra) in other
water scarce states.
Promote cultivation of HYV of sugarcane crop in water abundant states like UP and Bihar
which may increase the profitability of sugarcane farmers in the state.
Export of water guzzler crops like rice and sugarcane (sugar) results in virtual export of
water, which needs to be contained by correcting power/irrigation water pricing. And if
that is not feasible, one can consider an export tax of say 5 percent on these commodities,
especially rice, while allowing their imports at zero or low duty. This would help dovetail
the objective of sustainable water use in agriculture in India’s trade and tariff policy.
Lessons can be learned from nations like Israel regarding their water pricing policy and
water governance, which has led to effective adoption of the precision irrigation
technology in the country.
Promoting micro irrigation in regions with no regular electricity supply (particularly in
the eastern regions) is a major challenge. In such places, Solar-micro irrigation system
may be encouraged with a provision to feed in the surplus power back to grid. This would
not only cut down the cost of diesel based irrigation in these regions, but also provide a
regular income from solar power supplied to the grid.
1
Towards sustainable, productive and profitable agriculture:
Case of Rice and Sugarcane
Ashok Gulati and Gayathri Mohan
1. Introduction
1.1 Why emphasize sustainability in agriculture water use in India?
With a population of 1.3 billion today, India is likely to overtake China by 20243 and emerge
as the most populous country in the world. Supporting more than 17 per cent of the world’s
population on 2 per cent of global land area, about 11 percent of world’s arable land, and 4
percent of global fresh water supplies will be a herculean task. An average Indian household
still spends about 45.5 percent of its expenditure on food (NSSO, 2014). As such, with per
capita incomes likely to rise by about 6 percent per annum for the coming decade or so, it is
obvious that demand pressures for food, feed and fiber are going to increase in India. Thus to
combat the pressure coming from rising population, increasing purchasing power,
urbanization and industrialization, there is a need to increase land as well as water
productivity in agriculture. At present, about 46 per cent of the land area and 78 per cent4 of
water resource is already diverted towards agriculture in India (CWC, 2014; LUS, DES). But
owing to the current water stress5 faced by the country, with the per capita water availability
reported as 1544 cubic metre (cu.m) in 2011 (CWC, 2013), water is going to be the bigger
binding constraint than land in India’s agriculture development (Figure 1). Though
increasing land productivity has been closely scrutinized by researchers and policy makers,
the emphasis towards the improving water productivity, particularly in terms of irrigation
water applied by farmers, has been very limited.
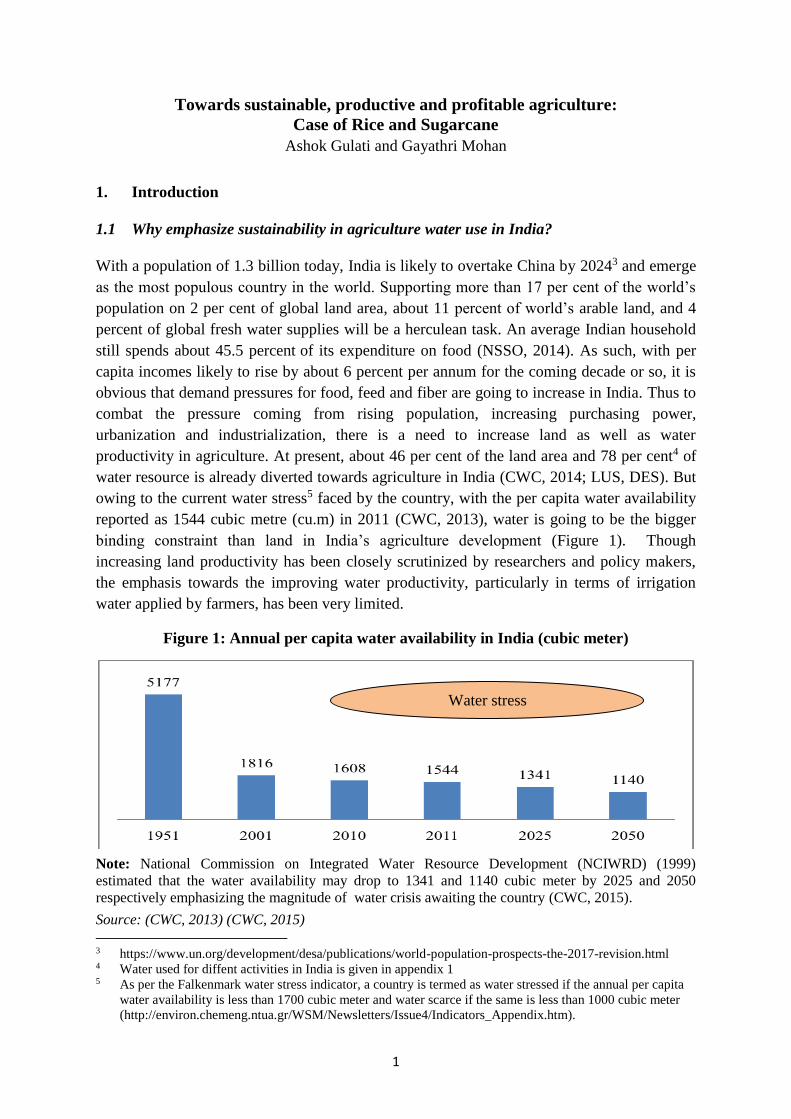
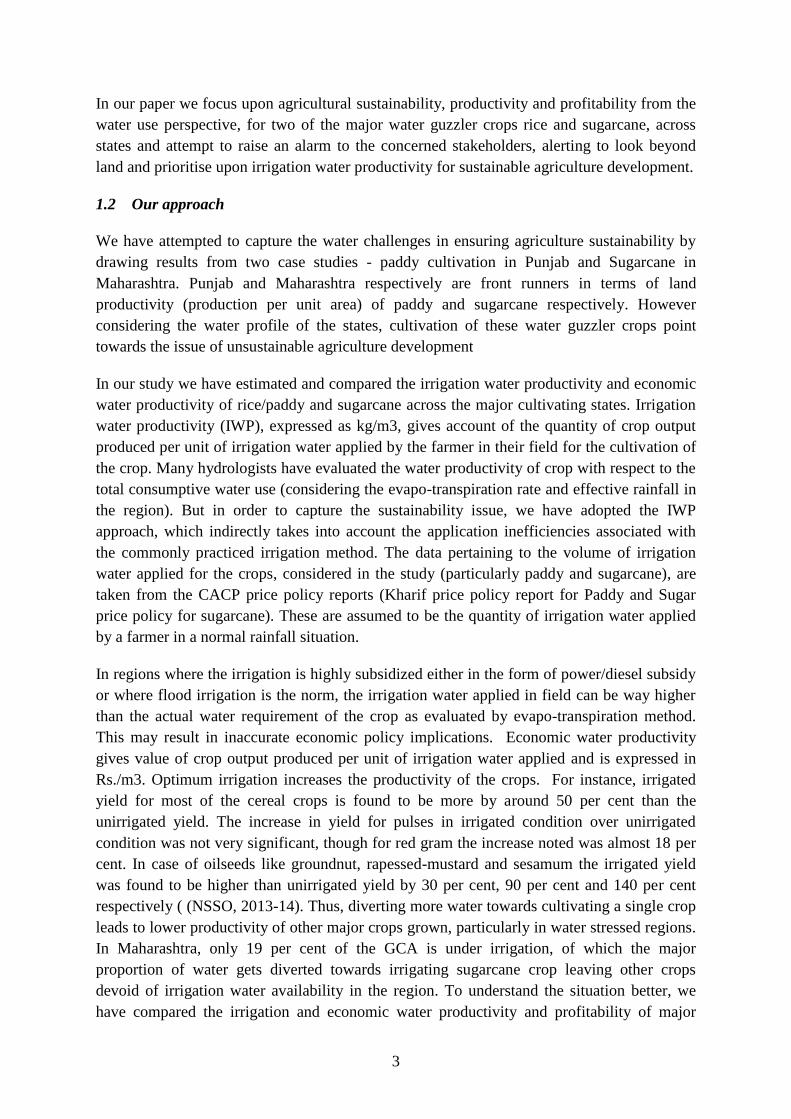
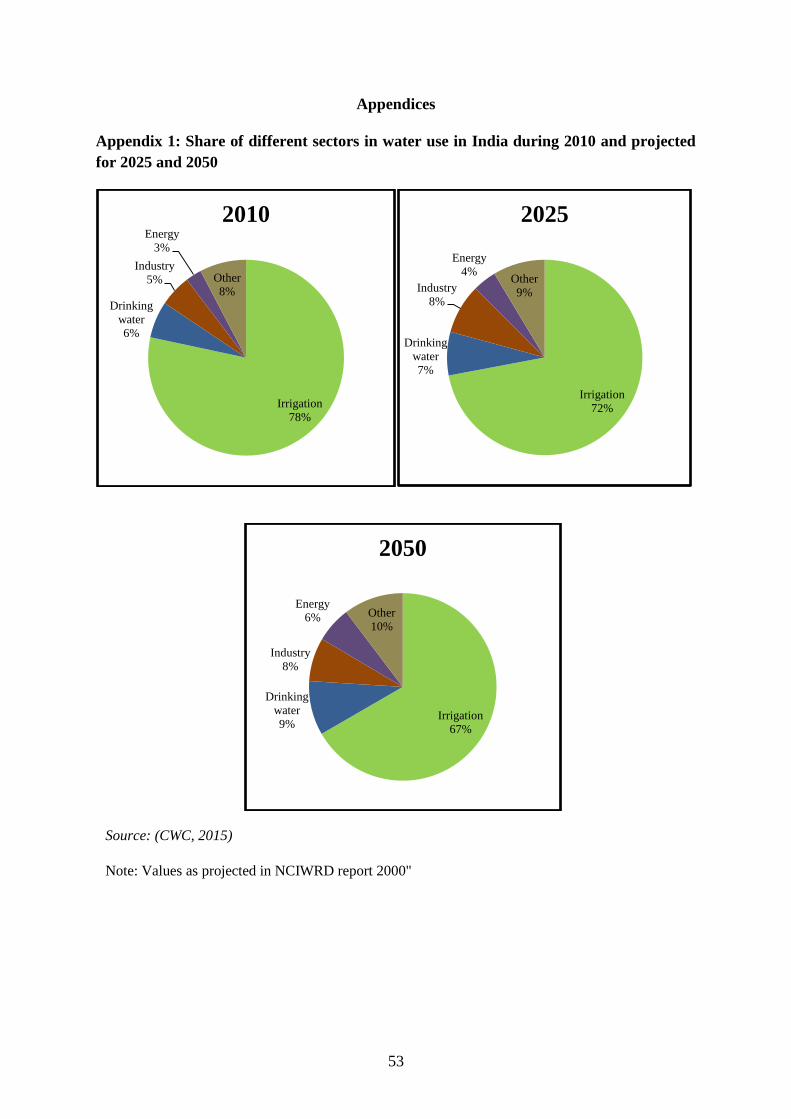
Figure 1: Annual per capita water availability in India (cubic meter)
Note: National Commission on Integrated Water Resource Development (NCIWRD) (1999)
estimated that the water availability may drop to 1341 and 1140 cubic meter by 2025 and 2050
respectively emphasizing the magnitude of water crisis awaiting the country (CWC, 2015).
Source: (CWC, 2013) (CWC, 2015)
3 https://www.un.org/development/desa/publications/world-population-prospects-the-2017-revision.html 4 Water used for diffent activities in India is given in appendix 1 5 As per the Falkenmark water stress indicator, a country is termed as water stressed if the annual per capita
water availability is less than 1700 cubic meter and water scarce if the same is less than 1000 cubic meter
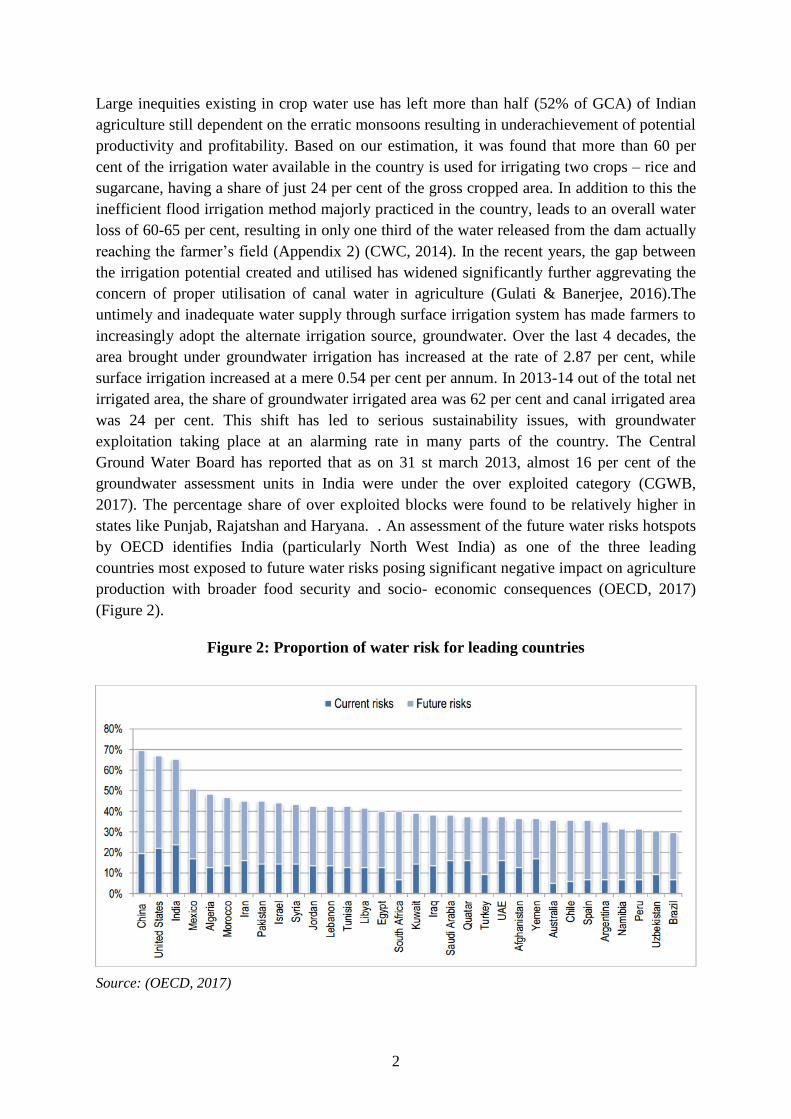
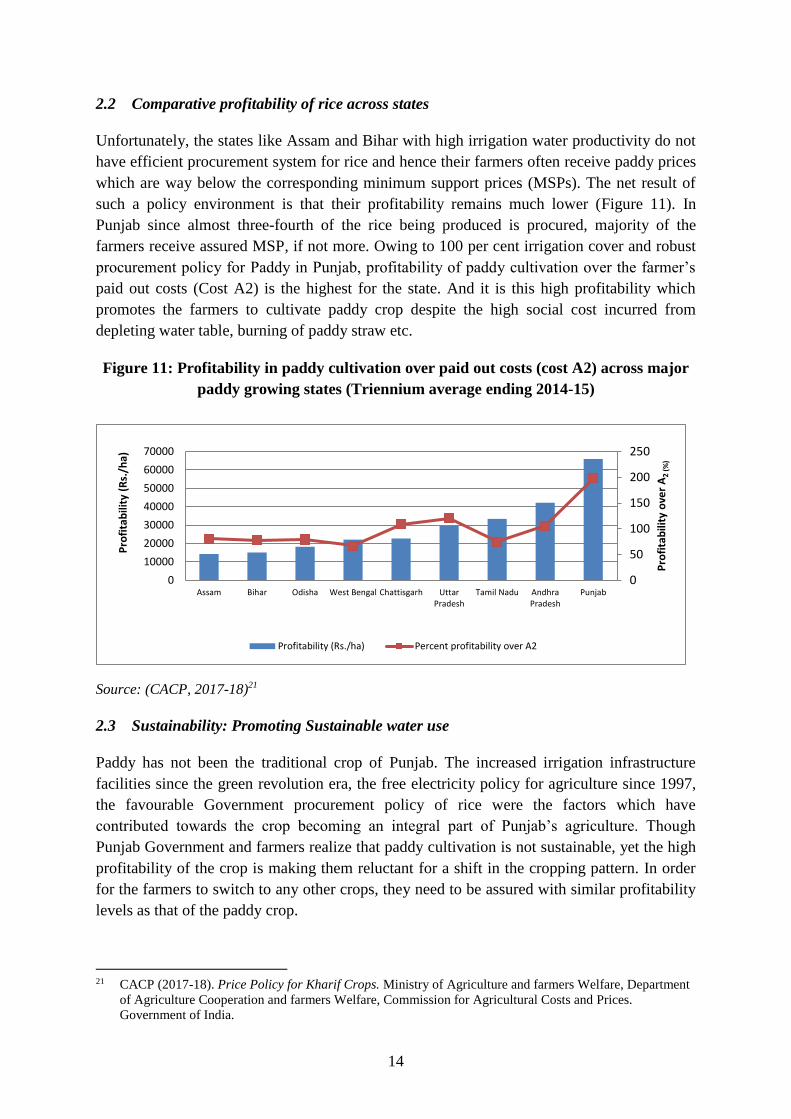
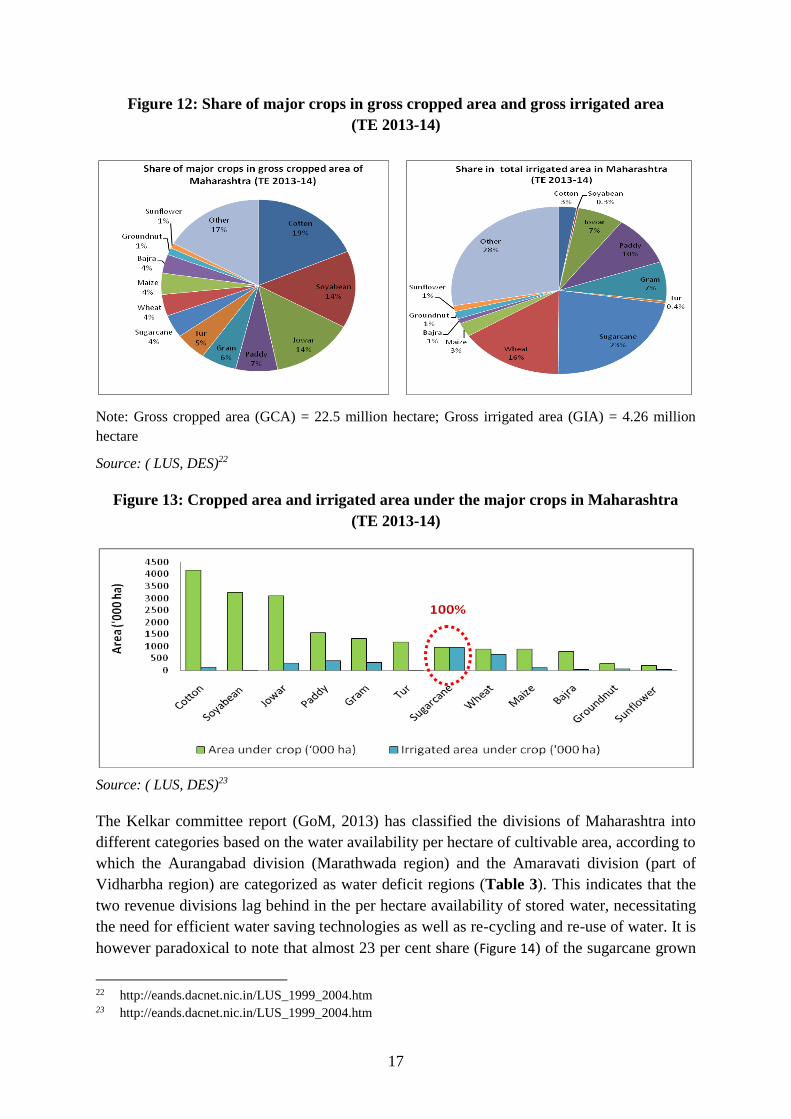
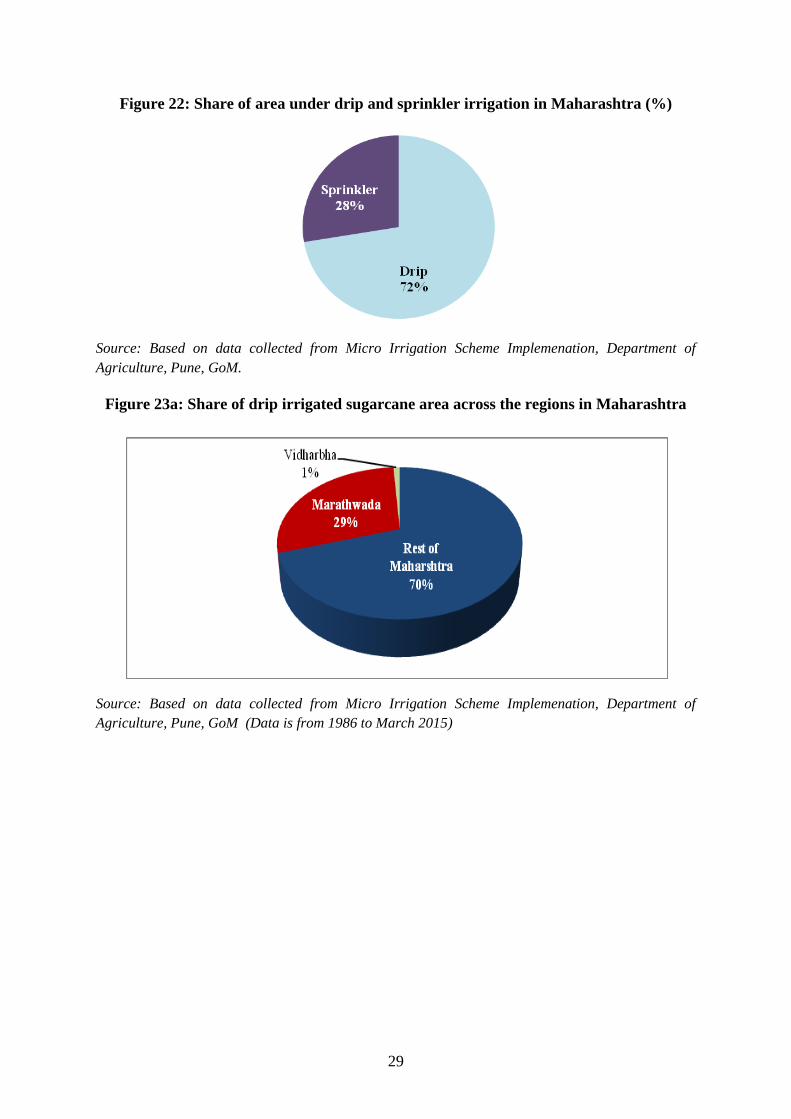
Maharashtra while cotton has only 3 percent irrigation cover. The overall 4 per cent area
under sugarcane crop in the state thus consumes almost 64 per cent of the total irrigation
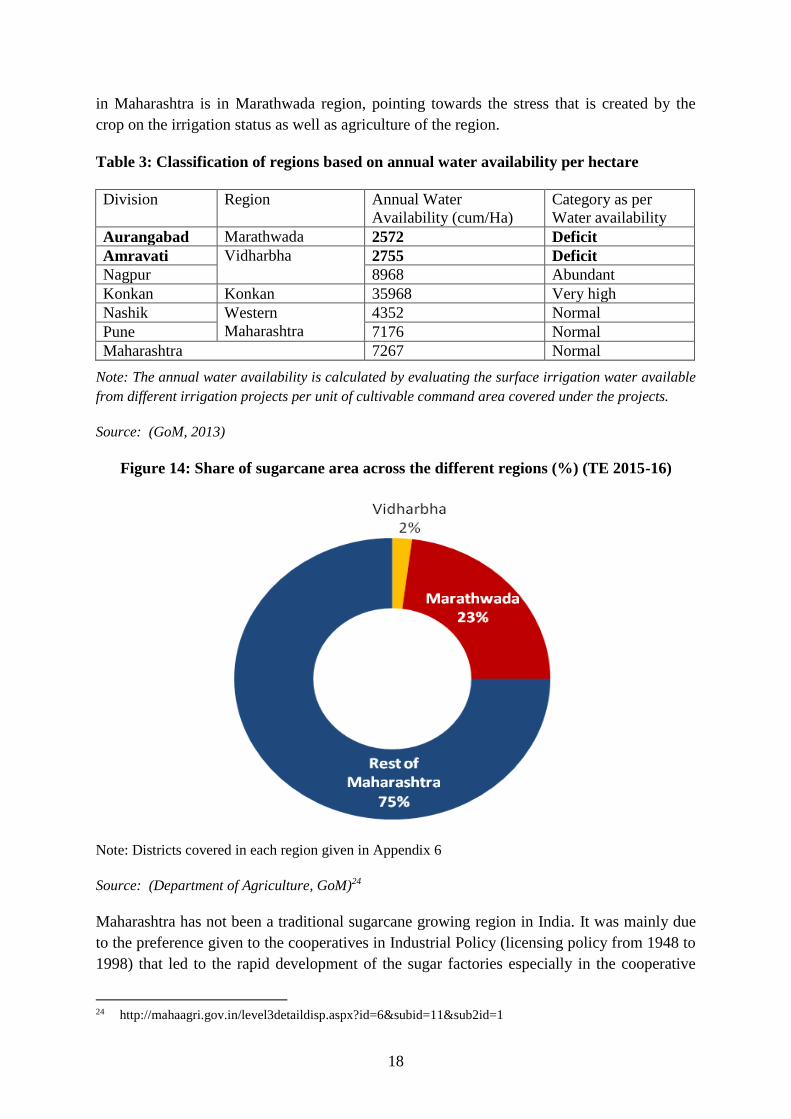
water available. Latur district, one of the worst water scarcity affected region in the 2014-15
and 2015-16 drought of Maharashtra, recorded the highest share of sugarcane area (20 % in
2015-16) in the Marathwada region. This skewed irrigation-water allocation limits the scope
for higher agriculture productivity and profitability for the other principal crops of the state,
driving the agricultural development to a highly water unsustainable situation.
1.4 Scope, Limitation and Structure of Paper
Using the two case studies addressing water productivity issues of rice cultivation in Punjab
and sugarcane cultivation in Maharashtra, the paper aims to analyze and provide policy
suggestions to promote sustainability, productivity and profitability of Indian agriculture
from the irrigation water use perspective. It is expected that the results of the study will flag
the need to re-align the cropping patterns, especially of rice and sugarcane in sync with the
water profile of the regions.
It may be noted that for sustainable agriculture, addressing soil health and climate change
issues are also a very critical. However, we have not taken these issues in this paper and have
concentrated mainly on water issues.
The paper is organized in the following manner: section 2 deals with the case study of
Punjab, highlighting the issue of paddy cultivation in the midst of depleting ground water
resource. Section 3 details the case study of Maharashtra, which presents a similar yet
different story of unsustainable sugarcane cultivation in the water scarce state. Section 4
includes the conclusion and policy suggestions specifically emerging from the study as well
as some supporting policies to achieve agriculture sustainability, productivity and
profitability from the water use perspective.
2. Punjab: A case of rice cultivation in the midst of depleting water resource
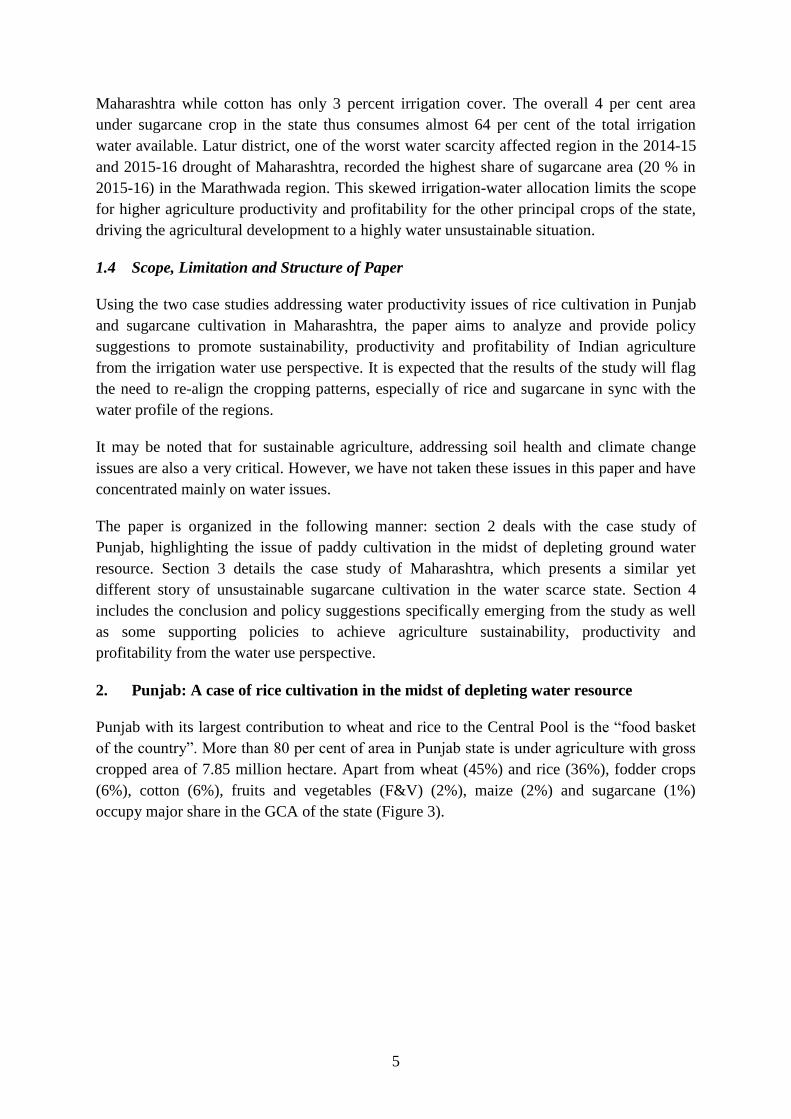
Punjab with its largest contribution to wheat and rice to the Central Pool is the “food basket
of the country”. More than 80 per cent of area in Punjab state is under agriculture with gross
cropped area of 7.85 million hectare. Apart from wheat (45%) and rice (36%), fodder crops
(6%), cotton (6%), fruits and vegetables (F&V) (2%), maize (2%) and sugarcane (1%)
occupy major share in the GCA of the state (Figure 3).
6
Figure 3: Share of major crops in gross cropped area of Punjab (%) (TE 2013-14)
Source: ( LUS, DES)10
The state records the highest irrigation ratio (98.5%) in the country with well developed
irrigation infrastructure dating back to the green revolution era. It has been reported that over
the last four decades, the traditional maize-wheat cropping pattern has been replaced by the
wheat-rice cropping pattern, increasing the irrigation demand (Gupta, 2009). Rice being a
water guzzler crop, consumes over 200 lakh litres of irrigation water per hectare, while maize
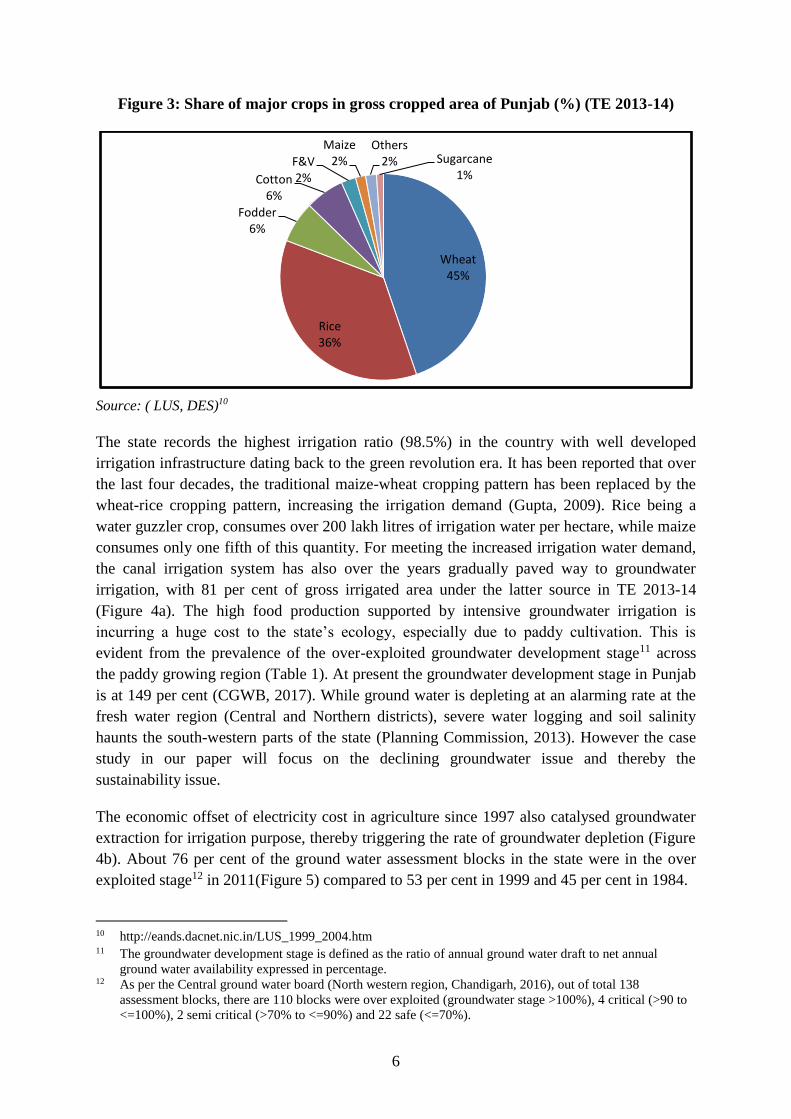
consumes only one fifth of this quantity. For meeting the increased irrigation water demand,
the canal irrigation system has also over the years gradually paved way to groundwater
irrigation, with 81 per cent of gross irrigated area under the latter source in TE 2013-14
(Figure 4a). The high food production supported by intensive groundwater irrigation is
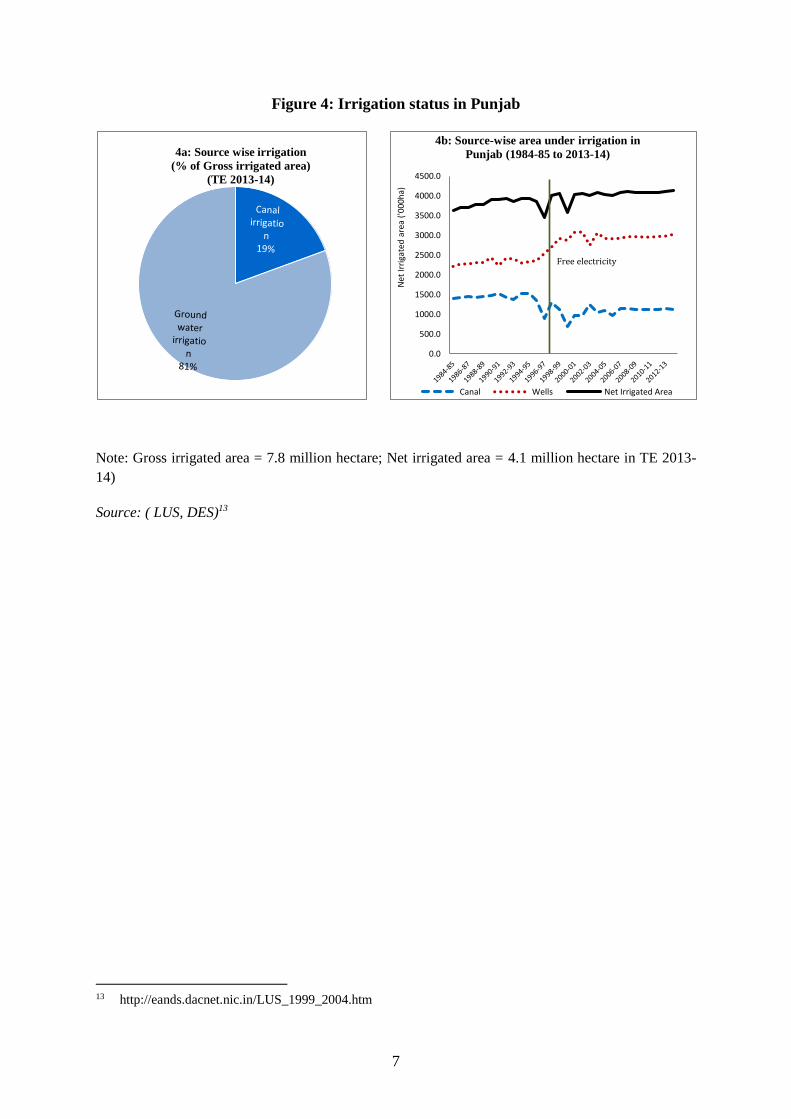
incurring a huge cost to the state’s ecology, especially due to paddy cultivation. This is
evident from the prevalence of the over-exploited groundwater development stage11 across
the paddy growing region (Table 1). At present the groundwater development stage in Punjab
is at 149 per cent (CGWB, 2017). While ground water is depleting at an alarming rate at the
fresh water region (Central and Northern districts), severe water logging and soil salinity
haunts the south-western parts of the state (Planning Commission, 2013). However the case
study in our paper will focus on the declining groundwater issue and thereby the
sustainability issue.
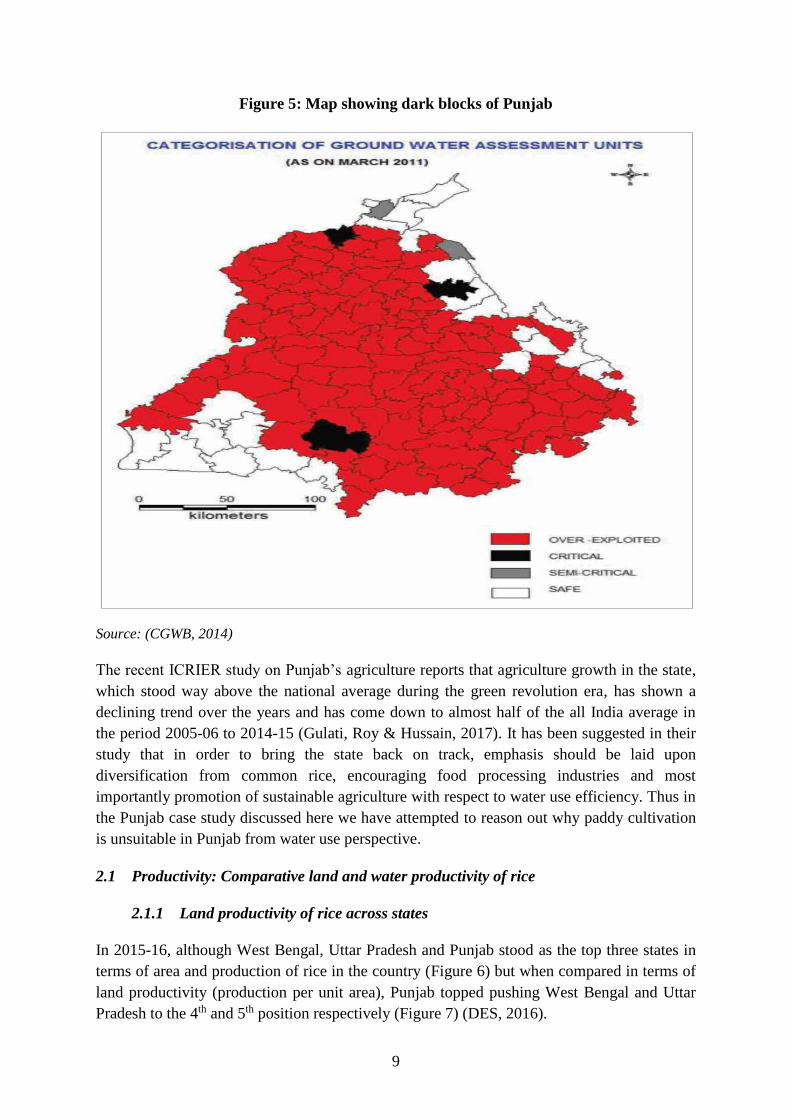
The economic offset of electricity cost in agriculture since 1997 also catalysed groundwater
extraction for irrigation purpose, thereby triggering the rate of groundwater depletion (Figure
4b). About 76 per cent of the ground water assessment blocks in the state were in the over
exploited stage12 in 2011(Figure 5) compared to 53 per cent in 1999 and 45 per cent in 1984.
10 http://eands.dacnet.nic.in/LUS_1999_2004.htm 11 The groundwater development stage is defined as the ratio of annual ground water draft to net annual
ground water availability expressed in percentage. 12 As per the Central ground water board (North western region, Chandigarh, 2016), out of total 138
assessment blocks, there are 110 blocks were over exploited (groundwater stage >100%), 4 critical (>90 to
<=100%), 2 semi critical (>70% to <=90%) and 22 safe (<=70%).
Wheat45%
Rice36%
Fodder6%
Cotton6%
F&V2%
Maize2%
Others2% Sugarcane
1%
7
Figure 4: Irrigation status in Punjab
Note: Gross irrigated area = 7.8 million hectare; Net irrigated area = 4.1 million hectare in TE 2013-
14)
Source: ( LUS, DES)13
13 http://eands.dacnet.nic.in/LUS_1999_2004.htm
4a: Source wise irrigation
(% of Gross irrigated area)
(TE 2013-14)
0.0
500.0
1000.0
1500.0
2000.0
2500.0
3000.0
3500.0
4000.0
4500.0
Net
Irri
gate
d a
rea
('0
00
ha)
4b: Source-wise area under irrigation in
Punjab (1984-85 to 2013-14)
Canal Wells Net Irrigated Area
Free electricity
8
Table 1: District-wise stage of ground water development in Punjab
District Region Stage of groundwater
development (%)
(2011)
Share of rice area in GCA
(of district/state@) (t/ha)
(TE 2014-15)
Amritsar Central 180 44
Barnala Central 204 43
Fateh Garh Sahib Central 210 15
Jalandhar Central 231 40
Kapurthala Central 234 43
Ludhiana Central 167 43
Mansa Central 208 22
Moga Central 202 46
Nawan Shahr Central 115 30
Patiala Central 196 45
Mohali (SAS Nagar) Central 103 26
Sangrur Central 283 43
Tarn Taran Central 182 45
Hoshiarpur Kandi 102 20
Pathankot** Kandi 28
Ropar Kandi 110 26
Gurdaspur Kandi (partly) 127 42
Bathinda South West 119 20
Faridkot South West 160 42
Fazilka* South West 45
Muktsar South West 69 27
Ferozepur South West 147 48
State@ 172 36
Note: *Fazilka was a part of Ferozpur before 2011 ; ** Pathankot was a part of Gurdaspur before
2011;
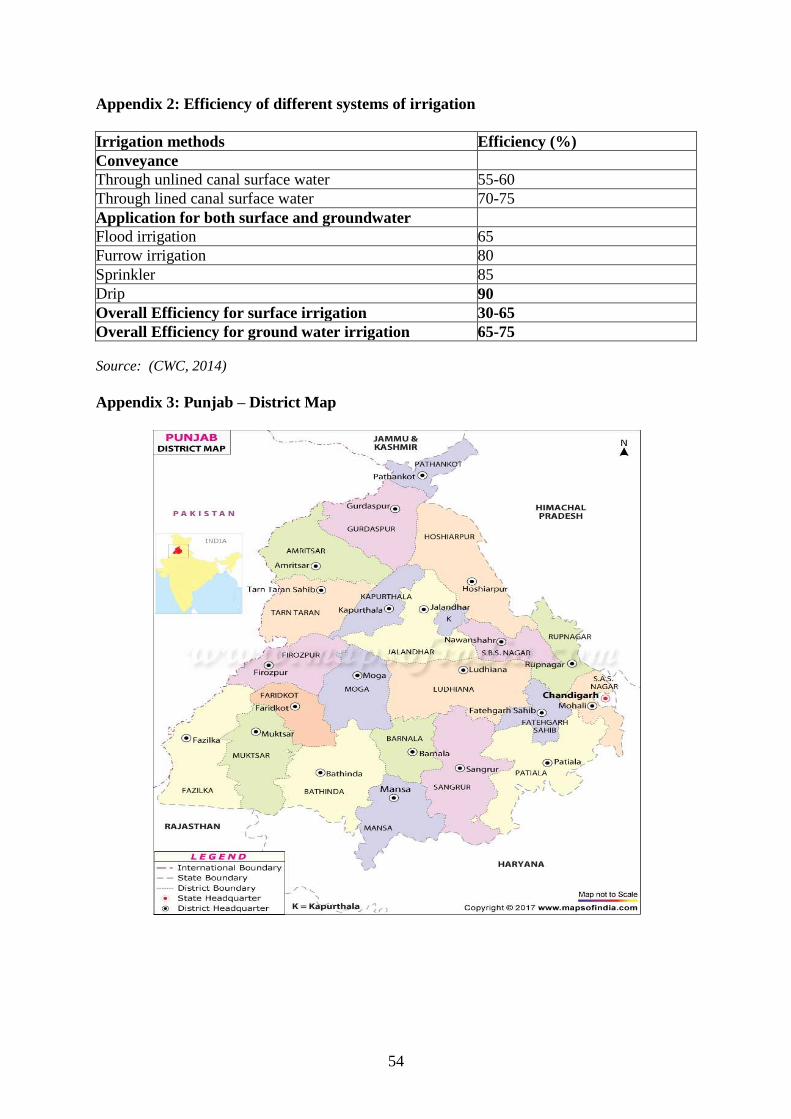
Map of Punjab given in Appendix 3
Source: APY, DES14; (CGWB, 2014)
14 http://aps.dac.gov.in/APY/Public_Report1.aspx
9
Figure 5: Map showing dark blocks of Punjab
Source: (CGWB, 2014)
The recent ICRIER study on Punjab’s agriculture reports that agriculture growth in the state,
which stood way above the national average during the green revolution era, has shown a
declining trend over the years and has come down to almost half of the all India average in
the period 2005-06 to 2014-15 (Gulati, Roy & Hussain, 2017). It has been suggested in their
study that in order to bring the state back on track, emphasis should be laid upon
diversification from common rice, encouraging food processing industries and most
importantly promotion of sustainable agriculture with respect to water use efficiency. Thus in
the Punjab case study discussed here we have attempted to reason out why paddy cultivation
is unsuitable in Punjab from water use perspective.
2.1 Productivity: Comparative land and water productivity of rice
2.1.1 Land productivity of rice across states
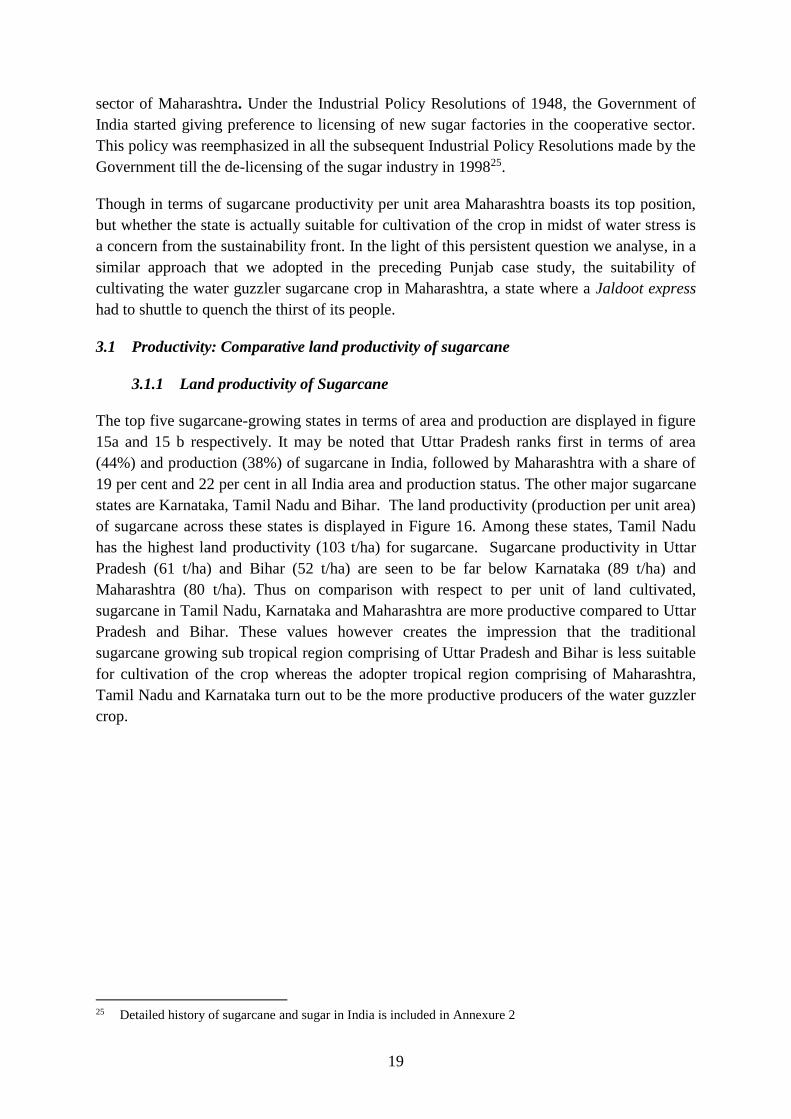
In 2015-16, although West Bengal, Uttar Pradesh and Punjab stood as the top three states in
terms of area and production of rice in the country (Figure 6) but when compared in terms of
land productivity (production per unit area), Punjab topped pushing West Bengal and Uttar
Pradesh to the 4th and 5th position respectively (Figure 7) (DES, 2016).
10
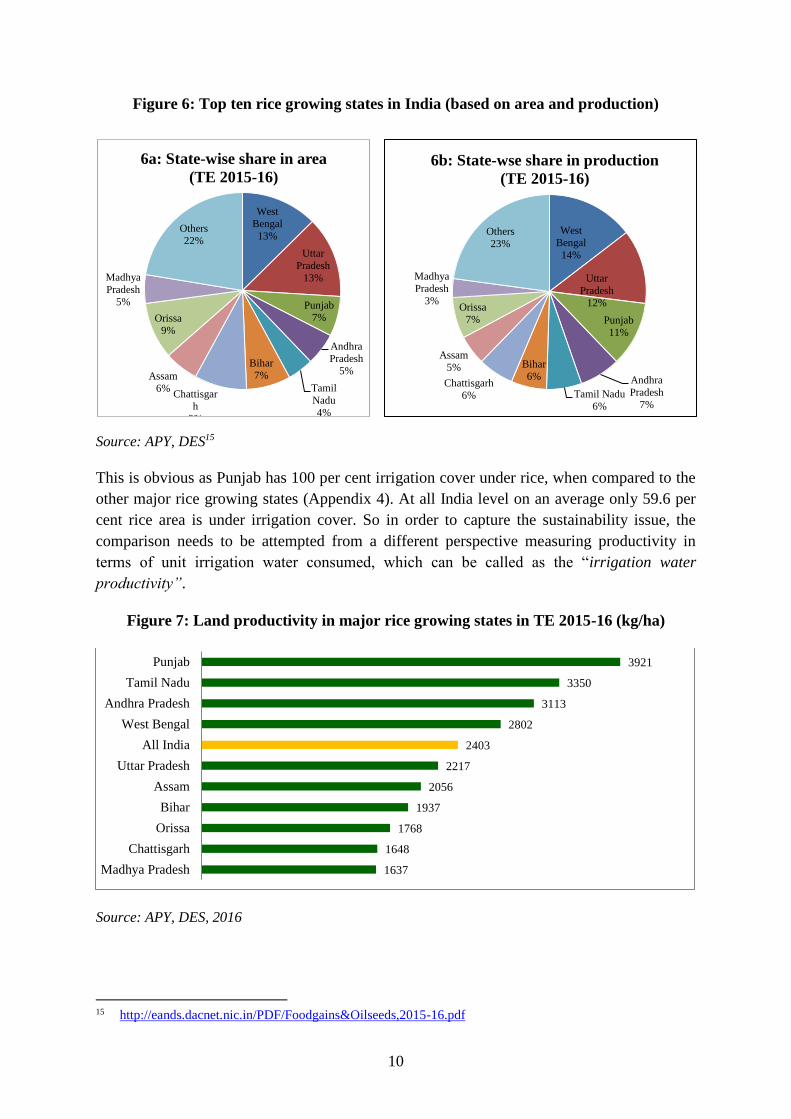
Figure 6: Top ten rice growing states in India (based on area and production)
Source: APY, DES15
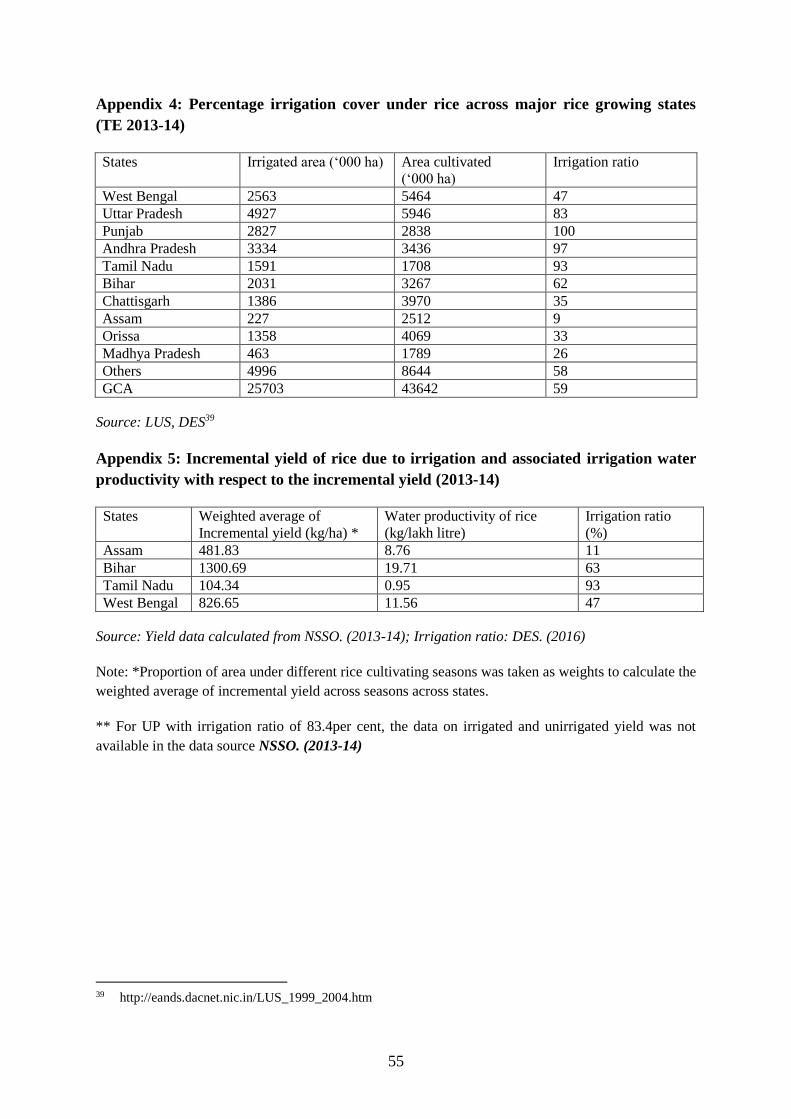
This is obvious as Punjab has 100 per cent irrigation cover under rice, when compared to the
other major rice growing states (Appendix 4). At all India level on an average only 59.6 per
cent rice area is under irrigation cover. So in order to capture the sustainability issue, the
comparison needs to be attempted from a different perspective measuring productivity in
terms of unit irrigation water consumed, which can be called as the “irrigation water
productivity”.
Figure 7: Land productivity in major rice growing states in TE 2015-16 (kg/ha)
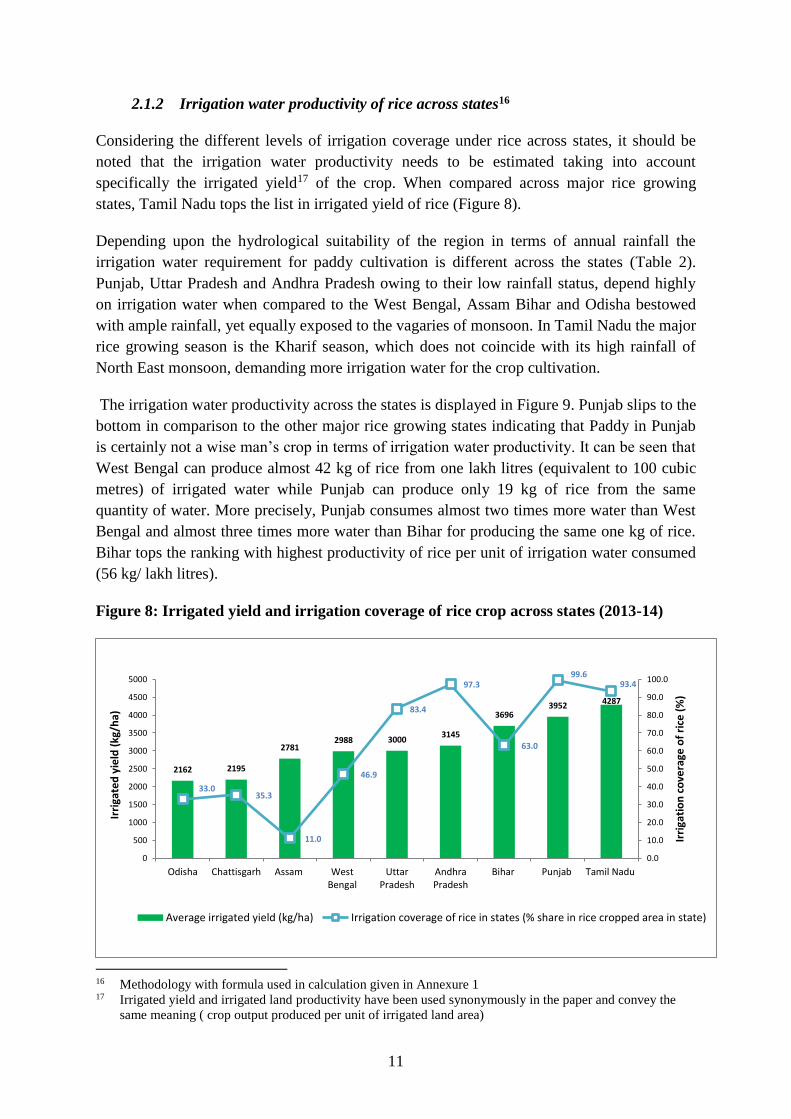
2.1.2 Irrigation water productivity of rice across states16
Considering the different levels of irrigation coverage under rice across states, it should be
noted that the irrigation water productivity needs to be estimated taking into account
specifically the irrigated yield17 of the crop. When compared across major rice growing
states, Tamil Nadu tops the list in irrigated yield of rice (Figure 8).
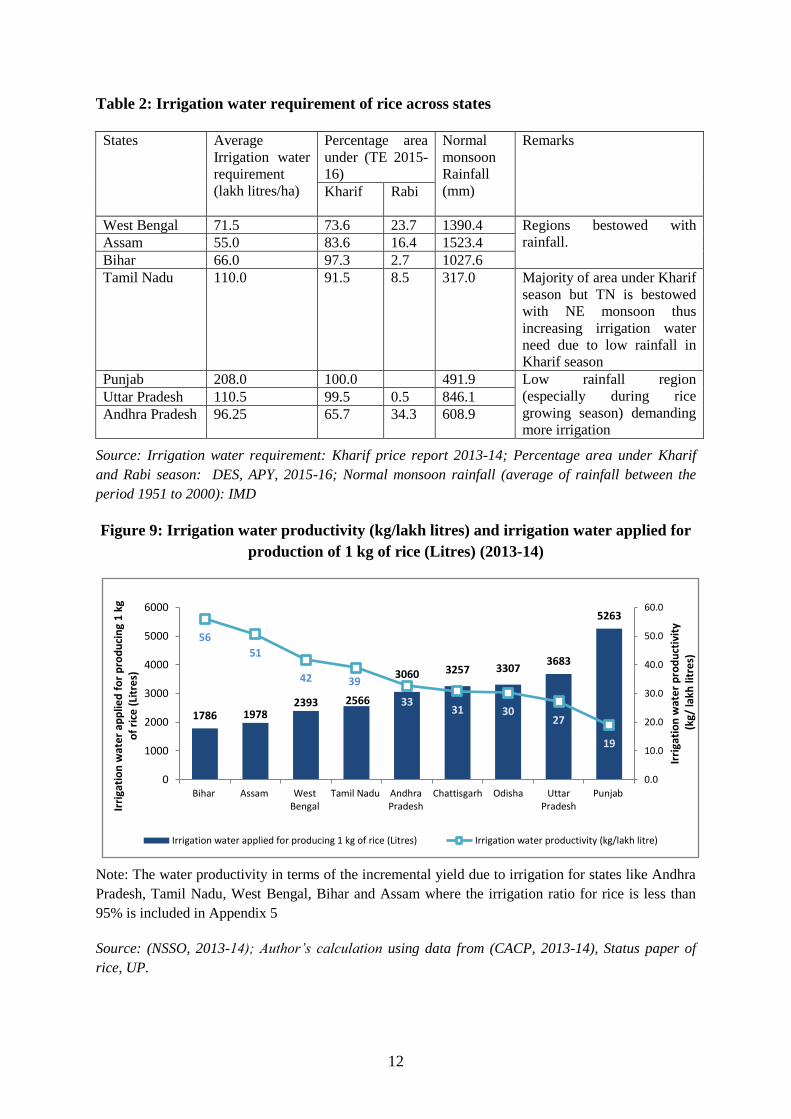
Depending upon the hydrological suitability of the region in terms of annual rainfall the
irrigation water requirement for paddy cultivation is different across the states (Table 2).
Punjab, Uttar Pradesh and Andhra Pradesh owing to their low rainfall status, depend highly
on irrigation water when compared to the West Bengal, Assam Bihar and Odisha bestowed
with ample rainfall, yet equally exposed to the vagaries of monsoon. In Tamil Nadu the major
rice growing season is the Kharif season, which does not coincide with its high rainfall of
North East monsoon, demanding more irrigation water for the crop cultivation.
The irrigation water productivity across the states is displayed in Figure 9. Punjab slips to the
bottom in comparison to the other major rice growing states indicating that Paddy in Punjab
is certainly not a wise man’s crop in terms of irrigation water productivity. It can be seen that
West Bengal can produce almost 42 kg of rice from one lakh litres (equivalent to 100 cubic
metres) of irrigated water while Punjab can produce only 19 kg of rice from the same
quantity of water. More precisely, Punjab consumes almost two times more water than West
Bengal and almost three times more water than Bihar for producing the same one kg of rice.
Bihar tops the ranking with highest productivity of rice per unit of irrigation water consumed
(56 kg/ lakh litres).
Figure 8: Irrigated yield and irrigation coverage of rice crop across states (2013-14)
16 Methodology with formula used in calculation given in Annexure 1 17 Irrigated yield and irrigated land productivity have been used synonymously in the paper and convey the
same meaning ( crop output produced per unit of irrigated land area)
2162 2195
27812988 3000
3145
36963952 4287
33.035.3
11.0
46.9
83.4
97.3
63.0
99.693.4
0.0
10.0
20.0
30.0
40.0
50.0
60.0
70.0
80.0
90.0
100.0
0
500
1000
1500
2000
2500
3000
3500
4000
4500
5000
Odisha Chattisgarh Assam WestBengal
UttarPradesh
AndhraPradesh
Bihar Punjab Tamil Nadu
Irri
gati
on
co
vera
ge o
f ri
ce (
%)
Irri
gate
d y
ield
(kg
/ha)
Average irrigated yield (kg/ha) Irrigation coverage of rice in states (% share in rice cropped area in state)
12
Table 2: Irrigation water requirement of rice across states
States Average
Irrigation water
requirement
(lakh litres/ha)
Percentage area
under (TE 2015-
16)
Normal
monsoon
Rainfall
(mm)
Remarks
Kharif Rabi
West Bengal 71.5 73.6 23.7 1390.4 Regions bestowed with
rainfall. Assam 55.0 83.6 16.4 1523.4
Bihar 66.0 97.3 2.7 1027.6
Tamil Nadu 110.0 91.5 8.5 317.0 Majority of area under Kharif
season but TN is bestowed
with NE monsoon thus
increasing irrigation water
need due to low rainfall in
Kharif season
Punjab 208.0 100.0 491.9 Low rainfall region
(especially during rice
growing season) demanding
more irrigation
Uttar Pradesh 110.5 99.5 0.5 846.1
Andhra Pradesh 96.25 65.7 34.3 608.9
Source: Irrigation water requirement: Kharif price report 2013-14; Percentage area under Kharif
and Rabi season: DES, APY, 2015-16; Normal monsoon rainfall (average of rainfall between the
period 1951 to 2000): IMD
Figure 9: Irrigation water productivity (kg/lakh litres) and irrigation water applied for
production of 1 kg of rice (Litres) (2013-14)
Note: The water productivity in terms of the incremental yield due to irrigation for states like Andhra
Pradesh, Tamil Nadu, West Bengal, Bihar and Assam where the irrigation ratio for rice is less than
95% is included in Appendix 5
Source: (NSSO, 2013-14); Author’s calculation using data from (CACP, 2013-14), Status paper of
rice, UP.
1786 19782393 2566
3060 3257 33073683
5263
56
51
42 39
3331 30
27
19
0.0
10.0
20.0
30.0
40.0
50.0
60.0
0
1000
2000
3000
4000
5000
6000
Bihar Assam WestBengal
Tamil Nadu AndhraPradesh
Chattisgarh Odisha UttarPradesh
Punjab
Irri
gati
on
wat
er
pro
du
ctiv
ity
(kg/
lakh
litr
es)
Irri
gati
on
wat
er
app
lied
fo
r p
rod
uci
ng
1 k
g o
f ri
ce (
Litr
es)
Irrigation water applied for producing 1 kg of rice (Litres) Irrigation water productivity (kg/lakh litre)
13
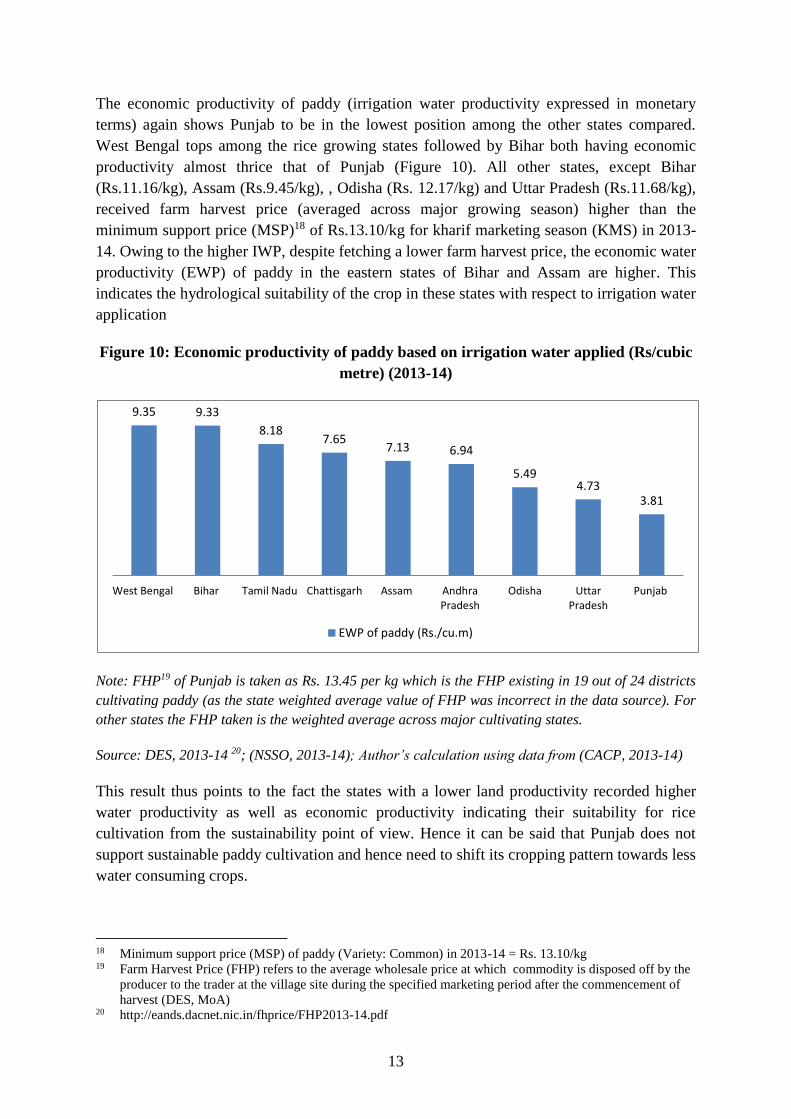
The economic productivity of paddy (irrigation water productivity expressed in monetary
terms) again shows Punjab to be in the lowest position among the other states compared.
West Bengal tops among the rice growing states followed by Bihar both having economic
productivity almost thrice that of Punjab (Figure 10). All other states, except Bihar
received farm harvest price (averaged across major growing season) higher than the
minimum support price (MSP)18 of Rs.13.10/kg for kharif marketing season (KMS) in 2013-
14. Owing to the higher IWP, despite fetching a lower farm harvest price, the economic water
productivity (EWP) of paddy in the eastern states of Bihar and Assam are higher. This
indicates the hydrological suitability of the crop in these states with respect to irrigation water
application
Figure 10: Economic productivity of paddy based on irrigation water applied (Rs/cubic
metre) (2013-14)
Note: FHP19 of Punjab is taken as Rs. 13.45 per kg which is the FHP existing in 19 out of 24 districts
cultivating paddy (as the state weighted average value of FHP was incorrect in the data source). For
other states the FHP taken is the weighted average across major cultivating states.
Source: DES, 2013-14 20; (NSSO, 2013-14); Author’s calculation using data from (CACP, 2013-14)
This result thus points to the fact the states with a lower land productivity recorded higher
water productivity as well as economic productivity indicating their suitability for rice
cultivation from the sustainability point of view. Hence it can be said that Punjab does not
support sustainable paddy cultivation and hence need to shift its cropping pattern towards less
water consuming crops.
18 Minimum support price (MSP) of paddy (Variety: Common) in 2013-14 = Rs. 13.10/kg 19 Farm Harvest Price (FHP) refers to the average wholesale price at which commodity is disposed off by the
producer to the trader at the village site during the specified marketing period after the commencement of
It is increasingly realized that water is going to be a bigger constraint in Indian agriculture
than even land. Given that India is going to be most populous nation on this planet by 2024,
and its demand for food, feed, fiber is going to accelerate with rising per capita income, both
land and water are going to be under tremendous pressure. India has over 17 percent of global
population but only 2 percent of geographical area (11% of global arable land) and 4 percent
of fresh water resources of this planet. Given the challenges emerging from climate change,
which hint towards greater frequency and intensity of droughts and floods, India must focus
not only on augmenting its utilizable water resources but more importantly on using scarce
water resources more efficiently. The first and foremost thing in that direction is to change
the mindset of our policy makers towards measuring water-productivity of agriculture, as
agriculture today consumes 78 percent of fresh water resources. The inequity in irrigation
water allocation among crops, with more than 60 per cent of it being diverted for cultivation
of two water guzzler crops – sugarcane and paddy, add to distress in agriculture water use.
Competing demands of water from rapid urbanization and industrialization cannot be met
unless agriculture makes a paradigm shift in water use.
The case study of rice in Punjab and sugarcane in Maharashtra throws light on the issue of
unsustainable agriculture water use prevalent in two regions with completely different water
ecology. Punjab with 99 per cent irrigation cover is facing the issue of depleting groundwater
and Maharashtra with just 19 per cent irrigation cover is affected by the issue of inefficient
crop-water use.
In case of rice, Tamil Nadu and Punjab reports the high land productivity (kg/ha) for irrigated
rice in India. However, when irrigation water productivity of irrigated rice crop is considered
Bihar tops the list, producing almost 56 kg of rice from one lakh litres of irrigated water
unlike Punjab which slips to the bottom producing just 19 kg. The economic water
productivity also shows Punjab to be inefficient in paddy cultivation producing paddy output
worth Rs. 3.81 per cubic metre of irrigation water applied relative to the eastern states of
West Bengal and Bihar producing output worth three times that of Punjab from the same
quantity of water applied. In the midst of the alarming rate of groundwater depletion and the
low irrigation water productivity, paddy in Punjab is certainly not a wise choice. However,
states with high irrigation and economic water productivity rankings (eastern states of Bihar,
West Bengal, etc) report low profitability in comparison to water stressed Punjab. Due to the
lack of efficient procurement system for rice farmers often get paddy prices way below the
minimum support prices (MSPs), thus reflecting a lower profitability from the cultivation of
the crop. On the other hand, the assured procurement policy along with the free electricity
supply for agriculture in Punjab ensures ideal conditions for farmers in cultivating paddy crop
despite high social cost incurred in terms of fast depleting water table, which will have
negative impact on the welfare of the future generation in the state.
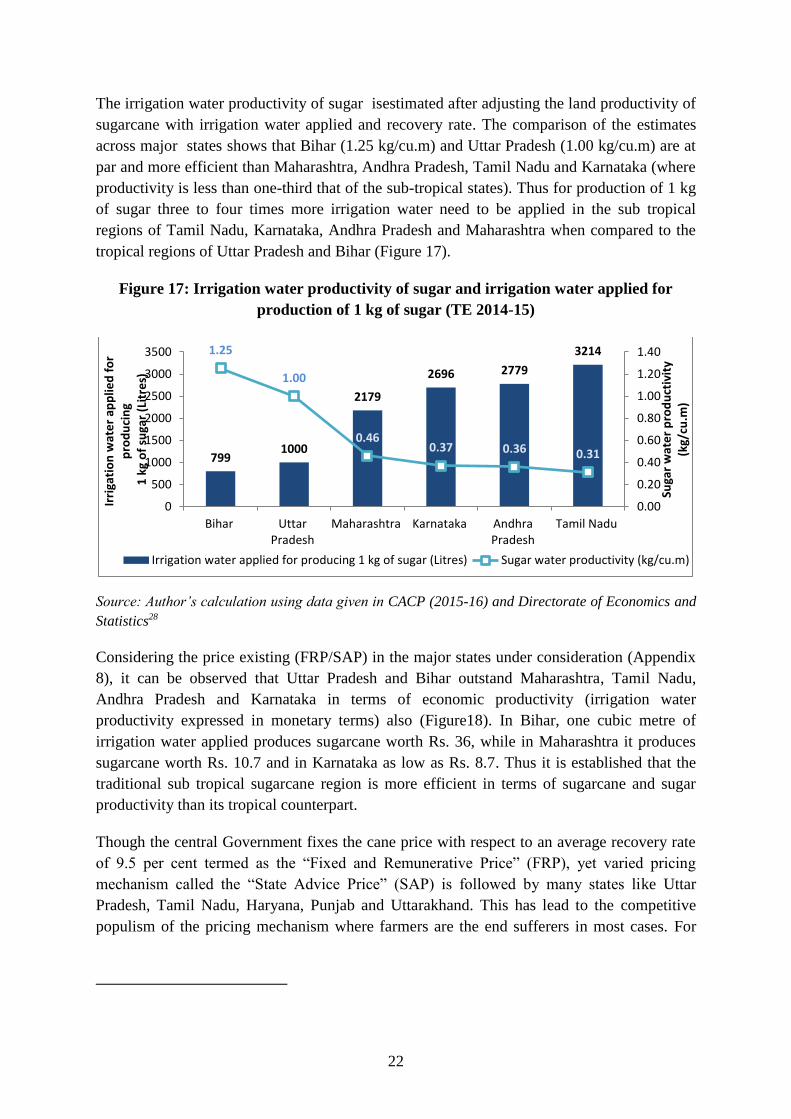
In case of sugarcane, owing to the wide variations existing in crop duration, sugar recovery
rates and irrigation water applied across states, it is essential to normalize these factors before
drawing realistic conclusions on the water productivity of the crop among the major
33
cultivating states. Tamil Nadu has high sugarcane productivity per unit area (103kg/ha), but
when irrigation water productivity is evaluated traditional sub-tropical sugarcane region
comprising of UP and Bihar emerge to be more efficient. The irrigation water productivity in
the traditional sugarcane region (UP and Bihar) is almost thrice that of the tropical region
comprising that of Maharashtra, Tamil Nadu, Karnataka and Andhra Pradesh. More
precisely, one cubic metre of water produces 1.25 kg of sugar in Bihar and 1 kg of sugar in
UP while in Maharashtra, Karnataka, Andhra Pradesh and Tamil Nadu, as low as 0.46 kg,
0.37kg, 0.36kg and 0.31 kg of sugar are produced respectively from the same quantity of
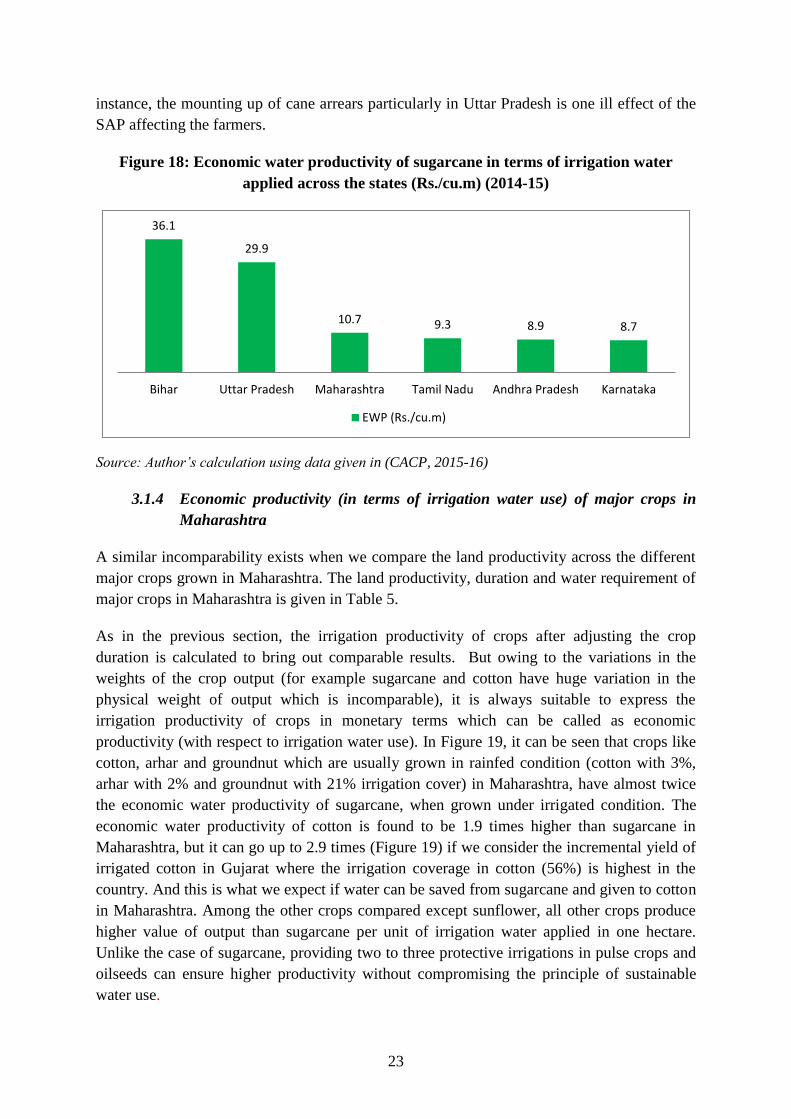
water. Economic water productivity of sugarcane in Bihar and UP are as high as Rs. 36 and
Rs. 30 per cubic metre of irrigation water applied. While in Maharashtra, Tamil Nadu,
Andhra Pradesh and Karnataka, EWP comes to Rs. 10.7, Rs. 9.3, Rs. 8.3 and Rs. 8.7
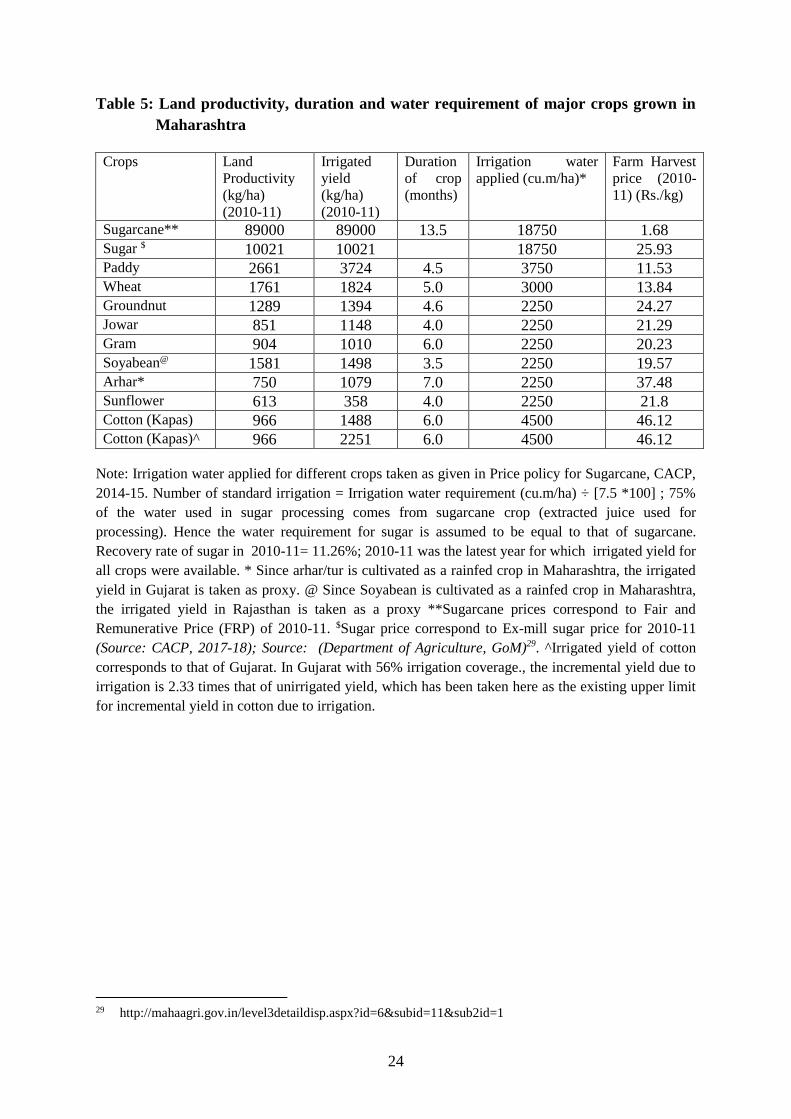
respectively per cubic metre of irrigation water. Similarly, on comparing the economic water
productivity across major crops in Maharashtra, it is observed that cotton, tur and groundnut
produce output with value twice that of sugarcane. Among the other crops compared except
sunflower, all other crops produce higher value of output than sugarcane per unit of irrigation
water applied in one hectare. These results clearly indicate that cultivation of a water guzzler
crop like sugarcane stands out as a paradox in water stressed state like Maharashtra with just
18 per cent irrigation coverage. Hence there is a need to re align the cropping pattern keeping
in mind the scarcity of irrigation water availability in the state. But due to the full irrigation
coverage and higher profitability due to assured markets to sugar mills, sugarcane farmers are
mostly reluctant to shift their cropping pattern to other crops. Thus there is a need to have
innovative policies and technologies that can save water applied to sugarcane and divert the
saved water to other less water intensive and more economically water productive crops.
Specific Policy emerging from study
1. Shifting water intensive crops to water abundant regions
The two most water intensive crops, rice and sugarcane, are being cultivated in large scale in
some of the most water stressed regions of the country. The rice cultivation in water scarce
north western parts of the country, particularly Punjab, needs to be reconsidered and must be
shifted to the eastern regions like Bihar, West Bengal, Assam etc which report higher IWP
and EWP. Further, the eastern states must increase their rice productivity per unit land area
inorder to meet the loss in production in water stressed states like Punjab. Similarly
sugarcane cultivation must shift to the traditional sub tropical regions like UP and Bihar
having higher IWP and EWP to ensure sustainability. These changes are needed not as a
zero-one game, but at margin, to restore the balance between irrigation water available and
demand for that water by these crops, so that a sustainable cropping pattern can be
encouraged in line with water availability.
2. Strengthening marketing opportunity and procurement policies
Punjab government as well as farmers do realize that paddy cultivation is not good for their
future generations as water table is depleting fast. But the assured procurement of rice
discourage the farmers to go for crop diversification. The farmers are ready to switch to any
34
other crops provided their profitability is not less than what they have been getting through
paddy cultivation. Promoting less water intensive maize crop linked to processing industry
(for food and especially poultry feed) may ensure assured marketing opportunities to farmers,
thus encouraging them to shift their cropping pattern from rice. On the other hand there is a
need to strengthen the rice procurement policy in the eastern states to make paddy profitable
there which may encourage shift in rice cultivation from Punjab to the eastern regions.
In Maharashtra, the farmers have been benefited by the sugarcane crop owing to the
existence of well established sugar mills providing assured marketing opportunity to the
farmers. The market needs to be set right for cotton, pulses like tur and oilseeds like
groundnut having higher EWP and IWP than sugarcane, to encourage crop diversification
and shift area from sugarcane. Market risks for these crops can be reduced by encouraging
private sector to operate and hold stock, spurring futures market and calibrating the trade and
tariff policies. Unless higher profitability is ensured for the other crops, farmers will be
reluctant to shift their cropping patterns from sugarcane to other less water intensive crops.
Sugarcane cultivation must be promoted in the water abundant subtropical regions of UP and
Bihar. For this investment friendly climate must be created to set up new sugar mills and
rejuvenate the sick sugar mills in states like Bihar having high potential for sustainable sugar
production, but recording over 60 per cent of the established sugar mills to be non-
operational or closed.
3. Implementing efficient price reforms in water and power use in agriculture
The pricing of water in India should be done such that it reflects its scarcity. In our country
water pricing for agriculture is very inefficient with water charges for surface irrigation
remaining almost nil in many states for decades. Similarly the highly subsidized agriculture
power supply in many states like Punjab, Karnataka, Andhra Pradesh and latest in Telangana,
have led to over exploitation of groundwater for irrigation. On the other hand in the eastern
regions, there is acute inefficiency in timely availability of power supply leaving most of the
land unirrigated. Thus efficient price and supply reforms need to be adopted in water and
power sector to ensure sustainable irrigation water use. Water charges for surface irrigation
must be raised so that at least the operation and maintenance cost is fully recovered.
4. Direct Benefit transfer of water and power subsidies
As mentioned above, water and power are highly subsidized in agriculture primarily with the
aim to support farmers to increase the irrigation coverage under crop. This was a noble
attempt from the Government to increase productivity of crops through improvement in
irrigation coverage, but this has resulted in negative externalities arising from injudicious use
of water resource. Thus there must be a reorientation in the subsidy delivery mechanism of
these inputs. The price based subsidy existing for inputs at present must shift to income
directed policies, wherein the input subsidies/benefits must be directly transferred to the
farmer’s account rather than getting reflected in the price of the particular input. This may
also help farmers to afford the increased water and power charges, at same time encourage
them to judiciously use these resources.
35
5. Rationing of irrigation water and power used in agriculture
In case the price reforms in water and power in agriculture cannot be implemented, we may
focus upon rationing of water and power used in agriculture. The mechanism of rationing the
available irrigation water will help to reduce the skewness in irrigation water application
among crops. Each farmer must be allocated with definite volume of irrigation water from
canal system (as in warabandi system in Punjab) per unit of cultivated area and any excess
requirement of irrigation water (as for water guzzler crops like paddy and sugarcane) must be
purchased from farmers cultivating less water intensive crops like pulses. This helps to
incentivize farmers cultivating less water intensive crops in water scarce regions. For
rationing power use in agriculture, the system of metering of feeder and distribution lines for
irrigation must be ensured.
6. Adopting precision irrigation through micro irrigation system
Precision agriculture and water saving irrigation technology like micro irrigation must be
looked upon as the stepping stone for achieving agricultural productivity, profitability and
sustainability. Open canal system and flood irrigation existing in the country result in less
than one-third of the water released from dams actually reaching crops. Micro irrigation
technology (drip and sprinkler) with 85 to 90 per cent application efficiency can solve the
issue to a large extent. Further, piped water facility connecting the dams and the micro
irrigation system in the fields can reduce water loss and increase the overall water use
efficiency to almost 90 per cent. This also ensures availability of pressurized water for
effective operation of drip and sprinkler system in canal command areas.
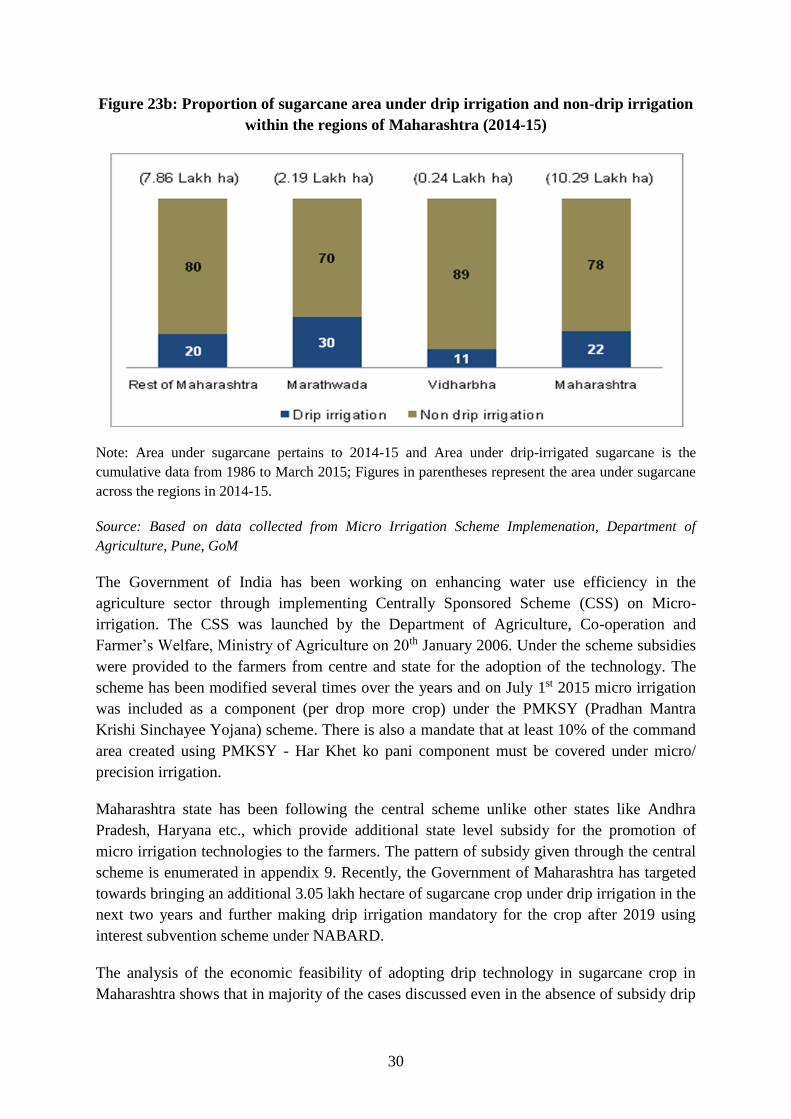
Drip technology has been found to be an economically feasible option in ensuring “per drop
more crop” in sugarcane in Maharashtra. Further water saved in the process could be diverted
to the other crops maintaining water equity. At present 2.25 lakh hectares of sugarcane area
has been brought under drip technology in Maharashtra. To promote farmers to adopt drip
irrigation in the remaining 7.6 lakh hectares sugarcane area, implementation of the micro
irrigation scheme (PMKSY) must be made through the sugar mills by making it mandatory
for the mills to purchase cane from only those farmers who have adopted the drip technology.
Recently, Maharashtra Government has come up with pilot schemes to increase area under
drip irrigation in sugarcane by 2019, which will be implemented in association with sugar
mills and with financial assistance from NABARD. Such policy measures must be adopted
by other states also to ensure better water use. Apart from this, Maharashtra Government has
formally adopted a policy of pressurized piped distribution system instead of open canal
system32 . This would minimize evaporation losses and would also do away with the need to
acquire land for canals.
At an installation cost of Rs. 85400 per hectare, a total of Rs. 6832 crore will be required to
bring 0.8 million hectare of sugarcane area under drip irrigation system in Maharashtra. If
this amount is raised (through grant, loan and private investment) in two years and if water
saved is diverted towards cotton crop, then by 2019 and additional 1.8 million hectare cotton 32 https://www.maharashtra.gov.in/site/Upload/Government%20Resolutions/Marathi/2015090115513344
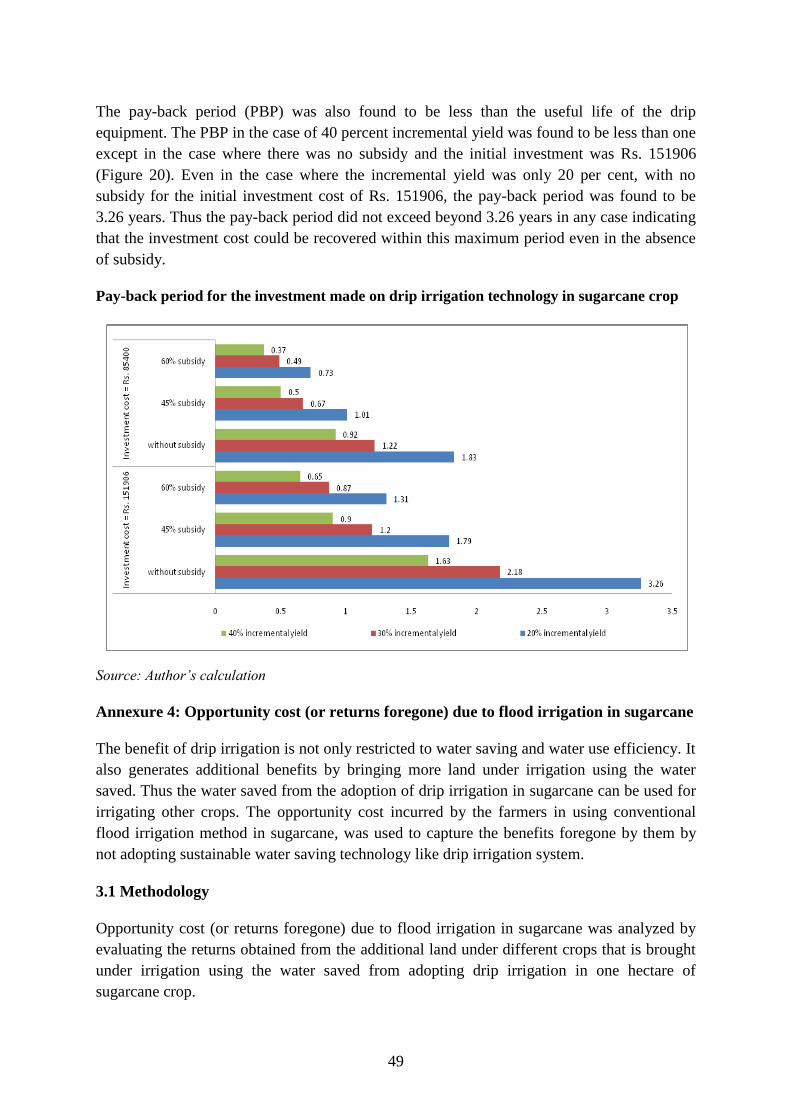
46547 Returns from drip irrigation at 20% incremental yield = Rs.
2615*17.80 = Rs. 46547
93094 Returns from drip irrigation at 20% incremental yield
= Rs. 2615*35.60 = Rs. 93094
45
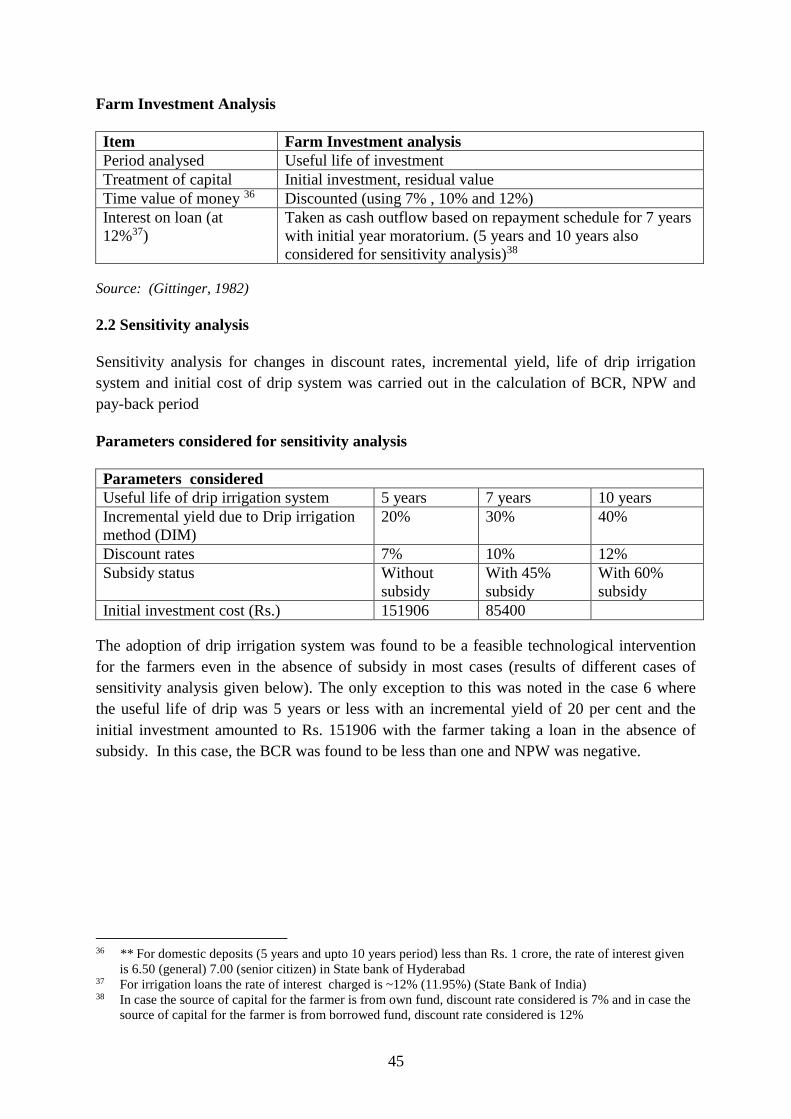
Farm Investment Analysis
Item Farm Investment analysis
Period analysed Useful life of investment
Treatment of capital Initial investment, residual value
Time value of money 36 Discounted (using 7% , 10% and 12%)
Interest on loan (at
12%37)
Taken as cash outflow based on repayment schedule for 7 years
with initial year moratorium. (5 years and 10 years also
considered for sensitivity analysis)38
Source: (Gittinger, 1982)
2.2 Sensitivity analysis
Sensitivity analysis for changes in discount rates, incremental yield, life of drip irrigation
system and initial cost of drip system was carried out in the calculation of BCR, NPW and
pay-back period
Parameters considered for sensitivity analysis
Parameters considered
Useful life of drip irrigation system 5 years 7 years 10 years
Incremental yield due to Drip irrigation
method (DIM)
20% 30% 40%
Discount rates 7% 10% 12%
Subsidy status Without
subsidy
With 45%
subsidy
With 60%
subsidy
Initial investment cost (Rs.) 151906 85400
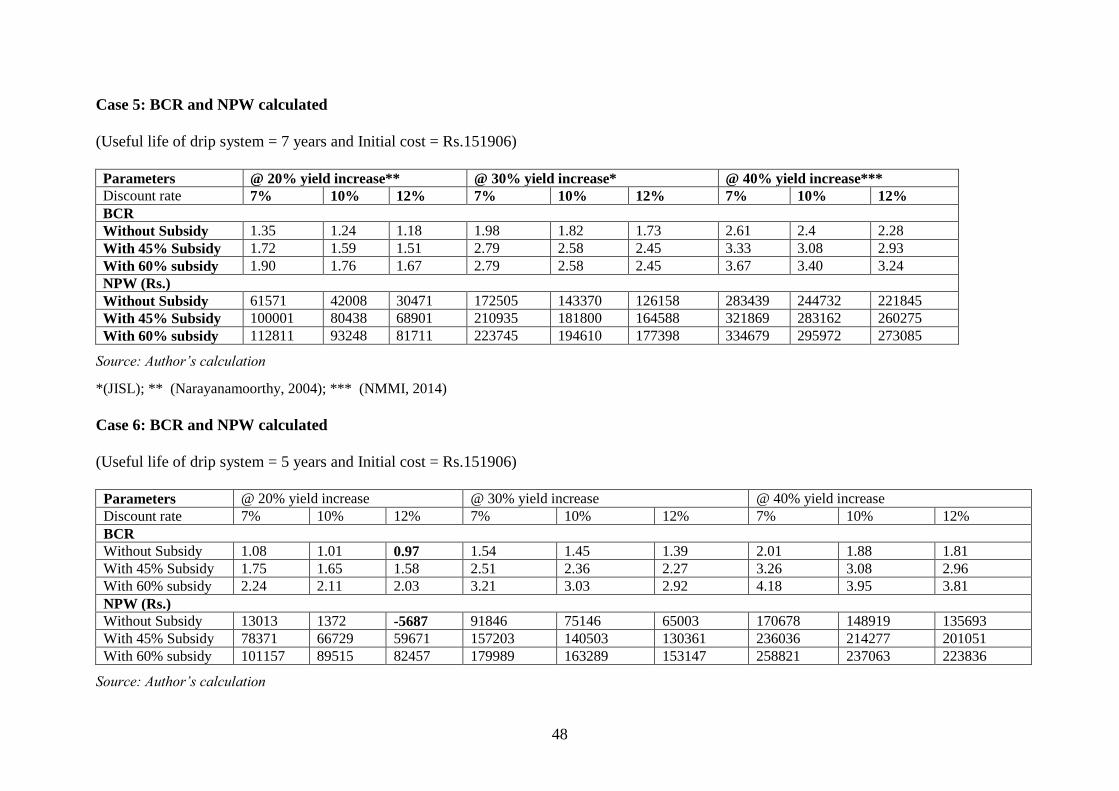
The adoption of drip irrigation system was found to be a feasible technological intervention
for the farmers even in the absence of subsidy in most cases (results of different cases of
sensitivity analysis given below). The only exception to this was noted in the case 6 where
the useful life of drip was 5 years or less with an incremental yield of 20 per cent and the
initial investment amounted to Rs. 151906 with the farmer taking a loan in the absence of
subsidy. In this case, the BCR was found to be less than one and NPW was negative.
36 ** For domestic deposits (5 years and upto 10 years period) less than Rs. 1 crore, the rate of interest given
is 6.50 (general) 7.00 (senior citizen) in State bank of Hyderabad 37 For irrigation loans the rate of interest charged is ~12% (11.95%) (State Bank of India) 38 In case the source of capital for the farmer is from own fund, discount rate considered is 7% and in case the
source of capital for the farmer is from borrowed fund, discount rate considered is 12%
46
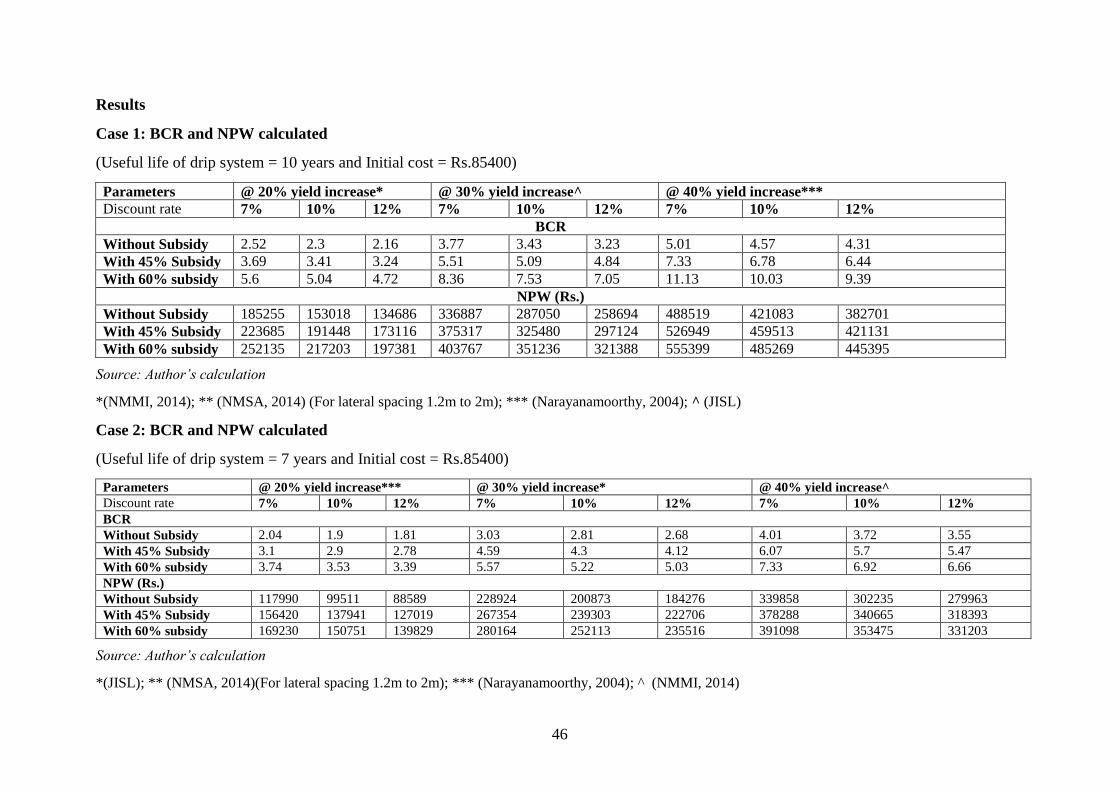
Results
Case 1: BCR and NPW calculated
(Useful life of drip system = 10 years and Initial cost = Rs.85400)