EUROPEAN CENTRAL BANK WORKING PAPER SERIES ECB EZB EKT BCE EKP EUROSYSTEM MONETARY TRANSMISSION NETWORK WORKING P ORKING P ORKING P ORKING P ORKING PAPER NO APER NO APER NO APER NO APER NO. 105 105 105 105 105 FINANCIAL SY FINANCIAL SY FINANCIAL SY FINANCIAL SY FINANCIAL SYSTEMS STEMS STEMS STEMS STEMS AND AND AND AND AND THE THE THE THE THE ROLE OF BANKS IN MONET OLE OF BANKS IN MONET OLE OF BANKS IN MONET OLE OF BANKS IN MONET OLE OF BANKS IN MONETAR AR AR AR ARY POLICY POLICY POLICY POLICY POLICY TRANSMISSION IN TRANSMISSION IN TRANSMISSION IN TRANSMISSION IN TRANSMISSION IN THE EUR THE EUR THE EUR THE EUR THE EURO O O O O AREA AREA AREA AREA AREA BY MICHAEL EHRMANN BY MICHAEL EHRMANN BY MICHAEL EHRMANN BY MICHAEL EHRMANN BY MICHAEL EHRMANN, LEONARDO GAMBA LEONARDO GAMBA LEONARDO GAMBA LEONARDO GAMBA LEONARDO GAMBACOR COR COR COR CORTA, A, A, A, A, JORGE MAR JORGE MAR JORGE MAR JORGE MARTÍNEZ-PA TÍNEZ-PA TÍNEZ-PA TÍNEZ-PAGES, GES, GES, GES, PA PA PA PA PATRICK SEVESTRE, TRICK SEVESTRE, TRICK SEVESTRE, TRICK SEVESTRE, TRICK SEVESTRE, ANDREAS WORMS ANDREAS WORMS ANDREAS WORMS ANDREAS WORMS ANDREAS WORMS December 2001 December 2001 December 2001 December 2001 December 2001 JORGE MARTÍNEZ-PAGÉS,
FINANCIAL SYFINANCIAL SYFINANCIAL SYFINANCIAL SYFINANCIAL SYSTEMS STEMS STEMS STEMS STEMS AND AND AND AND AND THETHETHETHETHERRRRROLE OF BANKS IN MONETOLE OF BANKS IN MONETOLE OF BANKS IN MONETOLE OF BANKS IN MONETOLE OF BANKS IN MONETARARARARARYYYYY
POLICY POLICY POLICY POLICY POLICY TRANSMISSION INTRANSMISSION INTRANSMISSION INTRANSMISSION INTRANSMISSION INTHE EURTHE EURTHE EURTHE EURTHE EURO O O O O AREAAREAAREAAREAAREA
BY MICHAEL EHRMANNBY MICHAEL EHRMANNBY MICHAEL EHRMANNBY MICHAEL EHRMANNBY MICHAEL EHRMANN,,,,,LEONARDO GAMBALEONARDO GAMBALEONARDO GAMBALEONARDO GAMBALEONARDO GAMBACORCORCORCORCORTTTTTA,A,A,A,A,JORGE MARJORGE MARJORGE MARJORGE MARTÍNEZ-PATÍNEZ-PATÍNEZ-PATÍNEZ-PAGES,GES,GES,GES,
December 2001December 2001December 2001December 2001December 2001
JORGE MARTÍNEZ-PAGÉS,
E U R O P E A N C E N T R A L B A N K
WO R K I N G PA P E R S E R I E S
EUROSYSTEM M
ONETARY
TRANSM
ISSION
NETW
ORK
1 European Central Bank.2 Banca d’Italia.3 Banco de España.4 Banque de France and Université Paris Val de Marne.5 Deutsche Bundesbank. This paper represents the authors’ personal opinions and does not necessarily reflect the views of the institutions they are affiliated to. We would like to thank
the members of the Eurosystem’s Monetary Transmission Network and the participants of the monetary economics workshop at the NBER Summer Institute 2001 for helpfuldiscussions and feedback, and especially Ignazio Angeloni, Ignacio Hernando, Anil Kashyap, Claire Loupias, Benoit Mojon and Fred Ramb for their comments and suggestions.
FINANCIAL SYFINANCIAL SYFINANCIAL SYFINANCIAL SYFINANCIAL SYSTEMS STEMS STEMS STEMS STEMS AND AND AND AND AND THETHETHETHETHERRRRROLE OF BANKS IN MONETOLE OF BANKS IN MONETOLE OF BANKS IN MONETOLE OF BANKS IN MONETOLE OF BANKS IN MONETARARARARARYYYYY
POLICY POLICY POLICY POLICY POLICY TRANSMISSION INTRANSMISSION INTRANSMISSION INTRANSMISSION INTRANSMISSION INTHE EURTHE EURTHE EURTHE EURTHE EURO O O O O AREAAREAAREAAREAAREA
BY MICHAEL EHRMANNBY MICHAEL EHRMANNBY MICHAEL EHRMANNBY MICHAEL EHRMANNBY MICHAEL EHRMANN11111,,,,,LEONARDO GAMBALEONARDO GAMBALEONARDO GAMBALEONARDO GAMBALEONARDO GAMBACORCORCORCORCORTTTTTAAAAA22222,,,,,JORGE MARJORGE MARJORGE MARJORGE MARTÍNEZ-PATÍNEZ-PATÍNEZ-PATÍNEZ-PAGESGESGESGES33333,,,,
Reproduction for educational and non-commercial purposes is permitted provided that the source is acknowledged.
The views expressed in this paper are those of the authors and do not necessarily reflect those of the European Central Bank.
ISSN 1561-0810
The Eurosystem Monetary Transmission Network This issue of the ECB Working Paper Series contains research presented at a conference on “Monetary Policy Transmission in the Euro Area” held at the European Central Bank on 18 and 19 December 2001. This research was conducted within the Monetary Transmission Network, a group of economists affiliated with the ECB and the National Central Banks of the Eurosystem chaired by Ignazio Angeloni. Anil Kashyap (University of Chicago) acted as external consultant and Benoît Mojon as secretary to the Network. The papers presented at the conference examine the euro area monetary transmission process using different data and methodologies: structural and VAR macro-models for the euro area and the national economies, panel micro data analyses of the investment behaviour of non-financial firms and panel micro data analyses of the behaviour of commercial banks. Editorial support on all papers was provided by Briony Rose and Susana Sommaggio.
ECB • Work ing Pape r No 105 • December 2001 3
Contents
Abstract 4
Non-technical summary 5
1. Introduction 7
2. The structure of the banking system in the euro area and its implications for therole of banks in monetary policy transmission 102.1 The structure of the banking system in the euro area 102.2 Some conjectures on the role of banks in monetary policy transmission 17
3. The model 20
4. Evidence from BankScope data 244.1 Evidence on the aggregate euro area level 254.2 Evidence on single countries in a pooled regression 274.3 Evidence on France, Germany, Italy and Spain in separate regressions 28
5. Evidence from Eurosystem datasets 29
6. Macroeoconomic relevance 34
7. Conclusions 35
References 37
APPENDIX 1: Databases and estimation methods 40
European Central Bank Working Paper Series 53
AbstractThis paper offers a comprehensive comparison of the structure of banking andfinancial markets in the euro area. Based on this, several hypotheses about the role ofbanks in monetary policy transmission are developed. Many of the predictions thathave been proposed for the U.S. are deemed unlikely to apply in Europe. Testingthese hypotheses we find that monetary policy does alter bank loan supply, with theeffects most dependent on the liquidity of individual banks. Unlike in the US, thesize of a bank does generally not explain its lending reaction. We also show that thestandard publicly available database, BankScope, obscures the heterogeneity acrossbanks. Indeed, for several types of questions BankScope data suggest very differentanswers than more complete data that reside at national central banks.
This paper analyses the role of banks in monetary policy transmission in the euro area. Banksare of major importance for the financing of firms in the euro area, which implies that the waythey adjust lending in response to monetary policy actions can potentially constitute animportant channel through which monetary policy works.
Banks are exposed to problems of informational asymmetry. It has been shown in severalrecent contributions on the US economy, that this may have consequences for the reaction ofbanks to monetary policy. Essentially, it has been shown that a change in interest rates canlead to distributional effects across banks that are informationally opaque to a differentdegree. For example, smaller banks have been found to be more affected by monetary policytightenings than large banks, and as such have been forced to restrict their lending morestrongly. Similar effects have been shown for banks with different levels of liquidity andcapitalisation.
When conducting tests of this kind for the euro area, we argue that the specificity of Europeanbanking and financial structures has to be kept in mind. We therefore compile acomprehensive overview of banking and financial market characteristics that we considerrelevant for the role of banks in monetary policy transmission, and compare them both to theUS and across the euro area countries. We argue that there are several reasons why theevidence found for the US should not necessarily be found for the euro area as well. Mainly,we would expect that the size of a bank need not be informative for the way it adjusts lendingafter a monetary contraction, whereas its liquidity might very well be.
These hypotheses are then tested in an empirical analysis, where we employ both a publiclyavailable dataset that has frequently been used in recent contributions on this topic, and morecomplete datasets residing at the national central banks of the euro area. Additionally, wedraw on results obtained in several companion papers to complete our analysis.
We find that a monetary policy tightening generally reduces bank lending, and that for mostcountries, the size of a bank does not explain its lending reaction, whereas its degree ofliquidity does.
We also show that the publicly available database suffers from a representation bias. Sincesmall banks are not adequately covered, the microeconomic distributional effects areestimated on a biased sample of banks. This might explain contradictory findings in theprevious literature as well as the few cases of coinciding evidence in this and earlier studies.When estimating the macroeconomic importance of the bank loan response, this bias is lessimportant, however. Since the coverage of large banks is relatively good, both the estimatescalculated with the publicly available database and those obtained with the completepopulation of banks arrive at quantitatively similar conclusions.
ECB • Work ing Pape r No 105 • December 2001 5
The Eurosystem datasets, on the other hand, produce a set of stable and robust results thatimproves markedly on the existing evidence on the role of banks in monetary policytransmission in the euro area to date.
ECB • Work ing Pape r No 105 • December 20016
1. IntroductionOn January 1st, 1999, eleven European countries fixed the exchange rates of their nationalcurrencies irrevocably and started monetary union with the conduct of a single monetarypolicy under the responsibility of the Governing Council of the European Central Bank.1
This creation of a single currency for several countries raises the need to better understandthe transmission process of monetary policy in the new currency area. While theory offersa wide array of different transmission channels (e.g., the exchange rate, asset price orinterest rate channels,...), those that offer an important role for banks are of special interesthere, mainly for two reasons.
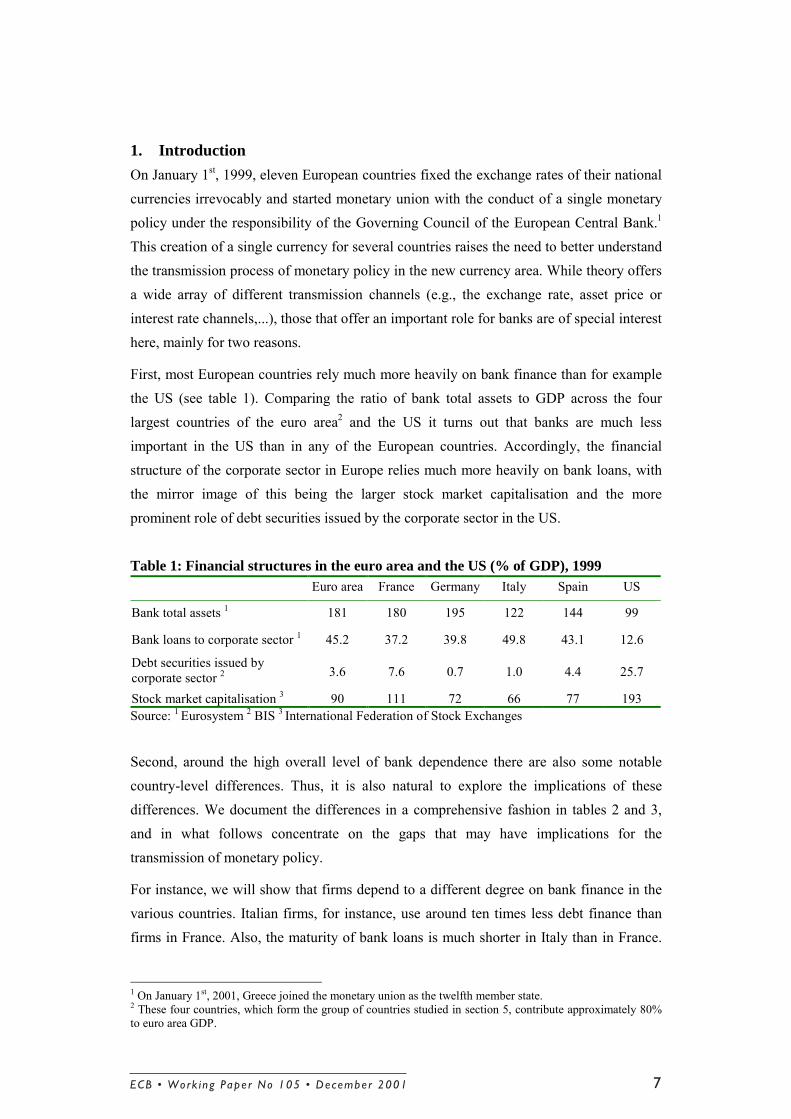
First, most European countries rely much more heavily on bank finance than for examplethe US (see table 1). Comparing the ratio of bank total assets to GDP across the fourlargest countries of the euro area2 and the US it turns out that banks are much lessimportant in the US than in any of the European countries. Accordingly, the financialstructure of the corporate sector in Europe relies much more heavily on bank loans, withthe mirror image of this being the larger stock market capitalisation and the moreprominent role of debt securities issued by the corporate sector in the US.
Table 1: Financial structures in the euro area and the US (% of GDP), 1999Euro area France Germany Italy Spain US
Bank total assets 1 181 180 195 122 144 99
Bank loans to corporate sector 1 45.2 37.2 39.8 49.8 43.1 12.6
Stock market capitalisation 3 90 111 72 66 77 193Source: 1 Eurosystem 2 BIS 3 International Federation of Stock Exchanges
Second, around the high overall level of bank dependence there are also some notablecountry-level differences. Thus, it is also natural to explore the implications of thesedifferences. We document the differences in a comprehensive fashion in tables 2 and 3,and in what follows concentrate on the gaps that may have implications for thetransmission of monetary policy.
For instance, we will show that firms depend to a different degree on bank finance in thevarious countries. Italian firms, for instance, use around ten times less debt finance thanfirms in France. Also, the maturity of bank loans is much shorter in Italy than in France.
1 On January 1st, 2001, Greece joined the monetary union as the twelfth member state.2 These four countries, which form the group of countries studied in section 5, contribute approximately 80%to euro area GDP.
ECB • Work ing Pape r No 105 • December 2001 7
Such a shorter maturity structure of bank loans is likely to accelerate the monetarytransmission, since loans have to be renewed much more frequently.
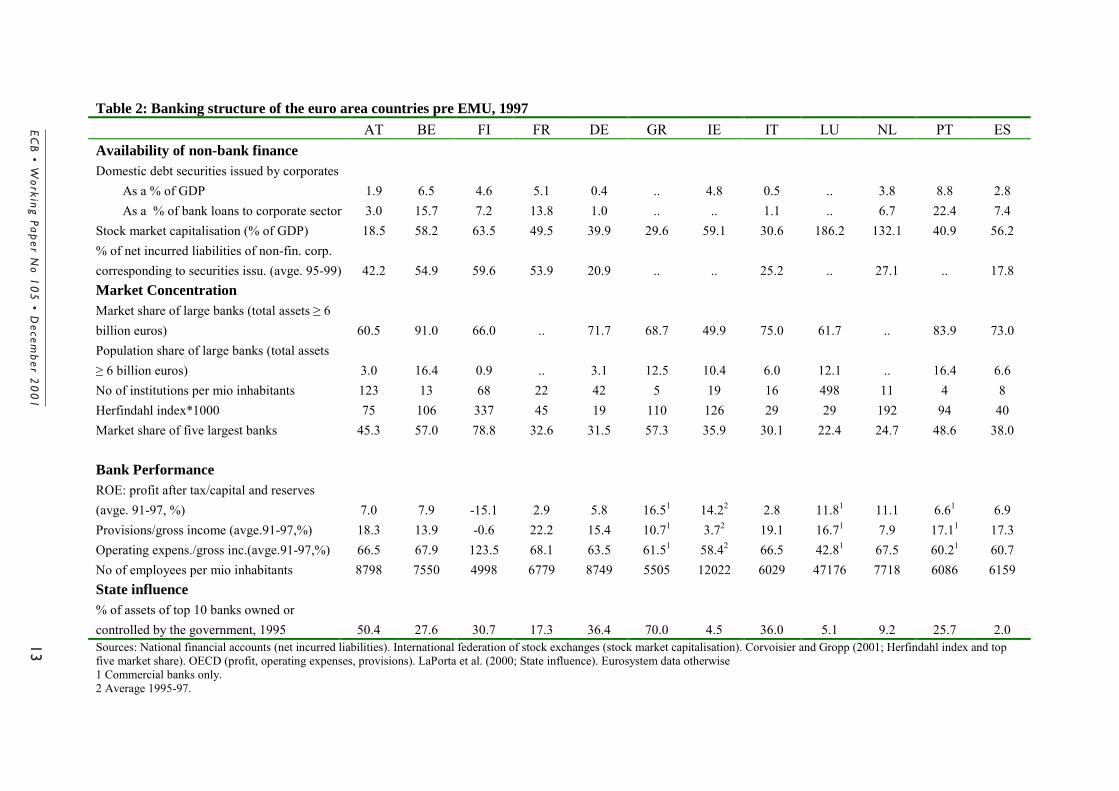
Another example is heterogeneity of the market structure of the banking industry acrosseuro area countries. The national market concentration as measured by the Herfindahlindex is much lower in Germany than for example in France. On the other hand, in bothcountries the five largest banks show a similar market share. Germany is thereforecharacterised by a banking system with many more very small banks, a large proportion ofwhich is affiliated to a network. These differences in the national market structure canpotentially alter the transmission of monetary policy impulses.
We try to quantify the importance of these considerations by focusing on three questions:(1) what is the role of banks (i.e. bank loans) in monetary transmission in the euro area,(2) are there differences in this respect across the member countries of EMU, and (3) arethere distributional effects of monetary policy on different types of banks?
These issues have also been addressed in several recent studies on the monetarytransmission process at the aggregate level.3 However, the macroeconomic evidence is notconclusive, mainly because of the wide confidence intervals that are normally associatedwith those estimates. This paper makes use of microdata on banks. By using the cross-sectional information of these datasets, we hope to get more precise estimates, thusallowing for better inference on differences across countries. Read in conjunction withseveral companion papers analysing the country-level, this makes for a very completeanalysis of the role of banks in monetary policy transmission in the euro area.
The central task in this effort is to identify the reaction of loan supply to monetary policyactions. This is important since bank loans are the most important link between banks andprivate non-banks, and because bank loans very often cannot be easily substituted by otherforms of finance on the borrower�s side. For the analysis of bank loan supply, cross-sectional differences between banks can aid in the identification problem.4
In particular, we investigate whether there are certain types of banks whose lending ismore responsive to monetary policy impulses. This would be the case if a monetary policyinduced decrease in deposits (or increase in the cost of funding) were differentially hard
3 E.g., Ciccarelli and Rebucci (2001); Clements et al (2001); Mihov (2001); Sala (2001). For a model whichexplicitly takes into account the effect of differences in the bank lending channel on monetary policy seeGambacorta (2001a).4 This identification strategy has been used extensively in the literature on the bank lending channel. Itattributes banks an active role in the transmission mechanism of monetary policy, arguing that banks reducetheir loan supply following a monetary contraction. If bank loans are not perfectly substitutable by other formsof finance by borrowers, then this reduction in loan supply leads to real effects (given a certain degree of pricerigidity). See, amongst others, Kashyap and Stein (1995, 1997).
ECB • Work ing Pape r No 105 • December 20018
for banks to neutralise. If the banks face different funding costs, the same impulse willlead to different reductions in lending across banks.
The prior literature has proceeded by positing several differences that could shape loansupply sensitivity to monetary policy. One strand of this literature checks whether poorlycapitalised banks have a more limited access to nondeposit financing and as such shouldbe forced to reduce their loan supply by more than well capitalised banks do (e.g., Peekand Rosengren, 1995). The role of size has been emphasised, for example, in Kashyap andStein (1995): small banks are assumed to suffer from informational asymmetry problemsmore than large banks do, and find it therefore more difficult to raise uninsured funds intimes of monetary tightening. Again, this should force them to reduce their bank lendingrelatively more when compared to large banks. Another distinction is often drawnbetween more and less liquid banks (e.g., Kashyap and Stein, 2000). Whereas relativelyliquid banks can draw down their liquid assets to shield their loan portfolio, this is notfeasible for less liquid banks.5
In section 2 we will provide a description of the financial markets in the countries of theeuro area. We will argue that these characteristics are important for the role of banks inmonetary policy transmission, and that some of the results found for the US are not likelyto be applicable in the European context. Mainly, we believe that the size criterion is notnecessarily a good indicator for distributional effects across banks. These presumptionswill be tested in the empirical analysis, where we consider which bank characteristics, i.e.size, liquidity or capitalisation distinguish banks� responses to changes in the interest ratesalso in Europe. In this paper, we will perform regressions for the euro area as a whole andthe four largest countries of the euro area, and furthermore draw on the results obtained inthe companion papers. Whereas the companion papers are written with a nationalperspective, the main aim of this paper is to provide an overview of those results obtainedat the national level, to produce a more comparable set of results by performingregressions in a harmonised approach, and to broaden the focus to the euro area as awhole.
The remainder of the paper is organised as follows. Section 2 describes the structure of thebanking sector in the euro area and the consequences it might have for the role of banks inmonetary policy transmission. The theoretical model underlying our analysis is introducedin section 3. Section 4 presents results for the entire euro area and the four largest membercountries using individual bank balance sheet data provided by BankScope, which havebeen used extensively in the literature, in order to assess their quality for this type ofanalysis. Section 5 presents evidence on a national basis using databases on the full 5 Stein (1998); Ashcraft (2001); Kishan and Opiela (2000); Van den Heuvel (2001).
ECB • Work ing Pape r No 105 • December 2001 9
population of banks collected by the respective national central banks. Section 6 providessome measures of the macroeconomic importance of the results obtained. Section 7summarises the main conclusions.
2. The structure of the banking system in the euro area and its implicationsfor the role of banks in monetary policy transmission
2.1 The structure of the banking system in the euro area
This section provides a short description of the structure of the banking system in the euroarea. As a background, table 2 reports a number of statistics on the banking market in theindividual euro area countries. It covers indicators for the availability of non-bank financefor firms, measures of concentration of the banking market, statistics on the performanceof banks as well as an index of the role of the government in banking. The table showsthat bank finance, as stated in the introduction, is of primary importance in most countriesof the euro area, and gives some indication as to the heterogeneity of banking structures.
We believe several features of national banking structures to be important for the responseof bank lending to a monetary policy action, and for the assessment of the macroeconomicimportance of such responses. In the following, we highlight the most distinctive patternsthat might be relevant in this context and refer the interested reader to the companionpapers, which elaborate in more detail on the main features of the respective nationalbanking systems.
Importance of banks for firms’ financingAs mentioned in the preceding section, banks play an important role in firms� financing.Market financing of the corporate sector is less developed than in the US. Even in France,where it is more important than in many countries of the euro area (see table 1), only thelargest firms can issue debt securities, and the role of banks in financing firms is stillmuch more dominant than in the US. To give another example, in Germany and Italy in1997, the ratio of bonds to total bank loans of firms stood at around 1 percent only. Thebusiness sector has therefore been heavily dependent on bank credit, while the smaller sizeof the capital market has limited diversification of bank assets. This indicates that changesin bank loan supply affect firms relatively strongly, since they cannot easily findsubstitutes for the bank finance.
ECB • Work ing Pape r No 105 • December 200110
Maturity of loans, collateralisationThe loans supplied by Italian banks are to a large extent short-term and come withvariable interest rates. The same tendency is present in Spain. This can accelerate thetransmission of monetary policy impulses to lending rates and thus borrowing costs. Onthe other hand, countries like Austria and the Netherlands have a longer maturity of loansand a higher share of fixed rate contracts.6 In countries like Italy, where a high percentageof loans is backed by collateral, the response of bank loans to monetary policy could befurthermore accentuated through the so called �balance sheet channel�.7
Relationship lendingIn several European countries, the market for intermediated finance is characterised byrelationship rather than arm�s length lending. It is very common that bank customersestablish long lasting relationships with banks, with a prominent example being theGerman system of �house banks�, in which firms conduct most of their financial businesswith one bank only.8 With most German banks operating as universal banks, and thereforesupplying their customers with the full range of financial services, this implies a muchcloser linkage to a single bank than in many other countries. For the creditor, this couldalso imply an implicit guarantee to have access to (additional) funds even if the centralbank follows a restrictive monetary policy.9 In such a case, the reaction of bank loansupply to monetary policy should be at least muted. Typically, house bank relationshipsexist between relatively small banks � for which the loan business with non-banks is still acentral activity � and their customers. Italy shows a similar pattern, where many smallbanks entertain close relationships with their customers, which are especially smallfirms.10 This is true for France as well, where most small firms have business relationshipswith one bank only. However, although being numerous, these small firms do not accountfor a large share of GDP.
Market concentration and size structureThe banking markets in the countries of the euro area have been characterised by asteadily increasing concentration during the 1990�s. It stands at different levels in thevarious countries, however. According to the Herfindahl index, Germany and Italy are atthe lower end of market concentration in the euro area, as opposed to Belgium, Greece,the Netherlands, and especially Finland.
6 Borio (1996).7 See, among others, Bernanke and Gertler (1989), Mishkin (1995), Oliner and Rudebusch (1996) andKashyap and Stein (1997).8 See, e.g., Elsas and Krahnen (1998).9 See, e.g., Rajan and Zingales (1998).10 Angelini, Di Salvo and Ferri (1998).
ECB • Work ing Pape r No 105 • December 2001 11
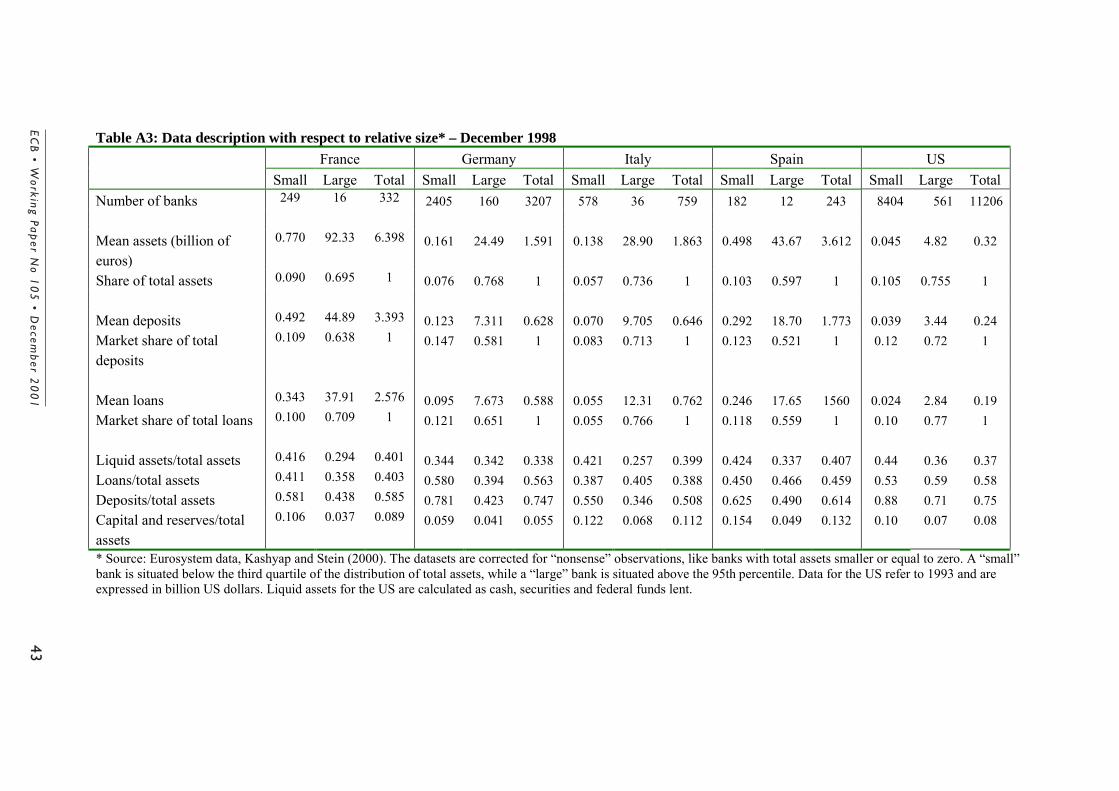
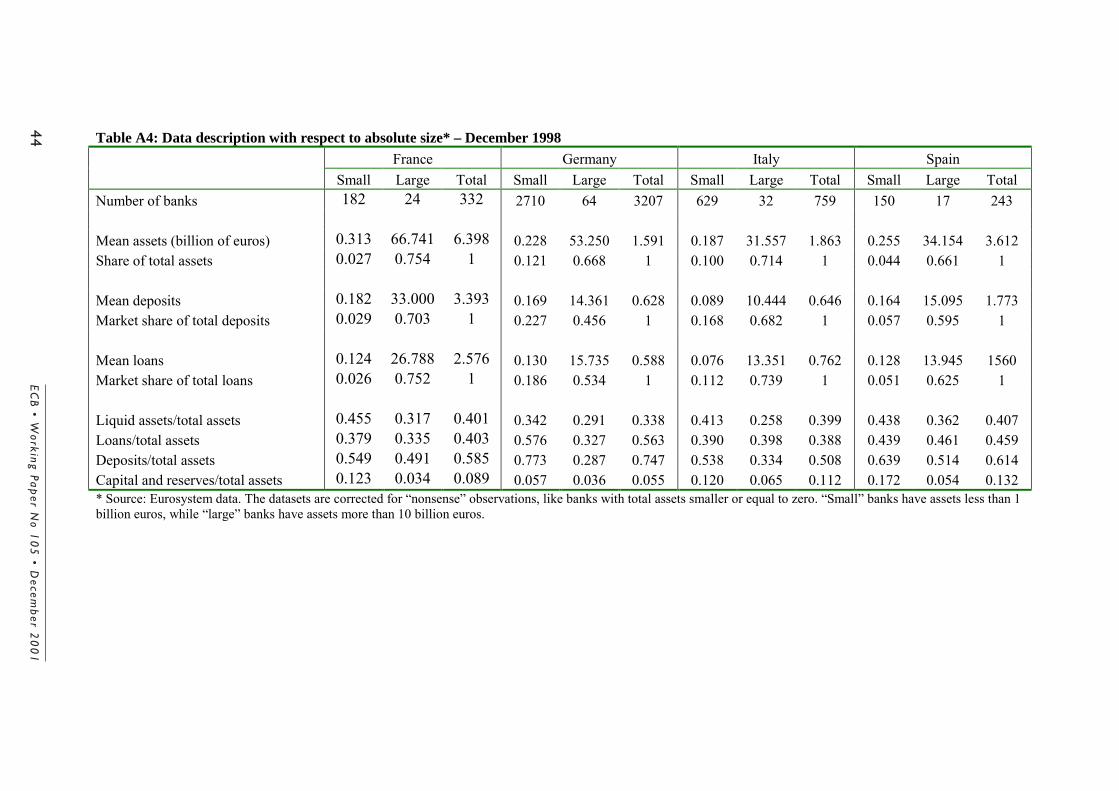
Tables A3 and A4 in the appendix provide a more detailed comparison of the sizestructure in the four largest countries of the euro area. We split the population of banksinto small and large banks with respect to a relative national threshold (with respect totheir size in comparison to the national distribution � table A3), as well as according to anabsolute criterion in terms of the value of their total assets (table A4).
For all countries, a small number of large banks holds a major share in both the loan anddeposit market: the 75% smallest banks hold only around 8% to 15% of deposits, andaccount for around 5% to 12% of loans, whereas the 5% largest banks hold around 52% to71% of deposits and have a market share of around 56% to 77% in loans. Table A3 reportssimilar data on the US as a benchmark. Also there, the 75% smallest banks account for asmall market share in terms of total assets, loans and deposits, whereas the top 5% accountfor the lion�s share in each respect.
The comparison with respect to the absolute threshold in table A4 shows that, althoughthere are many more banks with assets larger than 10 billion euros in Germany thanelsewhere, there are many fewer large banks in relation to the overall banking population:2% of the German banks are large in an absolute sense compared to 7% of the Frenchbanks. The relatively atomistic structure of the German banking sector can also be seenwhen comparing the loan market share of small banks across the four economies. It standsat 19% for Germany, as opposed to 3% in France.11
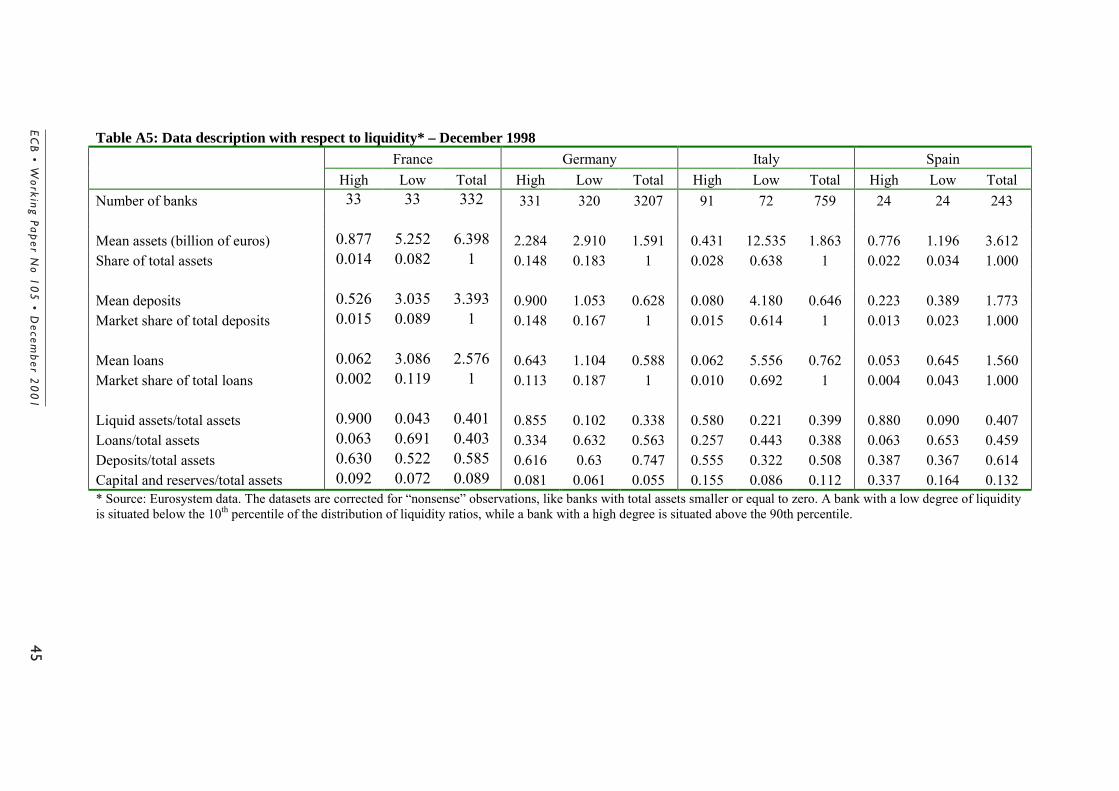
The structure of these small banks varies considerably across countries. Whereas French,Italian and Spanish small banks are on average very liquid, there does not seem to be adifference in this respect in Germany. Similarly with capitalisation, where small banks areon average better capitalised in France, Italy and Spain, whereas there is only a smalldifference in Germany.
On the euro area scale, German banks are the least capitalised. The low degree ofcapitalisation in Germany is usually explained by the low riskiness of the asset structure ofGerman banks in an international comparison: on average, German banks hold morepublic bonds and other less risky assets, like e.g. interbank assets. It is interesting to notethat in Italy, the small banks hold a much larger market share in the deposit market than inthe loan market, which turns out to be less extreme in the other countries. 11 These discrepancies might also partly reflect differences in the way cooperative bank networks areconsidered in each country. In France, these networks have been, except for one of them, considered as aunique entity, rather than a multitude of banks. Nevertheless, those networks are globally less important inFrance than in Germany.
ECB • Work ing Pape r No 105 • December 200112
Table 2: Banking structure of the euro area countries pre EMU, 1997AT BE FI FR DE GR IE IT LU NL PT ES
Availability of non-bank financeDomestic debt securities issued by corporates As a % of GDP As a % of bank loans to corporate sector
1.93.0
6.515.7
4.67.2
5.113.8
0.41.0
..
..4.8..
0.51.1
..
..3.86.7
8.822.4
2.87.4
Stock market capitalisation (% of GDP) 18.5 58.2 63.5 49.5 39.9 29.6 59.1 30.6 186.2 132.1 40.9 56.2% of net incurred liabilities of non-fin. corp.corresponding to securities issu. (avge. 95-99) 42.2 54.9 59.6 53.9 20.9 .. .. 25.2 .. 27.1 .. 17.8Market ConcentrationMarket share of large banks (total assets ≥ 6billion euros) 60.5 91.0 66.0 .. 71.7 68.7 49.9 75.0 61.7 .. 83.9 73.0Population share of large banks (total assets≥ 6 billion euros) 3.0 16.4 0.9 .. 3.1 12.5 10.4 6.0 12.1 .. 16.4 6.6No of institutions per mio inhabitants 123 13 68 22 42 5 19 16 498 11 4 8Herfindahl index*1000 75 106 337 45 19 110 126 29 29 192 94 40Market share of five largest banks 45.3 57.0 78.8 32.6 31.5 57.3 35.9 30.1 22.4 24.7 48.6 38.0
Bank PerformanceROE: profit after tax/capital and reserves(avge. 91-97, %) 7.0 7.9 -15.1 2.9 5.8 16.51 14.22 2.8 11.81 11.1 6.61 6.9Provisions/gross income (avge.91-97,%) 18.3 13.9 -0.6 22.2 15.4 10.71 3.72 19.1 16.71 7.9 17.11 17.3Operating expens./gross inc.(avge.91-97,%) 66.5 67.9 123.5 68.1 63.5 61.51 58.42 66.5 42.81 67.5 60.21 60.7No of employees per mio inhabitants 8798 7550 4998 6779 8749 5505 12022 6029 47176 7718 6086 6159State influence% of assets of top 10 banks owned orcontrolled by the government, 1995 50.4 27.6 30.7 17.3 36.4 70.0 4.5 36.0 5.1 9.2 25.7 2.0Sources: National financial accounts (net incurred liabilities). International federation of stock exchanges (stock market capitalisation). Corvoisier and Gropp (2001; Herfindahl index and topfive market share). OECD (profit, operating expenses, provisions). LaPorta et al. (2000; State influence). Eurosystem data otherwise1 Commercial banks only.2 Average 1995-97.
EC
B • W
ork
ing P
ap
er No
10
5 • D
ecemb
er 20
01
13
Table 3: The structure of national financial systems
AT BE FI FR DE GR IE IT LU NL PT ES
Importance of banks forfirms� financing1
Veryimportant
Important Important Important Veryimportant
Veryimportant
Important Veryimportant
Important Important Important Veryimportant
Fraction of short-termloans2
Average Average Low Low Low High Low High N.A. Low Low High
Fraction of loans atvariable interest rates3
Low High High Average Low High High High N.A. Low High High
Relationship lending Veryimportant(housebanks)
Not veryimportant(manySMEs,family-owned, lessproned totraditionalrelationshiplending)
Important,but declining
Notimportantexcept forsmall firms
Veryimportant(housebanks)
Notimportantany more
Veryimportant forcommerciallending
Veryimportant
N.A. Important Notimportant(firms ofteninitiallyborrow froma singlebank, butthen switchto borrowingfrom severalbanks7)
Notimportant
Market concentration4 Medium High High Medium Low High High Low Low High High Medium
State influence5 Strong(publicguaranteesfor mostsavingsbanks)
Medium Strong(blanketpublicguarantee inthe aftermathof thebankingcrisis)
Medium Strong(publicguarantees inthe savingsbanks�sector)
Strong Weak Weak Weak Medium Weak (nopublicguarantees ofsavingsbanks)
1 See table 2. Countries ranked �very important� are those that comply with all of the following four conditions: debt securities to GDP <4%, debt securities to bank loans <10%, stock marketcapitalisation to GDP <60% and funds raised through securities issuance <50%. Countries that fail to comply with at least one of those conditions are ranked �important�. No country wasranked as �less important�, which would apply for example for the US with debt to GDP at 26%, debt to bank loans higher than 100% and stock market capitalisation at 193% of GDP (seetable 1).
2 Source: Borio, 1996. �low�: fraction of short term loans <20%; �high�: >35%3 Source: Borio, 1996. �low�: fraction of loans at variable interest rates <40%; �high�: >50%. Source in case of Germany: Bundesbank internal paper, based on survey data for 1997.4 See table A1. Concentration is ranked low when Herfindahl index and the market share of the five largest banks are in the range of 30 or below. It is ranked high when the Herfindahl index
stands at around 100, and the market share of the five largest banks does not give conflicting evidence. It is ranked medium for intermediate cases.5 Countries are ranked according to the percentage of the assets of the top 10 banks controlled by the government (see table 2): �strong� (>30%), �medium� (between 10% and 30%) and
�weak� (<10%). This is checked to be consistent with other available information on public guarantees or ownership. The evaluation refers roughly to the first half of the 1990s. Stateinfluence declined steadily during the sample period in almost all countries. Therefore, the present ranking is based on a rough average for the sample period considered in the estimates anddoes not necessarily reflect the ranking at the end of the sample period.
6 Source: Eurosystem. �Average� for values around 20,000 euros.7 See Farinha and Santos, 2000.
EC
B • W
ork
ing P
ap
er No
10
5 • D
ecemb
er 20
01
15
State influence and ownership structureAlthough steadily declining over time, the role of the government in banking markets is animportant issue in Europe.12 State influence has been much more common than in the US,as is documented in LaPorta et al. (2000). State influence is exerted either through directpublic ownership of banks, through state control, or through public guarantees. Publicownership of banks was, during the sample period studied, most widespread in Austria,but significant also in most other countries of the euro area. In Finland, the governmentissued a guarantee for all bank deposits following the banking crisis of the early 1990s,and maintained this until 1998. In Greece, the market share of the state-controlled banks iscurrently around 50%, down from 70% in 1995. In other countries, the influence of thestate is rather limited, like for example in Spain, where state-owned banks represented13% of total loans and 3% of total deposits at the start of the sample period (1988), buthave been completely privatised by the end of the sample. Savings banks in Spain are notpublicly guaranteed, despite the involvement of some local governments in their control.
Deposit insuranceThe degree of effective deposit insurance differs considerably across European countriesduring the sample period studied. Deposit insurance in Spain covered all deposits of non-financial entities up to a relatively modest amount (9000 euros per depositor in 1990 and15000 euros in 1998). In Germany, on the other hand, the statutory deposit insurancesystem, a private safety fund as well as cross-guarantee arrangements in the savingsbanks� and in the cooperative banks� sectors, respectively, effectively amount to a fullinsurance of all non-bank deposits. France appears to be in an intermediate position with acomplete insurance for deposits up to 76000 euros per depositor.
Bank failuresIn most countries of the euro area, bank failures have been occurring much less frequentlythan in the US.13 Around 1500 bank failures are reported for the US for the period 1980-1994. Even between 1994 and 2000, i.e. in an economic boom, there were 7 bank failuresper year on average.14 This is a considerably higher fraction of the banking populationthan for example in Germany, where only around 50 private banks have failed since 1966.
12 For example, in Italy the share of total asset held by banks and groups controlled by the State passed from68 per cent in 1992 to 12 per cent in 2000.13 A direct comparison of these numbers is complicated by the fact that the definition of bank failures might bedifferent across countries. Especially numbers on prevented bank failures are difficult to obtain for the euroarea countries. Some cases are listed in Gropp et al. (2001).14 See Federal Deposit Insurance Corporation (1998) for 1980-1994, and www.fdic.gov.
ECB • Work ing Pape r No 105 • December 200116
Also in Italy many fewer bank failures occurred.15 In Spain, two banking crises occurredduring the last 25 years. The first one (1978-1985) was more widespread, affecting 58banks (accounting for 27% of deposits), while the second one (1991-1993) affected veryfew banks but involved one of the biggest institutions. In both cases, due to the potentialsystemic implications, most of the banks were either acquired by other solvent institutions,or the government intervened, so that depositors� losses were very limited. Besides thesetwo periods, there was only one failure of a very small bank in Spain. A banking crisiswas also experienced in Finland during the early 1990s. However, because of stronggovernment intervention, only one bank failure materialised.
Bank networksIn several countries of the euro area, banks have set up networks of various kinds.Especially the savings banks and credit cooperatives are frequently organised in networks,although with a varying degree of collaboration in the different countries. To give anexample, in Germany most banks (and especially the vast majority of small banks) belongto either the cooperative sector (in the 1990s about 70% of all banks) or the savings banks�sector (almost 20%). Both sectors consist of an �upper tier� of large banks serving as headinstitutions. The �lower tier� banks generally entertain very close relationships to the headinstitutions of their respective sector, leading to an internal liquidity management: onaverage, the �lower tier� banks deposit short-term funds with the �upper tier� banks, andreceive long-term loans in turn.16
Similar structures can be found in many countries of the euro area. In Austria, 750 of 799banks in 1996 belonged to the savings banks or credit cooperative network, which havestructures comparable to those described for Germany. In Finland, cooperative banks areorganised in the OKO Bank group, which has a centralised liquidity management. InSpain, on the other hand, savings and cooperative banks� networks exist, but their centralinstitutions play only a relatively minor role.
2.2 Some conjectures on the role of banks in monetary policy transmission
The structure of the banking markets in the individual countries is likely to determine theresponse of bank lending to monetary policy. Several features of European bankingmarkets are significantly different from those found in the US. It is therefore most likelythat the distributional effects across banks that have been documented for the US will notbe identical to those we can expect for the countries of the euro area. Additionally, there 15 In the period 1980-1997, 40 (in almost all cases very small mutual) banks were placed in administrativeliquidation. The share of deposits of failed banks was always negligible and reached around 1% only threetimes, namely in 1982, 1987 and 1996 (see Boccuzzi, 1998).16 See Upper and Worms (2001) and Deutsche Bundesbank (2001, p. 57).
ECB • Work ing Pape r No 105 • December 2001 17
are significant differences across European countries, such that we would not necessarilyexpect results to be identical for the various countries.
One important issue is the relevance of informational frictions in the banking markets. Ifdepositors and players in the interbank markets are confronted with strong informationalasymmetries, then distributional effects are likely to occur between banks that areinformationally opaque to different degrees. This would suggest the use of the sizecriterion as is standard in the literature. However, several features mentioned above arecapable of reducing the importance of informational frictions in Europe significantly. Afirst indication that in general, informational asymmetries may be less important is therelatively low risk involved in lending to banks, given the few numbers of bank failuresexperienced in many countries.
The role of governments in the banking markets similarly reduces the risk of depositors:An active role of the state in the banking sector is obviously able to reduce the amount ofinformational asymmetries significantly. Publicly owned or guaranteed banks aretherefore unlikely to suffer a disproportionate drain of funds after a monetary tightening,and distributional effects in their loan reactions are hence unlikely to occur.
Under a government guarantee, it is also possible that weaker banks engage in a �gamblefor resurrection� by extending their loan portfolio despite potential increases in itsriskiness. Evidence for this is provided in Virhiälä (1997, p.166), who detects such apattern among cooperative banks in Finland during the early 1990s. He finds, that thelower the degree of capitalisation of a bank, the more expansive was its loan supply.
The extensive degree of effective deposit insurance in countries like Germany and Italymakes it furthermore difficult to believe that deposits at small banks are riskier thandeposits held at large banks.
The network arrangement between banks can also have important consequences for thereaction of bank loan supply to monetary policy. In networks with strong links betweenthe head institutions and the lower tier, the large banks in the upper tier can serve asliquidity providers in times of a monetary tightening, such that the system wouldexperience a net flow of funds from the head institutions to the small member banks.Ehrmann and Worms (2001) show that in Germany, indeed, small banks receive a netinflow of funds from their head institutions following a monetary contraction. Thisindicates that the size of a bank need not be a good proxy to assess distributional effects ofmonetary policy across banks.
Additionally, banking networks consist frequently of mutual assistance agreements, as isthe case for example for the Austrian and German credit cooperative sectors. These help
ECB • Work ing Pape r No 105 • December 200118
to diminish informational asymmetries for a single bank, since it is the sector as a wholerather than the single bank that determines the riskiness of a financial engagement with amember bank.
Under the assumption that relationship lending implies that banks shelter their customersfrom the effects of monetary policy to some degree, we would expect that those banksshow a muted reaction in their lending behaviour. Since it is often small banks whichmaintain these tight lending relationships, it might very well be that smaller banks reactless strongly to monetary policy than large banks (which would be the opposite to thefindings for the US). At least, size does not always need to be a good indicator fordistributional effects across banks. Of course, the small banks need to have the necessarysources of funds at hand to maintain their loan portfolio even in times of monetarytightenings. This can be either achieved through a higher degree of liquidity of thosebanks like, e.g., in Italy or in France, through the liquidity provisions within the banknetworks as, e.g., in Germany, and/or thanks to a better capitalisation as in France, Italyand Spain.
Overall, we would therefore expect the consequences of informational frictions to bemuch less important in most countries of the euro area than they are in the US. Thereaction of a bank�s lending might thus depend much more on the importance it attributesto maintaining a lending relationship than on the necessity to fund a certain loan portfolio.In most European countries, the role of size as a bank characteristic that explainsdifferential loan supply reactions to monetary policy could be either irrelevant or possiblyeven reversed with respect to the usual assumptions of the literature. However, there maystill be distributional effects, which might depend more on other factors. For example, insome European countries, some groups of small banks have traditionally acted ascollectors of retail deposits to the whole banking system. Consequently, those banks tendto be more liquid on average. It may be the case that these banks react differently tomonetary policy changes.
In order to understand how strong distributional effects across banks are in the variouscountries, and which bank characteristics should be relevant, it is therefore necessary toconsider the institutional peculiarities of each country.17 Table 3 looks at the variouscharacteristics discussed above and provides a rough ranking of the euro area countries.Relationship lending, for example, emerges as an important feature in Austria, Germany 17 Several papers have already ranked countries with respect to the effectiveness of a bank lending channel(Kashyap and Stein (1997), Cecchetti (1999), DNB (2000)). They rely on indicators from three maincategories: the importance of small banks, bank health, and the availability of alternative finance. Despitedifferences with respect to some countries, the rankings reach relatively similar conclusions. For the fourlargest economies, both Kashyap and Stein (1997) and Cecchetti (1999) rank Italy as the strongest, France andGermany in the mid range, and Spain as the country with the least exposure to a bank lending channel.
ECB • Work ing Pape r No 105 • December 2001 19
and Italy. We would expect that some banks in these countries shelter their customersfrom monetary policy tightenings, with an accordingly muted response of their lending.Bank characteristics like size that proxy informational asymmetries should not beparticularly revealing in most of the euro area countries. In particular, in countries likeAustria or Germany, where bank networks are important and many banks are publiclyowned or guaranteed, or in Finland, where for some time there has been a governmentguarantee and most banks are organised within a banking group, we would not believethat a smaller bank is subject to stronger informational asymmetries and as such forced toreduce its lending more strongly after a monetary tightening.
3. The model
We base our analysis of bank lending on a very simple version of the model by Bernankeand Blinder (1988). We restrict the model of the deposit market to an equilibriumrelationship, assuming that deposits ( D ) equal money ( M ) and that both depend on thepolicy interest rate i as follows:
χψ +−== iDM (1)
The demand for loans ( diL ) which a bank faces is assumed to depend on real GDP ( y ),
the price level ( p ) and the interest rate on loans ( li ):
ld
i ipyL 321 φφφ −+= (2)
The supply of loans of a bank ( siL ) depends on the amount of money (or deposits)
available, the interest rate on loans and the monetary policy rate directly. This direct effectof the monetary policy rate arises in the presence of opportunity costs for the bank, whenbanks use the interbank market to finance their loans or in the case of mark-up pricing bybanks, which pass on increases in deposit rates to lending rates.18 The supply of loans istherefore modelled as:
iiDL liis
i 54 φφµ −+= (3)
18 For the reaction of interest rates to monetary policy at the aggregate level, Mojon (2000) provides evidencefor several countries of the euro area. For some evidence at the bank level for France, see Baumel and Sevestre(2000).
ECB • Work ing Pape r No 105 • December 200120
We furthermore assume that not all banks are equally dependent on deposits. We modelthe impact of deposit changes to be lower, the higher the bank characteristics size,liquidity or capitalisation ( ix ):
ii x10 µµµ −= (4)
The clearing of the loan market, together with equations (1) and (4), leads to the reducedform of the model:
43
3130313054241 )(φφ
χφµχφµψφµφψµφφφφφ+
−+++−+= iii
xixipyL (5)
which can be simplified to
constdxixcicbpayL iii +++−+= 10 (6)
The coefficient 43
311 φφ
ψφµ+
=c relates the reaction of bank lending to monetary policy to the
bank characteristic. Under the assumptions of the above model, a significant parameter for
1c implies that monetary policy affects loan supply. This requires, in particular, that the
interest elasticity of loan demand which is faced by a bank is independent of its
characteristic ix , i.e. 3φ is the same across all banks.
This assumption of a homogeneous reaction of loan demand across banks is thereforecrucial for the identification of loan supply effects of monetary policy. It excludes caseswhere, for example, large or small bank customers are more interest rate sensitive. Giventhat bank loans are the main source of financing for firms in the euro area, and readilyavailable substitutes in times of monetary tightenings are very limited even for relativelylarge firms, we see this as a reasonable benchmark for most countries. Several of thecompanion papers can improve on this identification issue by including bank specific loandemand proxies that allow for differences in loan demand across banks. The results seemto be rather robust to these changes (see, e.g., Worms, 2001).
Moreover, in the empirical model, we allow for asymmetric responses of bank lending toGDP and prices by the inclusion of these variables interacted with the bank
ECB • Work ing Pape r No 105 • December 2001 21
characteristics.19 We also introduce some dynamics and estimate the model in firstdifferences.20 The regression model is therefore specified as in equation (7):
( ) ( )
( ) it
l
jjtitj
l
jjtitj
l
jjtitjit
l
jjtj
l
jjtj
l
jjtj
l
jjitjiit
flinxgGDPxgrxgxf
flineGDPdrcLbaL
ε++∆+∆++
+∆+∆+∆+=∆
���
����
=−−
=−−
=−−−
=−
=−
=−
=−
013
012
0111
0001
log
loglog)log( (7)
with Ni ,...,1= and iTt ,...,1= and where N denotes the number of banks and l thenumber of lags. itL are the loans of bank i in quarter t to private non-banks. tr∆
represents the first difference of a nominal short-term interest rate, )log( tGDP∆ thegrowth rate of real GDP, and tflin the inflation rate. The bank specific characteristics aregiven as itx . The model allows for fixed effects across banks, as indicated by the bankspecific intercept ia .The approach followed in model (7) is based on the assumption that we can capture therelevant time effect with the inclusion of the macroeconomic variables. We estimate asecond model with a complete set of time dummies, in order to ensure that this assumptionholds. This second model is therefore estimated as
( )
( ) itt
l
jjtitj
l
jjtitj
l
jjtitjit
l
jjitjiit
flinxgGDPxg
rxgxfLbaL
ελ +++∆+
∆++∆+=∆
��
��
=−−
=−−
=−−−
=−
013
012
0111
1
log
log)log((8)
where all variables are defined as before, and tλ describes the time dummies.
We see a comparison of the estimated coefficients on the interaction terms between thetwo models as a sort of specification test. To the extent that they are similar it gives ussome confidence that we can use model (7) to infer the direct effect of interest rates onlending for the average bank from the coefficients jc .
In both models, the distributional effects of monetary policy should be reflected in asignificant interaction term of the bank specific characteristic with the monetary policyindicator. The usual assumptions met in the literature are that a small, less liquid or lesscapitalised bank21 reacts more strongly to the monetary policy change than a bank with a
19 This is equivalent to allowing for different values of φ1 and φ2 among banks with different size, liquidityand capitalisation.20 The underlying idea is that banks react to a change in the interest rate by adjusting the new loans. Since theaverage maturity of loans in Europe is longer than one year, the level of loans approximates the stock of loansfor both quarterly and annual data, whereas the flow can be approximated by the first difference. In theestimates below, the exact specification may change from country to country, depending on the empiricalproperties of the data (see the Appendix for the exact specification in each case).21 For size, see e.g. Kashyap and Stein (1995), for liquidity, see, e.g. Kashyap and Stein (2000) and for capital,see, e.g., Peek and Rosengren (1995).
ECB • Work ing Pape r No 105 • December 200122
high value of the respective bank characteristic. This would imply positive coefficients onthe interaction terms.
As a monetary policy indicator, we use the change in the short term interest rate. The threemeasures for bank characteristics size (S), liquidity (Liq) and capitalisation (Cap) aredefined as follows:
�−=i it
titit A
NAS log1log
� � ���
����
�−=
t iit
it
tit
itit A
LNTA
LLiq 11
� � ���
����
�−=
t iit
it
tit
itit A
CNTA
CCap 11
Size is measured by the log of total assets, Ait. Liquidity is defined as the ratio of liquidassets Lit (cash, interbank lending and securities) to total assets, and capitalisation is givenby the ratio of capital and reserves, Cit, to total assets.
All three criteria are normalised with respect to their average across all the banks in therespective sample in order to get indicators that sum to zero over all observations. For theregression model (7), the average of the interaction term jtit rx −− ∆1 is therefore zero, too,and the parameters jc are directly interpretable as the overall monetary policy effects onloans. In case of size, we normalise not just with respect to the mean over the wholesample period, but also with respect to each single period. This removes unwanted trendsin size (reflecting that size is measured in nominal terms).
Due to the inclusion of lags of the dependent variable, we use the GMM estimatorsuggested by Arellano and Bond (1991). This ensures efficiency and consistency of ourestimates, provided that instruments are adequately chosen to take into account the serialcorrelation properties of the model (the validity of these instruments is tested for with thestandard Sargan test). To ensure econometrically sound estimates for each country, theharmonised model needs to be amended slightly country by country, e.g. by choosing theappropriate treatment of seasonality, lag structure and an adequate set of instrumentalvariables. The actual regression models for each country are therefore slight modificationsof equations (7) and (8).
We will estimate models (7) and (8) using two different datasets. The first is BankScope, apublicly available database provided by the rating agency Fitch Ibca that covers balancesheet data on banks in all the euro area countries, although not the full population in each.This data is available on an annual basis only. It has been used in all published papers for
ECB • Work ing Pape r No 105 • December 2001 23
the euro area that are based on microdata on banks so far. The second dataset consists ofbank balance sheet data collected by the national central banks of the euro area. Thesedata are likely to be of a better quality, because they are available at least on a quarterlybasis and cover the full population of banks in a country. To provide a comprehensivepicture and to enable an assessment of the adequacy of BankScope for this type ofexercise, we will make parallel use of both types of datasets.
4. Evidence from BankScope data
The existing literature on the role of banks in monetary policy transmission in Europe hasso far been using the publicly available database BankScope. In order to achievecomparability with those studies, we will provide estimates on the basis of BankScope inthis section. In the subsequent section we will then move on to the more comprehensivedatasets available in the Eurosystem. This will give an indication as to how representativethe BankScope results are.
The existing studies using BankScope show rather inconclusive results.22 For instance,both de Bondt (1999) and King (2000) report that size and liquidity are important bankcharacteristics. However, they find such effects in different countries. Whereas Kingidentifies them in France and Italy, de Bondt finds them to be particularly weak in thesetwo countries. Instead, he finds evidence for size and liquidity effects in the Netherlands,which King does not.
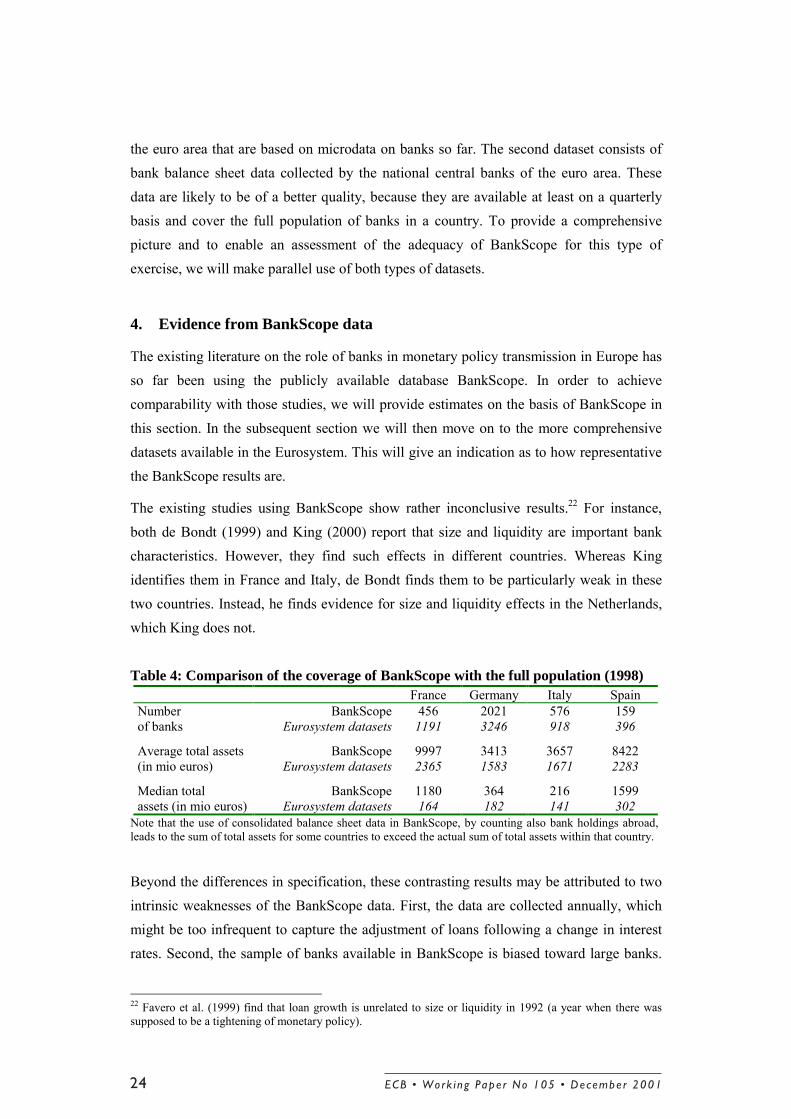
Table 4: Comparison of the coverage of BankScope with the full population (1998)France Germany Italy Spain
Note that the use of consolidated balance sheet data in BankScope, by counting also bank holdings abroad,leads to the sum of total assets for some countries to exceed the actual sum of total assets within that country.
Beyond the differences in specification, these contrasting results may be attributed to twointrinsic weaknesses of the BankScope data. First, the data are collected annually, whichmight be too infrequent to capture the adjustment of loans following a change in interestrates. Second, the sample of banks available in BankScope is biased toward large banks.
22 Favero et al. (1999) find that loan growth is unrelated to size or liquidity in 1992 (a year when there wassupposed to be a tightening of monetary policy).
ECB • Work ing Pape r No 105 • December 200124
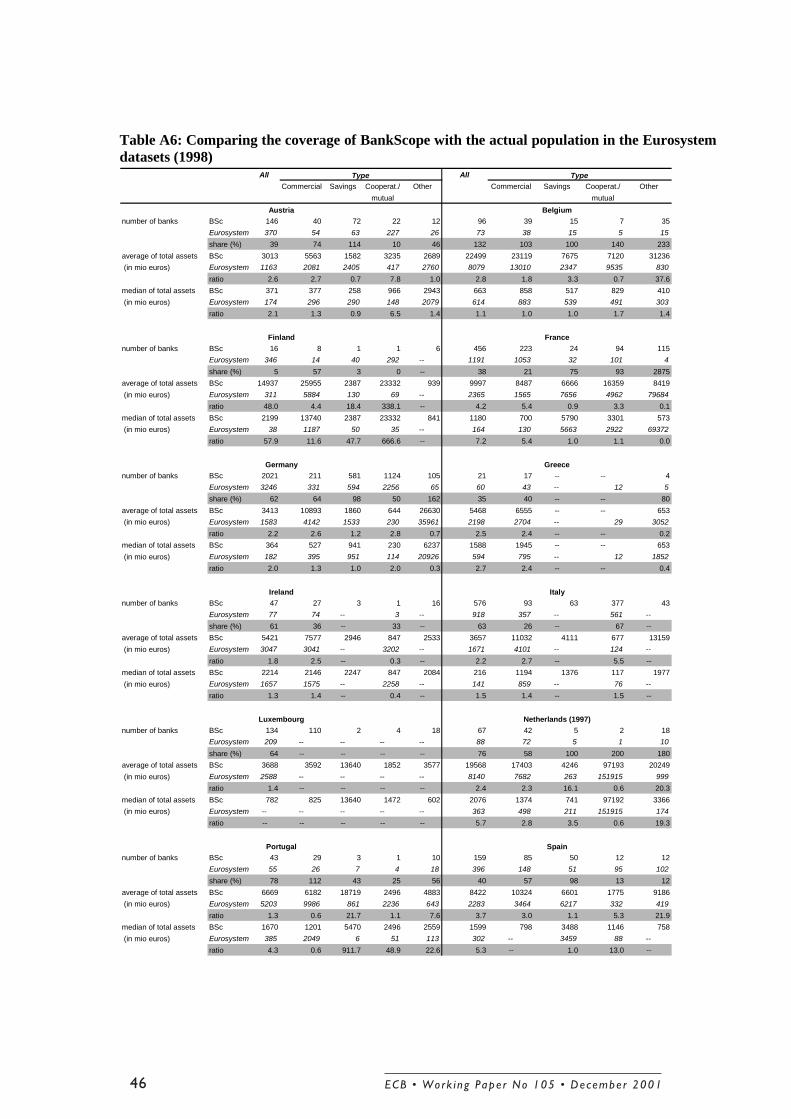
This is shown for the four largest countries of the euro area in Table 4.23 The coverage ofthe population of banks ranges from about 40% in France and in Spain to a little bit morethan 60% in Italy and in Germany. However, the median and average bank size is severaltimes larger in BankScope than in the actual population.
In terms of market share this poses less of a problem, since, as described in section 2.2,the larger banks make up a disproportionately larger fraction of the total loans. The biasesare, however, stronger for the beginning of the sample (1992-1999), since the coverage ofBankScope has improved markedly over the years.
BankScope data offer the choice between consolidated and unconsolidated balance sheets.For the purposes of this paper, we opted for consolidated balance sheets wheneveravailable, and unconsolidated balance sheets otherwise. In order to assess financialconstraints and informational asymmetries of a bank, it is important to know whether abank is in fact a subsidiary of another, potentially large and well known, bank. In such acase, using the subsidiary�s unconsolidated balance sheet would lead to a biasedmeasurement of the informational problems of the bank. However, this choice is notwithout drawbacks. As mentioned in table 4, consolidated balance sheets can potentiallyexaggerate the size of a bank, especially if a bank is internationally oriented, and has bankholdings abroad. This might create problems when looking at individual countries, wherethe mismeasurement due to international operations of domestic banks is larger than whenlooking at evidence on the euro area aggregate level.
4.1 Evidence on the aggregate euro area level
To assess the role of banks in monetary transmission at the euro area level, we firstestimate model (7) with the full BankScope dataset, i.e. including observations on banksin all euro area countries, without discriminating for national parameters. In order to proxyloan demand and the monetary policy changes for each bank as closely as possible, weregress loan growth of a bank in country z on country z�s GDP growth, inflation rate andthe interest rate change. The model is therefore formulated as in equation (7a).
23 Table A6 in the appendix extends the comparison to all countries of the euro area. Whereas for somecountries the coverage is extremely poor (most noticeably for Finland, where only 5% of all banks are coveredby BankScope, and where the average size of a bank in BankScope is roughly 50 times as big as the averagebank in the actual population. This comes about because BankScope treats OKO Bank as one bank only), it isfair for many other countries.
ECB • Work ing Pape r No 105 • December 2001 25
( ) ( )
( ) itj
jtitjj
jtitjj
jtitjit
jjtj
jjtj
jjtjitiit
flinxgGDPxgrxgxf
flineGDPdrcLbaL
ε∆∆
∆∆∆∆
+++++
++++=
���
���
=−−
=−−
=−−−
=−
=−
=−−
1
013
1
012
1
0111
1
0
1
0
1
011
log
loglog)log( (7a)
Table 5:Long-run coefficients estimated in model (7a), BankScope data for the euro area
Models estimated with the following bank characteristic variablesEuro area
*/**/*** denotes significance at the 10%/5%/1% level. Numbers in italics are p-values.
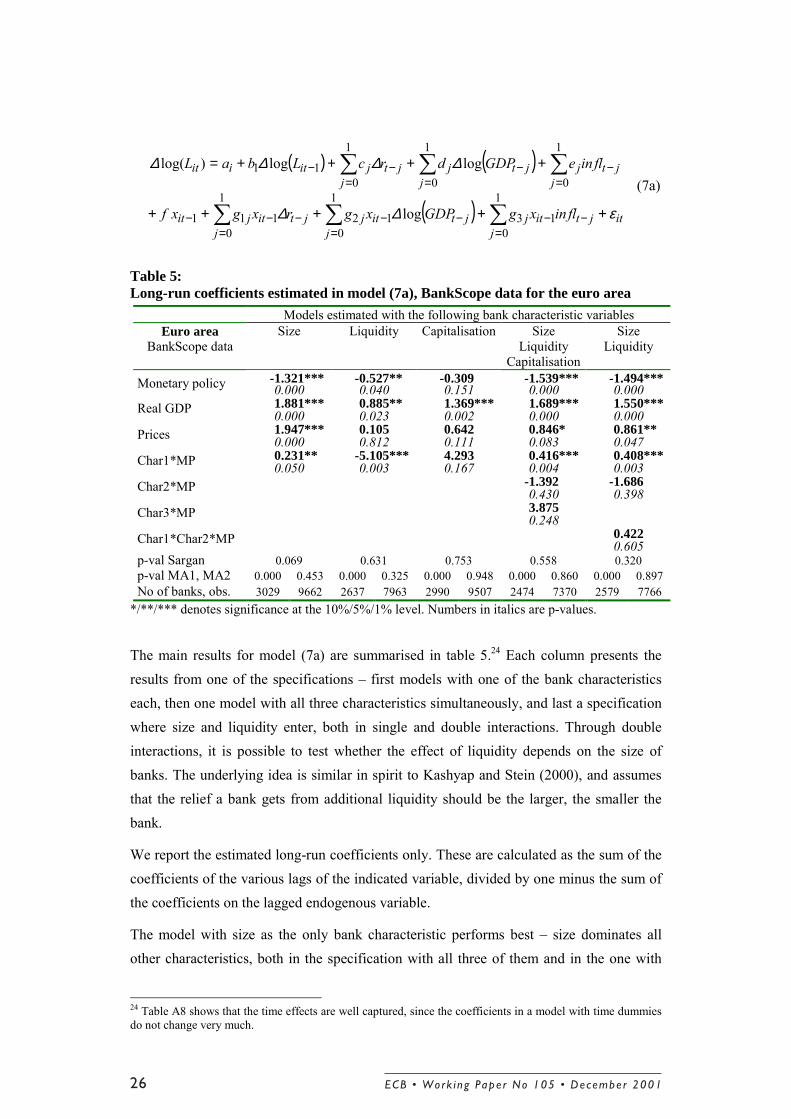
The main results for model (7a) are summarised in table 5.24 Each column presents theresults from one of the specifications � first models with one of the bank characteristicseach, then one model with all three characteristics simultaneously, and last a specificationwhere size and liquidity enter, both in single and double interactions. Through doubleinteractions, it is possible to test whether the effect of liquidity depends on the size ofbanks. The underlying idea is similar in spirit to Kashyap and Stein (2000), and assumesthat the relief a bank gets from additional liquidity should be the larger, the smaller thebank.
We report the estimated long-run coefficients only. These are calculated as the sum of thecoefficients of the various lags of the indicated variable, divided by one minus the sum ofthe coefficients on the lagged endogenous variable.
The model with size as the only bank characteristic performs best � size dominates allother characteristics, both in the specification with all three of them and in the one with
24 Table A8 shows that the time effects are well captured, since the coefficients in a model with time dummiesdo not change very much.
ECB • Work ing Pape r No 105 • December 200126
double interactions. The average bank reduces lending after a monetary tightening by1.3% following a 100 basis point increase in interest rates. Smaller banks, however,reduce their lending by more than large banks do.
Whereas capitalisation does not enter the models significantly, liquidity at first sightseems to be a good discriminatory device to trace the differential loan response of banks,too, given the highly significant interaction term (which has an unexpected negative sign).However, this model is not robust. Table A8 reveals that the liquidity specification is notstable when the macro variables are replaced by time dummies.25
4.2 Evidence on single countries in a pooled regression
The regression performed in the preceding section treated all banks in the same way byrestricting all coefficients to be the same across countries. In this section, the model isextended to exploit the information on cross-country differences. The parameters ofinterest, i.e. those on the bank characteristic, the first difference of the interest rate, and theinteraction of the two, are now allowed to vary across countries through the introductionof country specific dummies:
( ) ( )
( )
itj
jtzitccjitccjj
jtzccj
jjtzitj
jjtzitj
jjtzitjit
jjtzj
jjtzj
jjtzjitiit
rxcxcrc
flinxgGDPxgrxgxf
flineGDPdrcLbaL
ε∆ωω∆ω
∆∆
∆∆∆∆
++++
++++
++++=
��
���
���
=−−−
=−
=−−
=−−
=−−−
=−
=−
=−−
1
0,1312
1
0,1
1
0,13
1
0,12
1
0,111
1
0,
1
0,
1
0,11
log
loglog)log(
(7b)
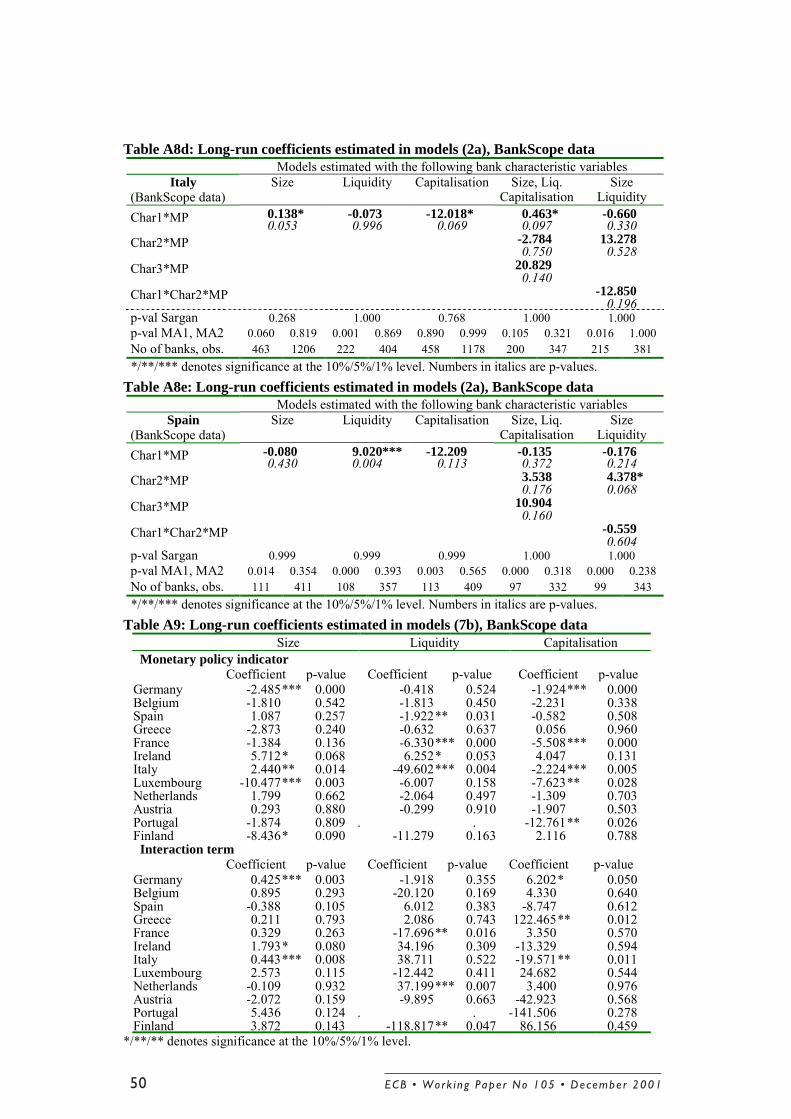
where the set of country dummies is denoted by cc . The model is again estimated withsize, capitalisation and liquidity as discriminatory bank characteristics, leaving aside morecomplicated models with two or three characteristics. Table A9 reports the estimatedcoefficients and standard errors on monetary policy and the interaction term for eachcountry.26
This model cannot replicate the results obtained at the aggregate euro area level. Thecoefficients on Germany in the specification with size suggest that the large number ofGerman banks (roughly 50% in the sample) dominates the results, although this is not the
25 This result might be driven by the fact that a liquidity measure is provided only for relatively few banks insome countries covered in BankScope. For example, only one third of observations are available in the Italiancase.26 The �national coefficients� are calculated as )( 1
10 cjjj c ω+Σ = and )( 21
10 cjjj g ω+Σ = . The robustness
tests for this model have been performed with either a set of time dummies, or alternatively a set of timedummies per country. The results are robust to these changes.
ECB • Work ing Pape r No 105 • December 2001 27
case for the other specifications. In any case, these results are very difficult to interpretwith respect to the role of banks in the individual countries.
There are two potential explanations for this result. On the one hand, it might be that thereis a considerable degree of heterogeneity in the data, which would imply that pooling thedata and restricting the coefficients to be identical across countries does not necessarilyconstitute a useful exercise. On the other hand, the aggregate model contains morevariability in the interest rates; with national interest rates, the model incorporates a muchricher variation in interest rates on which it can draw inference, namely across time ineach country, but also across countries for a given time. This additional variation canpotentially alleviate problems stemming from the short sample of the BankScope data.
4.3 Evidence on France, Germany, Italy and Spain in separate regressions
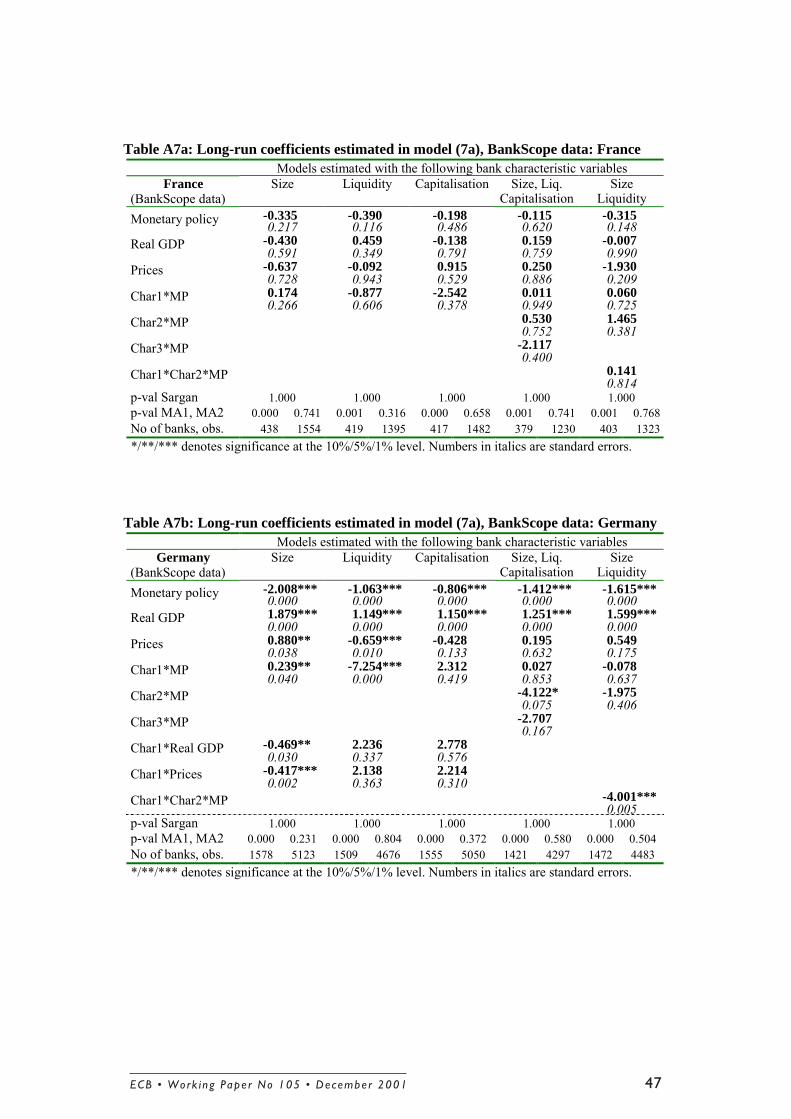
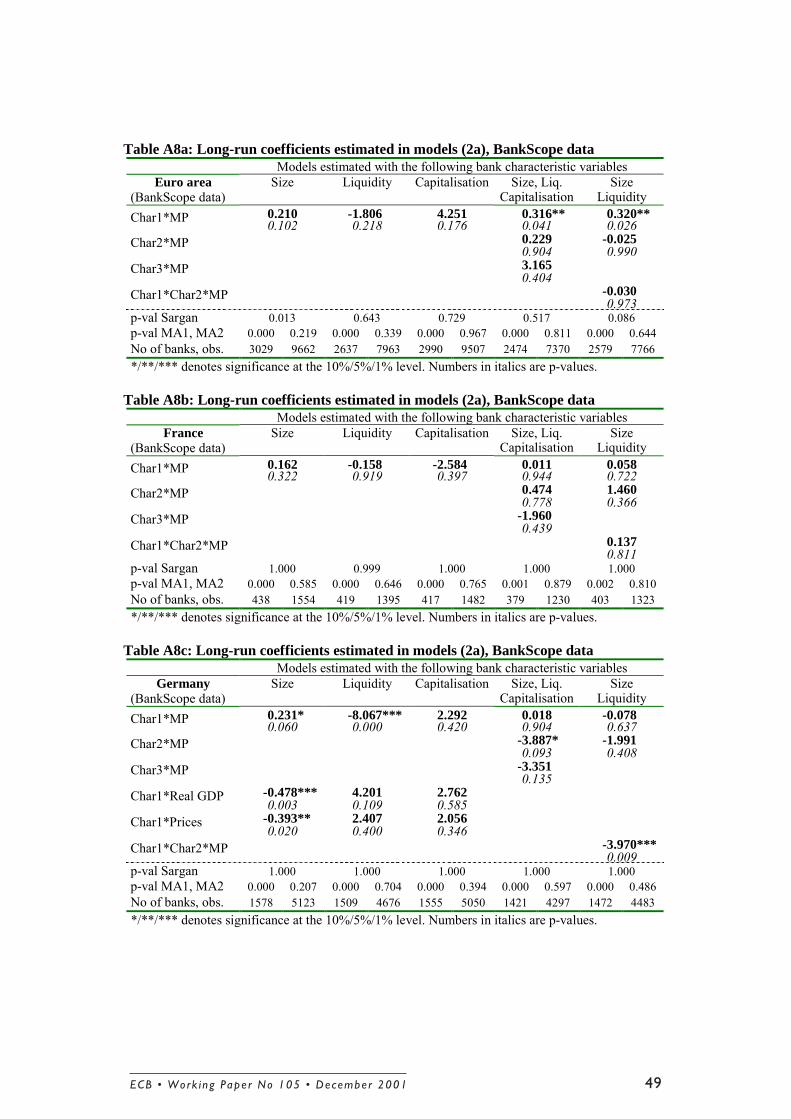
This section presents results from re-estimating model (7a) separately for each of the fourlargest countries of the euro area. These countries have the largest cross-sectionaldimension, so that it might be possible to improve on the results of the preceding sectionfor these countries. This also allows us to check for the consistency of the BankScoperesults with those reported in the subsequent section, obtained at the national level withthe more comprehensive datasets. Table A7 presents the results of these regressions, andtable A8 shows that the results of estimating model (8) are very similar.
For most of the estimated models, a tightening of monetary policy leads to the expecteddecrease of loans. However, with the exception of Germany, the results lack significanceand robustness. The most extreme case is France, where not a single coefficient turns outto be significant and several coefficients even change sign across the different models.Also in Spain and Italy, the coefficients on the macro variables depend on the exact modelspecification, and frequently change sign. For Spain, the specification with liquidity asbank specific characteristic results as the model with the most significantly estimatedeffects, suggesting that banks with a lower degree of liquidity react more strongly. ForGermany, the country with by far the best coverage in BankScope, the parameters aregenerally estimated to be significantly different from zero. The average bank reacts to amonetary tightening by decreasing loans. This coefficient is always estimated to benegative and significant at the 1% level, but its size varies considerably across thedifferent specifications.
The lack of robustness and the few specifications that achieve significant estimates castsome doubt on the adequacy of BankScope to capture the distributional effects ofmonetary policy across banks.
ECB • Work ing Pape r No 105 • December 200128
5. Evidence from Eurosystem datasets
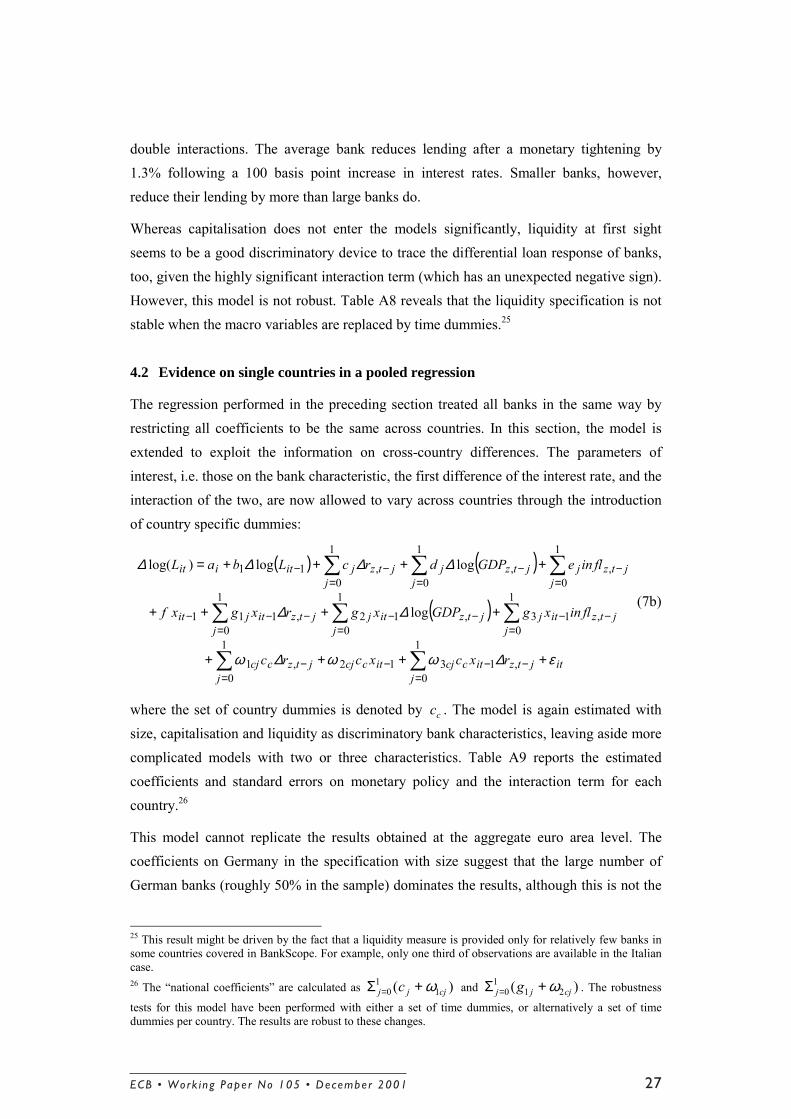
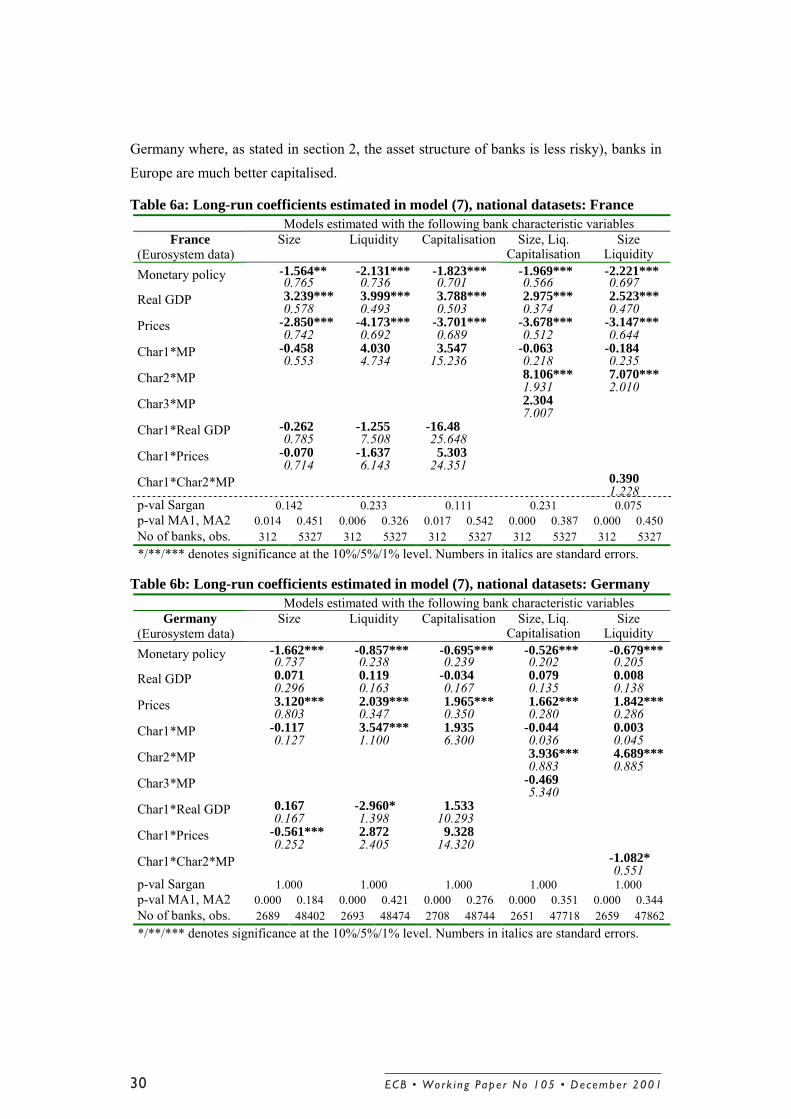
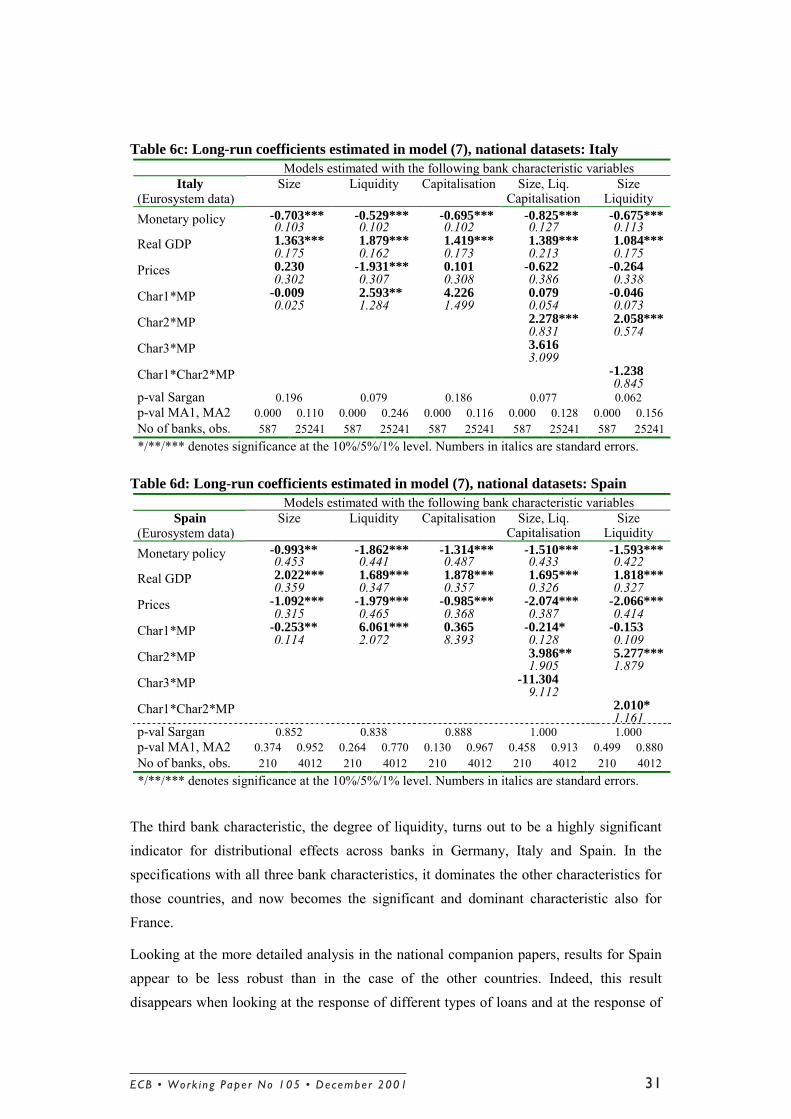
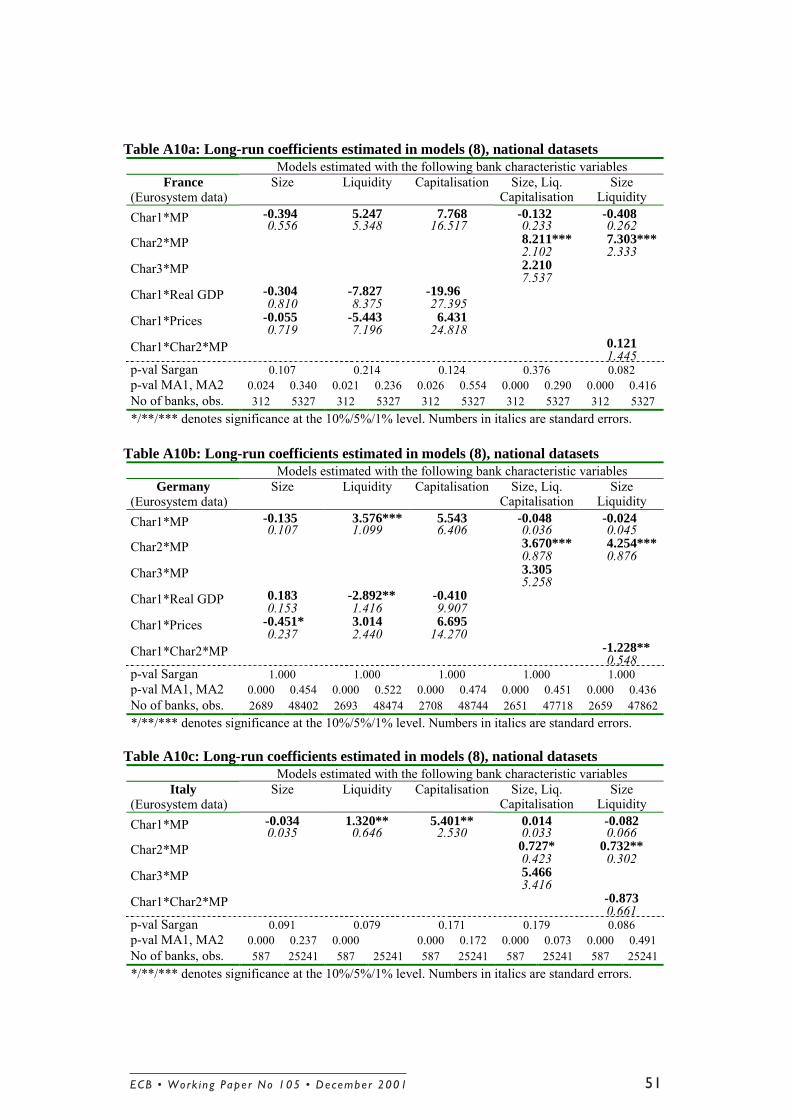
In this section, we employ the Eurosystem datasets for national models for each of thefour largest countries of the euro area, and report the analysis of similar models for theother euro area countries covered in the companion papers. The results of models (7) and(8) for France, Germany, Italy and Spain are presented in tables 6a-6d and A10.27
The long-run effects of monetary policy on loans of an average bank are estimated to benegative in all countries, indicating that restrictive monetary policy reduces loan supply inthe long run. As we had conjectured in section 2, size does not emerge as a usefulindicator for the distributional effects of monetary policy. In the specifications with sizeonly, we find it to be insignificant in France, Germany and Italy, and significantlynegative in Spain.28 Hence, the role of size as an indicator of informational asymmetriesappears irrelevant in all countries, which is consistent with the structure of the bankingmarket. Also capitalisation does not play an important role in distinguishing banks�reactions. Its interaction with the monetary policy indicator is insignificant in all countries,both when used as the only characteristic as well as in the complete specification with allthree criteria. This could be caused by several reasons. For example, the measure ofcapitalisation we use could be too crude to capture the riskiness of a bank, and is thus notindicative for the informational asymmetry problems. This could very well be the case,since our capitalisation variable is derived from balance sheets without considering thestructure of the loan portfolio or its risk characteristics. It might therefore not be capturinga risk-based measure like the Basel capital requirement.29
An alternative explanation could be that all banks are operating at levels of capitalisationsufficiently high to prevent market participants� doubts on the soundness of a bank. Insuch a case, capitalisation does not determine a bank�s reaction to monetary policy anylonger. Loupias et al. (2001) have estimated a model with a double interaction of size andcapitalisation with monetary policy. This is a way to check whether, after a monetarypolicy tightening, small and under-capitalised banks restrict their loan supply by morethan large banks do. The paper does not find any significant coefficient, thus confirmingthat capitalisation does not seem to affect banks loan supply in a significant way, at leastin France. Moreover, when comparing the level of capitalisation of European banks withthose in the US (see table A3), it can easily be seen that (with the notable exception of
27 A description of the sample periods, the outlier detection methods and the exact specifications can be foundin the appendix.28 For Italy, this is consistent with previous work analysing lending rates, e.g. Angeloni et al. (1995) andCottarelli et al. (1995).29 The BIS ratio measure cannot be obtained from the available datasets for the four largest countries.
ECB • Work ing Pape r No 105 • December 2001 29
Germany where, as stated in section 2, the asset structure of banks is less risky), banks inEurope are much better capitalised.
Table 6a: Long-run coefficients estimated in model (7), national datasets: FranceModels estimated with the following bank characteristic variables
p-val Sargan 0.852 0.838 0.888 1.000 1.000p-val MA1, MA2 0.374 0.952 0.264 0.770 0.130 0.967 0.458 0.913 0.499 0.880No of banks, obs. 210 4012 210 4012 210 4012 210 4012 210 4012*/**/*** denotes significance at the 10%/5%/1% level. Numbers in italics are standard errors.
The third bank characteristic, the degree of liquidity, turns out to be a highly significantindicator for distributional effects across banks in Germany, Italy and Spain. In thespecifications with all three bank characteristics, it dominates the other characteristics forthose countries, and now becomes the significant and dominant characteristic also forFrance.
Looking at the more detailed analysis in the national companion papers, results for Spainappear to be less robust than in the case of the other countries. Indeed, this resultdisappears when looking at the response of different types of loans and at the response of
ECB • Work ing Pape r No 105 • December 2001 31
loans to an exogenous shock to deposits (Hernando and Martínez-Pagés, 2001). Therefore,in the case of Spain, the distributional effects across banks with different degrees ofliquidity do not appear to be related to loan supply effects.
On the other hand, the results for the other countries are very robust. For Germany, it turnsout that the result is driven by the short-term interbank deposits that many small bankswith a network affiliation hold with their head institutions (Worms, 2001). For Italy, theanalysis is extended to the role of deposits and liquidity. It is shown that deposits dropsharpest for those banks that have fewer incentives to shield their deposits, like, e.g., smallbanks with a deposit to loan ratio larger than one. The analysis of liquidity supports theidea that banks use their liquidity to maintain their loan portfolio (Gambacorta, 2001b).For France too, this conclusion appears to be robust, both to different measures of theliquidity ratio and to the specific treatment of mutual and cooperative banks networks(Loupias et al., 2001).
The positive coefficient on the interaction of the monetary policy indicator with the degreeof liquidity in France, Germany and Italy means that less liquid banks show a strongerreduction in lending after a monetary tightening than relatively more liquid banks do. Theunderlying reasoning is that banks with more liquid balance sheets can use their liquidassets to maintain their loan portfolio and as such are affected less heavily by a monetarypolicy tightening. The robustness of these results can be checked through the last columnof table 6 that includes the double interaction between size and liquidity. The doubleinteraction has the expected negative sign in Germany and Italy, but is insignificant in thecase of Italy and only weakly significant for the case of Germany. Hence, there is nostrong evidence that the effect of liquidity is stronger for smaller banks; the conclusionthat size is not the dominant characteristic that distinguishes banks' responses to monetarypolicy does therefore obtain further support.
When comparing the BankScope regression results of section 4.3 with those based on thenational datasets, the results generally do not agree. (The exception is Spain whenliquidity is used as the bank characteristic.) The Eurosystem datasets, through their muchlarger variation both across banks and time, seem to be superior to the BankScope data, asevidenced by the improved explanatory power of the models and the better significanceand robustness of results. This casts doubt on the usefulness of the BankScope dataset forstudies of the micro effects across banks. Through the representation bias towards largebanks, important heterogeneity in bank behaviour is lost.
Several companion papers provide an analysis along similar lines for several othercountries of the euro area. De Haan (2001) finds for the Netherlands that interest rate
ECB • Work ing Pape r No 105 • December 200132
increases reduce unsecured bank lending, and provides evidence that size, degree ofliquidity and capitalisation all matter for a bank�s reaction in this market segment. Anothersplit according to bank types shows that wholesale banks react more strongly to monetarypolicy than retail banks. Looking at table 3, these findings can be explained by the factthat the role of government is weak in the Netherlands, such that banks cannot rely ongovernment guarantees to attract financing. There are also no important bank networks inthe Netherlands. Thus, the Netherlands appears to be a case where the usual informationalasymmetry problems might play a bigger role than in many other countries of the euroarea. Interestingly, the split according to retail and wholesale banks can be reconciled withthe fact that relationship lending is important in this country.
A paper on Portugal (Farinha and Marques, 2001) finds similarly that monetary policytightenings reduce bank lending. Here, the capitalisation of banks plays an important rolefor the way banks respond to interest rate changes, whereas the other tested criteria sizeand liquidity do not. They report furthermore, that the models are subject to a structuralbreak when Portuguese banks had the possibility to access funds from foreign EU banks.Interestingly, during this period the growth rate of loans increased relative to the growthof deposits, suggesting that this improved availability of funds matters for the growth rateof lending.
Brissimis et al. (2001) investigate the Greek case, and conclude that both the size and theliquidity of a bank determine distributional effects. Although there has been a stronginvolvement of the government, proxies for informational asymmetries seem to beimportant in Greece. This is consistent with the absence of bank networks, so that eachbank�s own creditworthiness is relevant. However, it has to be noted that, as is describedin more detail in the paper, the Bank of Greece managed to tightly control the bankingactivities by applying a reserve requirement of 12% (and of effectively 100% for depositsin foreign currencies).
Kaufmann (2001) looks at Austrian data, and detects distributional effects across banksonly for subperiods of the sample. When they are found, it is the degree of liquidity thatmatters rather than size. This is in line with our results for Germany, and consistent withthe similarity of the two banking systems as evidenced in table 3. Interestingly, monetarypolicy is effective only in times of economic slowdowns, as opposed to times of highgrowth.
Looking at the case of Finland, Topi and Vilmunen (2001) find that bank lendingcontracts after interest rate increases. Monetary policy does seem to affect all banks alike,however. Only liquidity is marginally significant in its interaction with monetary policy.
ECB • Work ing Pape r No 105 • December 2001 33
This is in line with our conjecture of section 2, that the state guarantees in the aftermath ofthe banking crisis, which were maintained in parts of the sample period they study, changethe lending behaviour of banks. Interestingly, the authors provide further evidence in thisdirection: a dummy variable for the state guarantees enters significantly in theirregressions, indicating that the bank support measures themselves might have contributedto the increase in the growth rate of loans.
6. Macroeoconomic relevance
Since the results presented in the preceding section are based on panel data regressions,the long-run coefficient on the monetary policy indicator represents the reaction of theaverage bank in the sample. Given the heterogeneity of reactions across banks (as shownthrough the significant interaction term with liquidity), the reaction of the average bankneed not be informative on the overall macroeconomic effect of monetary policy on bankloans. We had found that for three countries, less liquid banks react more strongly. If wewant to interpret this finding on a macroeconomic level, it is important to weight thebanks in the sample with their respective market share when calculating their response tomonetary policy. The resulting, overall response of the loan market can be quite differentfrom the response of the average banks, depending on the distribution of liquidity andmarket share across banks. Table A5 presents some evidence on this distribution in thesingle countries.
In table 7, we present how the equilibrium quantities in the loan market respond in eachcountry. This response is calculated by first weighting the liquidity ratio of each bank withits loan market share.30 Doing so yields the liquidity ratio of the loan market as a whole.Then, this ratio is used in the estimated models to explore overall loan market responses.
The weighted average coefficient implies that the magnitude of the lending reaction issimilar in France and Spain, and similar in Germany and Italy. France and Spain show amuch stronger overall response than Germany and Italy. This finding could for examplebe explained by the dominance of relationship lending in the two latter countries � thatsome banks shield their customers from a monetary policy tightening seems to bereflected in a lower overall responsiveness of loans.
Interestingly, the same exercise with BankScope arrives at not too dissimilar conclusions.Table A11 reports the respective coefficients, which show that the response issignificantly estimated for Spain and Germany. The response is somewhat stronger for 30 However, in the case of France, one should keep in mind that only banks with a significant level of depositshave been kept in the sample, leaving aside many branches of foreign banks, as well as specialised creditinstitutions which, on the whole, account for about ¼ of total loans.
ECB • Work ing Pape r No 105 • December 200134
Spain, and for Germany is actually very close to the one obtained with the full sample. ForGermany, therefore, the coverage of large banks is good enough to portray the relevantmarket reaction fairly well.31
Table 7: Percentage change of loans following a one percent change in interest ratesEurosystem data France Germany Italy Spain
*/**/*** denotes significance at the 10%/5%/1% level.
This observation leads us to believe that BankScope, although a poor instrument toinvestigate micro effects across banks, can actually give a fair description of the macroeffects. This is easily understandable as macro effects mainly derive from large banks�responses to monetary policy shocks. It is therefore enlightening to calculate the overallresponse of the euro area loan market from the BankScope regressions. Looking at theeuro area models, the preferred specification is the one with size as bank characteristic.Repeating the same kind of exercise, we find the market response to be 261.1−(significant at the 1% level).
The long-run effect of monetary policy on bank loans is in the range of a 1% decline aftera 100 basis point increase in interest rates in Germany, Italy and the euro area as awhole.32 However, there is considerable heterogeneity across countries, as shown in themuch stronger reaction of French and Spanish loans.
7. Conclusions
This paper has investigated the role of banks in monetary policy transmission in the euroarea. It has been shown that bank lending contracts significantly after a monetarytightening both on the euro area aggregate as well as on the country level.
Using micro data on banks, it is found that liquidity is important to characterise a bank�sreaction to a monetary policy action: less liquid banks react more strongly than moreliquid banks do, although not in all countries. On the other hand, factors like the size orthe degree of capitalisation of a bank are generally not important for the way a bankadjusts its lending to interest rate changes. This is opposed to findings for the US, where
31 Interestingly, the lower frequency of the BankScope data seems to be less problematic for analysing thedistributional effects than the coverage bias. When the Eurosystem dataset on German banks is used to analysethe distributional effects amongst large banks only, then size turns out to be a significant determinant, just likein the BankScope regressions reported in this paper (see Worms, 2001). This indicates that the differences infrequency between the two datasets are less of a problem.32 These estimates are in the same range as those found at the macro level in VAR analyses, e.g., by Peersmanand Smets (2001).
ECB • Work ing Pape r No 105 • December 2001 35
small and lowly capitalised banks show a disproportionately strong response to monetarypolicy. We explain the absence of size and capitalisation effects with a lower degree ofinformational asymmetries: the role of the government, banking networks, as well as thelow number of bank failures in the countries of the euro area contribute to a reduction ininformational frictions. Proxies for informational asymmetry are therefore less informativein the European case than they are in the US.
The way banks respond to monetary policy can be explained by the structure of bankingmarkets. This finding emerges when comparing the banking systems between Europe andthe US, and matching the empirical findings with differences in the banking structures, aswell as in the same comparison across euro area countries.
We have worked with two different types of datasets in this paper. The publicly availabledatabase BankScope, used in similar studies to date, suffers from a representation bias.Since small banks are not covered adequately, the microeconomic distributional effects areestimated on a biased sample of banks. This might explain the contradictory findings inthe previous literature as well as the few cases of coinciding evidence in this and earlierstudies. When estimating the macroeconomic importance of the bank loan response, thisbias is less important, however: since the coverage of large banks is relatively good, boththe estimates with BankScope and those with the complete population of banks arrive atquantitatively similar conclusions. This holds especially for Germany, which is coveredparticularly well in BankScope.
The Eurosystem datasets used in this paper have been able to produce a set of stable androbust results that improves markedly on the existing evidence on the role of banks inmonetary policy transmission in the euro area to date.
ECB • Work ing Pape r No 105 • December 200136
ReferencesAngelini, P., P. Di Salvo and G. Ferri (1998). Availability and Cost of Credit for Small
Businesses: Customer Relationships and Credit Cooperatives, Journal of Bankingand Finance 22(6-8), pp. 925-54
Angeloni, I., L. Buttiglione, G. Ferri and E. Gaiotti (1995), The Credit Channel ofMonetary Policy across Heterogeneous Banks: The Case of Italy, Banca d�Italia,Temi di discussione, No. 256
Arellano, M. and S. Bond (1991). Some Tests of Specification for Panel Data: MonteCarlo Evidence and an Application to Employment Equations. Review of EconomicStudies 58: 277-297
Ashcraft, A.B. (2001). New Evidence on the Lending Channel. Federal Reserve Bank ofNew York Staff Reports No. 136
Baumel, L. and P. Sevestre (2000). La relation entre le taux des crédits et le coût desressources bancaires. Modélisation et estimation sur données individuelles debanques, Annales d'Economie et de Statistique 59, pp. 199-226
Bernanke, B. and A. Blinder (1988). Credit, Money and Aggregate Demand. AmericanEconomic Review 78, pp. 435-439
Bernanke, B. and M. Gertler (1989). Agency Costs, Net Worth, and BusinessFluctuations. American Economic Review 79, pp. 14-31
Brissimis, S.N., Kamberoglou, N.C. and G.T. Simigiannis (2001). Is there a Bank LendingChannel of Monetary Policy in Greece? Evidence from Bank Level Data.forthcoming, ECB Working Paper
Boccuzzi, G. (1998). La crisi dell'impresa bancaria. Profili economici e giuridici, Giuffrè,Milano
Borio, E.V. (1996). Credit Characteristics and the Monetary Policy TransmissionMechanism in Fourteen Industrial Countries: Facts, Conjectures and SomeEconometric Evidence, in Alders K. et al. (eds.), Monetary Policy in aConverging Europe, Kluwer Academic Publishers
Cecchetti, S. (1999). Legal Structure, Financial Structure, and the Monetary PolicyTransmission Mechanism. NBER WP No. 7151
Ciccarelli, M. and A. Rebucci (2001). The Transmission Mechanism of EuropeanMonetary Policy: Is there Heterogeneity? Is it changing over time? Mimeo, Bank ofSpain and IMF
Clements, B., Kontolemis, Z.G. and J. Levy (2001). Monetary Policy under EMU:Differences in the Transmission Mechanism?�, IMF Working Paper No. 01/102
Corvoisier, S. and R. Gropp (2001). Bank Concentration and Retail Interest Rates, ECBWP No. 72
Cottarelli, C., G. Ferri and A. Generale (1995), Bank Lending Rates and FinancialStructure in Italy: A Case Study, IMF Working Papers, No. 38
De Haan, L. (2001). The Credit Channel in the Netherlands: Evidence from Bank BalanceSheets. forthcoming, ECB Working Paper
ECB • Work ing Pape r No 105 • December 2001 37
De Bondt, G.J. (1999). Banks and Monetary Transmission in Europe: Empirical Evidence.BNL Quarterly Review 209: 149-168
Deutsche Bundesbank (2001). Bank Balance Sheets, Bank Competition and MonetaryPolicy Transmission. Monthly Report September 2001, pp. 51-70
DNB (2000). The Importance of Financial Structure for Monetary Transmission inEurope. Quarterly Bulletin, pp. 33-40
Ehrmann, M. and A. Worms (2001). Interbank Lending and Monetary PolicyTransmission � Evidence for Germany, ECB WP No. 73
Elsas, R. and J.P Krahnen (1998). Is relationship-lending special? Evidence from creditfile data in Germany. Journal of Banking and Finance 22, pp. 1283-1316
Farinha, L.A. and J.A.C. Santos (2000). Switching from single to multiple bank lendingrelationships: determinants and implications. BIS Working Paper No. 83
Farinha, L.A. and C.R. Marques (2001). The Bank Lending Channel of Monetary Policy:Identification and Estimation Using Portuguese Micro Bank Data. forthcoming,ECB Working Paper
Favero, C.A., Giavazzi, F. and L. Flabbi (1999). The Transmission Mechanism ofMonetary Policy in Europe: Evidence from Banks� Balance Sheets. NBER WP7231
Federal Deposit Insurance Corporation (1998). Managing the Crisis: The FDIC and RTCExperience, 1980-1994. Washington, D.C.
Gambacorta, L. (2001a). Asymmetric Bank Lending Channels and ECB Monetary Policy.Economic Modelling, forthcoming
Gambacorta, L. (2001b). Bank Specific Characteristics and Monetary PolicyTransmission: the Case of Italy. forthcoming, ECB Working Paper
Gropp, R., Vesala, J. and G. Vulpes (2001). Equity and Bond Market Signals as LeadingIndicators of Bank Fragility. Mimeo, European Central Bank
Herando, I. and J. Martinez-Pages (2001). Is there a Bank Lending Channel of MonetaryPolicy in Spain? forthcoming, ECB Working Paper
Kashyap, A. and J. Stein (1995). The Impact of Monetary Policy on Bank Balance Sheets,Carnegie Rochester Conference Series on Public Policy, Vol. 42, pp. 151-195
Kashyap, A. and J. Stein (1997). The Role of Banks in Monetary Policy: A Survey WithImplications for the European Monetary Union, Federal Reserve Bank of ChicagoEconomic Perspectives, pp. 2-18
Kashyap, A. and J. Stein (2000). What do a Million Observations on Banks Say about theTransmission of Monetary Policy, American Economic Review 90, pp. 407-428
Kaufmann, S. (2001). Asymmetries in bank lending behaviour. Austria during the 90s.forthcoming, ECB Working Paper
King, S.K. (2000). A Credit Channel in Europe: Evidence from Bank�s Balance Sheets.Mimeo, University of California, Davis
Kishan, R.P. and T.P. Opiela (2000). Bank Size, Bank Capital, and the Bank LendingChannel, Journal of Money, Credit and Banking 32(1), pp. 121-141
ECB • Work ing Pape r No 105 • December 200138
La Porta, R., Lopez-de-Silanes, F. and A. Shleifer (2000). Government Ownership ofBanks. NBER Working Paper No. 7620
Loupias, C., Savignac, F. and P. Sevestre (2001). Monetary policy and bank lending inFrance. Are there asymmetries? forthcoming, ECB Working Paper
Mihov, I. (2001). Monetary Policy Implementation and Transmission in the EuropeanMonetary Union. Forthcoming, Economic Policy
Mishkin, F. S. (1995). Symposium on the Monetary Transmission Mechanism, Journal ofEconomic Perspectives 9 (4), pp. 3-10
Mojon, B. (2000). Financial Structure and the Interest Rate Channel of ECB MonetaryPolicy, ECB Working Paper No. 40
Oliner, S. D. and G. D. Rudebusch (1996). Is There a Broad Credit Channel for MonetaryPolicy?, Economic Review, Federal Reserve Bank S. Francisco, n. 1, pp. 3-13
Peek, J. and E.S. Rosengren (1995). Bank Lending and the Transmission of MonetaryPolicy; in: Peek, J. and E.S. Rosengren (eds.): Is Bank Lending Important for theTransmission of Monetary Policy? Federal Reserve Bank of Boston ConferenceSeries 39, pp. 47-68
Peersman, G. and F. Smets (2001). The Monetary Transmission Mechanism in the EuroArea: More Evidence from VAR Analysis. forthcoming, ECB Working Paper
Rajan R. and L. Zingales (1998), Which capitalism? Lessons from the East Asian crisis,mimeo, University of Chicago.
Sala, L. (2001). Monetary Transmission in the Euro Area: A Factor Model Approach.Mimeo, Universite libre de Bruxelles - ECARES
Stein, J.C. (1998). An Adverse-Selection Model of Bank Asset and LiabilityManangement with Implications for the Transmission of Monetary Policy. RANDJournal of Economics 29(3), pp.466-86
Topi, J. and J. Vilmunen (2001). Transmission of Monetary Policy Shocks in Finland;Evidence from Bank Level Data on Loans. forthcoming, ECB Working Paper
Upper, C. and A. Worms (2001). Estimating bilateral exposures in the German interbankmarket: Is there a danger of contagion?; in: BIS (ed.): Marrying the macro- andmicroprudential dimensions of financial stability, BIS papers No.1, pp. 211-229
Van den Heuvel, S.J. (2001). The Bank Capital Channel of Monetary Policy. Mimeo,Wharton School
Virhiälä, V. (1997). Banks and the Finnish Credit Cycle 1986-1995. Bank of FinlandStudies E7
Worms, A. (2001). The Reaction of Bank Lending to Monetary Policy Measures inGermany. forthcoming, ECB Working Paper
ECB • Work ing Pape r No 105 • December 2001 39
APPENDIX 1: Databases and estimation methods
A) The samples
1) Data sourcesEurosystem datasets for France, Italy and Spain: respective national banks supervisoryreports. Eurosystem dataset for Germany: Bundesbank banks� balance sheets statistics.BankScope: Fitch Ibca, a publicly accessible source. The Eurosystem datasets are on aquarterly basis while BankScope provides annual data. BankScope data are consolidatedbalance sheets when available, and unconsolidated balance sheets otherwise.
2) Merger treatmentFor all countries, mergers have been treated by a backward aggregation of the entitiesinvolved in the merger. Other kinds of treatments have shown to have little impact on theeconometric results. No merger treatment with the BankScope data.
3) Criteria defining banks and sample initial coverageCredit specialised financial institutions are excluded from the sample in France, Italy andSpain. For Spain, also branches of foreign banks are excluded from the sample. ForFrance, each mutual bank network (except for one of them) is considered as an aggregatebank. Banks with less than 10 % deposits (which are mostly foreign banks are discardedfrom the sample). Banks with less than 1 % loans are also discarded. Before the necessarytrimming of the samples, but after the merger treatment, the coverage is as follows:
Table A1: Initial sample coveragePeriod Number of banks
BankScope 1992 � 1999 4425France 1993:Q1 to 2000:Q3 496
Germany 1993:Q1 to 1998:Q4 3281Italy 1986:Q4to 1998:Q4 785Spain 1991:Q1 to 1998:Q4 264
4) Trimming of the sample/outlier elimination.For France, Italy and Spain, only banks with both non-null loans and deposits are kept inthe sample. For Germany and BankScope, this positivity condition only applies to loans.
Criteria defining outliers are as follows:1st difference in logs is, for each period,below (above)
1st difference in the ratio of liquidityand capitalisation over total assets is,for each period, below (above)
BankScope 4th (96th) percentile for loans, depositsand total assets
4th (96th) percentile
France 2nd (98th) percentile for loans, depositsand total assets
1st (99th) percentile
Germany 2nd (98th) percentile for loans and 1st
(99th) percentile for total assets1st (99th) percentile of the ratios level
Italy 1st (99th) percentile for loansSpain 2nd (98th) percentile for total assets and
3rd (99th) percentile for loans2nd (98th) percentile or 3rd (99th)percentile of the ratios level
ECB • Work ing Pape r No 105 • December 200140
NB: For Germany and Italy, banks with one outlier or more are fully discarded from thesample. Moreover, for Germany and BankScope, different samples have been built forsize, liquidity and capitalisation.
5) Number of consecutive lags required:Due to the model specification as well as the estimation methods requiring numerous lags,we required a minimal number of consecutive observations of the first difference of thelog of loans (and correspondingly for the other variables in the model): 2 lags forBankScope, 5 for France, 4 for Germany, 12 for Italy, and 9 for Spain.
The final composition of the samples used for econometric estimations is thus:
Table A2: Econometric samples coverageEstimation period Number of banks Number of observations
BankScope 1993 � 1999 Around 3000 Around 9700France 1994:Q3 to 2000:Q3 312 5327
Germany 1994:Q1 to 1998:Q4 Around 2700 Around 48000Italy 1988:Q1 to 1998:Q4 587 28763Spain 1991:Q1 to 1998:Q4 210 4012
B) Variable definitions
1) LoansFor all countries, loans are those to the non-financial private sector. For Italy and France,bad loans are excluded.
2) LiquidityThe liquidity ratio is computed by dividing liquid by total assets. The precise definition ofliquidity changes a bit from country to country, due to differences in the availableinformation: In France, it is constructed as cash and interbank deposits. In Germany, itincludes cash, short-term interbank deposits and government securities. In Italy, itcomprises cash, interbank deposits and securities and repurchase agreements at bookvalue. In Spain, liquid assets include cash, interbank lending and government securities.For BankScope, this variable is pre-defined in the database. For all countries, the ratioliquidity/total assets is centred with respect to its overall sample mean.
3) CapitalisationFor all countries, capitalisation is defined as the sum of capital and reserves divided bytotal assets. For BankScope, this variable is pre-defined in the database. Alsocapitalisation has been centred with respect to its overall sample mean.
4) SizeFor all countries and BankScope, size is defined as the log of total assets. This variable iscentred with respect to each period�s mean.
5) Monetary policy indicatorIn each country but Italy, the monetary policy indicator is the first difference of the 3months interest rate. In Italy, it is the first difference in the interest rate on repurchaseagreements between the central bank and credit institutions.
ECB • Work ing Pape r No 105 • December 2001 41
C) Model specification and estimation methods
For France, model (7) is directly estimated with four lags and contemporaneous macrovariables. Instruments are second and third lags of the 1st difference of log of loans,second lags of the characteristics included in the equation: size and/or liquidity and/orcapitalisation, and the monetary policy indicator which is assumed exogenous. All theseinstruments are multiplied by time dummies �à la Arellano-Bond�.
For Germany, all bank specific variables have been seasonally adjusted on a bankindividual basis, using a MA procedure. The first difference operator has been applied tomodel (7) before estimation. The model has 4 lags. Instruments are the macro variablesthemselves, lags t-2 to t-5 of the 1st difference of the log of loans, and lags 2 to 5 of allother (interaction) variables in the model. No contemporaneous variables enter themodels. Seasonal dummies and trend enter model (1).
For Italy, model (7) is directly estimated. Instruments are lags of the 1st difference of logof loans and of the characteristics included in the equation. Inflation, GDP growth and themonetary policy indicator are considered as exogenous variables. The model has 4 lags,and no contemporaneous variables.
For Spain, the model is estimated in 4th differences of the 1st differences. This eliminatesthe seasonal individual effects existing in the model in 1st differences. Estimation is donein a model with contemporaneous values and 4 lags, with the GMM method proposed byArellano and Bond, using as instruments lags 5 through 8 of the 1st difference of loans andbank characteristics. Macroeconomic variables are instrumented by themselves and theirinteractions with bank characteristics are instrumented by the same macro variableinteracted with the characteristic at time t-5.
For BankScope, model (7) is estimated with one lag of the endogenous variable, and eitherthe contemporaneous values or one lag (if contemporaneous values are not significant) forthe other explanatory variables. Estimation is performed in first differences. Instrumentsare the second and consecutive lags of the 1st difference of log of loans, the bankcharacteristics and the interaction terms.
ECB • Work ing Pape r No 105 • December 200142
Table A3: Data description with respect to relative size* – December 1998France Germany Italy Spain US
Small Large Total Small Large Total Small Large Total Small Large Total Small Large TotalNumber of banks 249 16 332 2405 160 3207 578 36 759 182 12 243 8404 561 11206
* Source: Eurosystem data, Kashyap and Stein (2000). The datasets are corrected for �nonsense� observations, like banks with total assets smaller or equal to zero. A �small�bank is situated below the third quartile of the distribution of total assets, while a �large� bank is situated above the 95th percentile. Data for the US refer to 1993 and areexpressed in billion US dollars. Liquid assets for the US are calculated as cash, securities and federal funds lent.
EC
B • W
ork
ing P
ap
er No
10
5 • D
ecemb
er 20
01
43
Table A4: Data description with respect to absolute size* – December 1998France Germany Italy Spain
Small Large Total Small Large Total Small Large Total Small Large TotalNumber of banks 182 24 332 2710 64 3207 629 32 759 150 17 243
Mean assets (billion of euros) 0.313 66.741 6.398 0.228 53.250 1.591 0.187 31.557 1.863 0.255 34.154 3.612Share of total assets 0.027 0.754 1 0.121 0.668 1 0.100 0.714 1 0.044 0.661 1
Mean deposits 0.182 33.000 3.393 0.169 14.361 0.628 0.089 10.444 0.646 0.164 15.095 1.773Market share of total deposits 0.029 0.703 1 0.227 0.456 1 0.168 0.682 1 0.057 0.595 1
Mean loans 0.124 26.788 2.576 0.130 15.735 0.588 0.076 13.351 0.762 0.128 13.945 1560Market share of total loans 0.026 0.752 1 0.186 0.534 1 0.112 0.739 1 0.051 0.625 1
Liquid assets/total assets 0.455 0.317 0.401 0.342 0.291 0.338 0.413 0.258 0.399 0.438 0.362 0.407Loans/total assets 0.379 0.335 0.403 0.576 0.327 0.563 0.390 0.398 0.388 0.439 0.461 0.459Deposits/total assets 0.549 0.491 0.585 0.773 0.287 0.747 0.538 0.334 0.508 0.639 0.514 0.614Capital and reserves/total assets 0.123 0.034 0.089 0.057 0.036 0.055 0.120 0.065 0.112 0.172 0.054 0.132* Source: Eurosystem data. The datasets are corrected for �nonsense� observations, like banks with total assets smaller or equal to zero. �Small� banks have assets less than 1billion euros, while �large� banks have assets more than 10 billion euros.
EC
B • W
ork
ing P
ap
er No
10
5 • D
ecemb
er 20
01
44
Table A5: Data description with respect to liquidity* – December 1998France Germany Italy Spain
High Low Total High Low Total High Low Total High Low TotalNumber of banks 33 33 332 331 320 3207 91 72 759 24 24 243
Mean assets (billion of euros) 0.877 5.252 6.398 2.284 2.910 1.591 0.431 12.535 1.863 0.776 1.196 3.612Share of total assets 0.014 0.082 1 0.148 0.183 1 0.028 0.638 1 0.022 0.034 1.000
Mean deposits 0.526 3.035 3.393 0.900 1.053 0.628 0.080 4.180 0.646 0.223 0.389 1.773Market share of total deposits 0.015 0.089 1 0.148 0.167 1 0.015 0.614 1 0.013 0.023 1.000
Mean loans 0.062 3.086 2.576 0.643 1.104 0.588 0.062 5.556 0.762 0.053 0.645 1.560Market share of total loans 0.002 0.119 1 0.113 0.187 1 0.010 0.692 1 0.004 0.043 1.000
Liquid assets/total assets 0.900 0.043 0.401 0.855 0.102 0.338 0.580 0.221 0.399 0.880 0.090 0.407Loans/total assets 0.063 0.691 0.403 0.334 0.632 0.563 0.257 0.443 0.388 0.063 0.653 0.459Deposits/total assets 0.630 0.522 0.585 0.616 0.63 0.747 0.555 0.322 0.508 0.387 0.367 0.614Capital and reserves/total assets 0.092 0.072 0.089 0.081 0.061 0.055 0.155 0.086 0.112 0.337 0.164 0.132* Source: Eurosystem data. The datasets are corrected for �nonsense� observations, like banks with total assets smaller or equal to zero. A bank with a low degree of liquidityis situated below the 10th percentile of the distribution of liquidity ratios, while a bank with a high degree is situated above the 90th percentile.
EC
B • W
ork
ing P
ap
er No
10
5 • D
ecemb
er 20
01
45
Table A6: Comparing the coverage of BankScope with the actual population in the Eurosystemdatasets (1998)
All AllCommercial Savings Cooperat./ Other Commercial Savings Cooperat./ Other
p-val Sargan 0.966 0.969 0.991 1.000 1.000p-val MA1, MA2 0.464 0.981 0.355 0.613 0.165 0.800 0.594 0.737 0.611 0.680No of banks, obs. 210 4012 210 4012 210 4012 210 4012 210 4012*/**/*** denotes significance at the 10%/5%/1% level. Numbers in italics are standard errors.
Table A11: Percentage change of loans following a one percent change ininterest rates, obtained from BankScope data
BankScope data France Germany Italy Spain-0.391 -0.948*** -0.719 -1.157***Overall loan
response 0.116 0.001 0.686 0.001*/**/*** denotes significance at the 10%/5%/1% level. Numbers in italics are p-vlaues.
ECB • Work ing Pape r No 105 • December 200152
European Central Bank Working Paper Series 1 “A global hazard index for the world foreign exchange markets” by V. Brousseau and
F. Scacciavillani, May 1999. 2 “What does the single monetary policy do? A SVAR benchmark for the European Central
Bank” by C. Monticelli and O. Tristani, May 1999. 3 “Fiscal policy effectiveness and neutrality results in a non-Ricardian world” by C. Detken,
May 1999. 4 “From the ERM to the euro: new evidence on economic and policy convergence among
EU countries” by I. Angeloni and L. Dedola, May 1999. 5 “Core inflation: a review of some conceptual issues” by M. Wynne, May 1999. 6 “The demand for M3 in the euro area” by G. Coenen and J.-L. Vega, September 1999. 7 “A cross-country comparison of market structures in European banking” by O. de Bandt
and E. P. Davis, September 1999. 8 “Inflation zone targeting” by A. Orphanides and V. Wieland, October 1999. 9 “Asymptotic confidence bands for the estimated autocovariance and autocorrelation
functions of vector autoregressive models” by G. Coenen, January 2000. 10 “On the effectiveness of sterilized foreign exchange intervention” by R. Fatum,
February 2000. 11 “Is the yield curve a useful information variable for the Eurosystem?” by J. M. Berk and
P. van Bergeijk, February 2000. 12 “Indicator variables for optimal policy” by L. E. O. Svensson and M. Woodford,
February 2000. 13 “Monetary policy with uncertain parameters” by U. Söderström, February 2000. 14 “Assessing nominal income rules for monetary policy with model and data uncertainty”
by G. D. Rudebusch, February 2000. 15 “The quest for prosperity without inflation” by A. Orphanides, March 2000. 16 “Estimating the implied distribution of the future short term interest rate using the Longstaff-
Schwartz model” by P. Hördahl, March 2000. 17 “Alternative measures of the NAIRU in the euro area: estimates and assessment”
by S. Fabiani and R. Mestre, March 2000. 18 “House prices and the macroeconomy in Europe: Results from a structural VAR analysis”
by M. Iacoviello, April 2000.
ECB • Work ing Pape r No 105 • December 2001 53
19 “The euro and international capital markets” by C. Detken and P. Hartmann, April 2000.
20 “Convergence of fiscal policies in the euro area” by O. De Bandt and F. P. Mongelli,
May 2000. 21 “Firm size and monetary policy transmission: evidence from German business survey data”
by M. Ehrmann, May 2000. 22 “Regulating access to international large value payment systems” by C. Holthausen
and T. Rønde, June 2000. 23 “Escaping Nash inflation” by In-Koo Cho and T. J. Sargent, June 2000. 24 “What horizon for price stability” by F. Smets, July 2000. 25 “Caution and conservatism in the making of monetary policy” by P. Schellekens, July 2000. 26 “Which kind of transparency? On the need for clarity in monetary policy-making”
by B. Winkler, August 2000. 27 “This is what the US leading indicators lead” by M. Camacho and G. Perez-Quiros,
August 2000. 28 “Learning, uncertainty and central bank activism in an economy with strategic interactions”
by M. Ellison and N. Valla, August 2000. 29 “The sources of unemployment fluctuations: an empirical application to the Italian case” by
S. Fabiani, A. Locarno, G. Oneto and P. Sestito, September 2000. 30 “A small estimated euro area model with rational expectations and nominal rigidities”
by G. Coenen and V. Wieland, September 2000. 31 “The disappearing tax base: Is foreign direct investment eroding corporate income taxes?”
by R. Gropp and K. Kostial, September 2000. 32 “Can indeterminacy explain the short-run non-neutrality of money?” by F. De Fiore,
September 2000. 33 “The information content of M3 for future inflation” by C. Trecroci and J. L. Vega,
October 2000. 34 “Capital market development, corporate governance and the credibility of exchange rate
pegs” by O. Castrén and T. Takalo, October 2000. 35 “Systemic risk: A survey” by O. De Bandt and P. Hartmann, November 2000. 36 “Measuring core inflation in the euro area” by C. Morana, November 2000. 37 “Business fixed investment: Evidence of a financial accelerator in Europe” by P. Vermeulen,
November 2000.
ECB • Work ing Pape r No 105 • December 200154
38 “The optimal inflation tax when taxes are costly to collect” by F. De Fiore, November 2000. 39 “A money demand system for euro area M3” by C. Brand and N. Cassola, November 2000. 40 “Financial structure and the interest rate channel of ECB monetary policy” by B. Mojon,
November 2000. 41 “Why adopt transparency? The publication of central bank forecasts” by P. M. Geraats,
January 2001. 42 “An area-wide model (AWM) for the euro area” by G. Fagan, J. Henry and R. Mestre,
January 2001. 43 “Sources of economic renewal: from the traditional firm to the knowledge firm”
by D. R. Palenzuela, February 2001. 44 “The supply and demand for eurosystem deposits – The first 18 months” by U. Bindseil and
F. Seitz, February 2001. 45 “Testing the Rank of the Hankel matrix: a statistical approach” by G. Camba-Mendez and
G. Kapetanios, February 2001. 46 “A two-factor model of the German term structure of interest rates” by N. Cassola and
J. B. Luís, February 2001. 47 “Deposit insurance and moral hazard: does the counterfactual matter?” by R. Gropp and
J. Vesala, February 2001. 48 “Financial market integration in Europe: on the effects of EMU on stock markets” by
M. Fratzscher, March 2001. 49 “Business cycle and monetary policy analysis in a structural sticky-price model of the euro
area” by M. Casares, March 2001. 50 “Employment and productivity growth in service and manufacturing sectors in France,
Germany and the US” by T. von Wachter, March 2001. 51 “The functional form of the demand for euro area M1” by L. Stracca, March 2001. 52 “Are the effects of monetary policy in the euro area greater in recessions than in booms?” by
G. Peersman and F. Smets, March 2001. 53 “An evaluation of some measures of core inflation for the euro area” by J.-L. Vega and
M. A. Wynne, April 2001. 54 “Assessment criteria for output gap estimates” by G. Camba-Méndez and D. R. Palenzuela,
April 2001. 55 “Modelling the demand for loans to the private sector in the euro area” by A. Calza,
G. Gartner and J. Sousa, April 2001.
ECB • Work ing Pape r No 105 • December 2001 55
56 “Stabilization policy in a two country model and the role of financial frictions” by E. Faia, April 2001.
57 “Model-based indicators of labour market rigidity” by S. Fabiani and D. Rodriguez-Palenzuela,
April 2001. 58 “Business cycle asymmetries in stock returns: evidence from higher order moments and
conditional densities” by G. Perez-Quiros and A. Timmermann, April 2001. 59 “Uncertain potential output: implications for monetary policy” by M. Ehrmann and F. Smets,
April 2001. 60 “A multi-country trend indicator for euro area inflation: computation and properties” by
E. Angelini, J. Henry and R. Mestre, April 2001. 61 “Diffusion index-based inflation forecasts for the euro area” by E. Angelini, J. Henry and
R. Mestre, April 2001. 62 “Spectral based methods to identify common trends and common cycles” by G. C. Mendez
and G. Kapetanios, April 2001. 63 “Does money lead inflation in the euro area?” by S. N. Altimari, May 2001. 64 “Exchange rate volatility and euro area imports” by R. Anderton and F. Skudelny, May 2001. 65 “A system approach for measuring the euro area NAIRU” by S. Fabiani and R. Mestre,
May 2001. 66 “Can short-term foreign exchange volatility be predicted by the Global Hazard Index?” by
V. Brousseau and F. Scacciavillani, June 2001. 67 “The daily market for funds in Europe: Has something changed with the EMU?” by
G. P. Quiros and H. R. Mendizabal, June 2001. 68 “The performance of forecast-based monetary policy rules under model uncertainty” by
A. Levin, V. Wieland and J. C.Williams, July 2001. 69 “The ECB monetary policy strategy and the money market” by V. Gaspar, G. Perez-Quiros
and J. Sicilia, July 2001. 70 “Central Bank forecasts of liquidity factors: Quality, publication and the control of the
overnight rate” by U. Bindseil, July 2001. 71 “Asset market linkages in crisis periods” by P. Hartmann, S. Straetmans and C. G. de Vries,
July 2001. 72 “Bank concentration and retail interest rates” by S. Corvoisier and R. Gropp, July 2001. 73 “Interbank lending and monetary policy transmission – evidence for Germany” by
M. Ehrmann and A. Worms, July 2001.
ECB • Work ing Pape r No 105 • December 200156
74 “Interbank market integration under asymmetric information” by X. Freixas and C. Holthausen, August 2001.
75 “Value at risk models in finance” by S. Manganelli and R. F. Engle, August 2001.
76 “Rating agency actions and the pricing of debt and equity of European banks: What can we infer about private sector monitoring of bank soundness?” by R. Gropp and A. J. Richards, August 2001. 77 “Cyclically adjusted budget balances: An alternative approach” by C. Bouthevillain, P. Cour-
Thimann, G. van den Dool, P. Hernández de Cos, G. Langenus, M. Mohr, S. Momigliano and M. Tujula, September 2001.
78 “Investment and monetary policy in the euro area” by B. Mojon, F. Smets and P. Vermeulen,
September 2001. 79 “Does liquidity matter? Properties of a synthetic divisia monetary aggregate in the euro area”
by L. Stracca, October 2001. 80 “The microstructure of the euro money market” by P. Hartmann, M. Manna and
A. Manzanares, October 2001. 81 “What can changes in structural factors tell us about unemployment in Europe?” by J. Morgan
and A. Mourougane, October 2001. 82 “Economic forecasting: some lessons from recent research” by D. Hendry and M. Clements,
October 2001. 83 “Chi-squared tests of interval and density forecasts, and the Bank of England's fan charts” by
K. F. Wallis, November 2001. 84 “Data uncertainty and the role of money as an information variable for monetary policy” by
G. Coenen, A. Levin and V. Wieland, November 2001. 85 “Determinants of the euro real effective exchange rate: a BEER/PEER approach” by F. Maeso-
Fernandez, C. Osbat and B. Schnatz, November 2001. 86 “Rational expectations and near rational alternatives: how best to form expecations” by
M. Beeby, S. G. Hall and S. B. Henry, November 2001. 87 “Credit rationing, output gap and business cycles” by F. Boissay, November 2001. 88 “Why is it so difficult to beat the random walk forecast of exchange rates?” by L. Kilian and
M. P. Taylor, November 2001. 89 “Monetary policy and fears of instability” by V. Brousseau and Carsten Detken, November
2001. 90 “Public pensions and growth” by S. Lambrecht, P. Michel and J. -P. Vidal, November 2001.
ECB • Work ing Pape r No 105 • December 2001 57
ECB • Work ing Pape r No 105 • December 200158
91 “The monetary transmission mechanism in the euro area: more evidence from VARanalysis“ by G. Peersman and F. Smets, December 2001.
92 “A VAR description of the effects of the monetary policy in the individual countries of theeuro area” by B. Mojon and G. Peersman, December 2001.
93 “The monetary transmission mechanism at the euro-area level: issues and results usingstructural macroeconomic models” by P. McAdam and J. Morgan, December 2001.
94 “Monetary policy transmission in the euro area: What do aggregate and nationalstructural models tell us?” by P. van Els, A. Locarno, J. Morgan and J.-P. Villetelle,December 2001.
95 “Some stylised facts on the euro area business cycle” by A.-M. Agresti and B. Mojon,December 2001.
96 “The reaction of bank lending to monetary policy measures in Germany” by A.Worms,December 2001.
97 “Asymmetries in bank lending behaviour. Austria during the 1990s.” by S. Kaufmann,December 2001.
98 “The credit channel in the Netherlands: evidence from bank balance sheets”by L. De Haan, December 2001.
99 “Is there a bank lending channel of monetary policy in Spain?” by I. Hernando
100 “Transmission of monetary policy shocks in Finland: evidence from bank level data onloans” by J. Topi and J. Vilmunen, December 2001.
101 “Monetary policy and bank lending in France: are there asymmetries?” by C. Loupias,F. Savignac and P. Sevestre, December 2001.
102 “The bank lending channel of monetary policy: identification and estimation usingPortuguese micro bank data” by L. Farinha and C. Robalo Marques, December 2001.
103 “Bank-specific characteristics and monetary policy transmission: the case of Italy”by L. Gambacorta, December 2001.
104 “Is there a bank lending channel of monetary policy in Greece? Evidence from bank leveldata” by S. N. Brissimis, N. C. Kamberoglou and G. T. Simigiannis, December 2001.
105 “Financial systems and the role of banks in monetary policy transmission in the euro
December 2001.
106 “Investment, the cost of capital, and monetary policy in the nineties in France: a paneldata investigation” by J. B. Chatelain and A. Tiomo, December 2001.
107 “The interest rate and credit channel in Belgium: an investigation with micro-level firmdata” by P. Butzen, C. Fuss and P. Vermeulen, December 2001.
and J. Martínez-Pagés, December 2001.
area” by M. Ehrmann, L. Gambacorta, J. Martínez-Pagés, P. Sevestre, A. Worms,
ECB • Work ing Pape r No 105 • December 2001 59
108 “Credit channel and investment behaviour in Austria: a micro-econometric approach”by M. Valderrama, December 2001.
109 “Monetary transmission in Germany: new perspectives on financial constraints andinvestment spending” by U. von Kalckreuth, December 2001.
110 “Does monetary policy have asymmetric effects? A look at the investment decisions ofItalian firms” by E. Gaiotti and A. Generale, December 2001.
111 “Monetary transmission: empirical evidence from Luxembourg firm level data”by P. Lünnemann and T. Mathä, December 2001.
112 “Firm investment and monetary transmission in the euro area” by J. B. Chatelain,A. Generale, I. Hernando, U. von Kalckreuth and P. Vermeulen, December 2001.