College of Business Administration University of Rhode Island 2007/2008 No. 2 This working paper series is intended to facilitate discussion and encourage the exchange of ideas. Inclusion here does not preclude publication elsewhere. It is the original work of the author(s) and subject to copyright regulations. WORKING PAPER SERIES encouraging creative research Office of the Dean College of Business Administration Ballentine Hall 7 Lippitt Road Kingston, RI 02881 401-874-2337 www.cba.uri.edu William A. Orme David Lam, Bing Xuan Lin and David Michayluk S & P 500 Change to Free Float Demand and Supply and their Relationship with Liquidity: Evidence from the
Transcript
College of Business Administration
University of Rhode Island
2007/2008 No. 2
This working paper series is intended tofacilitate discussion and encourage the
exchange of ideas. Inclusion here does notpreclude publication elsewhere.
It is the original work of the author(s) andsubject to copyright regulations.
WORKING PAPER SERIESencouraging creative research
Office of the DeanCollege of Business AdministrationBallentine Hall7 Lippitt RoadKingston, RI 02881401-874-2337www.cba.uri.edu
William A. Orme
David Lam, Bing Xuan Lin and David Michayluk
S & P 500 Change to Free Float
Demand and Supply and their Relationship with Liquidity: Evidence from the
Demand and Supply and their Relationship with Liquidity: Evidence from the S&P 500 Change to Free Float
David Lam University of Technology, Sydney
PO Box 123, School of Finance and Economics Broadway, NSW Australia 2007
+61-2-9514-7761 Fax +61-2-9514-7711
Bing-Xuan Lin
College of Business Administration University of Rhode Island Kingston, RI USA 02881
Demand and Supply and their Relationship with Liquidity: Evidence
from the S&P 500 Change to Free Float
Demand and supply describe the fundamental economic relationship between prices and quantities of exchanged goods, however, market efficiency suggests that information drives changes in the value of equity shares and prices are only temporarily influenced by demand and supply. During 2005 Standard and Poor’s altered their US indices in a two-stage process from a simple market capitalization weighting to a free float weighting expressly to reflect the extent of the shares available for trading. By relating the supply to the demand, S&P’s change acknowledged a liquidity influence on the pricing mechanism. This paper examines the behavior of liquidity estimates and finds that a stock’s free float affects the level of liquidity and the price impact responses observable in the market. The evidence also support the notion that the adoption of a free float methodology was effective in reducing price distortions created by demand that was disproportionate to supply for low float stocks. These findings support the existence of stock market demand and supply curves in the medium to long-term and their influence on observable liquidity measures and gives support to a liquidity component in asset pricing.
1
Demand and Supply and their Relationship with Liquidity: Evidence from the S&P 500 Change to Free Float
The size of the index funds benchmarked to the S&P 500 index is estimated by Standard and Poor’s to
be at a record high of US $1.26 trillion during the year 2005. Trading by index funds that duplicate
the index creates demand for each stock component that is proportional to the weighting in the index1.
With a market capitalization weighting, any purchases or sales by index funds are in the same
proportion as the total number of shares outstanding. If all the shares are available for trading then the
supply of stocks is then proportional to the demand. A complication arising before the switch to a free
float weighting is that the total amount of shares were not available for trading yet index funds were
required to buy shares in those proportions.
Free float is defined by equity index providers as the percentage of a company’s total
number of shares outstanding freely available for trading in the market (Standard and Poor’s, 2004a;
MSCI, 2000). A low free float company is one that has a large proportion of shares outstanding held
by strategic shareholders that hold these shares primarily for control rather than for investment value.
An adjustment to free float process was implemented where the weighting of each company within
the index was altered to reflect each index constituent’s available proportion of tradable shares. With
a free float adjusted index, an additional Investable Weight Factor ( jIWF ) is applied to the total
number of shares outstanding for each stock in the index. The IWF is computed as the ratio of the
company’s available float shares over total shares outstanding. The IWF is incorporated into the
1 From 1998 to 2003 approximately 10% of the shares outstanding of S&P 500 index constituents were held by index funds.
2
jP is the price of stock j, jS is the total shares outstanding of stock j.
The free float adjustment process does not directly result in the removal or inclusion of any
particular stock from the index. Rather, the individual weightings of all stocks in the S&P 500 index
jointly shifted to new index weightings. Stocks that had low (high) free float were allocated lower
(higher) index weightings within the S&P 500 Index. The change was done in two stages in order to
minimize the immediate effects of the change. The immediate rebalancing effects are not the focus of
this paper since there is a well-documented literature on temporary price effects. This paper focuses
on liquidity effects over the medium term.
The free float methodology was promoted as a means of reducing the potential price distortions
created from trading by index funds. The price distortion occurs whenever an index fund receives an
influx or outflow of funds. Each stock must be purchased or sold in the same proportion as the overall
weighting, however if a significant proportion of shares of any companies are held by strategic
shareholders, then the liquidity of those stocks may be reduced since the shares are not available for
trading. Since the index fund must obtain the same proportion of shares as the weighting in the index,
it creates a disproportionate amount of trading in those stocks with a reduced free float. This may lead
to an artificial increase or decrease in the price of the stock and an increase in the cost of index
investing (Standard and Poor’s, 2004b). This paper examines whether measurements of liquidity
display behavior that could lead to the price distortions.
To demonstrate the relationship between free float and stock liquidity consider the example of
Coca-Cola Enterprises (CCE). CCE has a full float factor of 0.50 (Standards and Poor’s, 2005), with
approximately 50% of its total shares outstanding (about 24.7 million) which are not readily available
for buying and selling by investors, or are taken outside of the active market by strategic shareholders
(Thomson Financial, 2004). If CCE had a weighting of 1% of the S&P 500, index tracking funds in
3
their attempts to replicate that 1% weighting of the total number of shares outstanding would in effect
be purchasing a proportion representing 2% of the amount of shares actually available in the public
float. Before the free float adjustment, index investors buying an index fund would create a higher
disproportionate demand for this low free float stock that would demand a larger portion of the
available supply.
This study focuses on discovering how the availability of shares affects stock liquidity in the
medium term. The two-step change to a free float weighting provides an excellent natural experiment
to measure the liquidity dynamics where some stocks may be facing additional pressure to absorb
demand with a limited supply. By estimating the price impact and liquidity measures during the three
periods around the two index alterations, we provide insight into how liquidity is related to supply and
demand. By examining periods away from the dates of the changes, any short-term price pressure
effects are ignored but longer medium-term liquidity differences are discernible. This examination of
the order flow helps to explain the relationship between liquidity and price adjustment.
The remainder of the paper is organized as follows: Section 1 discusses the implementation of
the free float weighting and the hypotheses to be investigated. Section 2 discusses the method of
analysis. Section 3 reports results and Section 4 provides a summary and conclusion.
1. Free float implementation and prior literature
Before the adjustment to a free float weighting, each stock in the S&P 500 index used the total number
of shares outstanding without regard to those shares held by outside investors2. A stock that has a
2An outside investor in this context is one that does not fit Standard and Poor’s definition of one of three groups of shareholders whose holdings are presumed to be for control and thus subject to float adjustment. These include: (1) strategic partners and other publicly traded corporations; (2) domestic and foreign government entities; and (3) current and former officers and directors of the company. Sourced from Standard and Poor’s (2004) “Float Adjustment” 28th September 2004.
4
significant amount of its total shares outstanding as non-tradable due to holdings by strategic
stockholders is labeled a low free float stock with a float factor less than 1.00; in contrast, the high free
float stocks have a float factor of 1.00. With the shift to weighting by free float, the total weighting of
all stocks in aggregate declines and a stock with a factor of 1.00 will experience an increase in the
relative proportion of shares required of that stock to mimic the index.
Consistent with S&P advance disclosure, the adoption of a free float methodology was
announced during March 2004, many months before the final full-float adjustment on 16 September
2005. During October 2004, there was publication of two provisional float-adjusted S&P 500 indices.
This was aimed at assisting index funds in rebalancing their portfolios before the half and full-float
adjustments on Friday 18 March 2005 and Friday 16 September 2005, respectively, as shown in
Figure 1.
Insert Figure 1 about here
Changes to the S&P 500 Index have been used in prior studies to test a number of hypotheses
including (i) the imperfect substitutes hypothesis (ISH) commonly referred to as the downward
sloping demand curve proposition, (ii) the price pressure hypothesis (PPH), (iii) the information
hypothesis, and (iv) the liquidity effect hypothesis. Jointly the ISH and PPH are repeatedly examined
in the majority of index change studies involving stock additions to and deletions from a particular
index, not necessarily the S&P 500 index. Often jointly interpreted, the information and liquidity
hypotheses provide quite similar explanations for observed changes in trading activity following the
addition of a stock to an index.
5
The ISH and PPH are primarily tested because evidence to support either hypothesis is
interpreted as evidence against the strict form of the efficient market hypothesis (EMH). Stock
additions to and deletions from an index such as the S&P 500 index involve large block purchases and
sales of stock. The EMH explicitly predicts that security prices reflect all publicly available
information. One implication occurs when a trader is able to convince the market that they do not
possess private information about a security. The trader would be able to buy or sell a large block of
that stock at close to the market price, that is, their trading activity would not affect the price of the
security. A number of early studies on block trades find that these trades do affect security prices. For
example, Scholes (1972) examined secondary stock distributions and Kraus and Stoll (1972) studied
the price impact of block trades on the New York Stock Exchange (NYSE). They found an immediate
price drop following large share sales. This finding led them to promote two hypotheses that
contrasted with the EMH, the imperfect substitutes and price pressure hypotheses.
In this study all stocks in the index are affected by the change in weighting but not in equal
ways, however we are able to discard the information hypothesis since there is clearly no information
being released that was not known well in advance of the actual changes. As explained by Shleifer
(1986), the demand curve for stocks is theoretically kept flat by arbitrage between perfect substitutes.
In the case of index funds, the demand for shares to replicate an index creates demand for specific
shares without any substitute. Thus, examination of liquidity responses ordered by the free float factor
will indicate the extent to which the availability of shares influences liquidity. Since the index shifts in
two-stages from a market capitalization to a free float weighting, differences across shares should
become less significant over time if the availability of shares influences liquidity.
Although, the float related literature is limited to a handful of studies, Kaul et al. (2000)
identify a potential relationship between the public float and stock liquidity. They examined the
6
effects of the redefinition of the public float of 31 stocks on the Toronto Stock Exchange (TSE) 300
Index, that occurred on November 15 1996, and found the redefinition resulted in an increase in both
the float and the index weightings of these stocks. Popularity of the TSE 300 index rose following the
public float redefinition as the index weightings became more stable, making index tracking easier.
They observed a temporary abnormal increase in trading volume (consistent with index rebalancing)
but no significant narrowing of the bid-ask spread.
Governments may also adversely affect the free float of a stock and affect liquidity. Chan et al
(2004) studied the effect of Hong Kong government intervention in the domestic stock market during
August 1998 when the government purchased an estimated HK$ 3 (US$ 0.4) billion in shares of the
Hang Seng Index (HIS) component stocks in an attempt to drive currency speculators out of the
domestic financial market. The government promised not to sell the shares for some time resulting in a
significant decline in the free-float of shares in the Hong Kong stock market. Chan et al. used the price
effect model by Kyle (1985), which provides a lambda measure that is an increasing function of
information asymmetry and a decreasing function of liquidity trading. They concluded that the level of
free float in the market had affected market liquidity. However, they note that there was no significant
and positive relation (i) between the increase in the price effect and the government’s holdings or (ii)
between the increase in the price effect and the decrease in the free float.
2. Hypothesis development and method of analysis
This study characterizes the cross section of liquidity and tests for stability of the liquidity measures
across time periods when index funds mimicking the S&P 500 altered their proportion of trading. S&P
altered the weighting in their US indexes in two phases in 2005 in order to mitigate the anticipated
7
pressure on stocks with a low free float and to reduce the cost of rebalancing by index funds. The half-
float occurred on March 18, 2005 and the full free float on September 16, 2005. The time period
immediately around the actual changes is excluded since the focus of the study is not short term price
pressure. Rather, three one month sample periods are chosen in which to conduct the analysis.
December 2003 is chosen as the pre-announcement period to capture a steady period of liquidity that
was unaffected by any issues related to the free float adjustment. This period is well before the initial
announcement of the change to free float. June 2005 is mid-way between the half and full float
implementation dates and was chosen to avoid the influence of rebalancing trades by index funds
around the half float date in March 2005 and full float date September 2005. December 2005 was
chosen to examine a steady period of liquidity after the September rebalancing trades of index funds is
complete. The hypothesis to be tested over these three periods is as follows:
:0H The differences in liquidity across stocks is less pronounced after the S&P 500 index changes to
half float and full float methodology.
Of the 500 companies, 80 Nasdaq companies are discarded from the sample due to the
different market structure of Nasdaq3. Of the remaining 420 stocks, 18 were not traded in 2003 and are
discarded from the sample, with 402 firms included in the final sample. 79 of these firms had their
weighting fall while all the other stocks experienced an increase in their relative proportional S&P 500
index representation. Table 1 lists the stocks that had their free float weighting decline. There is a
lower bound to the level of free float since the S&P 500 Index inclusion criteria in place before and
3 Discarding the typically smaller Nasdaq stocks may reduce the significance of differences between stocks since smaller stocks typically have lower liquidity and may have more variability in their liquidity measures. This action therefore works against finding significant results.
8
after the free float adjustment required stocks included in the S&P 500 Index to maintain a minimum
public float threshold of 50%, that is IWF = 0.50 (Standard and Poor’s, 2006a).
Insert Table 1 about here
An alternative method of sample stock division is to divide the stocks that underwent a decline
in weighting into different groups depending on the free float level. We divide the 79 stocks with a
free float factor less than one into two samples (above or below a free float factor of 0.80). The results
using these smaller samples are similar but are not reported in the interests of space.4
Data is obtained primarily from the Trades and Quotes (TAQ) data set distributed by the New
York Stock Exchange (NYSE), which contains trade prices, quotes, and shares traded for exchange
listed stocks. The sample period covered is for the month of December 2003 (22 trading days), June
2005 (22 trading days) and December 2005 (21 trading days). Certain data was also manually
collected from company annual reports and SEC filings. Daily liquidity measures were estimated for
each NYSE stock in the S&P 500 Index for each of the individual trading days, then mean values for
reach stock were used in cross-sectional testing.5
3. Liquidity estimates
Liquidity proxies are estimated in each of the three periods and if liquidity is affected by the change to
free float then differences should be present between the high and low free float stocks. The
4 The three sample test results are available on request. 5 There are three prominent specialists in the low float grouping and four in the medium float grouping. Any conclusions about differences may be partially attributable to how each specialist handled order flow.
9
differences should be most pronounced in the earlier sample period (December 2003), and should
decline in June 2005 and not be observable in the final sample period (December 2005).
Insert Table 2 about here
We employ a number of different liquidity measures. The first measure examined is the bid-
ask spread. This measure captures the cost of immediate trading. Table 2 reports that the percentage of
transactions that occurred within the bid-ask spread has gradually declined over time. The change
from December 2003 to December 2005, includes (i) a decline in the percentage of transactions that
occurred within the spread (from 23.7% to 18.8%), (ii) an increase in the percentage of transactions at
the bid (from 33.7% to 38.3%), and (iii) a marginal increase in the percentage of transactions at the
ask (from 42.5% to 42.9%). The implication of these trends is that as more transactions occur at the
ask and the bid, the quoted bid-ask spread measure reflects a greater percentage of trades, and is
therefore more accurate in measuring the cost of transacting. There were no significant differences
between high and low float stocks in the percentage of trades within the quoted bid-ask spread. We
include this table to report on the changing characteristics of trading that may simultaneously be
occurring since the sample periods reflect a period of increasing competition. Since the comparison is
across stocks during one period at a time, concern about changing characteristics across time will be
examined by testing across the periods as well.
Insert Table 3 about here
10
Table 3 reports the univariate estimates of the bid-ask spread measures over the three periods
and the two groups. The results indicate that for the quoted bid-ask spread, the differences between
high and low float groups becomes less pronounced over time. In the December 2003, Panel (a)
reports that the bid-ask spread is larger (using both parametric and non-parametric tests) for those
S&P 500 stocks with free float factors less than one. The level of significance drops to 5% for the
parametric test while the non-parametric test is not significant in June 2003. No statistical differences
are observed in December 2005. Examining the mean percentage bid-ask spread in Panel (b) the level
of significance drops from 2.24% in December 2003 to 5.05% in June 2005 and finally to 7.98% in
December 2005. The levels decline over the two years and the decline is statistically significant as
noted by the tests across the periods.
Other measures of the quoted spread and the percentage spread are examined and reported in
Table 3 to provide a robustness check on the bid-ask spread. A time weighted quoted bid-ask spread,
shown in Panel (c), supports the Panel (a) results at the same significance levels for the parametric
tests. A time-weighted percentage bid-ask spread, shown in Panel (d), supports the panel (b) results,
also with the same statistical significance levels. Trade-weighted quoted and percentage bid-ask
spreads, shown in Panels (e) and (f), respectively, also support the declining significance but for these
measures, the only statistical difference is in the first period and the half-float period already has no
significant difference between the high and low float groups.
The effective bid-ask spread shown in Panel (g) reports statistically significant differences in
December 2003 (at a level of 1%), in June 2005 (at a level of 5%) but no statistical difference in
December 2005. The effective percentage bid-ask spread reports the same decline in the level of
significance, but for this measure the decline is from 3.9% to 4.4% to 8.7%. There were no statistical
differences that were observable from the realized bid-ask spread.
11
These results show a clear pattern where the lower free float stocks have higher quoted and
percentage bid-ask spreads but the difference between the groups declines as the free float weightings
are implemented. The tests across time reveal that overall the liquidity measures have differences even
within each group, as there is an increase in liquidity possibly due to increases in competition. The
overall declines in liquidity are not problematic since they do not hamper the tests across groups
within each period. One possible confounding factor may be that as the liquidity measures improve,
the differences might naturally become less pronounced.
Insert Table 4 about here
Table 4 reports the liquidity estimates for the depth liquidity measures examined in this study.
Depth represents the ability to trade at the prevailing quotes without suffering from any price
concession. The results of examining this aspect of liquidity also support the hypothesis that the
switch to free float weighting reduced the differences in liquidity. Panel (a) reports the sum of the
time-weighted dollar value of the depth on both sides of the bid-ask spread. There was a statistically
significant difference between the low and the high free float stocks in December 2003, but there were
no statistical differences in June 2005 and December 2005. Panel (b) reports the sum of the number of
shares on both sides of the bid-ask spread and the level of significance shows a decline over the three
periods when the non-parametric test is examined. In December 2003, the difference between the high
and low free float stocks is statistically significant at a level of 5% but this difference declines to 10%
in June 2005 and there is no statistical difference in December 2005. These tests are robust to either
side of the bid-ask spread.
12
The decline in depth differences supports the reduction in differences between high and low
free float stocks when the weighting of the S&P 500 index is changed to reflect the number of shares
outstanding. This supports the hypothesis that market did respond differently to the low free float
stocks.
There is the possibility that the above univariate tests were biased by factors unrelated to the
free float adjustment of the S&P 500 index. In order to control for these factors and to supplement the
findings a pooled time series cross-sectional multivariate analysis of measures of spread and depth are
used. Copeland and Galai (1983) and others document that (i) the quoted bid-ask spread increases
with return volatility and decreases with stock price and trading volume, whereas (ii) depth varies
directly with trading volume and inversely with price and volatility. Regression analysis is conducted
to consider these factors and confirm the univariate analysis. The variable MMPRICE (average price
per transaction) proxies for the effect of price, the variable MSSIZE (daily number of shares traded)
proxies for the effect of trading volume, while stock volatility is represented by SDDRET (the
standard deviation of daily closing price returns)6. The regression model facilities the interpretation of
results as to confirm the findings observed under univariate analysis with the incorporating the ‘group
period’ indicator variables. The base model is as follows:
6 The control variables are examined across the free float groups and no differences are observed for the average trade price, the standard deviation of returns and the average number of shares traded per transaction. The daily number of shares traded is higher for high free float groups across all periods using a non-parametric test. Complete results available upon request.
13
Where the F variable represents the three free float groups and the T represents the three time periods.
The three free float groups are used in the regression analysis and results are reported in Table 5. The
same measures of liquidity are used in the regression analysis as are used in the univariate analysis
reported in Table 3.
Insert Table 5 about here
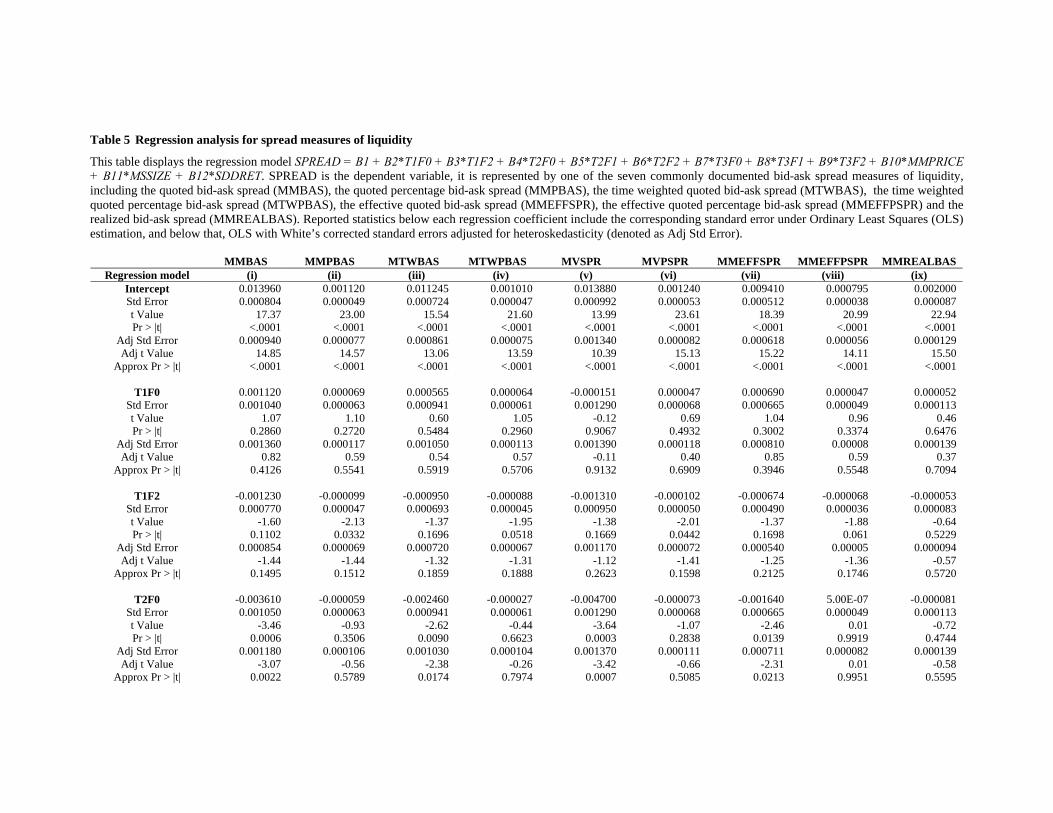
Table 5 reports the coefficients for each dummy variable across the three periods and three free
float groups. The lowest free float group has an F2 in the variable name. For period 1 (T1), F2 is
statistically significant for 4 of the 9 liquidity variables, indicating that the lowest liquidity group is
statistically different from the medium liquidity group. This result indicates the presence of liquidity
differences across the groups as measured by about half of these liquidity measures during the first
period before any reduction in activity for low float stocks by index funds.
Testing across groups within each of the other periods requires creating an F test to compare
different coefficients. Table 6 reports the specific tests. Tests numbered 4, 8 and 12 report whether the
coefficients within each period are significantly different across the 9 different bid-ask spread liquidity
variables. In Period 1, 7 out of 9 liquidity variables are statistically different between the free float
groups. For both period 2 and period 3 there are 4 out of 9 variables that are statistically different
between the free float groups. A similar regression analysis for depth (not reported but available upon
request) controls for price, and reveals statistically significant differences across free float groups only
during December 2003.
Insert Table 6 about here
14
These results using control variables confirm the univariate analysis and support the
hypothesis that differences in the liquidity levels between low and high free float stocks declined
when the free float weighting of the S&P 500 index was introduced.
4. Summary and conclusion This study differs from previous studies conducted on S&P 500 index changes as the event examined
in this study is the adoption of a free float methodology to the index calculation. This information-free
event provides a unique natural experiment that allows medium-to-long term liquidity effects to be
examined across stocks traded on the New York Stock Exchange that are included in the S&P 500
index. Prior to the index weightings reflecting the availability of shares for trading, index funds
replicated the index by buying and selling the same proportion of shares as are proportional in the
index. For stocks with a low free float, the disproportionately greater demand for low float stocks
created pressure on the available liquidity and resulted in price distortions. Any liquidity differences
would gradually become less pronounced with each phase of the free float adjustment to the S&P 500
index if the free float adjustment were effective in addressing a demand and supply imbalance.
Cross sectional evidence of liquidity differences were found between stocks in the S&P 500
index segregated by their respective free float factors (or investable weight factors). In addition, the
time series findings offer evidence of a gradual narrowing of the liquidity difference between high and
low free float stocks following each phase of the free float adjustment. These findings contribute to
the observation that, in the presence of increasing capital inflows into index funds, the liquidity of
15
constituent stocks can be influenced when the proportion of shares demanded by index funds is
inconsistent with the availability of shares for trading.
This study provides evidence that liquidity differences are related to the supply of shares. This
simple explanation appears to contradict efficient markets theory that information alone drives stock
prices. While short-term price pressure has been documented in the literature, this is the first paper to
measure medium term supply and demand effects. This finding implies that the demand and supply
may influence pricing mechanisms, and if liquidity reflects demand and supply, this finding gives
support to a liquidity component in asset pricing.
Another implication of this study is that measurement of liquidity should consider the intrinsic
trading ability of a stock. Traditional measures of liquidity may be simplified and without controlling
for fundamental differences in supply, any conclusions about liquidity differences may become
confounded. A third implication of this study is that the prior findings of S&P 500 index change
studies did not consider the availability of shares for trading (free float) before dismissing the liquidity
hypothesis. These implications suggest avenues of further research.
16
References Chan, K., Y. Chan and W. Fong, 2004, Free float and market liquidity: A study of Hong Kong
government intervention, The Journal of Financial Research 27, 179-197. Copeland, T. C., and D. Galai, 1983, Information effects on the bid-ask spread, Journal of Finance, 38,
1457-1469. Kaul, A., V. Mehrotra and R. Morck, 2000, Demand Curves for Stocks Do Slope Down: New
Evidence from an Index Weights Adjustment, Journal of Finance 55, 893-912 Kraus, A and H.R. Stoll, 1972, Price Impacts of Block Trading on the New York Stock Exchange.,
Journal of Finance 27, 569-88. Kyle, A., 1985, Continuous Auctions and Insider Trading, Econometrica 53, 1315-1336. MSCI, 2000, News watch: Consultation on free float and target market representation - October 2000. Scholes, M.S, 1972, The Market for Securities: Substitution versus Price Pressure and the Effects of
Information on Share Prices., Journal of Business 45, 179-211. Shleifer, A., 1986, Do Demand Curves for Stocks Slope Down?, The Journal of Finance 41, 579-590. Standard and Poor's, 2004a, Standard and Poor's - Understanding Indices, May 2004. Standard and Poor's, 2004b, Standard and Poor's - Float Adjustment FAQ, September 28, 2004. Standard and Poor's, 2005, S&P float factors list - as of March 18, 2005. Thomson Financial, 2004, Float Adjustment to the S&P 500., October 2004
17
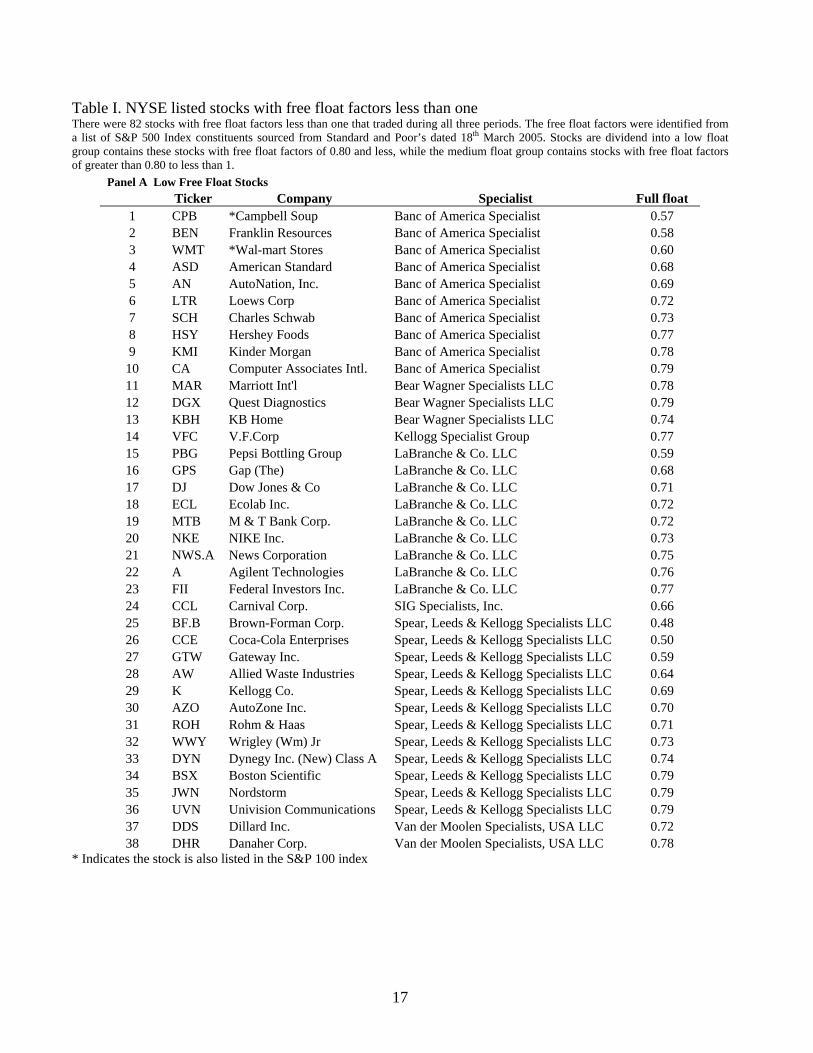
Table I. NYSE listed stocks with free float factors less than one There were 82 stocks with free float factors less than one that traded during all three periods. The free float factors were identified from a list of S&P 500 Index constituents sourced from Standard and Poor’s dated 18th March 2005. Stocks are dividend into a low float group contains these stocks with free float factors of 0.80 and less, while the medium float group contains stocks with free float factors of greater than 0.80 to less than 1.
Panel A Low Free Float Stocks Ticker Company Specialist Full float
1 CPB *Campbell Soup Banc of America Specialist 0.57 2 BEN Franklin Resources Banc of America Specialist 0.58 3 WMT *Wal-mart Stores Banc of America Specialist 0.60 4 ASD American Standard Banc of America Specialist 0.68 5 AN AutoNation, Inc. Banc of America Specialist 0.69 6 LTR Loews Corp Banc of America Specialist 0.72 7 SCH Charles Schwab Banc of America Specialist 0.73 8 HSY Hershey Foods Banc of America Specialist 0.77 9 KMI Kinder Morgan Banc of America Specialist 0.78
10 CA Computer Associates Intl. Banc of America Specialist 0.79 11 MAR Marriott Int'l Bear Wagner Specialists LLC 0.78 12 DGX Quest Diagnostics Bear Wagner Specialists LLC 0.79 13 KBH KB Home Bear Wagner Specialists LLC 0.74 14 VFC V.F.Corp Kellogg Specialist Group 0.77 15 PBG Pepsi Bottling Group LaBranche & Co. LLC 0.59 16 GPS Gap (The) LaBranche & Co. LLC 0.68 17 DJ Dow Jones & Co LaBranche & Co. LLC 0.71 18 ECL Ecolab Inc. LaBranche & Co. LLC 0.72 19 MTB M & T Bank Corp. LaBranche & Co. LLC 0.72 20 NKE NIKE Inc. LaBranche & Co. LLC 0.73 21 NWS.A News Corporation LaBranche & Co. LLC 0.75 22 A Agilent Technologies LaBranche & Co. LLC 0.76 23 FII Federal Investors Inc. LaBranche & Co. LLC 0.77 24 CCL Carnival Corp. SIG Specialists, Inc. 0.66 25 BF.B Brown-Forman Corp. Spear, Leeds & Kellogg Specialists LLC 0.48 26 CCE Coca-Cola Enterprises Spear, Leeds & Kellogg Specialists LLC 0.50 27 GTW Gateway Inc. Spear, Leeds & Kellogg Specialists LLC 0.59 28 AW Allied Waste Industries Spear, Leeds & Kellogg Specialists LLC 0.64 29 K Kellogg Co. Spear, Leeds & Kellogg Specialists LLC 0.69 30 AZO AutoZone Inc. Spear, Leeds & Kellogg Specialists LLC 0.70 31 ROH Rohm & Haas Spear, Leeds & Kellogg Specialists LLC 0.71 32 WWY Wrigley (Wm) Jr Spear, Leeds & Kellogg Specialists LLC 0.73 33 DYN Dynegy Inc. (New) Class A Spear, Leeds & Kellogg Specialists LLC 0.74 34 BSX Boston Scientific Spear, Leeds & Kellogg Specialists LLC 0.79 35 JWN Nordstorm Spear, Leeds & Kellogg Specialists LLC 0.79 36 UVN Univision Communications Spear, Leeds & Kellogg Specialists LLC 0.79 37 DDS Dillard Inc. Van der Moolen Specialists, USA LLC 0.72 38 DHR Danaher Corp. Van der Moolen Specialists, USA LLC 0.78
* Indicates the stock is also listed in the S&P 100 index
18
Table I. NYSE listed stocks with free float factors less than one (continued)
Panel B Medium Free Float Stocks Ticker Company Specialist Full float
1 SWK Stanley works Banc of America Specialist 0.81 2 AHC Amerada Hess Banc of America Specialist 0.86 3 GS *Golden Sachs Group Banc of America Specialist 0.86 4 NCC National City Corp Banc of America Specialist 0.86 5 CNP CenterPoint Energy Banc of America Specialist 0.87 6 IFF International Flav/Frag Banc of America Specialist 0.87 7 KO *Coca Cola Co. Banc of America Specialist 0.87 8 LUV Southwest Airlines Banc of America Specialist 0.87 9 JBL Jabil Circuit Bear Wagner Specialists LLC 0.81
10 LMT Lockheed Martin Corp. Bear Wagner Specialists LLC 0.82 11 MCO Moody's Corp Bear Wagner Specialists LLC 0.84 12 RHI Robert Half International Bear Wagner Specialists LLC 0.85 13 ATI *Allegheny Technologies Inc Bear Wagner Specialists LLC 0.86 14 NAV Navistar International Corp Bear Wagner Specialists LLC 0.87 15 HAS Hasbro Inc. Bear Wagner Specialists LLC 0.88 16 ASH Ashland Inc. Kellogg Specialist Group 0.84 17 ITW Illinois Tool Works Kellogg Specialist Group 0.87 18 MDP Meredith Corp. LaBranche & Co. LLC 0.82 19 AVY Avery Dennison Corp. LaBranche & Co. LLC 0.83 20 DG Dollar General LaBranche & Co. LLC 0.83 21 Q Qwest Communications Int LaBranche & Co. LLC 0.83 22 SHW Sherwin-Williams SIG Specialists, Inc. 0.80 23 CCU *Clear Channel Communications LaBranche & Co. LLC 0.87 24 AXP *American Express LaBranche & Co. LLC 0.88 25 STI Sun Trust Banks LaBranche & Co. LLC 0.88 26 TRB Tribune Co LaBranche & Co. LLC 0.88 27 ADM Archer-Daniels-Midland LaBranche & Co. LLC 0.90 28 RBK Reebok International SIG Specialists, Inc. 0.88 29 BBY Best Buy Co., Inc. Spear, Leeds & Kellogg Specialists LLC 0.81 30 GWW Grainger (W.W) Inc. Spear, Leeds & Kellogg Specialists LLC 0.84 31 ACV Alberto-Culver Spear, Leeds & Kellogg Specialists LLC 0.86 32 GDW Golden West Financial Van der Moolen Specialists, USA LLC 0.83 33 PHM Pulte Homes Inc. Van der Moolen Specialists, USA LLC 0.83 34 DRI Darden Restuarants Van der Moolen Specialists, USA LLC 0.86 35 MI Marshall & Ilsley Corp. Van der Moolen Specialists, USA LLC 0.86 36 SYK Stryker Corp. Van der Moolen Specialists, USA LLC 0.86 37 CMI Cummins Inc. Van der Moolen Specialists, USA LLC 0.88 38 LTD *Limited Brands, Inc. Van der Moolen Specialists, USA LLC 0.88 39 ROK *Rockwell Automation Inc. Van der Moolen Specialists, USA LLC 0.89 40 HCA *HCA Inc. Van der Moolen Specialists, USA LLC 0.90 41 KSS Kohl's Corp Van der Moolen Specialists, USA LLC 0.90
* Indicates the stock is also listed in the S&P 100 index
19
Table 2 Percentage of transactions that occur within the bid-ask spread This table reports the percentage of transactions that occur with the bid-ask spread in each of the three sample months. Calculations are made using NYSE TAQ data and only include those stocks in the final sample.
All stocks n = 402 Dec-03 Jun-05 Dec-05 At the ask 42.53% 40.87% 42.85% Within the spread 23.73% 21.41% 18.78% At the bid 33.74% 37.72% 38.37% Total 100.00% 100.00% 100.00%
20
Table 3 Liquidity Estimates – Bid – Ask Spread This table reports liquidity estimates for the NYSE stocks that were included in the S&P 500 during the adjustment to a free float weighting. Period 1 is the month of December 2003, Period 2 is June 2005 and Period 3 is December 2005. The panels show the results of two tests of group means (i) across time per float grouping and (ii) across float groupings per month. The reported results are for a parametric ANOVA F-value test along with corresponding p-values and a non-parametric Kruskal-Wallis approximation of the Wilcoxon rank sum test with calculated Chi-square and corresponding p-values, as part of cross sectional float group mean comparisons. Panel (a) Mean quoted bid-ask spread
MMBAS N Period 1 Period 2 Period 3 F Value Pr > F Chi-Square Pr > Chi-SquareAll 402 0.024663 0.021600 0.021756 16.0812*** <.0001 50.0351*** <.0001
F Value 0.1745 0.0813 0.1780 Pr > F 0.6764 0.7757 0.6734 Chi-Square 0.5215 0.4757 0.9781
Pr > Chi-Square 0.4702 0.4904 0.3227
*Significant at the 10% level. **Significant at the 5% level. ***Significant at the 1% level.
22
Table 4 Liquidity Estimates - depth This table reports liquidity estimates for the NYSE stocks that were included in the S&P 500 during the adjustment to a free float weighting. Period 1 is the month of December 2003, Period 2 is June 2005 and Period 3 is December 2005. The panels show the results of two tests of group means (i) across time per float grouping and (ii) across float groupings per month. The reported results are for a parametric ANOVA F-value test along with corresponding p-values and a non-parametric Kruskal-Wallis approximation of the Wilcoxon rank sum test with calculated Chi-square and corresponding p-values, as part of cross sectional float group mean comparisons.
Panel (a) Sum of time weighted dollar value of offer and bid depth
MDOLDEPTH N Period 1 Period 2 Period 3 F Value Pr > F Chi-Square Pr > Chi-SquareAll 402 1,212.46 1,055.41 1,151.13 4.0146** 0.0180 29.9734*** <.0001
F Value 0.7469 0.4665 0.2394 Pr > F 0.3880 0.4950 0.6249 Chi-Square 4.1486** 2.7263* 0.9463 Pr > Chi-Square 0.0417 0.0987 0.3307
*Significant at the 10% level. **Significant at the 5% level. ***Significant at the 1% level.
Table 5 Regression analysis for spread measures of liquidity
This table displays the regression model SPREAD = B1 + B2*T1F0 + B3*T1F2 + B4*T2F0 + B5*T2F1 + B6*T2F2 + B7*T3F0 + B8*T3F1 + B9*T3F2 + B10*MMPRICE + B11*MSSIZE + B12*SDDRET. SPREAD is the dependent variable, it is represented by one of the seven commonly documented bid-ask spread measures of liquidity, including the quoted bid-ask spread (MMBAS), the quoted percentage bid-ask spread (MMPBAS), the time weighted quoted bid-ask spread (MTWBAS), the time weighted quoted percentage bid-ask spread (MTWPBAS), the effective quoted bid-ask spread (MMEFFSPR), the effective quoted percentage bid-ask spread (MMEFFPSPR) and the realized bid-ask spread (MMREALBAS). Reported statistics below each regression coefficient include the corresponding standard error under Ordinary Least Squares (OLS) estimation, and below that, OLS with White’s corrected standard errors adjusted for heteroskedasticity (denoted as Adj Std Error).
MMBAS MMPBAS MTWBAS MTWPBAS MVSPR MVPSPR MMEFFSPR MMEFFPSPR MMREALBAS Regression model (i) (ii) (iii) (iv) (v) (vi) (vii) (viii) (ix)
Table 6 F-test for regression analysis of spread measures of liquidity
Reported are the F-tests for coefficients of interest with respect to float group testing for the regressions in Table 5. The intercept reference float group is T1F1. Test numbers 4, 8 and 12 considers if there is a cross sectional difference in the group mean (of the dependent variable) among all three float groups (high, medium and low).
MMBAS MMPBAS MTWBAS MTWPBAS MVSPR MVPSPR MMEFFSPR MMEFFPSPR MMREALBAS Regression model (i) (ii) (iii) (iv) (v) (vi) (vii) (viii) (ix)
Figure 1 Timeline of S&P 500 Free Float Implementation This figure shows a timeline of the original announcement of the S&P 500 switch to free float weighting along with the two implementation dates for a half float (March 18, 2005) and full float (September 16, 2005).
15 th October 2004
Unadjusted
18th March
2005Half float
16th September
2005Full float
1 st March 2004S&P Free float Announcement
Our responsibility is to provide strong academic programs that instill excellence,confidence and strong leadership skills in our graduates. Our aim is to (1)promote critical and independent thinking, (2) foster personal responsibility and(3) develop students whose performance and commitment mark them as leaderscontributing to the business community and society. The College will serve as acenter for business scholarship, creative research and outreach activities to thecitizens and institutions of the State of Rhode Island as well as the regional,national and international communities.
Mission
The creation of this working paper serieshas been funded by an endowmentestablished by William A. Orme, URICollege of Business Administration,Class of 1949 and former head of theGeneral Electric Foundation. This workingpaper series is intended to permit facultymembers to obtain feedback on researchactivities before the research is submitted toacademic and professional journals andprofessional associations for presentations.
An award is presented annually for the mostoutstanding paper submitted.
Founded in 1892, the University of Rhode Island is one of eight land, urban, and sea grantuniversities in the United States. The 1,200-acre rural campus is lessthan ten miles from Narragansett Bay and highlights its traditions ofnatural resource, marine and urban related research. There are over14,000 undergraduate and graduate students enrolled in seven degree-granting colleges representing 48 states and the District of Columbia.More than 500 international students represent 59 different countries.Eighteen percent of the freshman class graduated in the top ten percentof their high school classes. The teaching and research faculty numbersover 600 and the University offers 101 undergraduate programs and 86advanced degree programs. URI students have received Rhodes,
Fulbright, Truman, Goldwater, and Udall scholarships. There are over 80,000 active alumnae.
The University of Rhode Island started to offer undergraduate businessadministration courses in 1923. In 1962, the MBA program was introduced and the PhDprogram began in the mid 1980s. The College of Business Administration is accredited byThe AACSB International - The Association to Advance Collegiate Schools of Business in1969. The College of Business enrolls over 1400 undergraduate students and more than 300graduate students.