#2016-063 The effect of improved storage innovations on food security and welfare in Ethiopia Wondimagegn Tesfaye and Nyasha Tirivayi Maastricht Economic and social Research institute on Innovation and Technology (UNU‐MERIT) email: [email protected]| website: http://www.merit.unu.edu Maastricht Graduate School of Governance (MGSoG) email: info‐[email protected]| website: http://www.maastrichtuniversity.nl/governance Boschstraat 24, 6211 AX Maastricht, The Netherlands Tel: (31) (43) 388 44 00 Working Paper Series
Transcript
#2016-063
The effect of improved storage innovations on food security and welfare in Ethiopia Wondimagegn Tesfaye and Nyasha Tirivayi
Maastricht Economic and social Research institute on Innovation and Technology (UNU‐MERIT) email: [email protected] | website: http://www.merit.unu.edu Maastricht Graduate School of Governance (MGSoG) email: info‐[email protected] | website: http://www.maastrichtuniversity.nl/governance Boschstraat 24, 6211 AX Maastricht, The Netherlands Tel: (31) (43) 388 44 00
Working Paper Series
UNU-MERIT Working Papers ISSN 1871-9872
Maastricht Economic and social Research Institute on Innovation and Technology UNU-MERIT Maastricht Graduate School of Governance MGSoG
UNU-MERIT Working Papers intend to disseminate preliminary results of research carried out at UNU-MERIT and MGSoG to stimulate discussion on the issues raised.
1
The Effect of Improved Storage Innovations on Food Security and Welfare in Ethiopia
Wondimagegn Tesfaye* and Nyasha Tirivayi†
United Nations University – Maastricht Economic and Social Research Institute on Innovation and Technology (UNU-MERIT)
November 2016
Abstract
Postharvest loss exacerbates the food insecurity and welfare loss of farming households in
developing countries. This paper analyses the effect of improved storage, a climate-smart crop
management technology, on household food and nutrition security, market participation and
welfare using nationally representative data from Ethiopia. Endogenous switching regression
models are employed to control for selection bias and unobserved heterogeneity. The results
show that improved storage use is mainly associated with climatic factors, access to extension
service, liquidity constraints, infrastructure and market access. Improved storage significantly
increases the dietary diversity, reduces child malnutrition and negative changes in diet. In
addition, use of improved storage technologies increases farmers’ participation in output markets
as sellers, the proportion of harvest sold and their marketing flexibility by altering the choice of
market outlets. Further, the paper provides evidence that households that did not use improved
storage would have benefited significantly had they decided to adopt. Overall, the study suggests
that improved storage technologies are effective tools for risk coping and enhancing food
security and would play a key role in the current debate of feeding a growing population in the
After estimating the model’s parameters, the conditional expectations or expected outcomes are
computed as follows.
For improved storage users who actually adopted:
| , / (10)
For improved storage non-users had they decided to use improved storage (counterfactual):
| , / (11)
For improved storage users had they decided not to use improved storage (counterfactual):
| , / (12)
For improved storage non-users who actually did not adopt:
| , / (13)
3 is the variance of the error term in the selection equation and and are variances of the error terms in the continuous equations. The covariances are given as non-diagonal values. The variance of the error term in the selection equation can be assumed to be 1 ( is estimable only up to a scalar factor). In the covariance matrix, the dot (.) indicates that the two outcomes cannot be observed simultaneously for a particular household (Lokshin and Sajaia, 2011).
9
Following Heckman et al. (2001) and Di Falco et al. (2011), the treatment effect on the treated
(TT) is computed as the difference between expected outcome for farm households that adopted
improved storage (eq. 10) and the counterfactual hypothetical cases that they did not use (eq. 12).
The treatment effect on the untreated (TU) is computed as the difference between the outcome
they would have obtained in the counterfactual scenario that they decided to use (eq. 13) and the
expected outcome for farm households who did not use improved storage (eq. 11). The
conditional expectation equations are also used to calculate heterogeneous effects (Di Falco et al.,
2011; Carter & Milon, 2005). Households that use improved storage innovations may have better
food security or other outcomes than the households that did not use regardless of the fact that
they decided to use, but because of unobservable characteristics such as skills and knowledge i.e.
the effect of base heterogeneity (Carter & Milon, 2005). The computation of the effect of base
heterogeneity for households that decided to use ( ) and for the household who did not use
improved storage ( ) is indicated in Table 1. Another important statistic is transitional
heterogeneity (TH) which measures whether the effect of the improved storage technologies use
is larger or smaller for households that adopted or for households that did not, in the
counterfactual case that they did use (Di Falco et al., 2011).
Table 1. Conditional expectations, treatment, and heterogeneous effect
Subsamples Decision stage Treatment effects
To use Not to use
User households (a) | 1 (b) | 1 TT
Non-user households (c) | 0 (d) | 0 TU
Heterogeneous effects TH
Note:
(a) TT: the effect of the treatment (use of improved storage) on the treated (user households)
(b) TU: the effect of the treatment on the untreated (non-user households)
(c) = the effect of base heterogeneity for households that used (S=1) and did not use (S=0)
(d) TH = TT – TU is the transitional heterogeneity
2.2.2. Endogenous switching probit model
We are also interested in estimating the impact of improved storage innovations on various
binary outcome measures of food security and marketing performance. Unlike for continuous
outcome variables, accounting for sample selection and endogenous switching for binary
outcomes where the data is fit using non-linear models is challenging (Heckman, 1978, 1986;
10
Miranda & Rabe-Hesketh, 2006). Hence, estimations using two-stage procedures (such as
Heckman’s sample selection model) would lead to wrong conclusions and produce inconsistent
results. Consequently, we utilise the endogenous switching probit framework which is analogous
to the endogenous switching regression for the continuous outcomes (Lokshin & Glinskaya,
2009; Lokshin & Sajaia, 2011; Miranda & Rabe-Hesketh, 2006).
Let the decision to use improved storage be represented by the following latent response model:
∗ (14)
, ∗ 0,
(15)
Where ∗ represent a continuous latent variable, is a parameter to be estimated and is an
error term. The binary response is also defined as follows:
∗ (16)
, ∗ 0,
(17)
Where is the main outcome variable and ∗ represents a continuous latent variable,
represents a vector of parameters to be estimated, is the coefficient of the endogenous
treatment dummy, and is a residual term.
The endogenous switching problem, in this case, is that the response for the household is
not always observed. Besides, is assumed to depend on the endogenous dummy and a
vector of explanatory variables, . The endogenous dummy also depends on a vector of
explanatory variables, . There is a possibility that vectors and share elements. A direct
estimation of equation 16 and interpreting as the casual effect would result in biased estimates
due to unobserved endogeneity. Endogenous switching probit regression would correct for this
bias by simultaneously estimating the selection and outcome equations with proper
instrumentation of the improved storage use decision (Aakvik et al., 2000; Lokshin & Sajaia,
2011). The endogenous switching probit framework models the decision to use improved storage
innovation and its effect on various binary outcomes in a two-stage treatment framework. In the
first stage, farm households’ decision to use improved storage is modeled and estimated using a
probit model. In the second stage, the relationship between the binary outcomes and improved
11
storage use along with a set of explanatory variables is determined using probit model with
selectivity correction.
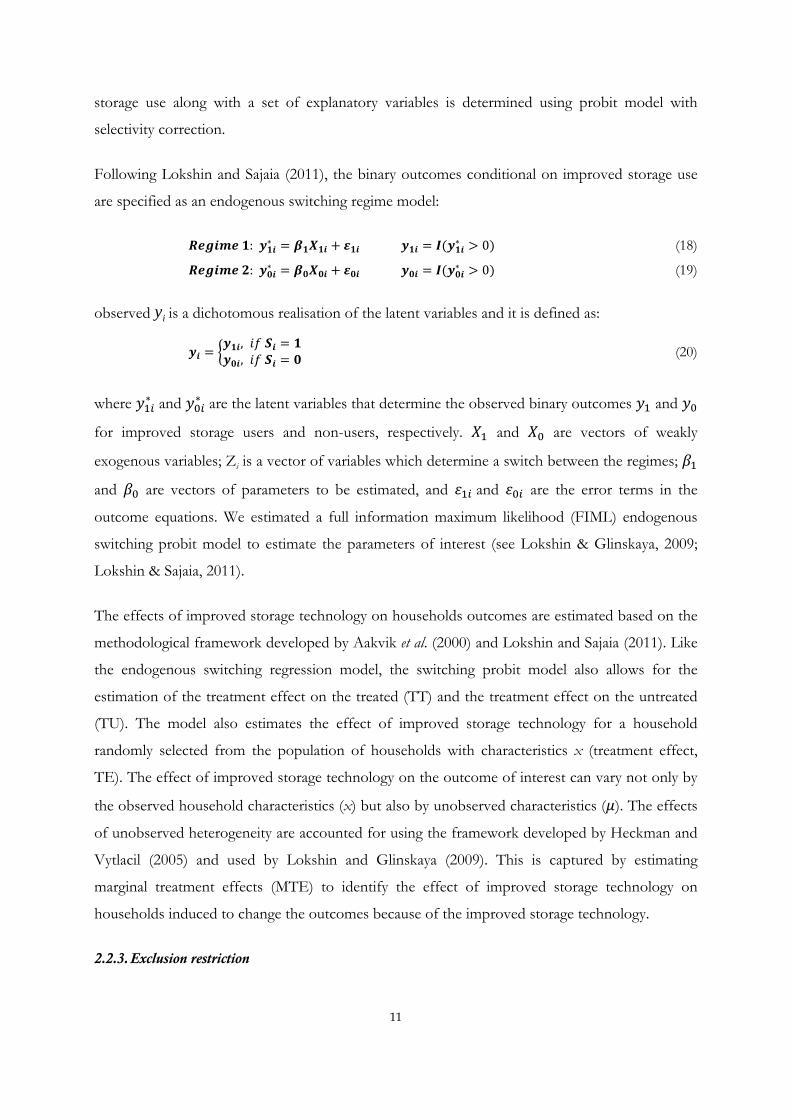
Following Lokshin and Sajaia (2011), the binary outcomes conditional on improved storage use
are specified as an endogenous switching regime model:
: ∗ ∗ 0 (18)
: ∗ ∗ 0 (19)
observed iy is a dichotomous realisation of the latent variables and it is defined as:
, , (20)
where ∗ and ∗ are the latent variables that determine the observed binary outcomes and
for improved storage users and non-users, respectively. and are vectors of weakly
exogenous variables; Zi is a vector of variables which determine a switch between the regimes;
and are vectors of parameters to be estimated, and and are the error terms in the
outcome equations. We estimated a full information maximum likelihood (FIML) endogenous
switching probit model to estimate the parameters of interest (see Lokshin & Glinskaya, 2009;
Lokshin & Sajaia, 2011).
The effects of improved storage technology on households outcomes are estimated based on the
methodological framework developed by Aakvik et al. (2000) and Lokshin and Sajaia (2011). Like
the endogenous switching regression model, the switching probit model also allows for the
estimation of the treatment effect on the treated (TT) and the treatment effect on the untreated
(TU). The model also estimates the effect of improved storage technology for a household
randomly selected from the population of households with characteristics x (treatment effect,
TE). The effect of improved storage technology on the outcome of interest can vary not only by
the observed household characteristics (x) but also by unobserved characteristics ( ). The effects
of unobserved heterogeneity are accounted for using the framework developed by Heckman and
Vytlacil (2005) and used by Lokshin and Glinskaya (2009). This is captured by estimating
marginal treatment effects (MTE) to identify the effect of improved storage technology on
households induced to change the outcomes because of the improved storage technology.
2.2.3. Exclusion restriction
12
An exclusion restriction is used for better identification of both the endogenous switching
regression and endogenous switching probit models. Selection of the exclusion restriction is
guided by economic theory and empirical studies. Studies by Di Falco et al. (2011), Shiferaw et al.
(2014) and Khonje et al. (2015) used information sources such as government extension, farmer-
to-farmer extension, radio information, market and climate information and distance to inputs as
exclusion restrictions. This paper uses the presence of an agricultural development or extension
agent in the village as an exclusion restriction based on two reasons. First, extension service is the
primary source of knowledge and information about new and improved technologies for farmers
especially when the cost of information and knowledge is prohibitive (e.g. Genius et al., 2014;
Krishnan & Patnam, 2014). In addition to its role in developing skills and knowledge of farmers
to adopt new and improved technologies, extension could play a vital role in the facilitation of
linkages with other institutional support services such as input supply, output marketing and
credit. Second, development or extension agents are usually assigned at the administrative level
and their assignment is less likely to be influenced by households’ behavior. Besides, the presence
of extension agent in the village or community is determined outside farmer’s improved storage
technology use decision (Kadjo et al., 2013).
A falsification test for admissibility of the exclusion restriction following Di Falco et al. (2011)
confirms that it is a possible selection instrument since the variable is significantly correlated with
improved storage use at less than 1% level, but not correlated with the outcomes for non-user
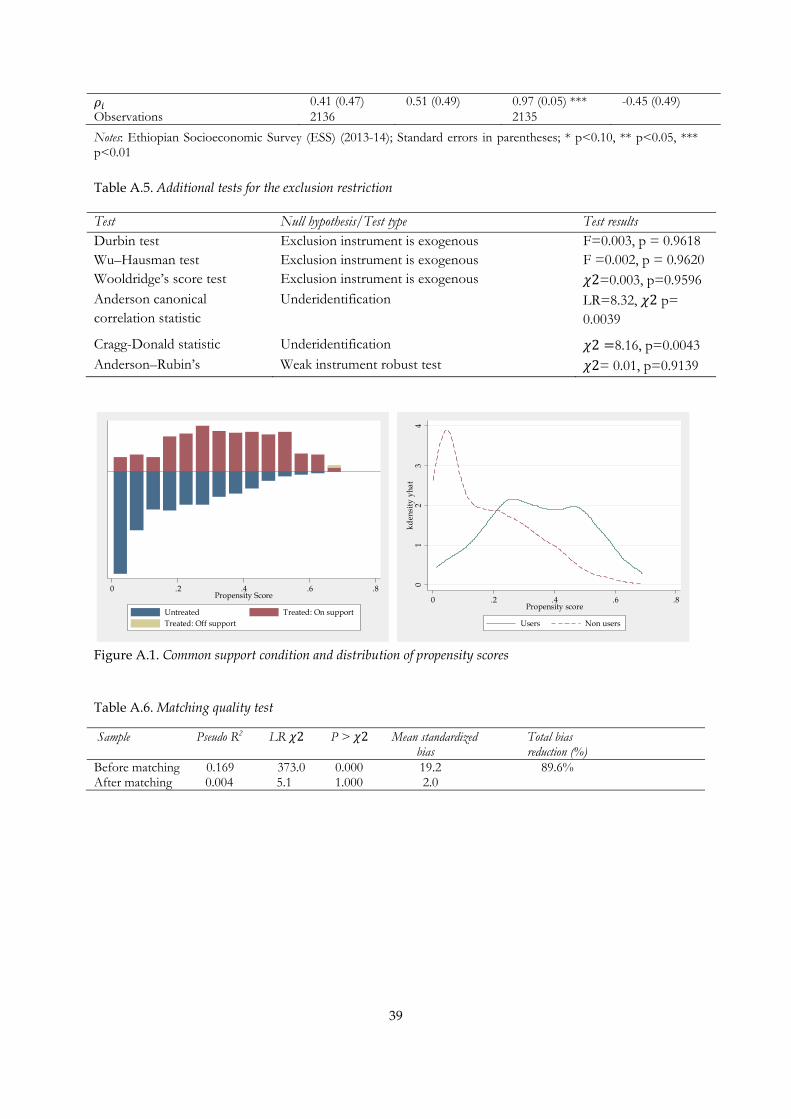
households. We did additional tests for the exclusion instrument (Appendix, Table A.5.). The
Durbin and Wu–Hausman (DWH) tests for exogeniety of the selection instrument are found to
be highly insignificant. Wooldridge’s (1995) score test of exogeneity which can tolerate
heteroskedastic errors also fails to reject the null hypothesis of exogeneity. We computed the
Anderson canonical correlation statistic (Baum et al., 2007) to test for identification of the model.
The test rejects the null hypothesis of underidentification of the model at less than 1% and
justifies that the excluded instrument is relevant. We further checked robustness of the results by
estimating the Cragg-Donald chi-square statistic which also rejects the null of weak identification
at less than 1% level of significance. Furthermore, we assessed the weak instrument robust
inference using the Anderson–Rubin’s test (Baum et al., 2007), which also confirmed the validity
of the selection instrument.
2.2.4. Matching and Inverse probability weighting Methods
13
We compared the endogenous switching regression model results with results from the matching
and inverse probability weighting estimates. Kernel-based matching is used for this paper. Kernel
matching is a non-parametric matching estimation that uses weighted averages of all individuals
in the control group to construct counterfactual outcome of a treated observation (Heckman et
al., 1998). It has the advantage of minimising the potential risk of bad matches that would arise
from the use of nearest neighbor matching methods (Caliendo & Kopeinig, 2008). Inverse
probability weighting (IPW) estimation is another method for adjusting for confounding when
using observational data (Curtis et al., 2007; Donald et al., 2014). Unlike matching techniques,
IPW assigns greater weights to control (comparison) groups with higher estimated probabilities
of selection into the treatment (Handouyahia et al., 2013). Another attractive feature of IPW is its
efficiency (minimum variance) within the class of semi-parametric estimators and matching
techniques including kernel and nearest neighbor matching (Hirano et al., 2003).
Various diagnostics were undertaken to check the quality of the matching. A visual inspection of
the density distribution of the propensity scores and the overlap in the distribution of the
propensity scores (figure A.1) indicates that the common support condition is satisfied.
Diagnostic tests also show a fairly low pseudo R2, high total bias reduction and insignificant p-
values of the LR test after matching (Appendix, Table A.6), which provides evidence that the
proposed specification is successful in terms of balancing the distribution of the covariates
between the treatment and control groups. Estimates from the propensity score matching are
sensitive to hidden bias or unobserved factors. The thresholds at which the estimates are
sensitive to such bias are computed using the Rosenbaum bounds (rbounds) for continuous
outcomes and MH bounds (mhbounds) for binary outcomes (see Becker and Caliendo, 2007). The
results are summarised in the Appendix, Table A.7.
2.3. Data
The study used data from Ethiopian Socioeconomic Survey (ESS), a nationally representative
cross-sectional survey of rural households of Ethiopia in the 2013/14 year. The data is collected
under the Living Standards Measurement Study-Integrated Surveys on Agriculture Initiative
(LSMS-ISA) in collaboration with Central Statistical Authority (CSA). The data were collected in
three rounds of visits to the households. The first round was carried out in September and
October 2013 and collected information on post-planting agriculture activities. The second round
was conducted in November-December 2013 to complete the livestock questionnaire.
Information on post-harvest agriculture and household characteristics were collected during the
14
third round that took place from February-April 2014. The survey collected detail information on
demographics, health (including anthropometric measurement for children), food and non-food
consumption expenditure, food security, and shocks, safety nets, among others. It also captured
information on both post-planting and post-harvest activities, land holding, crop harvest, storage,
and utilisation. In addition to the household data, the survey solicited community level
information on access to services such as weekly markets, cooperatives, financial institutions,
irrigation scheme and presence of agricultural development or extension agent. The household
location is geo-referenced which enables linking the household data with geographic data sets
including climatic variables (rainfall and temperature) and geographic characteristics such as
distance to main markets, nearest road, and population centers. After excluding observations with
no information on crop storage and storage methods, the analysis here is based on a sample of
2514 rural households.
2.4. Variables
2.4.1. Outcome variables
This paper utilises both objective and subjective measures of food security. This addresses
limitations of previous studies which used a single measure without aligning different measures of
food security with the food security dimensions (Coates, 2013; Maxwell et al., 2014). The
measures of food security and nutrition used include whether the household worries that there
would be no enough food for the household and the coping strategies employed to secure
sufficient food, the diversity of household diets, percapita food consumption expenditure and
anthropometric measurements of child nutritional status (Anderman et al., 2014). We used real
percapita consumption expenditure as an indicator of welfare (Deaton, 2003; Moratti & Natali,
2012). Other studies have also used the same indicator for welfare (e.g. Asfaw et al., 2012;
Khonje et al., 2015; Mmbando et al., 2015).
The household dietary diversity (HDD) score is an attractive proxy indicator for food security
and the socioeconomic ability of a household as it is highly correlated with caloric, protein and
nutrient adequacy, household income and child nutritional status (Hoddinott & Yohannes, 2002;
Swindale & Bilinsky, 2006; Webb et al., 2006). The household food insecurity and access scale
(HFIAS) and coping strategies are other indicators used in this study to capture household
behaviors regarding anxiety and uncertainty over household insecure access or food supply
(Coates, 2013; Cordeiro et al., 2012; Maxwell et al., 2014; Swindale & Bilinsky, 2006). Closely
following the existing literature (Coates et al., 2006; Maxwell et al., 2008), we combine the
15
individual coping strategies to construct two indicators of food security: negative change in diet
and reduced food intake. Negative changes in diet include strategies where the household have to
rely on less preferred food or limit the variety of foods eaten which corresponds to dietary
change. Dietary changes are easily reversible without jeopardising long-term prospects of the
households. Reduced food intake is very similar to food rationing and constructed from strategies
such as limiting the number of meals taken per day as well as the portion size, restricting
consumption of adults so that children can eat, borrowing food or relying on external help from
others, and have no food or any kind, or going an entire day and night without eating anything.
The nutritional status of under-5 children is measured using anthropometric measures. We used
stunting and wasting as indicators of child malnutrition. Stunting is preferred as it is the most
important long term indicator of child nutritional status and wasting is a short term indicator of
acute malnutrition (WHO, 1995; Manda et al., 2016; Slavchevska, 2015). Two indices, height-for-
age (HAZ) and weight-for-height (WHZ) were constructed and recorded as a z-score, which
describes the number of standard deviations by which the child’s anthropometric measurement
deviates from the median in the 2006 WHO child growth standard. The z-score cut-off point
between -3 and -2 classify low height-for-age and low weight-for-height as moderate stunting and
wasting suggesting moderate undernutrition, and a z-score of less than -3 defines severe stunting
or wasting which shows severe undernutrition (WHO, 1997).
The study also looks at households’ market participation, the proportion of harvest sold to
market and choice of market outlet. Integrating smallholders to markets is touted to be one of
the mechanisms through which agriculture plays an enormous role in reducing rural households’
vulnerability to food insecurity and market shocks (Barrett, 2008; Baiphethi & Jacobs, 2009). At
the micro level, it also has a positive impact on food security (Seng, 2016), household welfare and
livelihoods (Asfaw et al., 2012; Olwande et al., 2015). While household commonly stores crops
for consumption, improved storage might enable households to store crops for markets. Hence,
analysing the relationship between improved storage innovations and households’ market
participation would be of policy relevance. Market participation is defined as a binary outcome
taking the value of 1 if the household sales any of its harvest and 0 otherwise. The proportion of
harvest sold indicates the level of market participation. Choice of market outlet is an indicator for
marketing flexibility which measures whether the household sells any of its harvest in local
(village) markets or main markets. Food storage as a physical capital would affect farm
households’ market participation along with other factors such as market and production shocks,
16
market imperfections (Rao & Qaim, 2011), access to irrigation, infrastructure and proximity to
Note: Ethiopian Socioeconomic Survey (ESS) (2013-14); ATT – Average Treatment Effect on the Treated, ATU – Average Treatment Effect on the Untreated, ATE – Average Treatment Effects; Standard errors in parentheses; * p<0.10, ** p<0.05, *** p<0.01 The results from the endogenous switching regression based treatment effects show that
improved storage has a positive and significant impact on dietary diversity score. The expected
dietary diversity score for the households that used improved storage technologies is 5.92 while it
is 5.65 for those who did not use. In the counterfactual case, households who used the
technology would have obtained a dietary diversity score of 5.67 had they decided not to use.
Hence, improved storage use had increased the dietary diversity score by 0.25 points for users. In
the counterfactual case, households that did not adopt improved crop storage technologies would
have increased the dietary diversity score by about 2.0 had they adopted. The positive effect on
dietary diversity is expected since improved storage technologies would help households increase
their food crops storage through relaxing risk-aversion to postharvest loss and encouraging
farmer’s production of diverse crops (Oluwatoba et al., 2016). The results are in agreement with
20
other studies that report positive link between improved storage and food security (Gitonga et al.,
2013; Snapp & Fisher, 2015). Improved storage is not found to have a significant effect on
percapita food consumption expenditure and real percapita consumption expenditure for users.
However, non-users would have had higher percapita consumption expenditure (14%) had they
decided to use improved storage. Our study finds no significant impact of improved storage on
household welfare. Cunguara and Darnhofer (2011) also reported insignificant impact of
improved granaries on household income in Mozambique. Improved storage is found to increase
the proportion of harvest sold to markets by 0.70 than the counterfactual scenario of not using
improved storage. Non-user households would have increased the proportion of harvest sold by
3.95 had they decided to use improved storage.
The negative base heterogeneity effect for almost all outcomes implies that improved storage
user households have lower food security, welfare and market performance not possibly due to
their decision to use improved storage, but possibly due to unobservables. Adjusting for the
potential heterogeneity in the sample, there is evidence that households who decided to use
improved crop storage technologies tend to have benefits lower than the average irrespective of
adoption, but they are better off adopting than not adopting (Di Falco et al., 2011). The negative
transitional heterogeneity effect also indicates that the effect is higher for improved storage non-
user households had they decided to use.
Coefficients of the key explanatory variables in the endogenous switching regression model
return important information (Table A.3). The difference in the coefficients of the explanatory
variables in the outcome equations of improved storage user and non-user households illustrates
the presence of heterogeneity in the sample (Di Falco et al., 2011). Overall, the observed
household demographic characteristics are important determinants of the outcomes for both
improved storage user and non-user households. Some of these explanatory variables have a
heterogeneous effect on the outcomes for the improved storage user and non-user households.
For improved storage non-user households, dietary diversity score increases when the head is
male but decreases with the age of the head. However, gender and age of the household head are
not correlated to food security status of improved storage user households. Consistent with the
theory, household heads with less than primary education record lower dietary diversity and
welfare. While enjoying a primary education is positively correlated with dietary diversity score
for improved storage user households, it deemed inadequate to positively affect dietary diversity
score for non-user households. Livestock holding and mobile ownership are found to increase
21
food security regardless of improved storage use. However, farm size and asset holding are
positively correlated with dietary diversity score for non-user households.
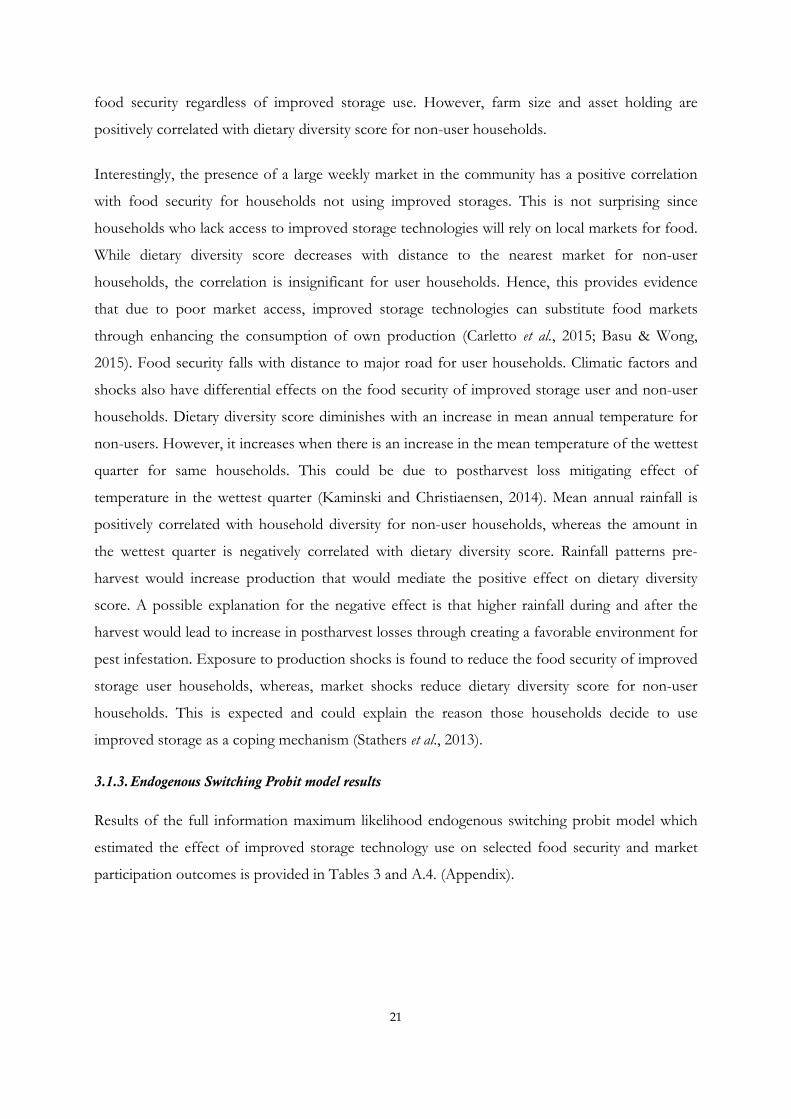
Interestingly, the presence of a large weekly market in the community has a positive correlation
with food security for households not using improved storages. This is not surprising since
households who lack access to improved storage technologies will rely on local markets for food.
While dietary diversity score decreases with distance to the nearest market for non-user
households, the correlation is insignificant for user households. Hence, this provides evidence
that due to poor market access, improved storage technologies can substitute food markets
through enhancing the consumption of own production (Carletto et al., 2015; Basu & Wong,
2015). Food security falls with distance to major road for user households. Climatic factors and
shocks also have differential effects on the food security of improved storage user and non-user
households. Dietary diversity score diminishes with an increase in mean annual temperature for
non-users. However, it increases when there is an increase in the mean temperature of the wettest
quarter for same households. This could be due to postharvest loss mitigating effect of
temperature in the wettest quarter (Kaminski and Christiaensen, 2014). Mean annual rainfall is
positively correlated with household diversity for non-user households, whereas the amount in
the wettest quarter is negatively correlated with dietary diversity score. Rainfall patterns pre-
harvest would increase production that would mediate the positive effect on dietary diversity
score. A possible explanation for the negative effect is that higher rainfall during and after the
harvest would lead to increase in postharvest losses through creating a favorable environment for
pest infestation. Exposure to production shocks is found to reduce the food security of improved
storage user households, whereas, market shocks reduce dietary diversity score for non-user
households. This is expected and could explain the reason those households decide to use
improved storage as a coping mechanism (Stathers et al., 2013).
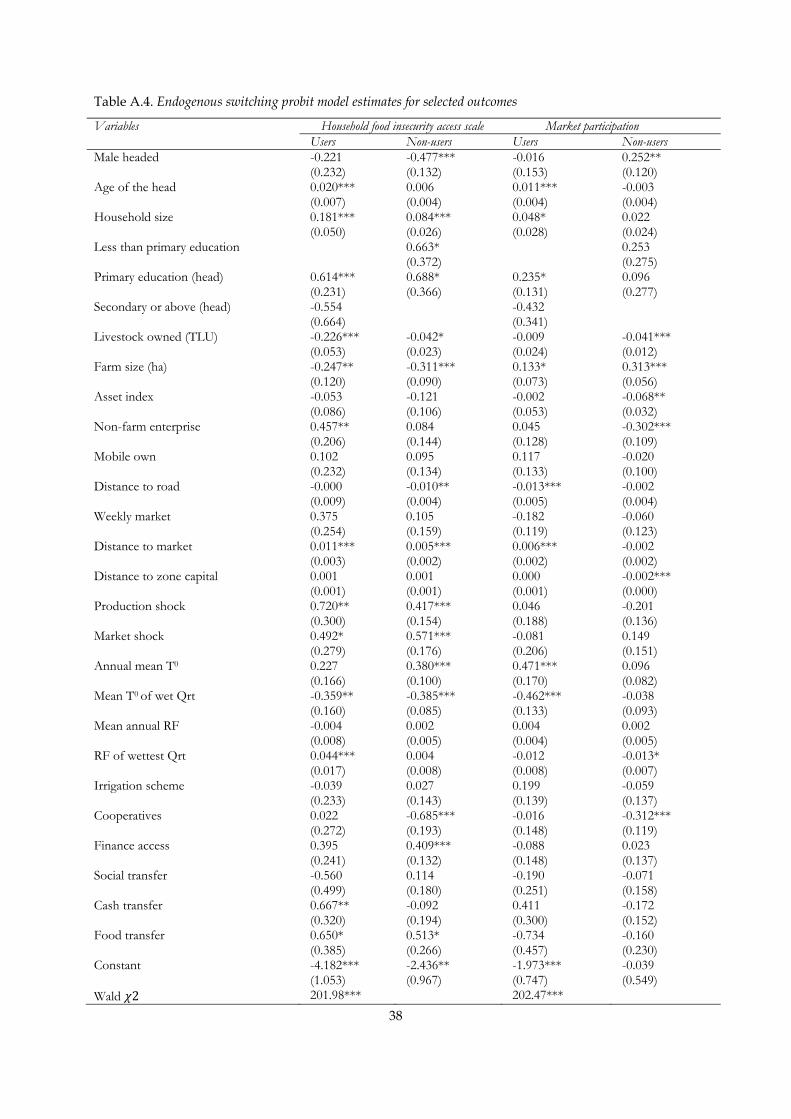
3.1.3. Endogenous Switching Probit model results
Results of the full information maximum likelihood endogenous switching probit model which
estimated the effect of improved storage technology use on selected food security and market
participation outcomes is provided in Tables 3 and A.4. (Appendix).
Sale in local markets 0.187 *** 0.552 *** 0.459 *** 0.546 ***
Sale in main markets -0.164 *** -0.291 *** -0.257 *** -0.281 ***
Note: Ethiopian Socioeconomic Survey (ESS) (2013-14); ATT – Average Treatment Effect on the Treated, ATU – Average Treatment Effect on the Untreated, ATE – Average Treatment Effect, and MTE – Marginal Treatment Effect; Bootstrapped standard errors; * p<0.10, ** p<0.05, *** p<0.01 Improved storage adoption has increased the probability of consuming minimum acceptable diet
i.e. a household dietary diversity score of 4 or more (Labadarios et al., 2011) by about 7
percentage points for user households than in the counterfactual scenario of non-use. Non-user
households would have increased the probability of meeting a minimum acceptable diet by about
6 percentage points had they adopted improved storage. Household using improved storage have
20.3 percentage points lower probability of food insecurity as measured by the household food
insecurity and access scale. These results corroborate the findings of Bokusheva et al. (2012) and
Gitonga et al. (2013). While improved storage reduced the likelihood of negative change in diet by
89.3 percentage points, it also increased reduced food intake (food rationing) by 12.6 percentage
points for improved storage user households. This might be since food rationing is not related
only to food availability but also household size and intrahousehold allocation of food. The result
also suggests that improved storage is not a sufficient instrument to cope with food insecurity.
The study further estimated the impact of improved storage on child nutritional status using
prevalence of stunting and wasting. Interestingly, improved storage reduces the prevalence of
under-5 stunting by about 33.3 percentage points compared to the counterfactual scenario of not
using improved storage technologies. The negative effect on children stunting is realised as
improved storage could increase the consumption of food from own production particularly
during market failures (Slavchevska, 2015). This provides evidence that improved storage reduces
the prevalence of malnutrition through ensuring food availability and increased access to food
23
during leans seasons when stocks are depleted and food prices are high (Vaitla et al., 2009). This is
consistent with the finding of Manda et al. (2016) who found improved maize varieties to reduce
the probability of stunting in Zambia, and Slavchevska (2015) who reported a positive link
between agricultural production and child nutritional status in Tanzania. Improved storage does
not have a significant impact on children wasting for user households. However, it would have
reduced children wasting by 7 percentage points for non-user households had they decided to use
improved storage.
Turning into the marketing performance impacts, improved storage adopters have about 35
percentage points higher probability of participation in markets as sellers compared with the
counterfactual scenario of households who do not use improved storage technologies. The
positive impact of improved storage on market participation as seller of crops and proportion of
harvest sold is consistent with our theoretical predictions. The positive impact on market
participation in general shows that improved storage encourages sale of crop through reducing
storage loss. Hence, users of improved storage would sale crops to meet their cash requirements
whenever prices are attractive (Park, 2006; Stephens & Barrett, 2011). The other channel through
which improved storage increase marketing performance is through its complementary with yield
enhancing technologies such as improved crop varieties (Mutenje et al., 2016; Ricker-Gilbert and
Jones, 2015). Further analysis of the estimates of the impact on market flexibility revealed that
improved storage use increases the probability to sell their crops in local markets by about 19
percentage points. However, it reduces the sale of crops in primary markets by about 16
percentage points. This could explain the role of improved storage in reducing households’
dependence on intermediaries and sale of crops in bulk in main markets. This is consistent with
existing studies which argue that improved storage users are more likely to participate in local or
village markets where they would get better prices and become less dependent on intermediaries
who are common in main markets (Xhoxhi et al., 2014; Bokusheva et al., 2012). Hence, improved
storage enable marketing flexibility through altering the location of sale which would enable
households to take advantage of seasonal and temporal price fluctuations (Bokusheva et al., 2012;
Florkowski & Xi-ling, 1990).
3.2. Comparing results across various estimation methods
Estimates from the endogenous switching regression models are compared with estimates
obtained using kernel-based matching and inverse probability weighting methods. Table 4
summarises the average treatment effects from the various techniques.
24
Table 4. Comparing results from alternative specifications: Average treatment effects (ATT)
self-reported food insecurity, and reducing child malnutrition. The positive effect of improved
storage on household dietary diversity score and the negative effect on under-5 child stunting
suggest that such innovations are not only climate-smart; they are also nutrition-smart. Third,
improved storage technologies positively affect the marketing performance of households by
increasing their participation in output markets as sellers, increasing the proportion of harvest
sold, and enabling market flexibility through influencing choice of market outlets. Fourth,
differences in household characteristics, institutional and climatic factors have heterogeneous
effects on food security, welfare and market participation among improved storage users and
non-users. From a policy intervention perspective, policy makers need to acknowledge the role of
various factors that hinder or favor the adoption of improved storage technologies and the
translation of benefits from technological change into food security and nutrition outcomes.
26
While promoting improved storage adoption provides a path for sustainable economic and social
development, the policy challenge would be how to make such innovations accessible and work
for the resource poor, food insecure and vulnerable.
Further research is recommended for investigating the local market economy, climate change
mitigation, and resource use efficiency effects of improved storage technologies. Examining the
complementarity or substitutability between household level storage technologies and larger scale
storage facilities would also be of policy relevance. Future research could also examine the
synergetic impacts of storage technologies and other production risk management practices such
as crop diversification on household level development outcomes.
27
5. References
Aakvik, A., Heckman, J. J., & Edward J. Vytlacil. (2000). Discrete Outcomes When Responses to Treatment Vary Among Observationally Identical Persons: An Application to Norwegian Vocational Rehabilitation (No. 262). Technical Working Papers.
Abass, A. B., Ndunguru, G., Mamiro, P., Alenkhe, B., Mlingi, N., & Bekunda, M. (2014). Post-harvest food losses in a maize-based farming system of semi-arid savannah area of Tanzania. Journal of Stored Products Research, 57, 49–57. http://doi.org/10.1016/j.jspr.2013.12.004
Adegbola, A., Bamishaiye, E. I., & Olayemi, F. (2011). Factors Affecting the Adoption of the Re-Usable Plastic Vegetable Crate in Three Local Government Areas of Kano State, Nigeria. Asian Journal of Agricultural Sciences, 3(4), 281–285.
Affognon, H., Mutungi, C., Sanginga, P., & Borgemeister, C. (2015). Unpacking Postharvest Losses in Sub-Saharan Africa: A Meta-Analysis. World Development, 66, 49–68. http://doi.org/10.1016/j.worlddev.2014.08.002
Alene, A. D., & Manyong, V. M. (2007). The effects of education on agricultural productivity under traditional and improved technology in northern Nigeria: An endogenous switching regression analysis. Empirical Economics, 32(1), 141–159. http://doi.org/10.1007/s00181-006-0076-3
Anderman, T. L., Remans, R., Wood, S. A., DeRosa, K., & DeFries, R. S. (2014). Synergies and tradeoffs between cash crop production and food security: A case study in rural Ghana. Food Security, 6(4), 541–554. http://doi.org/10.1007/s12571-014-0360-6
Asfaw, S., Shiferaw, B., Simtowe, F., & Lipper, L. (2012). Impact of modern agricultural technologies on smallholder welfare: Evidence from Tanzania and Ethiopia. Food Policy, 37(3), 283–295. http://doi.org/10.1016/j.foodpol.2012.02.013
Baiphethi, M. N., & Jacobs, P. T. (2009). The contribution of subsistence farming to food security in South Africa. Agrekon, 48(4), 459–482. http://doi.org/10.1080/03031853.2009.9523836
Barrett, C. B. (2008). Smallholder market participation: Concepts and evidence from eastern and southern Africa. Food Policy, 33(4), 299–317. http://doi.org/10.1016/j.foodpol.2007.10.005
Basu, K., & Wong, M. (2015). Evaluating seasonal food storage and credit programs in east Indonesia. Journal of Development Economics, 115, 200–216. http://doi.org/10.1016/j.jdeveco.2015.02.001
Baum, C. F., Schaffe, M. E., & Schaffe, M. E. (2007). Enhanced routines for instrumental variables/generalized method of moments estimation and testing. The Stata Journal, 7(4), 465–506. http://doi.org/The Stata Journal
Becker, S. O., & Caliendo, M. (2007). Sensitivity analysis for average treatment effect. The Stata Journal, 7(1), 71–83. http://doi.org/The Stata Journal
Besley, T., & Case, A. (2000). Unnatural Experiments? Estimating the Incidence of Endogenous Policies. The Economic Journal, 110(467), F672–F694. http://doi.org/http://www.blackwellpublishing.com/journal.asp?ref=0013-0133
Bezu, S., Kassie, G. T., Shiferaw, B., & Ricker-Gilbert, J. (2014). Impact of Improved Maize Adoption on Welfare of Farm Households in Malawi: A Panel Data Analysis. World Development, 59, 120–131. http://doi.org/10.1016/j.worlddev.2014.01.023
Bokusheva, R., Finger, R., Fischler, M., Berlin, R., Marín, Y., Pérez, F., & Paiz, F. (2012). Factors
28
determining the adoption and impact of a postharvest storage technology. Food Security, 4, 279–293. http://doi.org/10.1007/s12571-012-0184-1
Caliendo, M., & Kopeinig, S. (2008). Some practical guidance for the implementation of propensity score matching. Journal of Economic Surveys, 22(1), 31–72. http://doi.org/10.1111/j.1467-6419.2007.00527.x
Carletto, G., Ruel, M., Winters, P., & Zezza, A. (2015). Farm-Level Pathways to Improved Nutritional Status: Introduction to the Special Issue. Journal of Development Studies, 51(8), 945–957. http://doi.org/10.1080/00220388.2015.1018908
Carter, D. W., & Milon, J. W. (2005). Price Knowledge in Household Demand for Utility Services. Land Economics, 81(2), 265–283. http://doi.org/10.3368/le.81.2.265
Clougherty, J., & Duso, T. (2015). Correcting for Self-selection Based Endogeneity in Management Research: A Review and Empirical Demonstration (No. 1465). Deutsches Institut für Wirtschaftsforschung. Retrieved from http://orm.sagepub.com/content/early/2015/12/11/1094428115619013?papetoc
Coates, J. (2013). Build it back better: Deconstructing food security for improved measurement and action. Global Food Security, 2(3), 188–194. http://doi.org/10.1016/j.gfs.2013.05.002
Coates, J., Frongillo, E. a, Rogers, B. L., Webb, P., Wilde, P. E., & Houser, R. (2006). Commonalities in the experience of household food insecurity across cultures: what are measures missing? Journal of Nutrition, 136(5), 1438S–1448S.
Conteh, A. M. H., Yan, X., & Moiwo, J. P. (2015). The determinants of grain storage technology adoption in Sierra Leone. Cah Agric, 24(1), 47–55. http://doi.org/10.1684/agr.2013.0663
Cordeiro, L. S., Wilde, P. E., Semu, H., & Levinson, F. J. (2012). Household Food Security Is Inversely Associated with Undernutrition among Adolescents from Kilosa, Tanzania. The Journal of Nutrition, 142, 1741–1747. http://doi.org/10.3945/jn.111.155994.disease
Coromaldi, M., Pallante, G., & Savastano, S. (2015). Adoption of modern varieties, farmers’ welfare and crop biodiversity: Evidence from Uganda. Ecological Economics, 119, 346–358. http://doi.org/10.1016/j.ecolecon.2015.09.004
Cunguara, B., & Darnhofer, I. (2011). Assessing the impact of improved agricultural technologies on household income in rural Mozambique. Food Policy, 36(3), 378–390. http://doi.org/10.1016/j.foodpol.2011.03.002
Curtis, L. H., Hammill, B. G., Eisenstein, E. L., Kramer, J. M., & Anstrom, K. J. (2007). Using inverse probability-weighted estimators in comparative effectiveness analyses with observational databases. Medical Care, 45(10), S103–S107. http://doi.org/10.1097/MLR.0b013e31806518ac
De Janvry, A., Dustan, A., & Sadoulet, E. (2010). Recent advances in impact analysis methods for ex-post impact assessments of agricultural technology: Options for the CGIAR. Unpublished Working Paper, University of California-Berkeley, (September).
Deaton, A. (2003). Household Surveys, Consumption, and the Measurement of Poverty. Economic Systems Research, 15(2), 135–159. http://doi.org/10.1080/0953531032000091144
Dethier, J., & Effenberger, A. (2012). Agriculture and development: A brief review of the literature. Economic Systems, 36(2), 175–205. http://doi.org/10.1016/j.ecosys.2011.09.003
Di Falco, S., Veronesi, M., & Yesuf, M. (2011). Does Adaptation to Climate Change Provide Food Security? A Micro-Perspective from Ethiopia. American Journal of Agricultural Economics, 93(3), 829–846. http://doi.org/10.1093/ajae/aar006
29
Donald, S. G., Hsu, Y. C., & Lieli, R. P. (2014). Inverse probability weighted estimation of local average treatment effects: A higher order MSE expansion. Statistics and Probability Letters, 95, 132–138. http://doi.org/10.1016/j.spl.2014.08.015
FAO. (2011). Global food losses and food waste. Extent, Causes and Prevention. Food and Agriculture Organisation.
FAO. (2012). SAVE FOOD: Global Initiative on Food Loss and Waste Reduction. Retrieved from http://www.fao.org/save-food/en/
Florkowski, W. J., & Xi-ling, W. (1990). Simulating Impact of Pecan Storage Technology on Farm Price and Growers’ Income. Southern Journal of Agricultural Economics, (December).
Foster, A. D., & Rosenzweig, M. R. (2010). Microeconomics of Technology Adoption. Annual Review of Economics, 2(1), 395–424. http://doi.org/10.1146/annurev.economics.102308.124433
Fuglie, K. O., & Bosch, D. J. (1995). Economic and Environmental Implications of Soil Nitrogen Testing: A Switching-Regression Analysis. American Journal of Agricultural Economics, 77(November), 891–900.
Genius, M., Koundouri, P., Nauges, C., & Tzouvelekas, V. (2014). Information transmission in irrigation technology adoption and diffusion: Social learning, extension services, and spatial effects. American Journal of Agricultural Economics, 96(1), 328–344. http://doi.org/10.1093/ajae/aat054
Gitonga, Z. M., De Groote, H., Kassie, M., & Tefera, T. (2013). Impact of metal silos on households’ maize storage, storage losses and food security: An application of a propensity score matching. Food Policy, 43, 44–55. http://doi.org/10.1016/j.foodpol.2013.08.005
Handouyahia, A., Haddad, T., & Eaton, F. (2013). Kernel matching versus inverse probability weighting: a comparative study. International Journal of Mathematical, Computational, Physical, Electrical and Computer Engineering, 7(8), 16–31.
Heckman, J. J. (1978). Dummy endogenous variables in a simultaneous equation system. Econometrica, 46, 931–959.
Heckman, J. J. (1986). Sample Selection Bias as a Specification Error. Econometrica, 47(1), 153–161.
Heckman, J. J., Ichimura, H., & Todd, P. (1998). Matching as an Econometric Evaluation Estimator. Review of Economic Studies, 65(2), 261–294. http://doi.org/10.1111/1467-937X.00044
Heckman, J. J., Ichimura, H., & Todd, P. E. (1997). Matching as an econometric evaluation estimator. Review of Economic Studies, 64, 605–654. http://doi.org/10.1111/1467-937X.00044
Heckman, J., Tobias, J., & Vytlacil, E. (2001). Four Parameters of Interest in the Evaluation of Social Programs. Southern Economic Journal, 68(2), 210–223.
Heckman, J., & Vytlacil, E. (2005). Structural equations, treatment effects, and econometric policy evaluation. Econometrica, 73 (3), 669-738.
Hirano K., Imbens G. W., & Ridder, G. (2003). Efficient Estimation of Average Treatment Effects Using the Estimated Propensity Score. Econometrica, 71(4), 1161–1189. http://doi.org/10.1111/1468-0262.00442
Hoddinott, J., & Yohannes, Y. (2002). Dietary diversity as a food security indicator (No. 136). Food Consumption and Nutrition Division. Retrieved from http://www.ifpri.org/sites/default/files/publications/fcndp136.pdf
30
Hodges, R. J., Buzby, J. C., Bennett, & B. (2011). Postharvest losses and waste in developed and less developed countries: opportunities to improve resource use. The Journal of Agricultural Science, 149(S1), 37–45. http://doi.org/10.1017/S0021859610000936
Juma, C., Tabo, R., Wilson, K., & Conway, G. (2013). Innovation for Sustainable Intensification in Africa. Montpellier Panel Briefing.
Kadjo, D., Ricker-Gilbert, J., Alexande, C., & Tahirou, A. (2013). Effects of Storage Losses and Grain Management Practices on Storage: Evidence from Maize Production in Benin. In Agricultural & Applied Economics Association’s 2013 AAEA & CAES Joint Annual Meeting (pp. 1–37). Washington, D.C. http://doi.org/10.1017/CBO9781107415324.004
Kaminski, J., & Christiaensen, L. (2014). Post-harvest loss in sub-Saharan Africa-what do farmers say? Global Food Security, 3(3–4), 149–158. http://doi.org/10.1016/j.gfs.2014.10.002
Khonje, M., Manda, J., Alene, A. D., & Kassie, M. (2015). Analysis of Adoption and Impacts of Improved Maize Varieties in Eastern Zambia. World Development, 66, 695 706. http://doi.org/10.1016/j.worlddev.2014.09.008
Krishnan, P., & Patnam, M. (2014). Neighbors and extension agents in ethiopia: Who matters more for technology adoption? American Journal of Agricultural Economics, 96(1), 308–327. http://doi.org/10.1093/ajae/aat017
Kummu, M., de Moel, H., Porkka, M., Siebert, S., Varis, O., & Ward, P. J. (2012). Lost food, wasted resources: Global food supply chain losses and their impacts on freshwater, cropland, and fertiliser use. Science of the Total Environment. http://doi.org/10.1016/j.scitotenv.2012.08.092
Labadarios, D., Steyn, N. P., & Nel, J. (2011). How diverse is the diet of adult South Africans? Nutrition Journal, 10(1), 33. http://doi.org/10.1186/1475-2891-10-33
Lee, L., & Trost, R. P. (1978). Estimation of some limited dependent variable models with application to housing demand. Journal of Econometrics, 8(3), 357–382. http://doi.org/Doi: 10.1016/0304-4076(78)90052-0
Lipinski, B., Hanson, C., Lomax, J., Kitinoja, L., Waite, R., & Searchinger, T. (2013). Reducing Food Loss and Waste (No. Installment 2 of “Creating a Sustainable Food Future”). Washington, DC.
Lokshin, M., & Glinskaya, E. (2009). The effect of male migration on employment patterns of women in Nepal. World Bank Economic Review, 23(3), 481–507. http://doi.org/10.1093/wber/lhp011
Lokshin, M., & Sajaia, Z. (2004). Maximum likelihood estimation of endogenous switching regression models. The Stata Journal, 4(3), 282–289. http://doi.org/The Stata Journal
Lokshin, M., & Sajaia, Z. (2011). Impact of interventions on discrete outcomes: Maximum likelihood estimation of the binary choice models with binary endogenous regressors. The Stata Journal, 11(3), 368–385. http://doi.org/The Stata Journal
Lybbert, T. J., & Sumner, D. A. (2012). Agricultural technologies for climate change in developing countries: Policy options for innovation and technology diffusion. Food Policy, 37(1), 114–123. http://doi.org/10.1016/j.foodpol.2011.11.001
Malikov, E., & Kumbhakar, S. C. (2014). A generalized panel data switching regression model. Economics Letters, 124(3), 353–357. http://doi.org/10.1016/j.econlet.2014.06.022
Manda, J., Gardebroek, C., Khonje, M. G., Alene, A. D., Mutenje, M., & Kassie, M. (2016). Determinants of child nutritional status in the eastern province of Zambia: the role of
Mantel, N., & Haenszel, W. (1959). Statistical Aspects of the Analysis of Data from Retrospective Studies of Disease. Journal of the National Cancer Institute. http://doi.org/10.1111/j.1467-9280.2007.01882.x
Maxwell, D., Caldwell, R., & Langworthy, M. (2008). Measuring food insecurity: Can an indicator based on localized coping behaviors be used to compare across contexts? Food Policy, 33(6), 533–540. http://doi.org/10.1016/j.foodpol.2008.02.004
Maxwell, D., Coates, J., & Vaitla, B. (2013). How Do Different Indicators of Household Food Security Compare ? Empirical Evidence from Tigray. Feinstein International Center. Medford, USA.
Maxwell, D., Vaitla, B., & Coates, J. (2014). How do indicators of household food insecurity measure up? An empirical comparison from Ethiopia. Food Policy, 47(August), 107–116. http://doi.org/10.1016/j.foodpol.2014.04.003
Miranda, A., & Rabe-Hesketh, S. (2006). Maximum likelihood estimation of endogenous switching and sample selection models for binary, ordinal and count variables. The Stata Journal, 6(3), 285–308. http://doi.org/The Stata Journal
Mmbando, F. E., Wale, E. Z., & Baiyegunhi, L. J. S. (2015). Welfare impacts of smallholder farmers’ participation in maize and pigeonpea markets in Tanzania. Food Security, 7(6), 1211–1224. http://doi.org/10.1007/s12571-015-0519-9
Moratti, M., & Natali, L. (2012). Measuring Household Welfare Short versus long consumption modules Marta (No. 4). Florence.
Mutenje, M., Kankwamba, H., Mangisonib, J., & Kassie, M. (2016). Agricultural innovations and food security in Malawi: Gender dynamics, institutions and market implications. Technological Forecasting and Social Change, 103, 240–248. http://doi.org/10.1016/j.techfore.2015.10.004
Oluwatoba J. Omotilewa, Ricker-Gilbert, J., Shively, G., & Ainembabazi, H. (2016). The Effects of Risk Perceptions and Liquidity Constraints on the Storage Decisions of Maize and Legume Producers in Uganda. Selected Paper Prepared for Presentation for the 2016 Agricultural & Applied Economics Association, Boston, MA, July 31-August 2.
Olwande, J., Smale, M., Mathenge, M. K., Place, F., & Mithofer, D. (2015). Agricultural marketing by smallholders in Kenya: A comparison of maize, kale and dairy. Food Policy, 52, 22–32. http://doi.org/10.1016/j.foodpol.2015.02.002
Parfitt, J., Barthel, M., & Macnaughton, S. (2010). Food waste within food supply chains: quantification and potential for change to 2050. Philosophical Transactions of the Royal Society of London. Series B, Biological Sciences, 365(1554), 3065–3081. http://doi.org/10.1098/rstb.2010.0126
Park, A. (2006). Risk and household grain management in developing countries. Economic Journal, 116(514), 1088–1115. http://doi.org/10.1111/j.1468-0297.2006.01124.x
Premanandh, J. (2011). Factors affecting food security and contribution of modern technologies in food sustainability. Journal of the Science of Food and Agriculture, 91(15), 2707–2714. http://doi.org/10.1002/jsfa.4666
Rao, E. J. O., & Qaim, M. (2011). Supermarkets, Farm Household Income, and Poverty: Insights from Kenya. World Development, 39(5), 784–796. http://doi.org/10.1016/j.worlddev.2010.09.005
Ricker-Gilbert, J., & Jones, M. (2015). Does storage technology affect adoption of improved
32
maize varieties in Africa? Insights from Malawi’s input subsidy program. Food Policy, 50(JANUARY), 92–105. http://doi.org/10.1016/j.foodpol.2014.10.015
Rosegrant, M., Magalhaes, E., Valmote-santos, R. A., & Mason-D’Croz, D. (2015). Returns to Investment in Reducing Postharvest Food Losses and Increasing Agricultural Productivity Growth. Food Security and Nutrition Assessment Paper.
Rutten, M. M. (2013). What economic theory tells us about the impacts of reducing food losses and/or waste: implications for research, policy and practice. Agriculture & Food Security, 2(1), 13. http://doi.org/10.1186/2048-7010-2-13
Seng, K. (2016). The Effects of Market Participation on Farm Households’ Food Security in Cambodia: An endogenous switching approach (No. 69669). Retrieved from https://mpra.ub.uni-muenchen.de/69669/
Sheahan, M., & Barrett, C. B. (2016). Food loss and waste in Sub-Saharan Africa : A critical review.
Shiferaw, B., Kassie, M., Jaleta, M., & Yirga, C. (2014). Adoption of improved wheat varieties and impacts on household food security in Ethiopia. Food Policy, 44, 272–284. http://doi.org/10.1016/j.foodpol.2013.09.012
Shiferaw, B., Prasanna, B. M., Hellin, J., & Bänziger, M. (2011). Crops that feed the world 6. Past successes and future challenges to the role played by maize in global food security. Food Security, 3(3), 307–327. http://doi.org/10.1007/s12571-011-0140-5
Slavchevska, V. (2015). Agricultural Production and the Nutritional Status of Family Members in Tanzania. The Journal of Development Studies, 51(8), 1016–1033. http://doi.org/10.1080/00220388.2015.1018906
Snapp, S. S., & Fisher, M. (2015). “Filling the maize basket” supports crop diversity and quality of household diet in Malawi. Food Security, 7, 83–96. http://doi.org/10.1007/s12571-014-0410-0
Stathers, T., Lamboll, R., & Mvumi, B. M. (2013). Postharvest agriculture in changing climates: Its importance to African smallholder farmers. Food Security, 5(3), 361–392. http://doi.org/10.1007/s12571-013-0262-z
Stephens, E. C., & Barrett, C. B. (2011). Incomplete Credit Markets and Commodity Marketing Behaviour. Journal of Agricultural Economics, 62(1), 1–24. http://doi.org/10.1111/j.1477-9552.2010.00274.x
Swindale, A., & Bilinsky, P. (2006). Development of a universally applicable household food insecurity measurement tool: process, current status, and outstanding issues. The Journal of Nutrition, 136(5), 1449S–1452S.
Tefera, T. (2012). Post-harvest losses in African maize in the face of increasing food shortage. Food Security, 4(2), 267–277. http://doi.org/10.1007/s12571-012-0182-3
Tefera, T., Kanampiu, F., De Groote, H., Hellin, J., Mugo, S., Kimenju, S., … Banziger, M. (2011). The metal silo: An effective grain storage technology for reducing post-harvest insect and pathogen losses in maize while improving smallholder farmers’ food security in developing countries. Crop Protection, 30(3), 240–245. http://doi.org/10.1016/j.cropro.2010.11.015
Tscharntke, T., Clough, Y., Wanger, T. C., Jackson, L., Motzke, I., Perfecto, I., … Whitbread, A. (2012). Global food security, biodiversity conservation and the future of agricultural intensification. Biological Conservation, 151(1), 53–59.
33
http://doi.org/10.1016/j.biocon.2012.01.068 Vaitla, B., Devereux, S., & Swan, S. H. (2009). Seasonal hunger: A neglected problem with
proven solutions. PLoS Medicine, 6(6). http://doi.org/10.1371/journal.pmed.1000101 Webb, P., Coates, J., Frongillo, E. A., Rogers, B. L., Swindale, A., & Bilinsky, P. (2006).
Measuring Household Food Insecurity: Why It’s So Important and Yet So Difficult to Do. The Journal of Nutrition, 136, 1404S–1408S.
WHO. (1995). Physical Status: The use and Interpretation of Anthropometry. WHO Technical Report Series. http://doi.org/854
WHO. (1997). Global Database on Child Growth and Malnutrition. Retrieved from http://onlinelibrary.wiley.com/doi/10.1002/cbdv.200490137/abstract
World Bank, Natural Resources Institute, & FAO. (2011). Missing Food: The Case of postharvest Grain Losses in Sub-Saharan African (Vol. 60371–AFR).
Xhoxhi, O., Pedersen, S. M., Lind, K. M., & Yazar, A. (2014). The determinants of intermediaries’ power over farmers’ margin-related activities: Evidence from Adana, Turkey. World Development, 64, 815–827. http://doi.org/10.1016/j.worlddev.2014.07.012
34
6. Appendix
Table A.1. Description and summary statistics of main explanatory variables
Variables Description Non users Users t Mean Std Dev Mean Std Dev
Household characteristics Male headed 1 if the head is male; 0 if female 81.0 81.6 -0.33 Age of head Age of the household head in years 46.00 14.69 47.60 14.81 -2.30 ** Household size Number of household members 5.29 2.24 5.42 2.21 -1.26 Adult equivalent Adult equivalent scale for the
household 4.26 1.84 4.42 1.83 -1.46 No education (head) 1 if the head has no education; 0
otherwise 69.25 61.65 3.46 *** Primary education 1 if the head has primary education; 0
otherwise 27.4 33.6 -2.82 ***
Secondary education 1 if the head has secondary education; 0 otherwise 1.4 2.4 -1.43
Postsecondary education 1 if the head has post-secondary education; 0 otherwise 1.0 0.9 0.15
Livestock holding (TLU) In tropical livestock units 3.49 4.09 3.37 3.09 0.72 Farm size (ha) Cultivated land in hectare 1.73 1.12 1.68 1.18 0.75 Asset index4 Asset index -0.11 1.65 -0.05 1.56 -0.86 Mobile owned 1 if the head/household own a mobile;
0 otherwise 36.7 37.8 -0.51 Finance access 1 if has access to finance; 0 otherwise 23.8 24.7 -0.43 Non-farm enterprise 1 if owns a non-farm enterprise; 0
otherwise 7.4 5.7 1.46 Public transfers 1 if the household received; 0 otherwise 3.72 14.0 -6.89 ***
Private food transfer 1 if the household received; 0 otherwise 3.88 3.59 0.33 Private cash transfer 1 if the household received; 0 otherwise 8.78 8.95 -0.12 Distance to the main road Distance to major road in Kms 16.26 17.54 13.28 13.10 4.46 *** Distance to nearest market Distance to nearest market in Kms 63.82 49.60 73.13 43.05 -4.43 *** Distance to admin. center Distance to administration center Kms 157.23 112.57 166.90 95.18 -2.07 ***
Shocks and climatic factors Production shocks 1 if hh reports; 0 otherwise 4.68 4.73 -0.05 Market shocks 1 if hh faces price hikes; 0 otherwise 12.2 10.1 1.41 Mean annual temperature 12 month average in 0C 19.59 3.33 17.51 2.65 15.69 *** Mean temp the wettest quarter Mean temperature of the wettest
quarter in 0C 19.29 3.36 16.94 2.77 17.14*** Mean annual rainfall Average 12 months total RF in mm (in
00’s) 9.167 2.588 10.076 2.214 -8.38 *** Rainfall of wettest quarter Rainfall amount of the wettest quarter
in mm (in 00’s) 5.0489 1.336 5.1805 0.974 -2.62 ** Community level variables Weekly market 1 if exist ; 0 otherwise 48.0 44.4 1.54 Cooperative 1 if exist in the community; 0 otherwise 16.5 19.1 -1.42 Agriextension expert 1 if exist ; 0 otherwise 94.5 97.4 -3.48 ***
4 Asset index is computed as the score along the first principal component of a principal component analysis applied to households’ assets (including farm implements, furniture, electronics, personal items and other assets).
35
Table A.2. Endogenous switching regression estimates of determinants of improved storage technologies use Variables Coeff (Std Err) Household (head) characteristics Male headed 0.024 (0.093) Age of the household head 0.009 (0.003) *** Household size 0.018 (0.017) Less than primary education (head) -0.102 (0.083) Secondary education or above (head) -0.048 (0.194) Farm size (ha) -0.050 (0.032) Asset index 0.006 (0.025) Livestock ownership (TLU) -0.010 (0.013) Nonfarm enterprise 0.193 (0.076) ** Institutional factors Distance to main road -0.005 (0.002) ** Distance to admin. center 0.001 (0.000) *** Distance to nearest market 0.005 (0.001) *** Mobile ownership 0.008 (0.080) Access to finance or credit 0.253 (0.080) *** Social transfers -0.433 (0.154) *** Private cash transfers 0.016 (0.130) Private food transfers 0.025 (0.197) Weekly market -0.318 (0.069) *** Irrigation scheme 0.185 (0.085) ** Cooperatives 0.082 (0.093) Agricultural extension expert 0.537 (0.194) *** Shocks and climate factors Production shocks -0.093 (0.124) Market shocks 0.163 (0.113) Annual mean temperature (0C) 0.123 (0.061) ** Mean temperature of wettest quarter -0.254 (0.059) *** Annual mean rainfall (mm) 0.007 (0.002) *** Annual mean rainfall of wettest quarter -0.005 (0.005) Constant -0.249 (0.369) Observations (N) 2136 Note: Ethiopian Socioeconomic Survey (ESS) (2013-14); Standard errors in parentheses; * p<0.10, ** p<0.05, *** p<0.01
36
Table A.3. Endogenous Switching Regression estimation for continuous outcomes
Notes: Ethiopian Socioeconomic Survey (ESS) (2013-14); Standard errors in parentheses; * p<0.10, ** p<0.05, *** p<0.01
Table A.5. Additional tests for the exclusion restriction Test Null hypothesis/Test type Test results Durbin test Exclusion instrument is exogenous F=0.003, p = 0.9618 Wu–Hausman test Exclusion instrument is exogenous F =0.002, p = 0.9620 Wooldridge’s score test Exclusion instrument is exogenous 2=0.003, p=0.9596 Anderson canonical correlation statistic
Figure A.1. Common support condition and distribution of propensity scores
Table A.6. Matching quality test
Sample Pseudo R2 LR 2 P > 2 Mean standardized Total bias bias reduction (%) Before matching 0.169 373.0 0.000 19.2 89.6% After matching 0.004 5.1 1.000 2.0
Outcomes rbounds mhbounds sig+ sig - Household dietary diversity score 1.10 >3.00 Minimum acceptable diet 1.5-2.0 & >3 >3.00 Per capita food consumption expenditure 1.20 >3.00 Real per capita consumption expenditure 1.15 >3.00 Child stunting 1 & > 3 1 & >3.00 Market participation 1.6 >3.00 Proportion of harvest sold 1.00 1-1.02 & >3Sale in main markets >3.00 >3.00
Note: Gamma: Odds of differential assignment due to unobserved factors sig+ upper bound significance level sig- lower bound significance level p Significance level (assumption: overestimation of treatment effect) p Significance level (assumption: underestimation of treatment effect)
The UNU‐MERIT Working Paper Series 2016-01 Mexican manufacturing and its integration into global value chains by Juan Carlos
Castillo and Adam Szirmai 2016-02 New variables for vocational secondary schooling: Patterns around the world from
1950‐2010 by Alison Cathles 2016-03 Institutional factors and people's preferences in social protection by Franziska
Gassmann, Pierre Mohnen & Vincenzo Vinci 2016-04 A semi‐endogenous growth model for developing countries with public factors,
imported capital goods, and limited export demand by Jan Simon Hallonsten and Thomas Ziesemer
2016-05 Critical raw material strategies in different world regions by Eva Barteková and René Kemp
2016-06 On the value of foreign PhDs in the developing world: Training versus selection effects by Helena Barnard, Robin Cowan and Moritz Müller
2016-07 Rejected Afghan asylum seekers in the Netherlands: Migration experiences, current situations and future aspirations
2016-08 Determinants of innovation in Croatian SMEs: Comparison of service and manufacturing firms by Ljiljana Bozic and Pierre Mohnen
2016-09 Aid, institutions and economic growth: Heterogeneous parameters and heterogeneous donors by Hassen Abda Wakoy
2016-10 On the optimum timing of the global carbon‐transition under conditions of extreme weather‐related damages: further green paradoxical results by Adriaan van Zon
2016-11 Inclusive labour market: A role for a job guarantee scheme by Saskia Klosse and Joan Muysken
2016-12 Management standard certification and firm productivity: micro‐evidence from Africa by Micheline Goedhuys and Pierre Mohnen
2016-13 The role of technological trajectories in catching‐up‐based development: An application to energy efficiency technologies by Sheng Zhong and Bart Verspagen
2016-14 The dynamics of vehicle energy efficiency: Evidence from the Massachusetts Vehicle Census by Sheng Zhong
2016-15 Structural decompositions of energy consumption, energy intensity, emissions and emission intensity ‐ A sectoral perspective: empirical evidence from WIOD over 1995 to 2009 by Sheng Zhong
2016-16 Structural transformation in Brazil, Russia, India, China and South Africa (BRICS) by Wim Naudé, Adam Szirmai and Nobuya Haraguchi
2016-17 Technological Innovation Systems and the wider context: A framework for developing countries by Hans‐Erik Edsand
2016-18 Migration, occupation and education: Evidence from Ghana by Clotilde Mahé and Wim Naudé
2016-19 The impact of ex‐ante subsidies to researchers on researcher's productivity: Evidence from a developing country by Diego Aboal and Ezequiel Tacsir
2016-20 Multinational enterprises and economic development in host countries: What we know and what we don't know by Rajneesh Narula and André Pineli
2016-21 International standards certification, institutional voids and exports from developing country firms by Micheline Goedhuys and Leo Sleuwaegen
2016-22 Public policy and mental health: What we can learn from the HIV movement by David Scheerer, Zina Nimeh and Stefan Weinmann
2016-23 A new indicator for innovation clusters by George Christopoulos and Rene Wintjes 2016-24 Including excluded groups: The slow racial transformation of the South African
university system by Helena Barnard, Robin Cowan, Alan Kirman and Moritz Müller 2016-25 Fading hope and the rise in inequality in the United States by Jo Ritzen and Klaus F.
Zimmermann 2016-26 Globalisation, technology and the labour market: A microeconometric analysis for
Turkey by Elena Meschi, Erol Taymaz and Marco Vivarelli 2016-27 The affordability of the Sustainable Development Goals: A myth or reality? By
Patima Chongcharoentanawat, Kaleab Kebede Haile, Bart Kleine Deters, Tamara Antoinette Kool and Victor Osei Kwadwo
2016-28 Mimetic behaviour and institutional persistence: a two‐armed bandit experiment by Stefania Innocenti and Robin Cowan
2016-29 Determinants of citation impact: A comparative analysis of the Global South versus the Global North by Hugo Confraria, Manuel Mira Godinho and Lili Wang
2016-30 The effect of means‐tested social transfers on labour supply: heads versus spouses ‐ An empirical analysis of work disincentives in the Kyrgyz Republicby by Franziska Gassmann and Lorena Zardo Trindade
2016-31 The determinants of industrialisation in developing countries, 1960‐2005 by Francesca Guadagno
2016-32 The effects of productivity and benefits on unemployment: Breaking the link by Alessio J. G. Brown, Britta Kohlbrecher, Christian Merkl and Dennis J. Snower
2016-33 Social welfare benefits and their impacts on labour market participation among men and women in Mongolia by Franziska Gassmann, Daphne François and Lorena Zardo Trindade
2016-34 The role of innovation and management practices in determining firm productivity in developing economies by Wiebke Bartz, Pierre Mohnen and Helena Schweiger
2016-35 Millennium Development Goals (MDGs): Did they change social reality? by Janyl Moldalieva, Arip Muttaqien, Choolwe Muzyamba, Davina Osei, Eli Stoykova and Nga Le Thi Quynh
2016-36 Child labour in China by Can Tang, Liqiu Zhao, Zhong Zhao 2016-37 Arsenic contamination of drinking water and mental health by Shyamal
Chowdhury, Annabelle Krause and Klaus F. Zimmermann 2016-38 Home sweet home? Macroeconomic conditions in home countries and the well‐
being of migrants by Alpaslan Akay, Olivier Bargain and Klaus F. Zimmermann 2016-39 How do collaboration and investments in knowledge management affect process
innovation in services? by Mona Ashok, Rajneesh Narula and Andrea Martinez‐Noya
2016-40 Natural disasters and human mobility by Linguère Mously Mbaye and Klaus F. Zimmermann
2016-41 The chips are down: The influence of family on children's trust formation by Corrado Giulietti, Enrico Rettore and Sara Tonini
2016-42 Diaspora economics: New perspectives by A.F. Constant and K.F. Zimmermann 2016-43 Entrepreneurial heterogeneity and the design of entrepreneurship policies for
economic growth and inclusive development by Elisa Calza and Micheline Goedhuys
2016-44 Gini coefficients of education for 146 countries, 1950‐2010 by Thomas Ziesemer 2016-45 The impact of rainwater harvesting on household labor supply by Raquel Tsukada
Lehmann and Christian Lehmann 2016-46 The impact of piped water supply on household welfare by Raquel Tsukada and
Degol Hailu 2016-47 The impact of household labor‐saving technologies along the family life cycle by
Raquel Tsukada and Arnaud Dupuy 2016-48 River deep, mountain high: Of long‐run knowledge trajectories within and between
innovation clusters by Önder Nomaler and Bart Verspagen 2016-49 Demographic dynamics and long‐run development: Insights for the secular
stagnation debate by Matteo Cervellati, Uwe Sunde and Klaus F. Zimmermann 2016-50 Reservation wages of first‐ and second‐generation migrants by Amelie F.
Constant, Annabelle Krause, Ulf Rinne and Klaus F. Zimmermann 2016-51 A 'healthy immigrant effect' or a 'sick immigrant effect'? Selection and policies
matter by Amelie F. Constant, Teresa García‐Muñoz, Shoshana Neuman and Tzahi Neuman
2016-52 The invisible hand of informal (educational) communication!? Social capital considerations on Twitter conversations among teachers by Martin Rehm and Ad Notten
2016-53 Fueling conflict? (De)escalation and bilateral aid by Richard Bluhm, Martin Gassebner, Sarah Langlotz and Paul Schaudt
2016-54 Trade liberalisation and child labour in China by Liqiu Zhao, Fei Wang and Zhong Zhao
2016-55 Three decades of publishing research in population economics by Alessio J.G. Brown and Klaus F. Zimmermann
2016-56 Corruption, innovation and firm growth: Firm‐level evidence from Egypt and Tunisia by Micheline Goedhuys, Pierre Mohnen and Tamer Taha
2016-57 Poverty reduction strategies in Canada: A new way to tackle an old problem? by Geranda Notten and Rachel Laforest
2016-58 Innovation system in development: The case of Peru by Pluvia Zuniga 2016-59 Formal and informal appropriation mechanisms: the role of openness and
innovativeness by Ann‐Kristin Zobel, Boris Lokshin and John Hagedoorn 2016-60 On the fungibility of public and private transfers: A mental accounting approach
by Jennifer Waidler 2016-61 Patents, exhibitions and markets for innovation in the early twentieth century:
Evidence from Turin 1911 International Exhibition by Giacomo Domini 2016-62 Towards a new European refugee policy that works by Amelie F. Constant and
Klaus F. Zimmermann 2016-63 The effect of improved storage innovations on food security and welfare in Ethiopia