49
John A. Clark, MD, MSPH April Zambelli-Weiner, Ph.D., M.P.H. David H. Schwartz, Ph.D. Working the Science and Regulations Harder to Win Your Drug and Device Cases
| Date post: | 16-Jul-2015 |
| Category: |
Healthcare |
| Upload: | sara-dunlap |
| View: | 101 times |
| Download: | 0 times |

John A. Clark, MD, MSPH
April Zambelli-Weiner, Ph.D., M.P.H.
David H. Schwartz, Ph.D.
Working the Science and Regulations Harder to Win Your Drug and Device Cases

BRIEF INTRODUCTION
David H. Schwartz, Ph.D.
Founding Partner, Innovative Science
Solutions, LLC

Drug and Device CasesHistorical Perspective
Early / Landmark Cases Representative Drug Cases Representative
Device Cases

Big Stakes!
Phen-Fen Litigation
• $6.44 Billion
Value of class action
settlement
• $567.67 Million
Plaintiff awards

The Science-Based Approach in Drug and Device Litigation
Craft a Winning
Scientific Strategy
Recruit the Best
Experts
Inherit the Scientific
Facts and Data
Gain Crucial
Admissions from
Opposing Experts
Align all Facts with
Strategy
Best
Resolution!
Develop Affirmative
Case
Direct
Cross
5
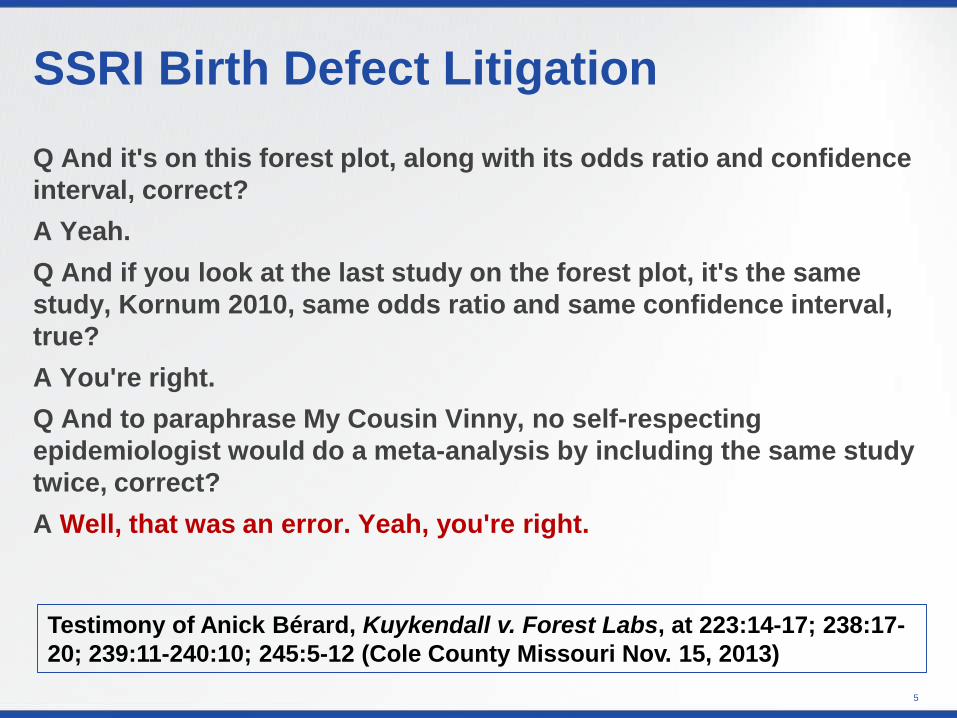
Q And it's on this forest plot, along with its odds ratio and confidence
interval, correct?
A Yeah.
Q And if you look at the last study on the forest plot, it's the same
study, Kornum 2010, same odds ratio and same confidence interval,
true?
A You're right.
Q And to paraphrase My Cousin Vinny, no self-respecting
epidemiologist would do a meta-analysis by including the same study
twice, correct?
A Well, that was an error. Yeah, you're right.
SSRI Birth Defect Litigation
Testimony of Anick Bérard, Kuykendall v. Forest Labs, at 223:14-17; 238:17-
20; 239:11-240:10; 245:5-12 (Cole County Missouri Nov. 15, 2013)

The Causation Question
Drug/device is not capable of causing the condition (General Causation defense)
Drug/device can cause the condition but didn’t in this case (Specific Causation Defense)
Drug/device can/did cause the condition, but the warnings were adequate (product misuse)

Clinical Data
Discovery Development Market
Approval /
Launch
Litigation filed
Phase I / II
Phase III
Phase IV Studies (PMS)
S
p
o
n
s
o
r
Spontaneous AEs
I
n
d
e
p
e
n
d
e
n
t
RCTs
Epi Studies
Published Case Reports

Presenters
April Zambelli-Weiner, Ph.D., M.P.H.
President and Founder, Translational
Technologies International
The Use of Epidemiological Data in Product
Liability Litigation
John A. Clark, M.D., M.S.P.H.
President and Chief Medical Officer,
PCSglobal
Making Effective Use of Safety Surveillance
Data in Drug and Device Litigation

Making Effective Use of Safety Surveillance Data in Drug and Device Litigation
John A. Clark, M.D., M.S.P.H.
President and Chief Medical Officer,
PCSglobal

KEY DEFENSE COMPONENTSTraditional Pharmacovigilance
Case-based
reporting since
early 1960’s
Important causality
information in
some individual
cases
Many
interconnections
(ICH E2B
standard)
3 level system –
company, national,
international
(WHO)
Cases come from
studies, literature,
medical practice,
Internet
Epidemiological
study follow-up
Reporting
patterns
(e.g. over
time, by
geography)

KEY DEFENSE COMPONENTSSafety Signaling
• Safety signaling is a process that assesses multiple cases
• Disproportionality – cases occur more often than expected
• Threshold – arbitrary setting that defines a safety signal
• Two phases of safety signalingo Phase 1: Signal detection (identification of signals)
o Phase 2: Signal evaluation (case series and other analyses)
• Signal detection methods
o Type 1: Individual case information that suggest disproportion
o Type 2: Disproportions from case reporting systems
o Type 3: Statistical disproportions from studies with a control group
• Type 2 methods produce high false positive rates
• Phase 1/2 may or may not be followed by formal studies

SAFETY SIGNALINGUS Regulations
Clinical
(312.32)
Assess safety
related
information from
all sources
Certain cases
sent in 15 days
(7 days if fatality)
Case series
analysis for
expedited
case reports
Postmarketing
(314.80)
Assess safety
related
information
from all sources
Certain cases
sent in 15 days
Case-based
reporting
High false
positive rate,
establishes
expected
reporting
patterns
Non-case
based
Disproportions
subject to
interpretation

• Derive from CIOMS and ICH consensus conferenceso CIOMS = Conference of International Organizations of the Medical
Sciences (sponsored by WHO; Headquarters is in Geneva)
o ICH = International Conference on Harmonisation (sponsored by US, Japan, and EU; Headquarters is in Geneva)
• CIOMS consensus conferences bring together thought leaders from agencies and industry on risk topics
• ICH considers CIOMS recommendations and creates international guidelineso May or may not be enacted into law by countries, BUT
o Is used by agencies as a basis for auditing
SAFETY SIGNALINGGenerally Accepted Practices

• Case-based signaling using “designated medical events”o Low incidence
o Can be caused by drugs, biologics, or devices
• FDA’s sentinel systemo Available only to FDA
o Applies signaling techniques to non-spontaneous datasets
• Combining adverse event and product complaint data
• Signaling within risk management programs
SAFETY SIGNALINGTrends and Updates

• Both case processing and safety signaling are extensively described by CIOMS and ICH
• Safety signaling is not “one size fits all”
• Signals come from multiple sources: individual cases, groups of cases, studies, and non-human data
• Develop objective case definitions
• Look for confounding factors
• Assess case series over time to identify effects due to the information system (rather than the product)
• Don’t overemphasize epidemiological study results
Safety SignalingComments

• Signaling is a process; Responsibility = establishing appropriate processes?o Processes clearly defined
o Processes carried out appropriately
o Results of internal and agency audits or inspections addressed by CAPAs
• When did the signal first occur? (company reaction time)
• Training and education? (e.g., medical expertise)
• Pharmacovigilance plan in place?
• Systems appropriate for the monitoring plan?
SAFETY SIGNALINGClient Performance?

SAFETY SIGNALINGData Source Checklist
Was a comprehensive case series
evaluation done?
Regulatory requirement
Clear criteria for when a case series
evaluation must be done
Frequently exonerates the product
Literature screening procedures
Internet case screening?
FDA’s Adverse Event Reporting
System database (FAERS)
FDA’s Manufacturer and User
Facility Device Experience database
(MAUDE)
Product complaint/product quality
database (especially for biologics) help
to monitor for:
Counterfeit product
Contract manufacturing issues
Difficult manufacturing processes
(e.g., complex biologics)
Integrated clinical trial data
Specialized datasets (registries, risk
management compilations)
Claims or electronic medical record
data

• Client company has good processes in place for finding, evaluating, and conveying safety signals
• Client company responded quickly
• Clear, supportable case definition
• Other causative (confounding) factors
• Information system factors (e.g., publicity)
• Study design factors
HANDLING OF SAFETY ISSUESWhat Should the Jury Know?

LESSONS LEARNEDEXAMPLES
Vioxx and vascular events• Product pulled from market before an assessment of all data had been performed
• Sales force and publication strategy misinformed the public about study results
• Most vascular event cases had numerous confounding factors
• Epidemiological studies are consistent with a slight association of the same
magnitude for ibuprofen
• Advisory committees in multiple countries have voted to reintroduce the product
Do a thorough analysis of all
sources of data, including cases
Don’t panic and pull a drug off
the market prematurely
Represent potential safety
problems accurately to the publicLesson 2
Lesson 3
Lesson 1

LESSONS LEARNEDEXAMPLES
Make sure case reporting
processes are robust
Always look at the timing of case
reporting
Critically evaluate
epidemiological study resultsLesson 2
Lesson 3
Lesson 1
Metal-on-metal hip replacement and early hip joint
damage• Monitoring systems at the company were rudimentary
• Many so-called cases did not qualify as cases
• Study design and data sources for epidemiological studies that showed a
low level increase in joint damage were not well done
• Much of the increase in reporting was publicity induced
• There was not an accepted biological mechanism

LESSONS LEARNEDEXAMPLES
The link to adenoCA of the pancreas is largely based on case reporting
AdenoCA of the pancreas is a co-morbid condition of diabetes
Confounder: adenoCA of the pancreas occurs at the same anatomical location as the site of
activity; reporters can easily draw a conclusion of possible relationship based on this
observation
Subsequent studies have not clearly demonstrated this link
Incidence and prevalence of adenoCA of the pancreas is increasing
Look carefully at cases for
sources of bias
Beware whenever the event is
becoming more common
Design epi studies to minimize
case level biasesLesson 2
Lesson 3
Lesson 1
GLP-1 anti-diabetic drugs and adenocarcinoma of the pancreas
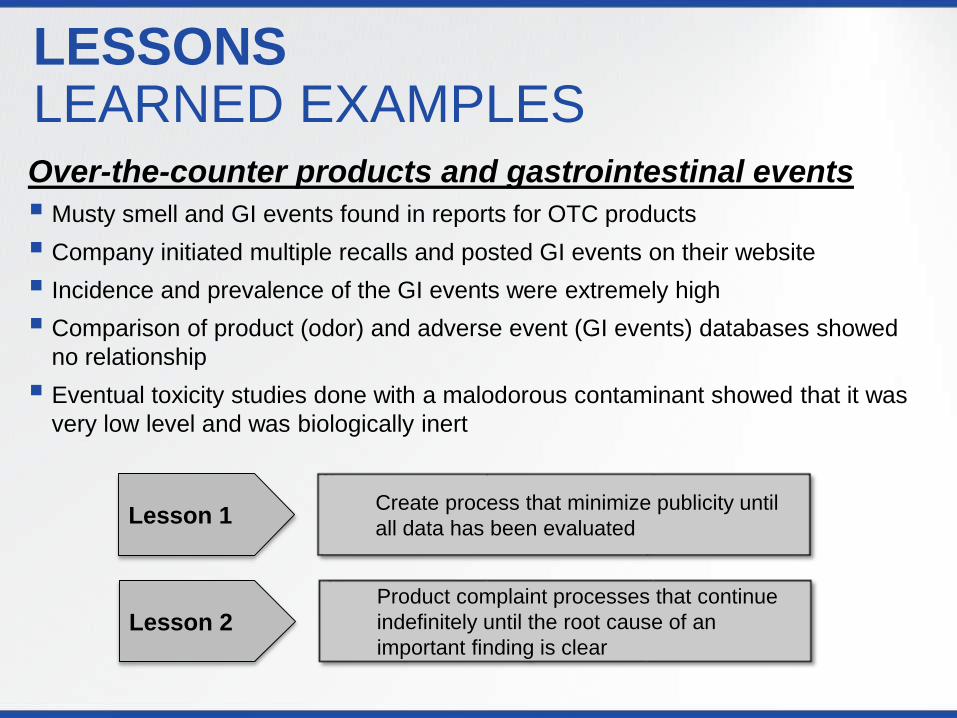
LESSONS LEARNED EXAMPLESOver-the-counter products and gastrointestinal events
Musty smell and GI events found in reports for OTC products
Company initiated multiple recalls and posted GI events on their website
Incidence and prevalence of the GI events were extremely high
Comparison of product (odor) and adverse event (GI events) databases showed
no relationship
Eventual toxicity studies done with a malodorous contaminant showed that it was
very low level and was biologically inert
Create process that minimize publicity until
all data has been evaluated
Product complaint processes that continue
indefinitely until the root cause of an
important finding is clearLesson 2
Lesson 1

The Use of Epidemiological Data in Product Liability Litigation
April Zambelli-Weiner, Ph.D., M.P.H.
President and Founder
Translational Technologies International

Randomized
Clinical Trials
Observational
Studies
Post-Market
Registries
PRIMARY
RESEARCH
SECONDARY
RESEARCH
Types of Studies and Sources of Data
Comparative
Effectiveness
Health
Economics
and
Outcomes
Research
Systematic
Reviews
Meta-Analyses
Pooled Analyses

Analytic Study Designs
Randomized Control Trials
(experimental)
Cohort studies (observational)
Case-control studies (observational)
Cross-sectional studies (observational)

Randomized Clinical Trials (RCTs)
Conducted in 4 Phases, each of which
answer different research questions
Phase I
• Testing in humans
• Small sample size
• Preliminary testing of safety, dosage, and side effects
Phase II
• Testing in humans
• Larger sample size
• Additional testing of efficacy and safety
Phase III
• Testing in humans
• Large sample size and follow-up to support registration
• “Pivotal” Studies: compare efficacy and safety against placebo and comparator
Phase IV
• Post-market studies
• Provides information regarding safety and efficacy of drug within real-world context
Pivotal Trials

Strengths and Limitations of Clinical Trials
STRENGTHS
Can be used to
evaluate causation
Gold standard for
obtaining evidence
of a treatment effect
Randomization
protects against
most forms of bias
LIMITATIONS
Do not reflect real-
world use scenarios
Narrow Focus
Expensive
Only possible
where there is
“intervention” that
people are willing to
be randomized to

Used to study a wider range of exposures
than experimental studies
“Natural” experiments
Mitigate many issues which are not
feasible in experimental studies
Observational Studies

Strengths and Limitations of Observational Studies
STRENGTHS Provide information
on “real world” use and
practice
Larger sample sizes
Longer follow-up
periods
Less costly
Different study
designs
Efficient use of
available data
LIMITATIONS
Subject to many
biases
Limited control over
composition of the
control groups
Standardization of
exposures and
outcomes varies
Data more likely to be
incomplete and of
poorer quality
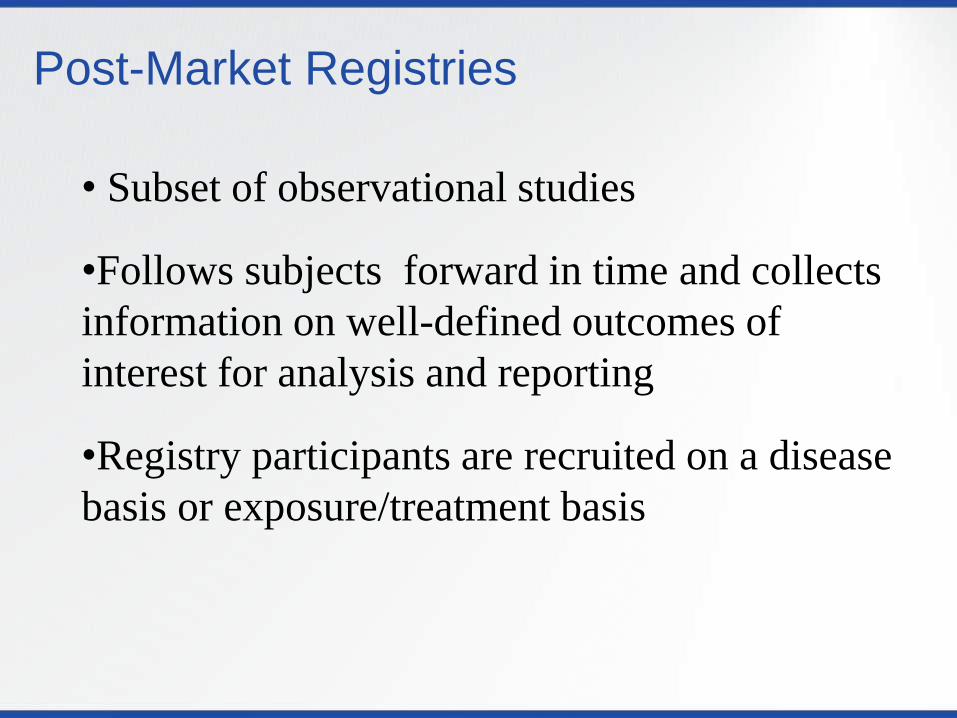
Post-Market Registries
• Subset of observational studies
•Follows subjects forward in time and collects
information on well-defined outcomes of
interest for analysis and reporting
•Registry participants are recruited on a disease
basis or exposure/treatment basis

Strengths and Limitations of Registries
STRENGTHSLarge number of cases with
long-term follow-up
Reflect “real-world”
experience on diverse patient
population
Can examine issues such
as the impact of clinical
experience or surgical skill
Additional data such as
patient-reported outcomes
LIMITATIONSData not 100%
verified
Variability in data
definitions
Under-reporting
Difficulty in
prospective follow-up
Incompleteness of
data
Competing registries

THE USE OF EPIDEMIOLOGICAL DATA IN
LITIGATION

Two types of data that are key to causal assessment
Published
Clinical data
Epidemiological data
Proprietary Studies

Know Your Numbers
Accurate analysis of study data can address important questions about potential safety signals
— Could a safety signal have been detected
earlier than reported?
— Despite the report of adverse events, do
the aggregate data show statistically
meaningful evidence of harm to patients?
—Are results being driven by a single study
or a particular patient subgroup?

Example
TABLE 1
Event
All Controlled Studies, n (%) Placebo Controlled Studies, n (%)
DRUG
N=12,581
Control
N=11,214
Rate
Ratio and
95% CI
(p-value)†
DRUG
N=3758
Control
N=2044
Rate
Ratio and 95%
CI
(p-value)†
Deep Vein Thrombosis 15 (0.12) 9 (0.08)1.49
0.65-3.553 (0.08) 4 (0.20)
0.41
0.08-1.98
Venous Thrombosis Limb 0 (0.00) 2 (0.02)0.20*
(p=0.44)0 (0.00) 0 (0.00) -
Pulmonary Embolism 4 (0.03) 1 (0.01)3.57
0.45-88.234 (0.11) 1 (0.05)
2.18
0.27-53.86
TABLE 1 REVISED
Event
All Controlled Studies, n (%) Placebo Controlled Studies, n (%)
DRUG
N=15,391
Control
N=13,453
Rate
Ratio and
95% CI
(p-value)†
DRUG
N=5510
Control
N=3093
Rate
Ratio and
95% CI
(p-value)†
Deep Vein Thrombosis 16 91.55
(0.69-3.68)3 4
0.42
(0.08-2.04)
Venous Thrombosis Limb 0 20.44*
(p=0.44)0 0 --
Pulmonary Embolism 5 14.37
(0.61-104)4 1
2.25
(0.28-55.56)

Methodological Issues
Outcome reporting (lumping vs. splitting)
See FDA Guidance for Industry, Premarketing Risk Assessment, 2005
Clinical protocols (monitoring and detection)
Spontaneous reporting vs. active surveillance
Inclusion and exclusion criteria
Generalizability of the study populations to general population
Length of follow-up
Were trials adequate to detect AEs/SAEs

Other Important Analyses
Sensitivity Analyses Is risk specific to a particular subgroup?
Are findings robust to choice of control group?
Analysis of registry data Are there consequences of long-term use?
Do we see AEs in previously unstudied populations or vulnerable populations?
Review/analysis of observational studies Do we see replication across studies?
What is the evidence for pooled analyses or meta-analyses?

Example: Subgroup Analyses (Risk/Benefit Ratio)
Risk of
Adverse
Event
Benefit

PUBLISHED DATA

The Publication Record
What was level of corporate involvement?
Did all investigators have full access to study
data?
What findings were published and which
findings were not published – and why?
What can be discerned from the published
data?


A Current Example: Testosterone Therapy
10/30/2014
43
Industry
Sponsored
Studies
Summary
OR=0.89
95% CI
(0.50-1.60)
Non-
Industry
Funded
Studies
Summary
OR=2.06
95% CI
(1.34-3.17)


Excerpted from ISMPP presentation , http://www.ismpp.org/assets/docs/Inititives/GPP2/chris_graf_ismpp_u_may2010.pdf

Conclusion
Know the sources of data for your product
Know the strengths and weakness of that
data
Understand the implications of
methodological choices in generating and
analyzing data
Look for data gaps
Review the publication record

For more information or to discuss your needs feel free to contact:
Dr. April Zambelli-WeinerTranslational Technologies International (TTI)
800-580-2990, ext 100

Q & A


